SHEAR RESISTANCE OF OIL PALM SHELL CONCRETE BEAMS WITH AND WITHOUT SHEAR REINFORCEMENT MEI YUN CHIN Thesis submitted to the University of Nottingham for the degree of Doctor of Philosophy August 2014
Transcript
SHEAR RESISTANCE OF OIL PALM SHELL CONCRETE
BEAMS WITH AND WITHOUT SHEAR
REINFORCEMENT
MEI YUN CHIN
Thesis submitted to the University of Nottingham
for the degree of Doctor of Philosophy
August 2014
i
Abstract
In recent years, the use of Oil Palm kernel Shell (OPS) aggregate as coarse aggregate
in concrete has received increasing attention due to its environmental and economic
benefits. To date, considerable amount of research have been carried out to aid the
understanding of its concrete mixture designs and its material properties, but, only
limited amount of works have been carried out to aid the current understanding with
respect to its shear resistance.
The main objective of this research was to investigate the shear resistance of Oil
Palm kernel Shell Concrete (OPSC), and to compare with the conventional Normal
Weight Concrete (NWC) through experimental and analytical study. The experimental
work carried out in this research involved destructive testing of forty-five numbers of
beam specimens, of which twenty-nine beams (24 casted with OPSC and 5 casted
with NWC) were casted without shear reinforcement while the remaining sixteen
beams (11 casted with OPSC and 5 casted with NWC) were casted with shear
reinforcement. The main variables for beams casted without shear reinforcement
were the concrete strength (fcu), overall section depth (h), longitudinal reinforcement
(ρ), and span to depth ratio (a/d). Whilst the main variables for beams casted with
shear reinforcement were concrete strength (fcu), shear reinforcement (ρs) and
inclination of shear cracks (Θ).
For beams casted without shear reinforcement, three distinct failure mechanisms
were observed from the tests: the shear compression mechanism (associated with
a/d < 2.5); the diagonal tension mechanism (associated with a/d = 2.5 and ρ = 0.88%);
and the shear mechanism (associated with a/d ≥ 2.5 and ρ > 0.88%). Whilst for OPSC
ii
beams casted with shear reinforcement, shear compression failure was observed for
the tests.
A comparative study was carried out to investigate if there are any differences on the
ultimate shear resistance and the shear failure mechanism between the OPSC beams
and NWC beams. In general, all specimens (OPSC and NWC) were found to fail in
similar failure mechanism; however, some variations have been noted in the ultimate
resistance with respect to span to depth ratio, concrete strength, and longitudinal
steel ratio (for beams without shear reinforcement) and concrete strength (for
beams with shear reinforcement).
An analytical study was carried out using the upper bound approach to evaluate the
observed shear failure mechanisms, and hence, to predict the failure loads. A
theoretical model was developed for each of the casting condition. In addition,
design models based on Eurocode 2 (EC2) and BS8110 have been developed. In all
cases, the proposed models achieved good agreement with the test results.
iii
Publications
CHIN, M.Y. and LAU, T.L., Shear Resistance of Non-Reinforced Oil Palm Shell Concrete
Beams, Advance Materials Research. Vol.587, 2012, pp. 130-143.
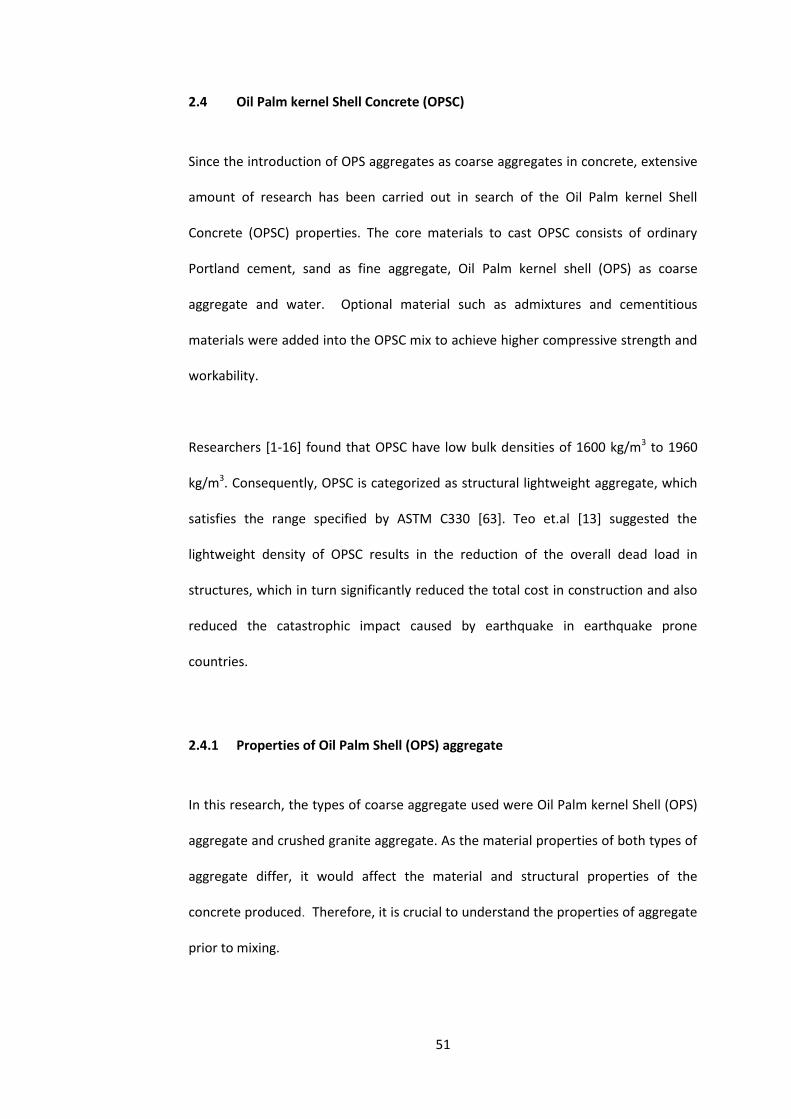
Figure 2.1 Three combined actions in reinforced concrete beams without shear reinforcement27
64
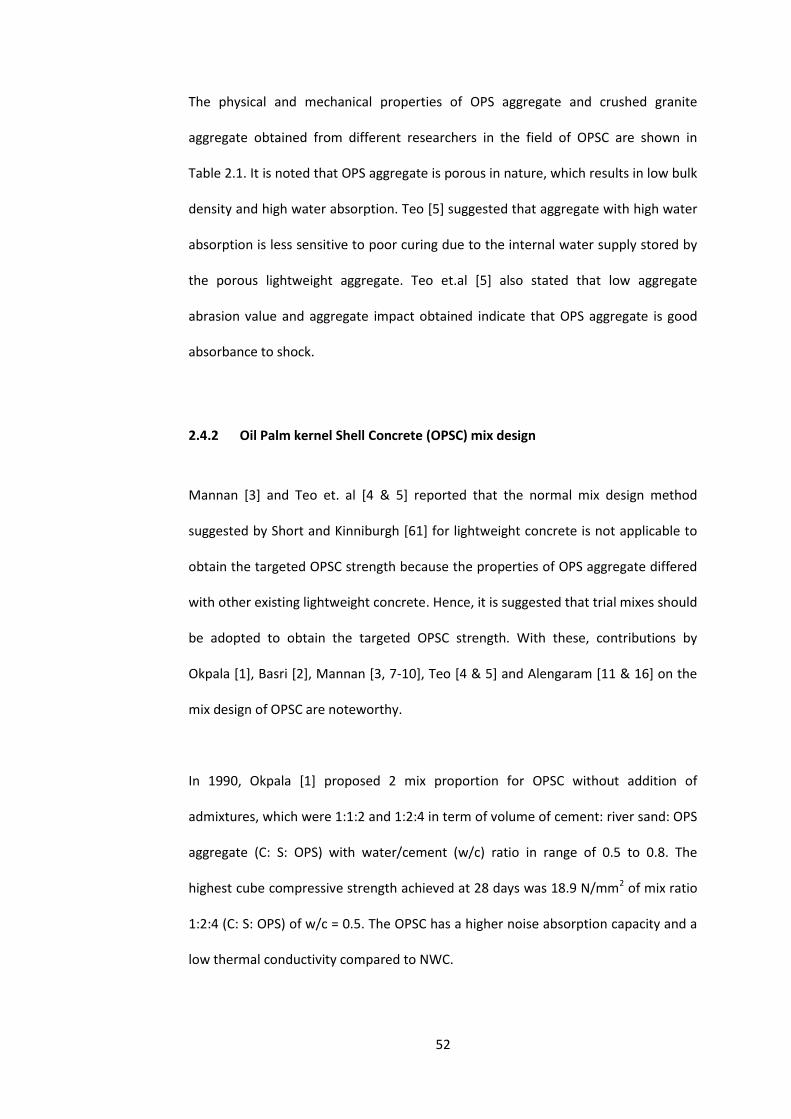
Figure 2.2 Hypothesis of systematically failure for beams failed in diagonal tension30
64
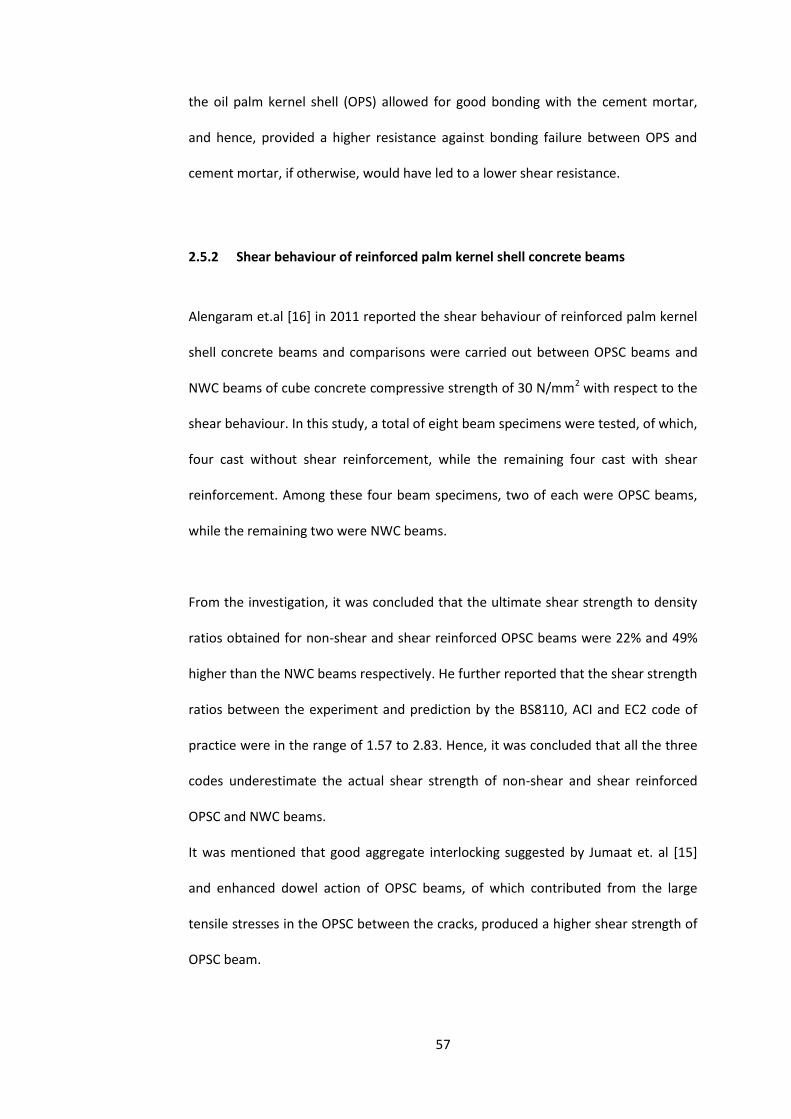
Figure 2.3 Formation of diagonal tension crack for beams without shear reinforcement31
64
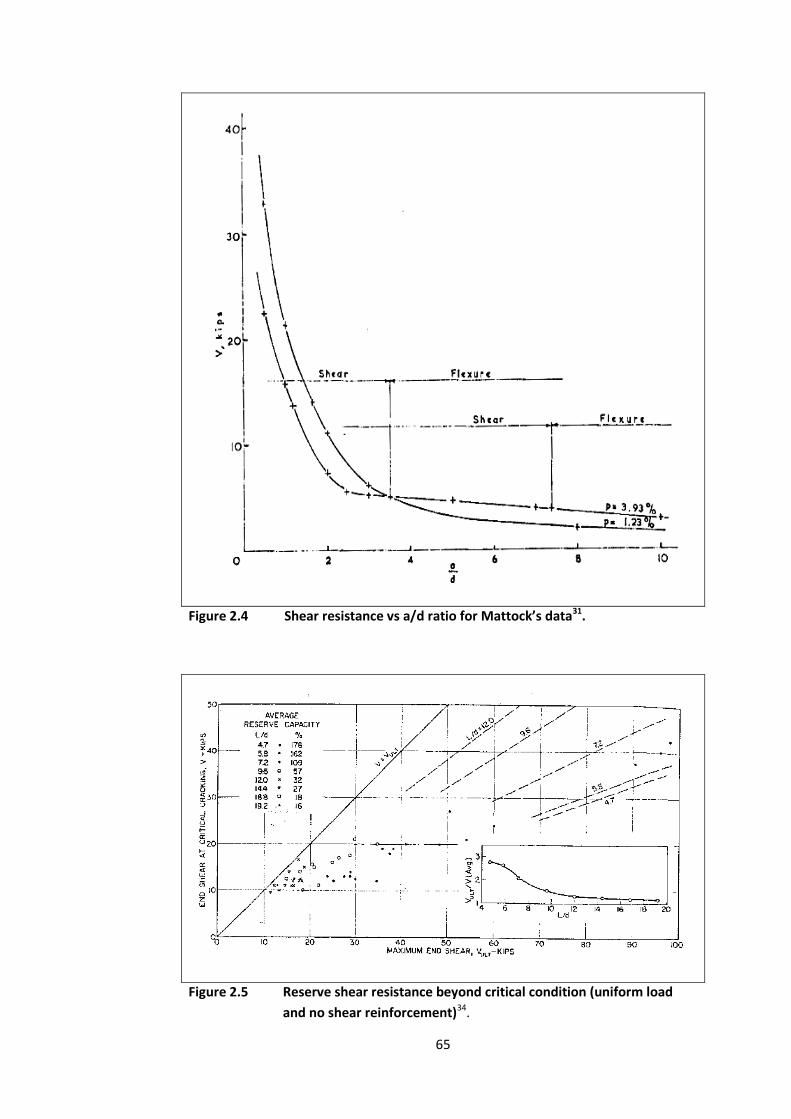
Figure 2.4 Shear resistance vs a/d ratio for Mattock’s data31 65
Figure 2.5 Reserve shear resistance beyond critical condition (uniform load and no shear reinforcement)34
65
Figure 2.6 Comparisons of calculated and observed critical shear intensities34
66
Figure 2.7 Shear stress at failure vs a/d35 66
Figure 2.8
vs a/d35 67
Figure 2.9 Relation between ρ and vu36 67
Figure 2.10 Ultimate shear force vs moment shear ratio for ρ = 1.7% and ρ = 2.67% for both deformed bars and plain bars38
68
Figure 2.11 Test results of series a/d=1.5, 2.5 and 3.6 with respect to concrete strength39
68
Figure 2.12 Test results of theoretical vs experimental shear strength values41
69
Figure 2.13 Effect of variables: reinforcement ratio, compressive strength and shear span on cracking and ultimate shear strength42
70
Figure 2.14 Plastic approach for reinforced concrete beams without shear reinforcement46
70
xv
Figure 2.15 Four combined actions in reinforced concrete beams with shear reinforcement27
71
Figure 2.16 Diagonal tension cracks crossed one of the shear reinforcement50
71
Figure 2.17 Comparison of test data with proposed formula51 71
Figure 2.18 Shear contributions of shear reinforcement34 72
Figure 2.19 Plastic approach for reinforced concrete beams with shear reinforcement46
72
Figure 2.20 Test results of beams with varying depth55 73
Figure 2.21 Test specimens casted by Kani55 73
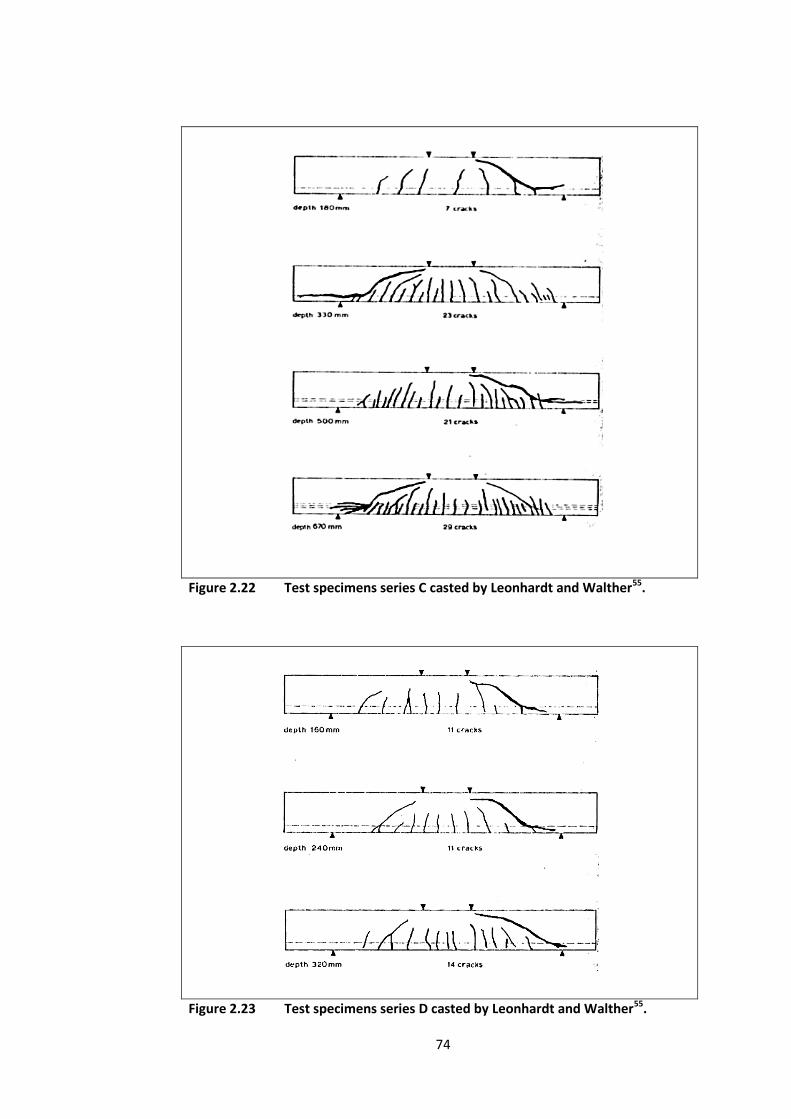
Figure 2.22 Test specimens Series C casted by Leonhardt and Walther55 74
Figure 2.23 Test specimens Series D casted by Leonhardt and Walther55 74
Figure 2.24 Test specimens casted by Taylor55 75
Figure 2.25 Illustration of size effect according to theory of linear fracture mechanics and nonlinear fracture mechanics57
75
Figure 2.26 Comparisons of the design formula with literature data57 76
Figure 2.27 Experimental values vs Calculated values of mean nominal shear strength for beams without shear reinforcement58
76
Figure 2.28 Relative nominal shear strength of gravel and lightweight concrete beams as function of the effective cross sectional depth (a/d=3)59
77
Figure 2.29 Shear stresses at inclined cracking and failure vs effective depth for short beams with a/d=159
77
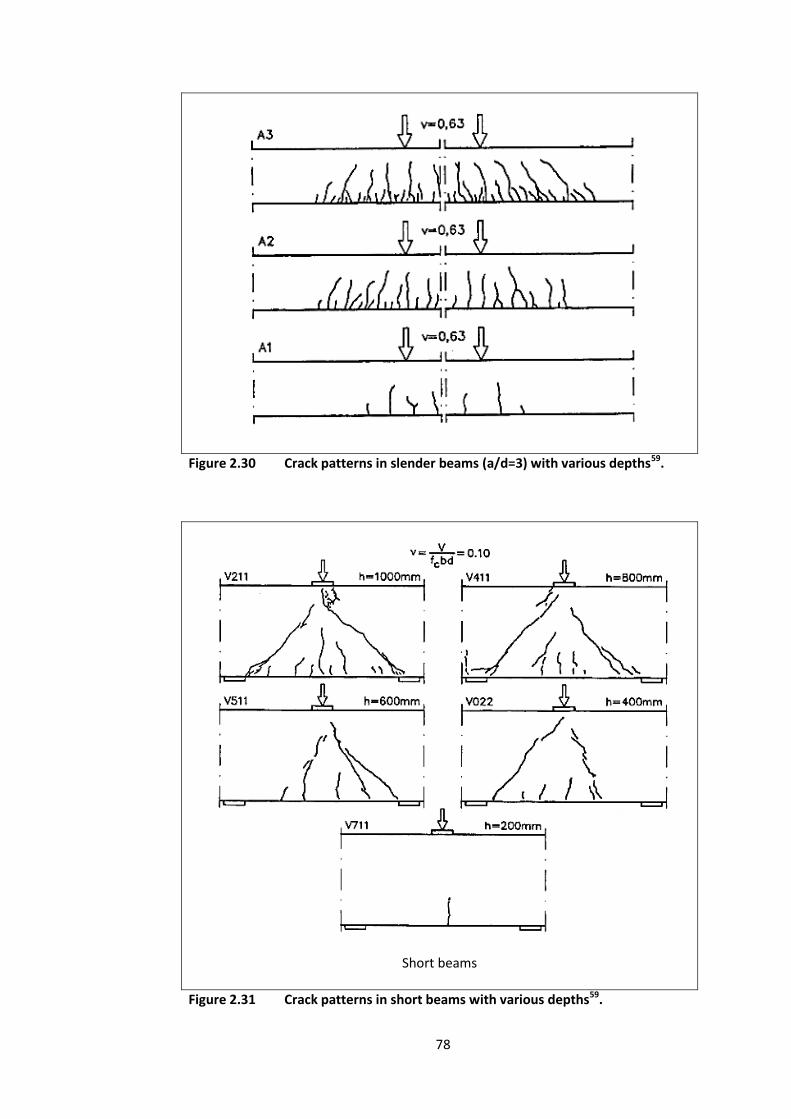
Figure 2.30 Crack patterns in slender beams (a/d=3) with various depth59 78
Figure 2.31 Crack patterns in short beams with various depth59 78
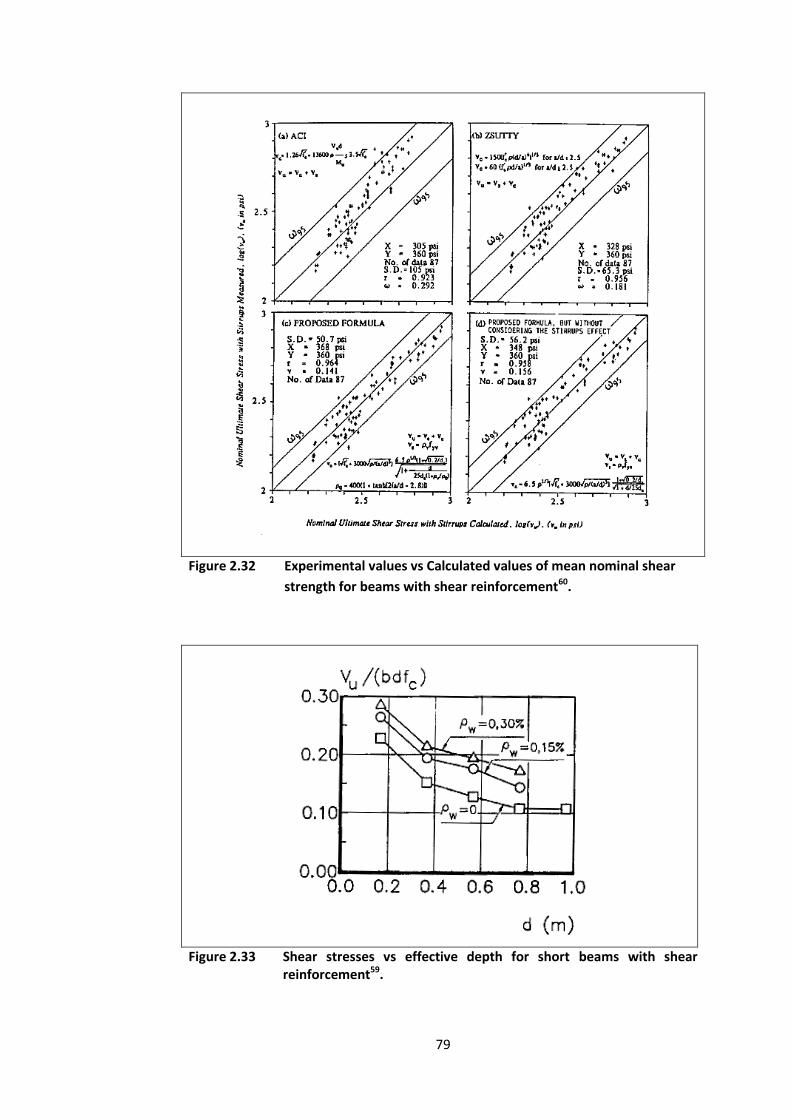
Figure 2.32 Experimental values vs Calculated values of mean nominal shear strength for beams without shear reinforcement60
79
Figure 2.33 Shear stresses vs effective depth for short beams with shear reinforcement59
79
Chapter 3
Figure 3.1 Grading curves of OPS Aggregate for OPSC beam specimens 95
xvi
Figure 3.2 Grading curve of Fine Aggregate for OPSC and NWC beam specimens
95
Figure 3.3 Grading curves of Gravel Aggregate for NWC beam specimens
96
Figure 3.4 General arrangements of beams without shear reinforcement
96
Figure 3.5 General arrangements of OPSC (3A, 3B, 3C) and NWC (NWCA) beams reinforced with 2T14 (compression), 2T16 (tension), and R6@120 mm (shear reinforcement)
97
Figure 3.6 General arrangements of OPSC (4A, 4B, 4C, 4D, 4E) and NWC (NWCB, NWCD, NWCE) beams reinforced with 2T14 (compression), 2T16 (tension), and R6@80 mm (shear reinforcement)
97
Figure 3.7 General arrangements of OPSC (5A, 5B, 5C) and NWC (NWCC) beams reinforced with 2T(14 + 20) (compression), 2T(16+20) (tension), and R6@60 mm (shear reinforcement)
98
Figure 3.8 General arrangements of steel mould for casting of specimens having overall section depth ≤ 200 mm
99
Figure 3.9 Bolting details of steel mould shown in Figure 3.8 100
Figure 3.10 General arrangements of wooden mould for casting of specimens having overall section depth > 200 mm
101
Figure 3.11 Bolting details of steel mould shown in Figure 3.10 102
Figure 3.12 Test setup for OPSC and NWC beam specimens 103
Figure 3.13 Loading rig for OPSC and NWC beam specimens 103
Figure 3.14 Loading arrangement for all beam specimens cast without shear reinforcement
104
Figure 3.15 Location of shear reinforcement were marked to ensure for correct positioning of loads and supports
104
Figure 3.16 Loading arrangement for OPSC and NWC beam specimens cast with shear reinforcement spaced at 120 mm intervals and loaded with 240 mm shear span
105
Figure 3.17 Loading arrangement for OPSC and NWC beam specimens cast with shear reinforcement spaced at 80 mm intervals and loaded with 240 mm shear span
105
Figure 3.18 Loading arrangement for OPSC and NWC beam specimens cast with shear reinforcement spaced at 60 mm intervals and loaded with 240 mm shear span
106
Figure 3.19 Loading arrangement for OPSC and NWC beam specimens cast with shear reinforcement spaced at 80 mm intervals and loaded with 200 mm shear span
106
xvii
Figure 3.20 Loading arrangement for OPSC and NWC beam specimens cast with shear reinforcement spaced at 80 mm intervals and loaded with 160 mm shear span
107
Figure 3.21 Position of mechanical dial gauge for measurements of mid span deflection
107
Chapter 4
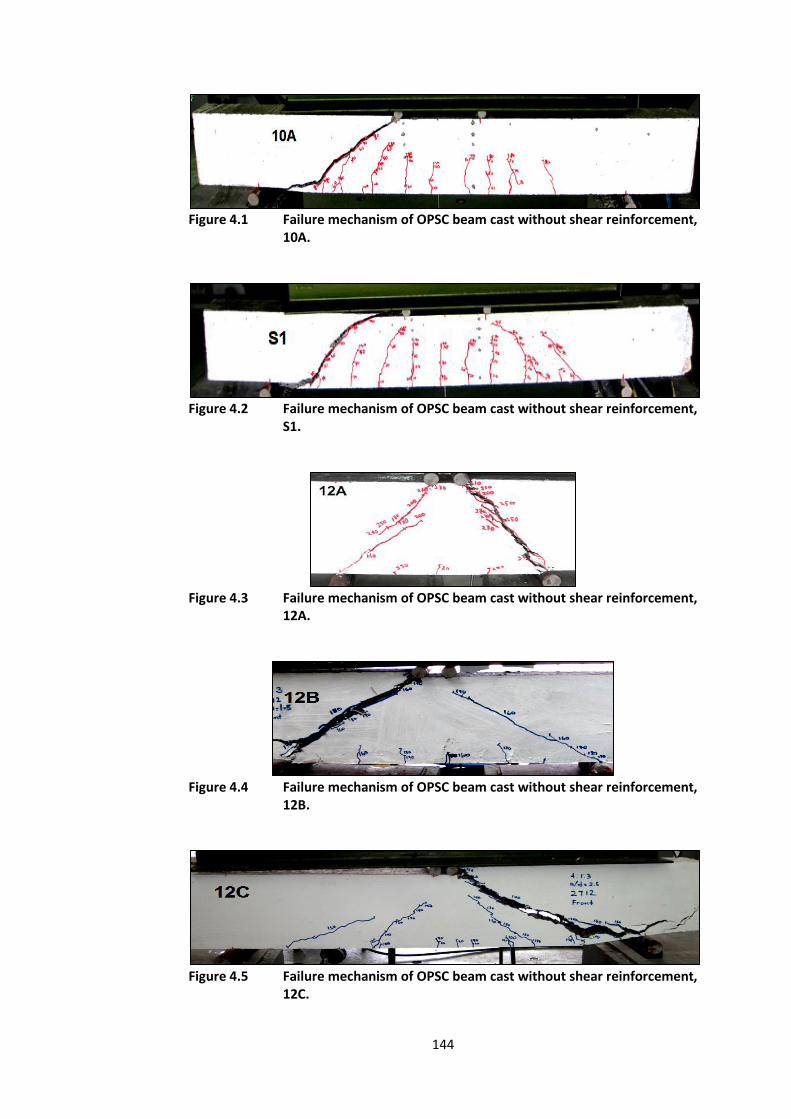
Figure 4.1 Failure mechanism of OPSC beam cast without shear reinforcement, 10A
144
Figure 4.2 Failure mechanism of OPSC beam cast without shear reinforcement, S1
144
Figure 4.3 Failure mechanism of OPSC beam cast without shear reinforcement, 12A
144
Figure 4.4 Failure mechanism of OPSC beam cast without shear reinforcement, 12B
144
Figure 4.5 Failure mechanism of OPSC beam cast without shear reinforcement, 12C
144
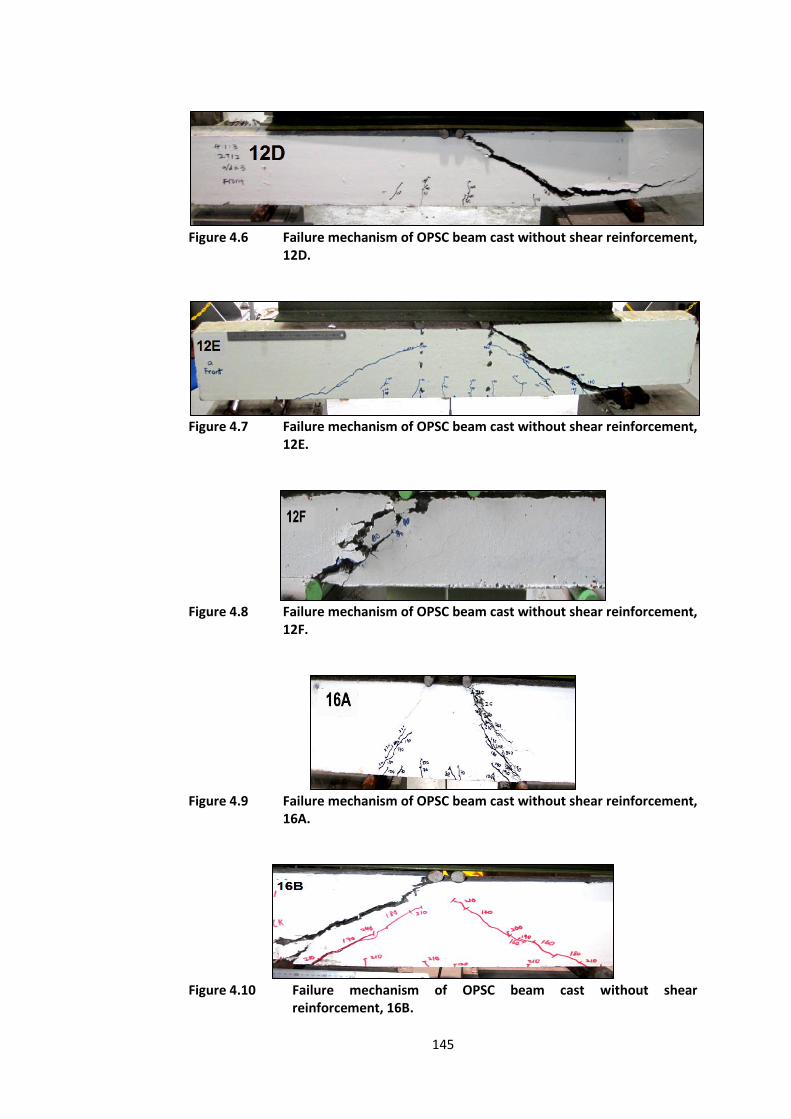
Figure 4.6 Failure mechanism of OPSC beam cast without shear reinforcement, 12D
145
Figure 4.7 Failure mechanism of OPSC beam cast without shear reinforcement, 12E
145
Figure 4.8 Failure mechanism of OPSC beam cast without shear reinforcement, 12F
145
Figure 4.9 Failure mechanism of OPSC beam cast without shear reinforcement, 16A
145
Figure 4.10 Failure mechanism of OPSC beam cast without shear reinforcement, 16B
145
Figure 4.11 Failure mechanism of OPSC beam cast without shear reinforcement, 16C
146
Figure 4.12 Failure mechanism of OPSC beam cast without shear reinforcement, 16D
146
Figure 4.13 Failure mechanism of OPSC beam cast without shear reinforcement, 16E
146
Figure 4.14 Failure mechanism of OPSC beam cast without shear reinforcement, 20A
146
Figure 4.15 Failure mechanism of OPSC beam cast without shear reinforcement, 20B
146
Figure 4.16 Failure mechanism of OPSC beam cast without shear reinforcement, 20C
147
Figure 4.17 Failure mechanism of OPSC beam cast without shear reinforcement, 20D
147
xviii
Figure 4.18 Failure mechanism of OPSC beam cast without shear reinforcement, 20E
147
Figure 4.19 Failure mechanism of OPSC beam cast without shear reinforcement, AD1
147
Figure 4.20 Failure mechanism of OPSC beam cast without shear reinforcement, AD2
147
Figure 4.21 Failure mechanism of OPSC beam cast without shear reinforcement, F1
148
Figure 4.22 Failure mechanism of OPSC beam cast without shear reinforcement, F2
148
Figure 4.23 Failure mechanism of OPSC beam cast without shear reinforcement, H2
148
Figure 4.24 Failure mechanism of OPSC beam cast without shear reinforcement, S2
148
Figure 4.25 Failure mechanism of NWC beam cast without shear reinforcement, NWC1
148
Figure 4.26 Failure mechanism of NWC beam cast without shear reinforcement, NWC2
149
Figure 4.27 Failure mechanism of NWC beam cast without shear reinforcement, NWC3
149
Figure 4.28 Failure mechanism of NWC beam cast without shear reinforcement, NWC4
149
Figure 4.29 Failure mechanism of NWC beam cast without shear reinforcement, NWC5
149
Figure 4.30 Load (kN) vs Central deflection (mm) for OPSC beam specimens cast without shear reinforcement of a/d = 1 and ρ = 1.08%, 1.92% and 2.99%
150
Figure 4.31 Load (kN) vs Central deflection (mm) for OPSC beam specimens cast without shear reinforcement of a/d = 1.5 and ρ = 1.08%, 1.92% and 2.99%
150
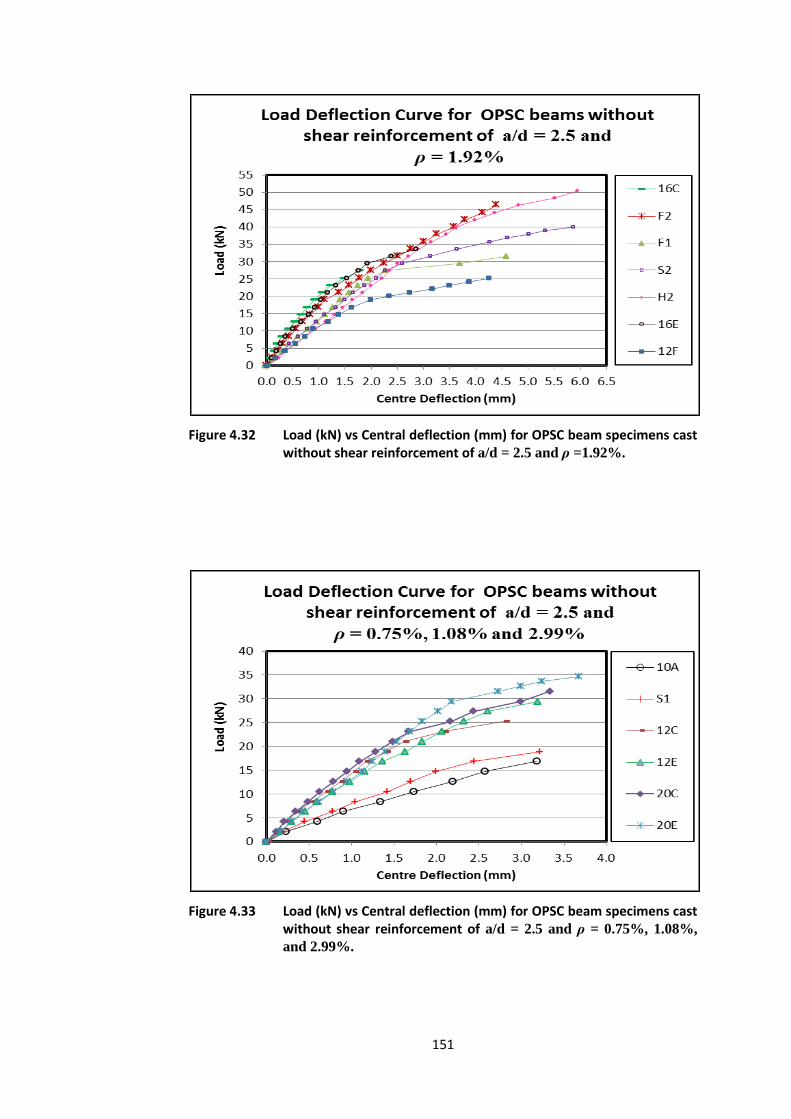
Figure 4.32 Load (kN) vs Central deflection (mm) for OPSC beam specimens cast without shear reinforcement of a/d = 2.5 and ρ = 1.92%
151
Figure 4.33 Load (kN) vs Central deflection (mm) for OPSC beam specimens cast without shear reinforcement of a/d = 2.5 and ρ = 0.75%, 1.08% and 2.99%
151
Figure 4.34 Load (kN) vs Central deflection (mm) for OPSC beam specimens cast without shear reinforcement of a/d = 3 and ρ = 1.08%, 1.92% and 2.99%
152
Figure 4.35 Load (kN) vs Central deflection (mm) for NWC beam specimens cast without shear reinforcement
152
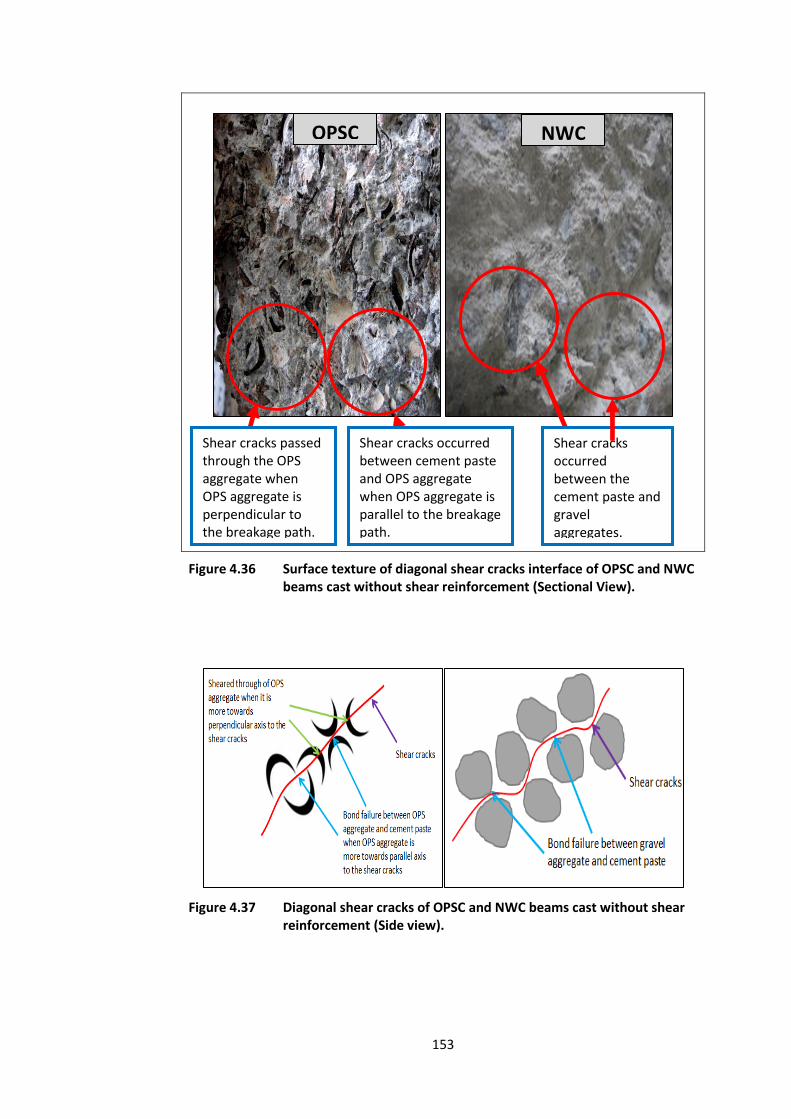
Figure 4.36 Surface texture at the interface of major diagonal shear cracks of OPSC beams cast without shear reinforcement
153
xix
(Sectional view)
Figure 4.37 Diagonal shear cracks of OPSC and NWC beams cast without shear reinforcement (Side view)
153
Figure 4.38 VOPSC (kN) vs Shear span to effective depth ratio, a/d for OPSC beam specimens cast without shear reinforcement
154
Figure 4.39 VTest (kN) vs Shear span to effective depth ratio, a/d for OPSC and NWC beam specimens cast without shear reinforcement
154
Figure 4.40 Surface texture of diagonal shear interface of OPSC beams cast without shear reinforcement tested at a/d=1.5 and a/d=2.5 (Sectional view)
155
Figure 4.41 Surface texture of diagonal shear interface of OPSC and NWC beams cast without shear reinforcement tested at a/d ratio = 1 (Sectional view and Isometric view)
156
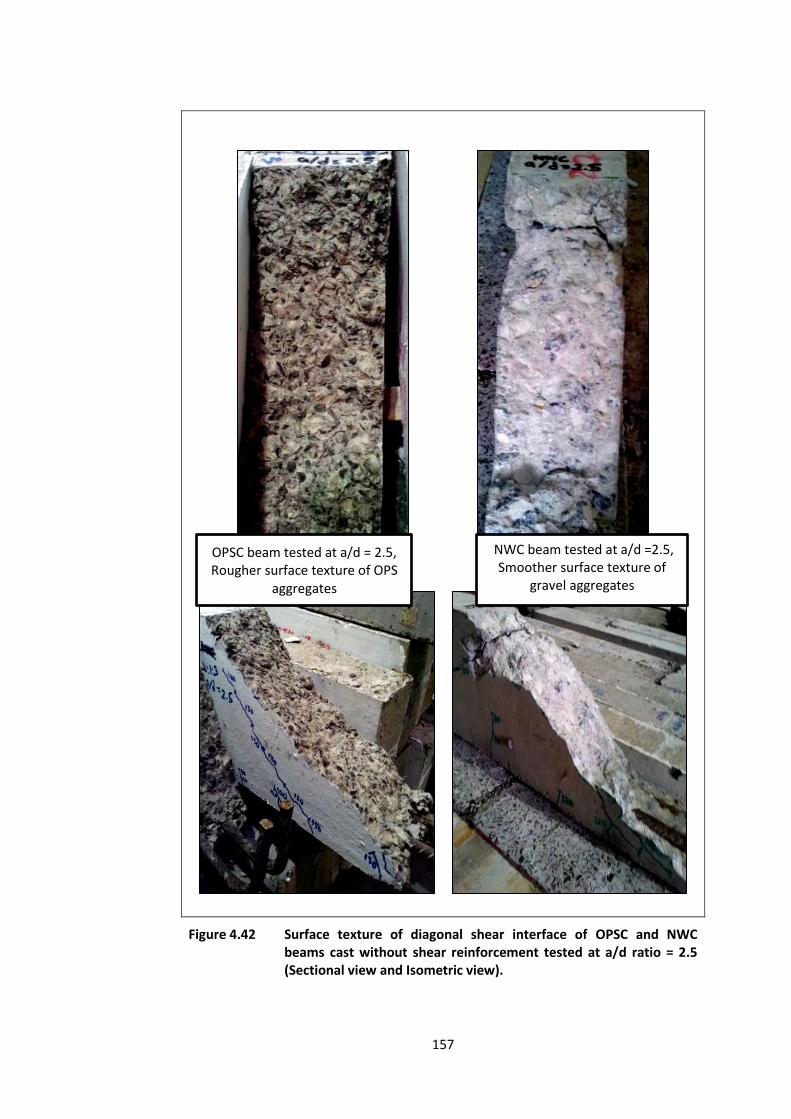
Figure 4.42 Surface texture of diagonal shear interface of OPSC and NWC beams cast without shear reinforcement tested at a/d ratio = 2.5 (Sectional view and Isometric view)
157
Figure 4.43 VOPSC(kN) vs Longitudinal steel ratio, ρ (%) for OPSC beam specimens cast without shear reinforcement
158
Figure 4.44 VTest kN) vs Longitudinal steel ratio, ρ (%) for OPSC and NWC beam specimens cast without shear reinforcement
158
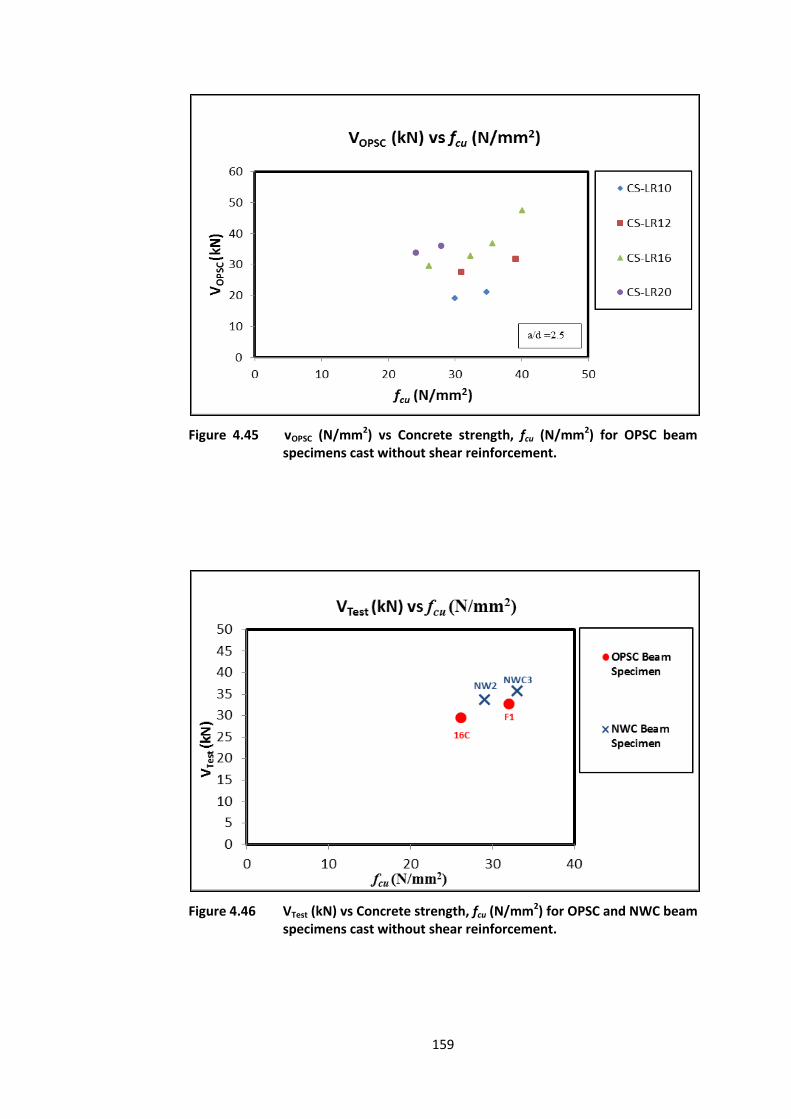
Figure 4.45 VOPSC(kN) vs Concrete strength, fcu (N/mm2) for OPSC beam specimens cast without shear reinforcement
159
Figure 4.46 VTest (kN) vs Concrete strength, fcu (N/mm2) for OPSC and NWC beam specimens cast without shear reinforcement
159
Figure 4.47 VOPSC(kN) vs Overall section depth, h (mm) for OPSC beam specimens cast without shear reinforcement
160
Figure 4.48 VOPSC(N/mm2) vs vs Overall section depth, h (mm) for OPSC and NWC beam specimens cast without shear reinforcement
160
Figure 4.49 VTest (kN) vs Overall section depth, h (mm) for OPSC and NWC beam specimens cast without shear reinforcement
161
Figure 4.50 Failure mechanism of OPSC beam cast with shear reinforcement, 3A
161
Figure 4.51 Failure mechanism of NWC beam cast with shear reinforcement, 3B
161
Figure 4.52 Failure mechanism of NWC beam cast with shear reinforcement, 3C
161
Figure 4.53 Failure mechanism of OPSC beam cast with shear reinforcement, 4A
162
Figure 4.54 Failure mechanism of NWC beam cast with shear reinforcement, 4B
162
Figure 4.55 Failure mechanism of NWC beam cast with shear reinforcement, 4C
162
xx
Figure 4.56 Failure mechanism of OPSC beam cast with shear reinforcement, 5A
162
Figure 4.57 Failure mechanism of NWC beam cast with shear reinforcement, 5B
162
Figure 4.58 Failure mechanism of NWC beam cast with shear reinforcement, 5C
163
Figure 4.59 Failure mechanism of OPSC beam cast with shear reinforcement, 4D
163
Figure 4.60 Failure mechanism of OPSC beam cast with shear reinforcement, 4E
163
Figure 4.61 Failure mechanism of NWC beam cast with shear reinforcement, NWCA
163
Figure 4.62 Failure mechanism of NWC beam cast with shear reinforcement, NWCB
163
Figure 4.63 Failure mechanism of NWC beam cast with shear reinforcement, NWCC
164
Figure 4.64 Failure mechanism of NWC beam cast with shear reinforcement, NWCD
164
Figure 4.65 Failure mechanism of NWC beam cast with shear reinforcement, NWCE
164
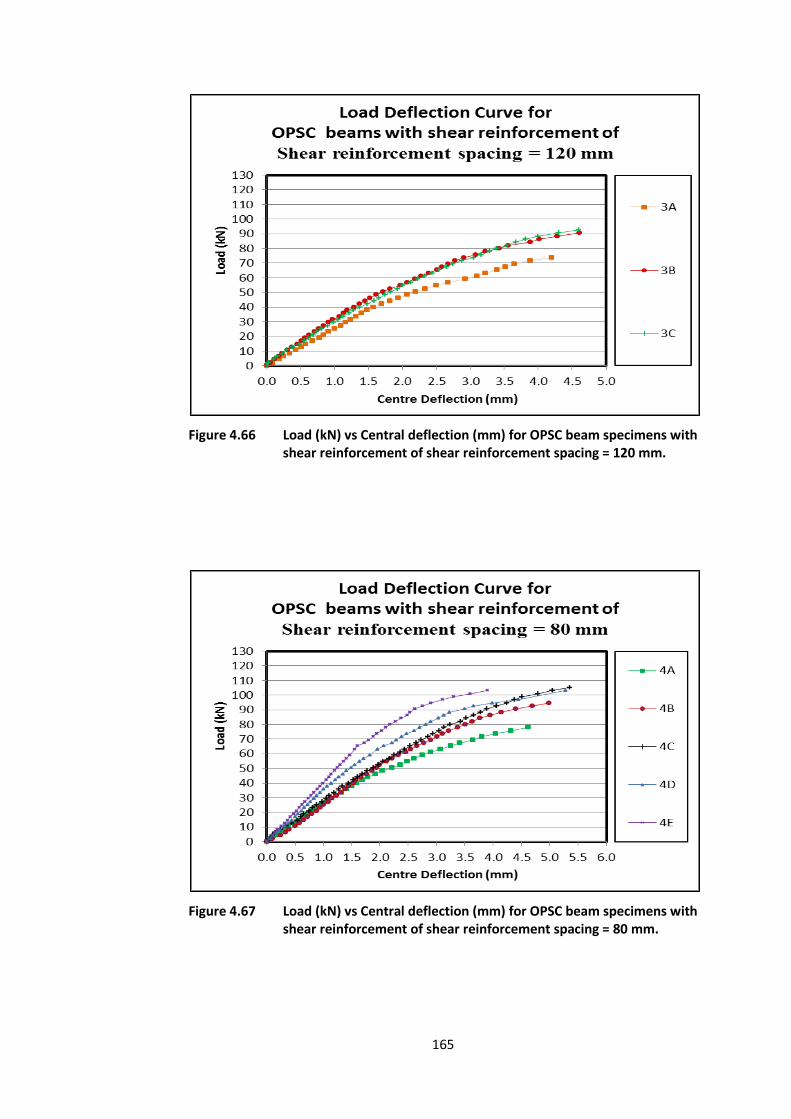
Figure 4.66 Load (kN) vs Central deflection (mm) for OPSC beam specimens with shear reinforcement of shear reinforcement spacing = 120 mm
165
Figure 4.67 Load (kN) vs Central deflection (mm) for OPSC beam specimens with shear reinforcement of shear reinforcement spacing = 80 mm
165
Figure 4.68 Load (kN) vs Central deflection (mm) for OPSC beam specimens with shear reinforcement of shear reinforcement spacing = 60 mm
166
Figure 4.69 Load (kN) vs Central deflection (mm) for NWC beam specimens with shear reinforcement
166
Figure 4.70 Surface texture of diagonal shear interface of OPSC and NWC beam specimens cast with shear reinforcement (Sectional view)
167
Figure 4.71 Surface texture of diagonal shear interface of OPSC and NWC beam specimens cast with shear reinforcement (Isometric view)
168
Figure 4.72 VOPSC(kN) vs Shear reinforcement spacing, s (mm) for OPSC beam specimens cast with shear reinforcement
169
Figure 4.73 VTest (kN) vs Shear reinforcement spacing, s (mm) for OPSC and NWC beam specimens cast with shear reinforcement
169
Figure 4.74 VOPSC(kN) vs Inclination of shear cracks, ϴ (degree) for OPSC beam specimens cast with shear reinforcement
170
xxi
Figure 4.75 VTest(kN) vs Inclination of shear cracks, ϴ (degree) for OPSC and NWC beam specimens cast with shear reinforcement
170
Figure 4.76 VOPSC(kN) vs Concrete strength, fcu (N/mm2) for OPSC beam specimens cast with shear reinforcement
171
Figure 4.77 VTest (kN) vs Concrete strength, fcu (N/mm2) for OPSC and NWC beam specimens cast with shear reinforcement
171
Chapter 5
Figure 5.1 f(a/h) vs a/h for Existing plastic model (CP-NS Model) and Modified plastic model (CP-I Model)
188
Figure 5.2 f(ρ) vs ρ(%) for Existing plastic model (CP-NS Model) and Modified plastic model (CP-I Model)
188
Figure 5.3 f(σc) vs σc (N/mm2) for Existing plastic model (CP-NS Model) and Modified plastic model (CP-I Model)
189
Figure 5.4 f(h) vs h (mm) for Existing plastic model (CP-NS Model) and Modified plastic model (CP-I Model)
189
Figure 5.5 VOPSC/VCP vs Shear span to height ratio, a/h 190
Figure 5.6 VOPSC/VCP vs Longitudinal steel ratio, ρ (%) 190
Figure 5.7 VOPSC/VCP vs Cylindrical concrete strength, σc (N/mm2) 191
Figure 5.8 VOPSC/VCP vs Overall section depth, h (mm) 191
Figure 5.9 f(σc) vs σc (N/mm2) for Existing CP Model (CP-S Model) and Modified CP Model (CP-II Model)
192
Figure 5.10 f(ρs) vs ρs (%) for Existing concrete plastic model (CP-S Model)
192
Figure 5.11 f(
) vs ϴ(rad) for Existing CP Model (CP-S Model) 193
Figure 5.12 VOPSC/VCP vs Cylindrical concrete strength, σc (N/mm2) 193
Figure 5.13 VOPSC/VCP vs Shear reinforcement ratio, ρs (%) 194
Figure 5.14 VOPSC/VCP vs Inclination angle of shear cracks, ϴ (rad) 194
Chapter 6
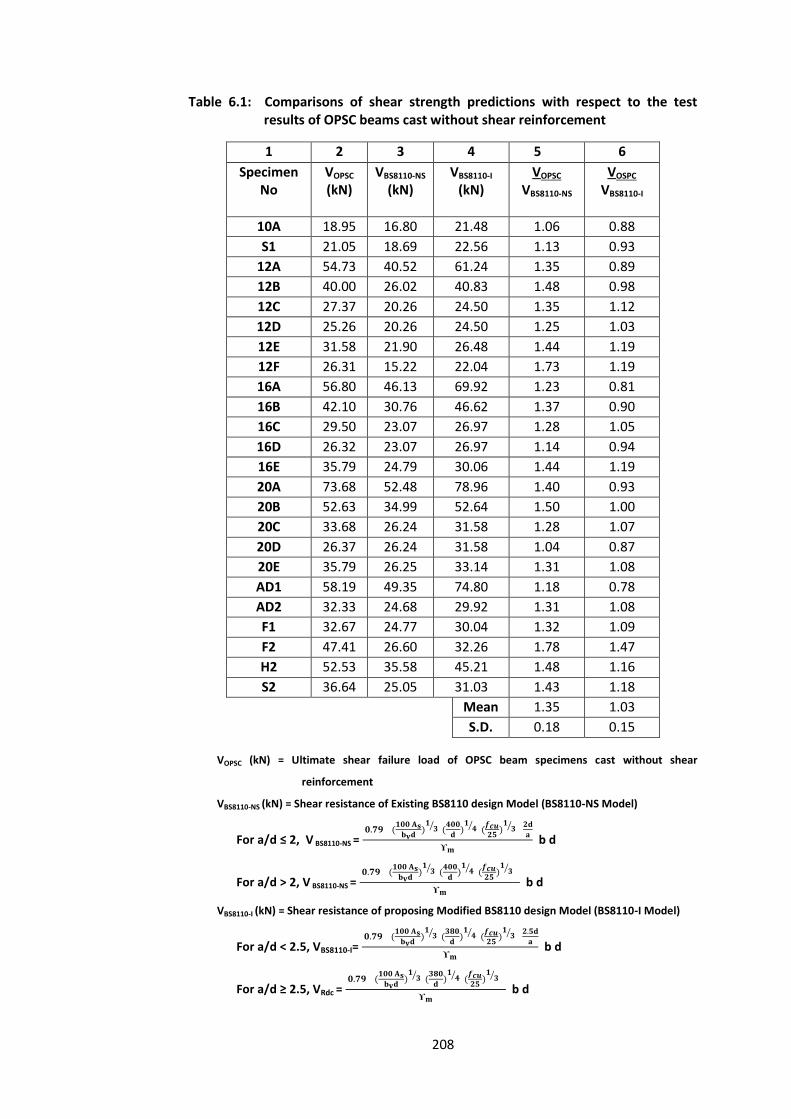
Figure 6.1 f(a/d) vs a/d for Existing BS8110 design Model (BS8110-NS Model) and Modified BS8110 design Model (BS8110-I Model)
210
xxii
Figure 6.2 f(ρ) vs ρ (%) for Existing BS8110 design model (BS8110-NS Model)
210
Figure 6.3 f(fcu1/3) vs fcu (N/mm2) for Existing BS8110 design model
(BS8110-NS Model) 211
Figure 6.4 f(d) vs d (mm) for Existing BS8110 design Model (BS8110-NS Model) and Modified BS8110 design Model (BS8110-I Model)
211
Figure 6.5 VOPSC/VBS8110 vs Shear span to effective section depth ratio, a/d
212
Figure 6.6 VOPSC/VBS8110 vs Longitudinal steel ratio, ρ (%) 212
Figure 6.7 VOPSC/VBS8110 vs Cube concrete strength, fcu (N/mm2) 213
Figure 6.8 VOPSC/VBS8110 vs Effective section depth, d (mm) 213
Figure 6.9 f(
) vs
for Existing BS8110 design model (BS8110-S
Model)
214
Figure 6.10 f( 1/3) vs ( ⁄
) for Existing BS8110 design model
(BS8110-S Model)
214
Figure 6.11 f(
vs for Existing BS8110 design model (BS8110-S
Model) and Modified BS8110 design model (BS8110-II Model)
215
Figure 6.12 VOPSC/VBS8110 vs Shear reinforcement ratio,
215
Figure 6.13 VOPSC/VBS8110 vs Cube concrete strength, fcu (N/mm2)
216
Figure 6.14 VOPSC/VBS8110 vs Shear span to effective depth ratio, a/d 216
Chapter 7
Figure 7.1 f(a/d) vs a/d for Existing EC2 design Model (EC2-NS Model) and Modified EC2 design Model (EC2-I Model)
231
Figure 7.2 f(ρ1/3) vs ρ (%) for Existing EC2 design Model (EC2-NS Model) 231
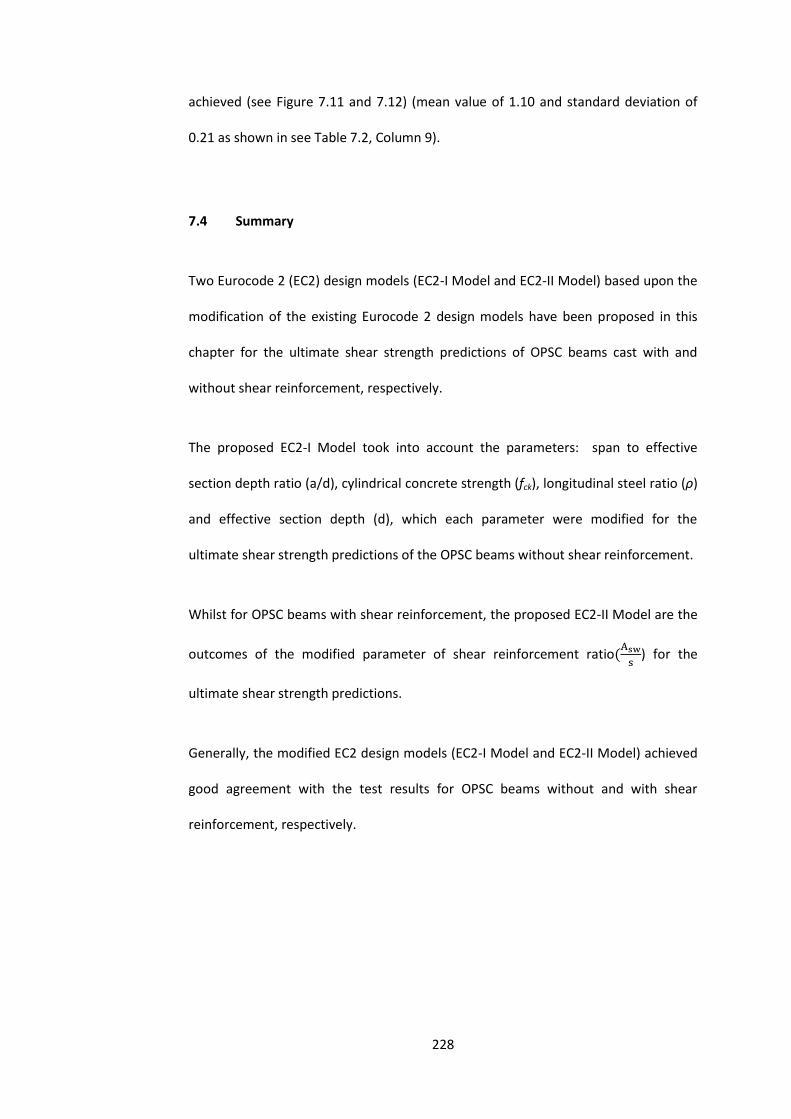
Figure 7.3 f(fck1/3) vs fck (N/mm2) for Existing EC2 design Model (EC2-NS
Model) 232
Figure 7.4 f(k) vs d (mm) for Existing EC2 design Model (EC2-NS Model) and Modified EC2 design Model (EC2-I Model)
232
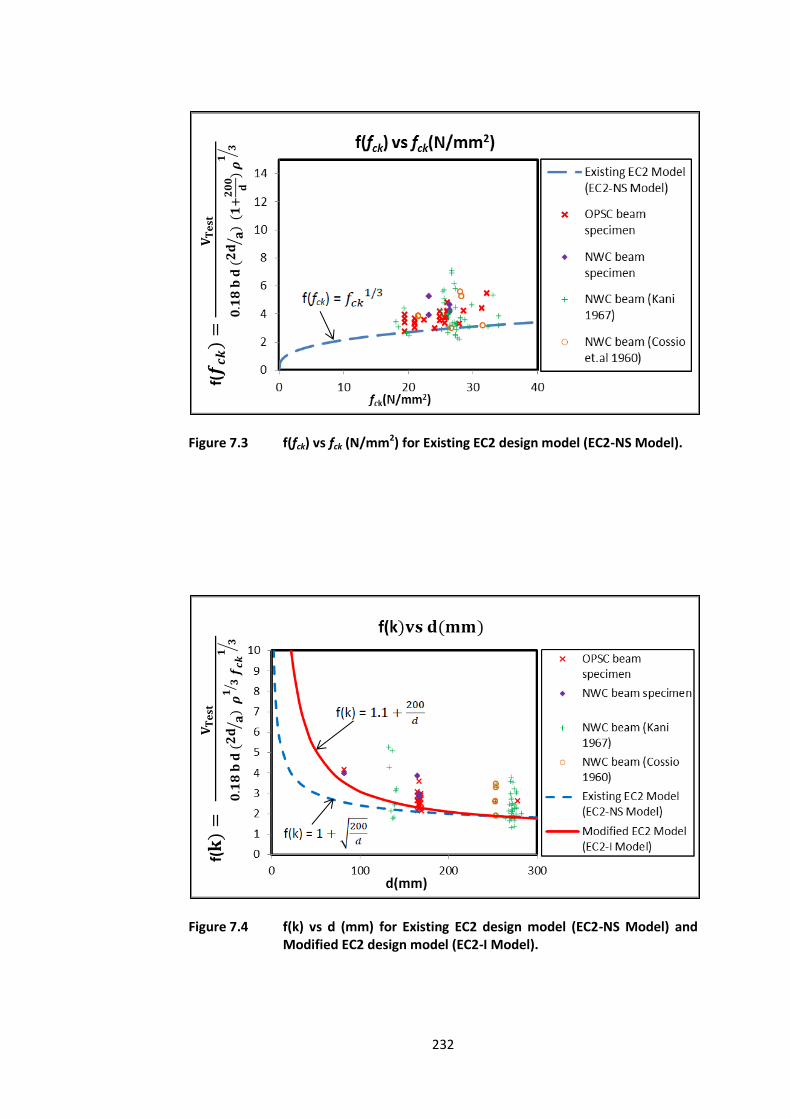
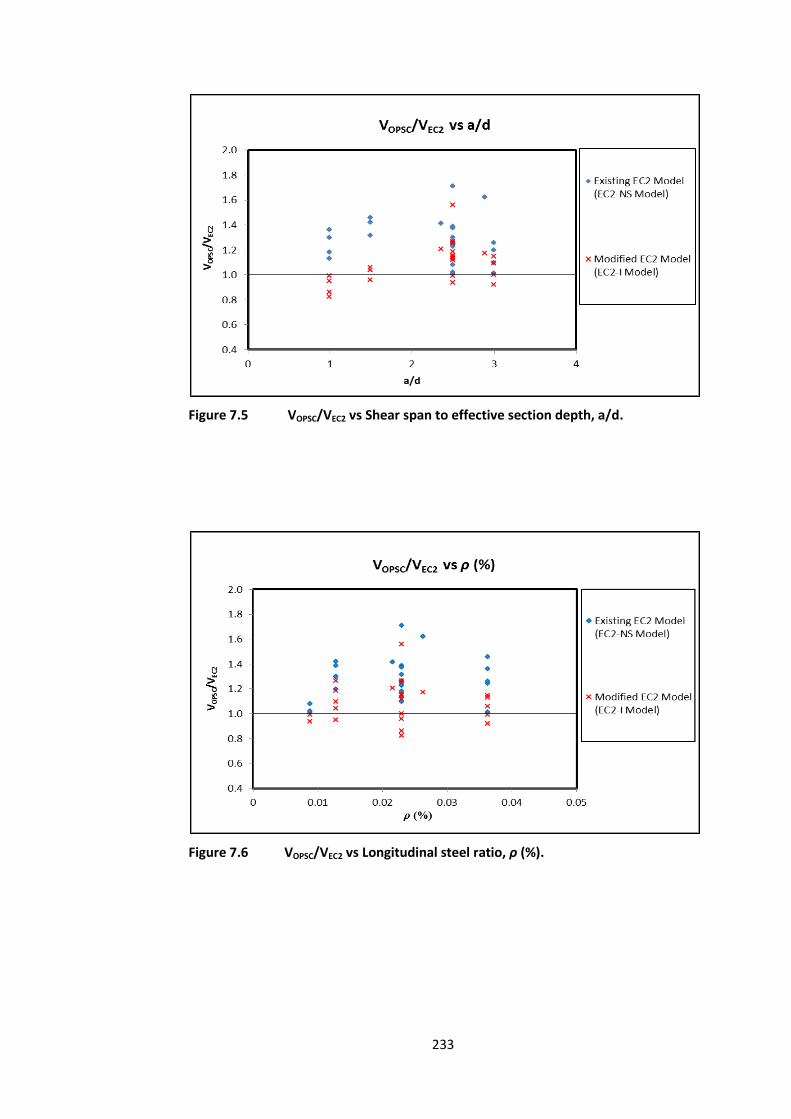
Figure 7.5 VOPSC/VCP vs Shear span to effective depth ratio, a/d 233
Figure 7.6 VOPSC/VCP vs Longitudinal steel ratio, ρ (%) 233
xxiii
Figure 7.7 VOPSC/VCP vs Cylindrical concrete strength, fck (N/mm2) 234
Figure 7.8 VOPSC/VCP vs Effective section depth, d (mm) 234
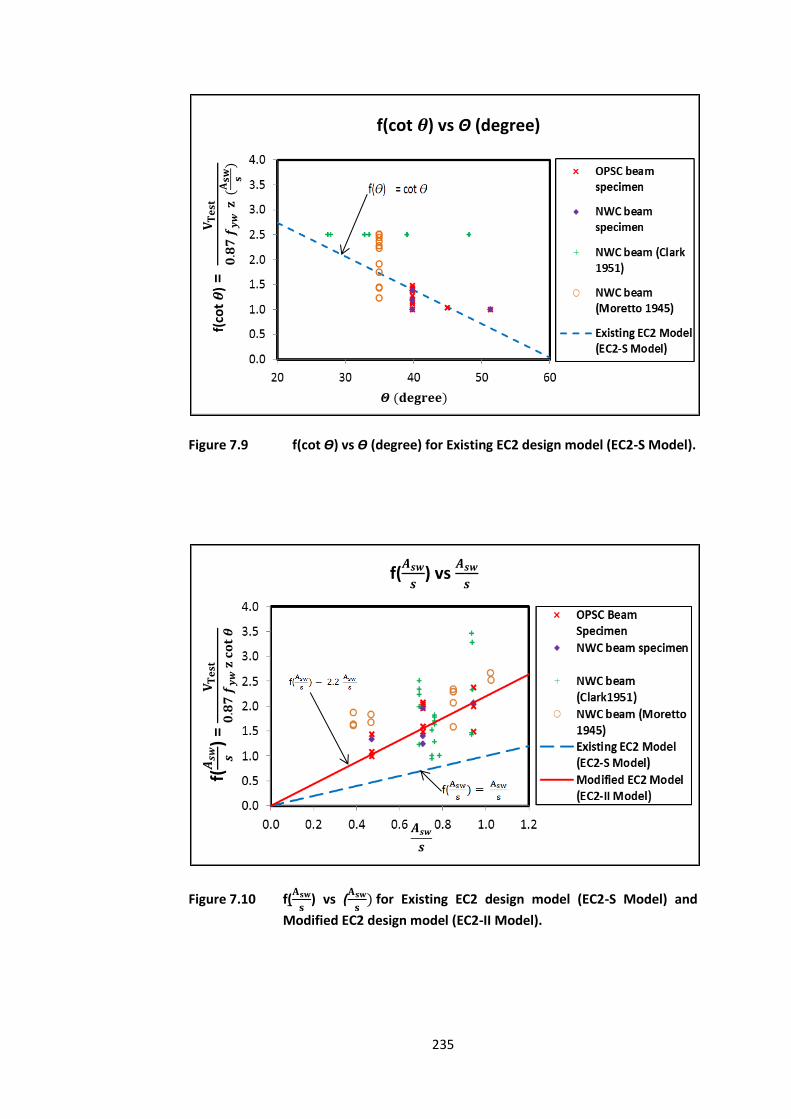
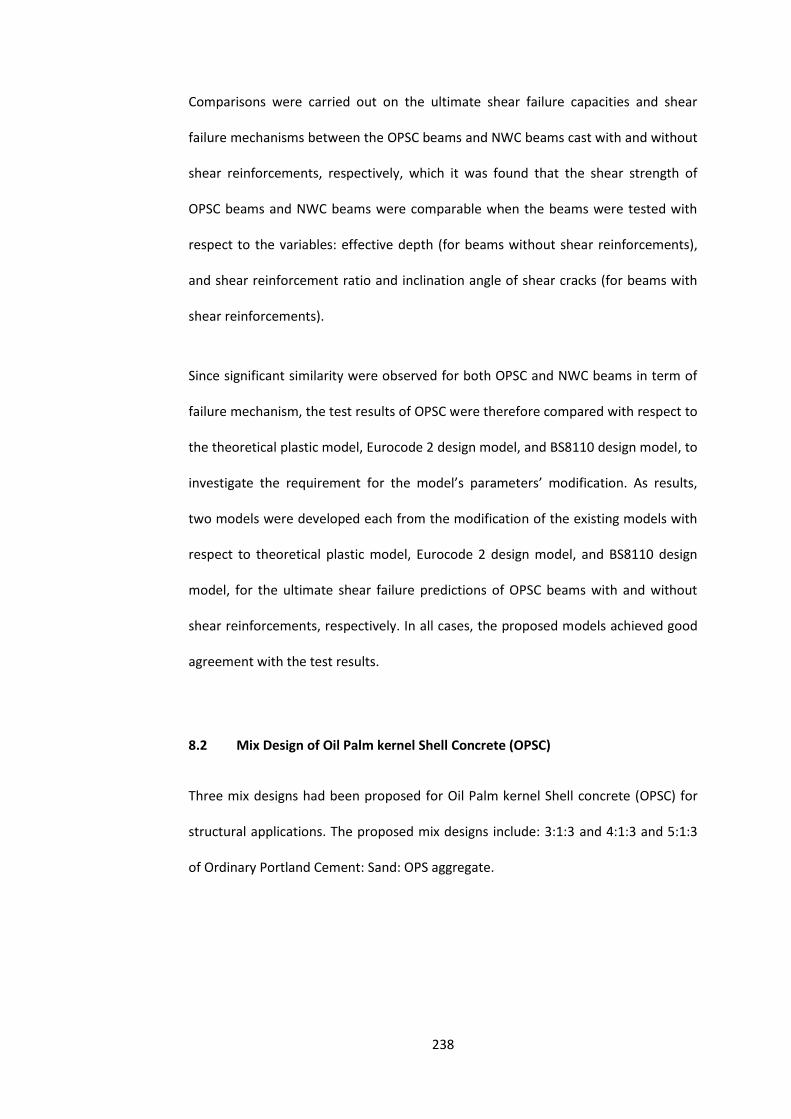
Figure 7.9 f(cot ϴ) vs ϴ (degree) for Existing EC2 design Model (EC2-S Model)
235
Figure 7.10 f(
) vs
for Existing EC2 design Model (EC2-S Model) and
Modified EC2 design Model (EC2-II Model)
235
Figure 7.11 VOPSC/VEC2 vs Inclination angle of shear cracks, ϴ (degree) 236
Figure 7.12 VOPSC/VEC2 vs Shear reinforcement ratio,
236
xxiv
Notations
a Length of that part of a member traversed by a shear failure plane
As Cross sectional area of longitudinal steel reinforcement
Asw Cross sectional area of shear reinforcement
b Breadth of section
d Effective depth
d’ Depth to compression reinforcement
fcu Cube concrete strength
fck Cylindrical concrete strength
fyk Characteristic yield strength of reinforcement
fyw Design yield strength of the shear reinforcement
h Overall depth of beam section
L Length or span
M Moment or bending moment
s Shear reinforcement spacing
vc Design cracking stress of the beam
vu Design ultimate shear stress of the beam
V Total shear strength of the beam
Vc Design cracking load of the beam
Vu Design shear force due to ultimate load
ρ Longitudinal steel ratio
ρs Shear reinforcement ratio
ϴ Inclination angle of shear cracks
ϒm Partial safety factor for material strength
ϒc Partial safety factor for concrete strength
1
Chapter 1
Introduction
1.1 Introduction In recent years, the use of Oil Palm kernel Shell (OPS) (see Figure 1.1) as coarse
aggregate in concrete, Oil Palm kernel Shell Concrete (OPSC), has increasingly
become popular in research [1-16] owing to its environmental and economic
benefits. Due to the scale of palm oil production industry in Malaysia, substantial
amount of OPS have therefore resulted. However, these OPS were of no economical
values and were mostly left to decay [1], but, in recent years, it has become
increasing popular as raw burning materials for power production [17].
OPS (see Figure 1.1) is essentially a by-product of palm oil production (see Figure
1.2). OPS has low bulk density, and when it is used in concrete as coarse aggregate,
lightweight concrete is produced. The lightweight nature of the concrete reduces the
overall dead load in a structure, hence, lead to smaller foundation size, and results in
a great amount of saving in the total construction cost [13].
The OPSC constitutes of cement, sand, OPS and water. Since the introduction of
OPSC, considerable amount of research [1-16] have been carried out to aid the
understanding of its concrete mixture designs [1-6] and its material properties [7-11].
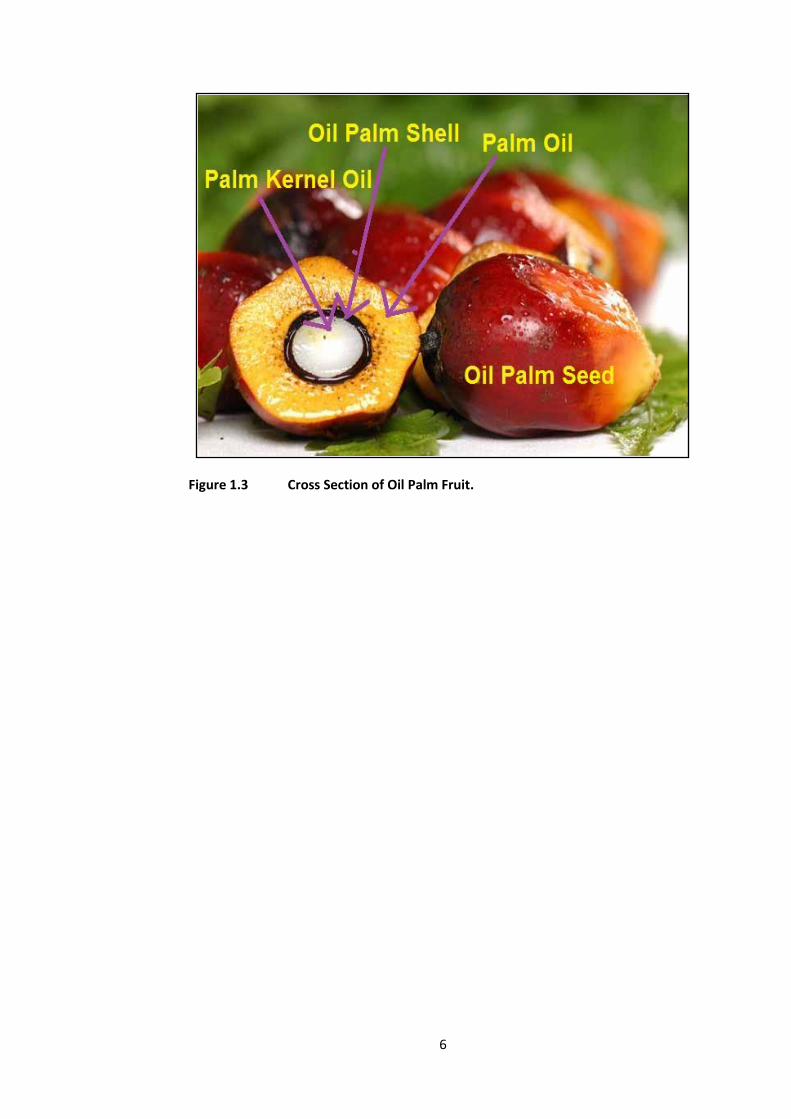
OPS is brown coloured in nature and it is basically the hard endocarps encasing the
palm kernel oil from the palm fruit as shown in Figure 1.3. The OPS extracted from
2
palm oil production take the shape of crescent, where the convex part of OPS were
observed to be rougher than the concave part as indicated in Figure 1.1.
1.2 Problem Statement
Previous researchers [1-11] have been focusing on the mix design and material
properties of OPSC. However, only limited amount of works have been carried out to
aid the understanding of the OPSC structural resistance, such as bending resistance
[12-14] and shear resistance [15 & 16]. Hence, due to the OPS promising potential as
lightweight aggregates, and OPSC as lightweight structural concrete, it is apparent
that more research are required to develop a comprehensive understanding,
particularly, in the area of shear transfer mechanism for its structural elements.
Current understanding on shear transfer mechanism, derives from tests on NWC cast
using normal granite aggregates, indicates that shear resistance of reinforced
concrete elements derives from aggregate interlocking, dowel action of the
longitudinal reinforcement, concrete compression zone and concrete tensile
strength. Since the OPS aggregate differed from those of normal aggregates in term
of aggregate impact strength, specific gravity, aggregate shape, and bulk density, the
shear transfer mechanism of OPSC would expected to be different from those of
NWC.
The current design procedures by BS8110 [47] and EC2 [48] for shear transfer
mechanism of both the Lightweight Aggregate Concrete (LWAC) and the Normal
Weight Concrete (NWC) are derived from the understanding of concrete cast using
normal aggregates. Hence, it is apparent that, the current design procedures by
BS8110 [47] and EC2 [48] may not be suitable to predict the ultimate shear resistance
3
of the OPSC beams. Since no guidance has been given from the current codes of
practice [47 & 48], it is therefore essential that a research investigation to be carried
out to aid the current understanding on shear transfer mechanisms of OPSC beams,
both cast without shear reinforcements and with shear reinforcements.
1.3 Objectives and scope
The main objective of this research is to explore the shear resistance of OPSC beams
through experimental and analytical study.
1.3.1 Objectives
Objectives of the research include:
1. To develop mix design of OPSC for structural applications.
2. To observe from experimental testing, the effect of variables considered on
the ultimate shear failure capacities and the shear failure mechanisms.
3. To compare the ultimate shear failure capacities and shear failure
mechanisms between the OPSC beams and NWC beams cast with and
without shear reinforcements, respectively.
4. To develop theoretical prediction models using upper bound plastic approach
[45 & 46] and simple predictive design models, from those based on the
current EC2 [47] and BS8110 [48] to predict the shear carrying resistance of
OPSC beams cast with and without shear reinforcements, respectively.
1.3.2 Scope
For OPSC cast without shear reinforcements, the variables considered are
NWCD, NWCE) were reinforced with 2T14 as compression reinforcement and 2T16 as
tension reinforcement (See Figure 3.5 and Figure 3.6). OPSC beam specimens (5A, 5B,
5C) and NWC specimens (NWCC) were reinforced with 2T14 and 2T20 as
compression reinforcement and 2T16 and 2T20 as tension reinforcement (See Figure
3.7).
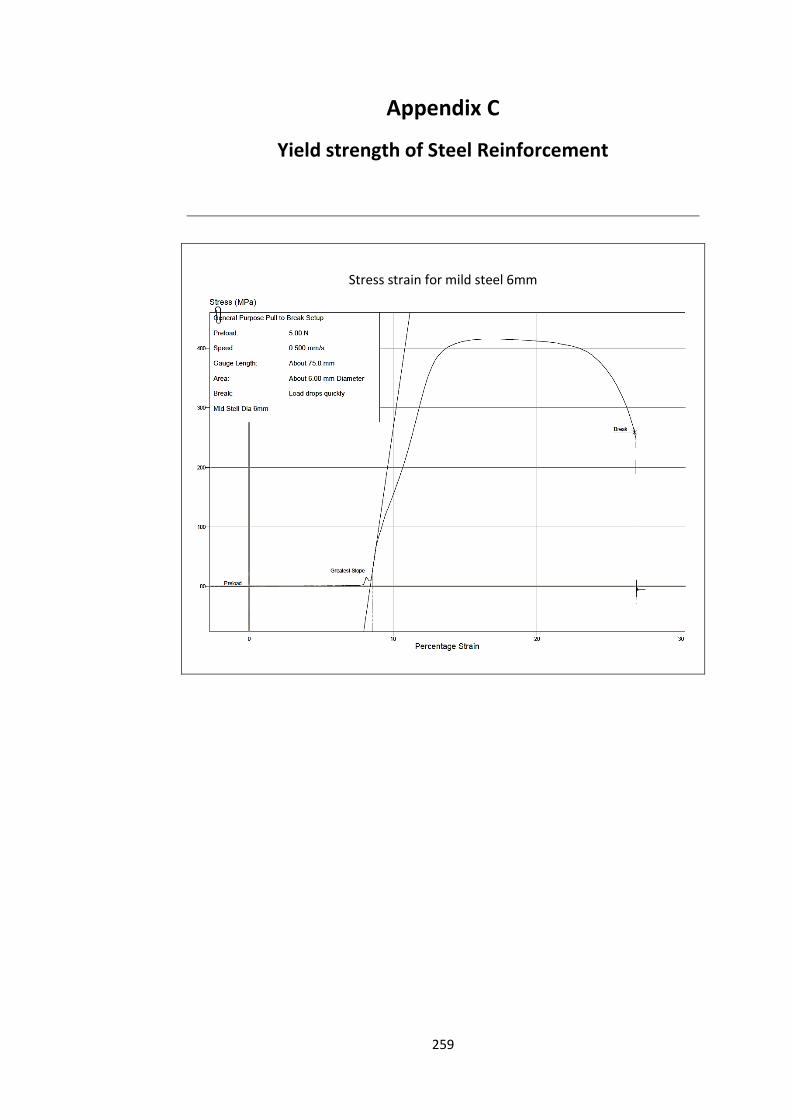
All shear reinforcement were 6mm plain bars with yield strength of 410 N/mm2. Link
spacing used in this research include: 60 mm, 80 mm, and 120 mm. (See Figure 3.5 to
Figure 3.7).
3.4 Beam specimens cast without shear reinforcement
3.4.1 OPSC Beam Specimens
A total of twenty-four OPSC beam specimens cast without shear reinforcement, as
indicated in Table 3.3, were tested to investigate the variables considered in this
84
research; shear span to effective depth ratio (Series SP), concrete strength (Series
CS), longitudinal steel reinforcement ratio (Series LR) and section depth (Series HT).
In general, all beam specimens were identical in their overall dimensions; 200 mm in
height, 105 mm in width, and 1500 mm in length; except for specimens 12F and H2,
where, the overall section depths were 113 mm and 313 mm, respectively.
The effect of Span to depth ratio, longitudinal reinforcement, concrete strength and
overall section depth variations on the ultimate shear capacity of OPSC beams
without shear reinforcement were investigated through destructive tests carried out
on fifteen, eighteen, ten and three beams, respectively (see Table 3.3).
3.4.2 NWC Beam specimens
A total of five NWC beam specimens cast without shear reinforcement, as indicated
in Table 3.4, were tested to form the basis for comparisons with the OPSC beam
specimens with respects to the variables considered: span to depth (SP), concrete
compressive strength (CS), longitudinal reinforcement ratio (LR) and overall section
depth (HT).
Specimens (NWC2, NWC3, NWC4 and NWC5) were tested at a/d = 2.5, while
specimen (NWC1) was tested at a/d = 1. The concrete strength for specimens (NWC1,
NWC2, and NWC5) was 33N/mm2, while specimens (NW3 and NWC4) were 29
N/mm2. The overall section depth of specimens (NWC1, NWC2, NWC3 and NWC4)
was 200 mm, while for specimen (NWC5) was 113 mm.
85
3.5 Beam specimens cast with shear reinforcement
3.5.1 OPSC beam specimens
A total of eleven OPSC beam specimens cast with shear reinforcement, as indicated
in Table 3.5 were tested to investigate the variables considered in this research:
concrete strength (CG), shear reinforcement spacing (SR) and shear span (PL). In
general, all beam specimens were identical in their overall dimensions; 200 mm in
height, 105 mm in width, and 1500 mm in length.
The effect of concrete compressive strength, shear reinforcement spacing, and shear
span variations on the ultimate shear capacity of OPSC beams with shear
reinforcement were investigated through destructive tests carried out on nine, nine
and three beams, respectively (see Table 3.5).
3.5.2 NWC beam specimens
A total of five NWC beam specimens cast with shear reinforcement, as indicated in
Table 3.6, were tested to form the basis for comparisons with the OPSC beam
specimens with respects to variables: span to depth ratio (PL), concrete compressive
strength (CG), and shear reinforcement spacing (SR).
Specimens (NWCA, NWCB, NWCC and NWCE) were tested at a/d = 1.69, while
specimen (NWCD) was tested at a/d = 1.06. The concrete strength for specimens
(NWC A, NWC B, NWCC and NWCD) was 30.61 N/mm2, while for specimen (NWCE)
was 35 N/mm2. The shear reinforcement spacing for specimens (NWCB, NWCD and
NWCE) was 80 mm, while for specimen NWCC and NWCA was 60 mm and 120 mm,
respectively.
86
3.6 Fabrication of specimens
3.6.1 Mould
All beam specimens with overall section depth of 200 mm were cast using steel
moulds. Each of these steel moulds consisted of a rectangular steel plate and four
channel sections (see Figure 3.8 and Figure 3.9). The rectangular steel plates, forming
the base plates, were predrilled with holes to receive the channel section, forming
the sides of the mould.
Beam specimens having overall section depth less than 200 mm were cast using the
abovementioned steel moulds. Depth control markings were made available within
the moulds to allow for casting of specimens with lower section depth.
Beam specimens having overall section depth more than 200 mm were cast using
plywood mould. The plywood moulds consisted of five rectangular plywood sections
of various sizes (see Figure 3.10 and Figure 3.11).
In all cases, silicone was used to fill the gaps between the sides and the bases before
every cast of beam specimens. This was done to avoid leakage of concrete.
In this research, standard steel cube moulds were used for the casting of concrete
cubes (100 mm X 100 mm X 100 mm) for compression tests.
3.6.2 Casting and curing
All beam specimens were cast in an upright position so as to stimulate the casting of
the prototype structures. Five cubes and three beam specimens were cast in every
87
single batch. Prior to concreting, all moulds and cubes were cleaned and applied with
de-moulding oil.
For every cast, concrete was poured into the moulds in three equal layers. Every
layers of concrete were poured simultaneously among all cubes and beam specimens
to ensure uniform distribution of concrete. After every layer of pouring, all beam
specimens were compacted using handheld vibrating poker for equal number of
times and until the bubbling subsided. All the cubes were compacted on vibrating
table for three equal layers, and for each layer, compaction were carried out until
bubbling subsided. These were done to ensure for similar compaction between the
cubes and the beam specimens.
All the specimens were de-moulded approximately 24 hours after casting. All
specimens were water cured, together in the same water tank, to ensure for identical
curing conditions. The curing durations and the compressive strengths for all
specimens are summarized and presented in Table 3.7 to Table 3.10.
3.7 Test setup
All beam specimens were tested in an upright manner so as to stimulate the
prototype structures. During tests, all specimens were simply supported at both
ends, as shown in Figure 3.18. The loads were applied at the centre, via spreader
beams with mean of 30 ton hand operated hydraulic jack. (See Figure 3.12 and Figure
3.13)
In general, the loads were applied with increment(s) of 4.21 kN until failure occurred.
Central deflections were measured and recorded after each load increment(s).
88
3.7.1 Beam specimens cast without shear reinforcement
Both OPSC and NWC specimens were loaded at designated positions from the
support to achieve the required span-depth ratio(s), a/d, as stipulated in Table 3.3
and 3.4 (See Figure 3.14).
3.7.2 Beam specimens cast with shear reinforcement
In general, the locations of the shear reinforcement were marked prior to tests to
ensure for correct positioning of supports and applying loads. (See Figure 3.15)
For OPSC specimens; beam specimens tested to investigate concrete strength (CG)
and links spacing (SR), were loaded at distance(s) of 240 mm from the support(s) as
shown from Figure 3.16 to Figure 3.18. Whilst for specimens tested to investigate
shear span (PL) were loaded at distance(s) of 240 mm, 200 mm, and 160 mm from
the support(s), as shown in Figure 3.17, Figure 3.19 and Figure 3.20, respectively.
For NWC control specimens; In general, beam specimens were loaded at distance(s)
of 240 mm from the support(s) (See Figure 3.17). Except for specimen NWCD, it was
loaded at distance(s) 160 mm from the support(s), as shown in Figure 3.19.
3.8 Central deflection
Mechanical dial gauge with a 100 mm strut, reading accuracy to 0.01 mm were used
to measure the central deflection of the beam specimens. The dial gauge was
positioned below the mid span of the beam specimens, as shown in Figure 3.21.
89
3.9 Testing procedures
Prior to testing, all beam specimens were positioned into the correct testing
positioning and dial gauge installed. In all cases, compressive tests on cubes
specimens were performed prior to any beam tests to ensure for the required
concrete compressive strength. The beam tests would be carried out after the
required compressive strength has been achieved.
After all the testing equipment had been accurately installed, the initial readings
from the deflection gauge were recorded.
For all beam specimens, the loads were applied with an increment of 4.21 kN until
failure occurred. Deflection was recorded and the cracks were marked at every load
increments. A series of load vs central deflection curves are presented in Chapter 4.
After testing, some of the specimens were cut open for ease of examine on the shear
crack interface. Details of these investigations are presented in Chapter 4.
90
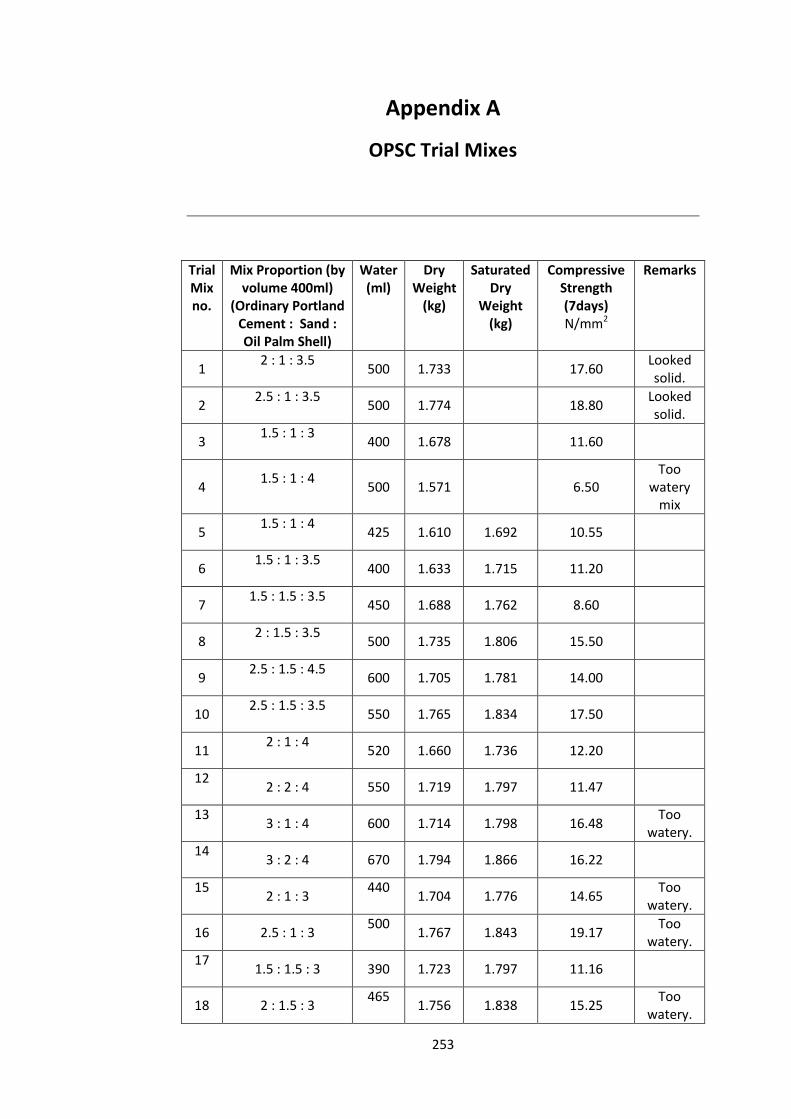
Table 3.1 Mix design of Oil Palm Shell Concrete (OPSC)
Constitutions Proportions in Volume
A B C
Ordinary Portland Cement 3 4 5
Sand as fine aggregate 1 1 1
Oil Palm Shell as coarse aggregate 3 3 3
Water/Cement ratio 0.44 0.37 0.34
Note: 1 volume Cement = 0.537 kg 1 volume Sand = 0.56 kg 1 volume OPS aggregates = 0.22 kg
Table 3.2 Mix design of Normal Weight Concrete Beam (NWC)
Constitutions
Proportion in Volume
N
Ordinary Portland Cement 1
Sand as fine aggregate 0.58
Crushed gravel aggregate as coarse aggregate 0.79
Water/Cement ratio 0.43
Note: 1 volume Cement = 0.537 kg 1 volume Sand = 0.56 kg 1 volume gravel aggregates = 0.594 kg
91
Table 3.3 Details of OPSC beam specimens cast without shear reinforcement
Specimen No.
Section width, b (mm)
Overall section
depth, h (mm)
Longitudinal steel ratio, ρ
(%)
Shear span to
effective depth,
a/d
Shear span,
a (mm)
Variable considered
10A 105 200 0.75 2.50 425 LR, CS
S1 105 200 0.75 2.50 425 LR, CS
12A 105 200 1.08 1.00 169 SP, LR
12B 105 200 1.08 1.50 254 SP
12C 105 200 1.08 2.50 423 SP, LR, CS
12D 105 200 1.08 3.00 507 SP, LR
12E 105 200 1.08 2.50 423 CS
12F 105 113 1.91 2.89 237 HT
16A 105 200 1.92 1.00 167 SP, LR
16B 105 200 1.92 1.50 251 SP, LR
16C 105 200 1.92 2.50 418 SP, LR, CS
16D 105 200 1.92 3.00 501 SP, LR
16E 105 200 1.92 2.50 418 LR, HT
20A 105 200 2.99 1.00 165 SP,LR
20B 105 200 2.99 1.50 248 SP, LR
20C 105 200 2.99 2.50 413 SP, LR, CS
20D 105 200 2.99 3.00 495 SP, LR
20E 105 200 2.99 2.50 413 LR, CS
AD1 105 200 1.92 1.00 167 SP, LR
AD2 105 200 1.92 2.50 418 SP, LR
F1 105 200 1.92 2.50 418 SP, LR, CS
F2 105 200 1.92 2.50 418 CS
H2 105 313 1.92 2.36 656 HT
S2 105 200 1.92 2.50 418 CS
Table 3.4 Details of NWC beam specimens cast without shear reinforcement
Specimen No.
Section width, b (mm)
Overall section depth, h (mm)
Longitudinal steel ratio, ρ
(%)
Shear span to
effective depth,
a/d
Shear span, a (mm)
To be compared with OPSC specimen
NWC1 105 200 1.91 1 167 AD1
NWC2 105 200 1.91 2.5 418 F1
NWC3 105 200 1.91 2.5 418 16C
NWC4 105 200 2.99 2.5 413 20E
NWC5 105 113 1.90 2.5 237 12F
92
Table 3.5 Details of OPSC beam specimens cast with shear reinforcement
Specimen no.
Section width, b (mm)
Overall section
depth, h (mm)
No. of shear reinforcement within shear
span
Shear reinforcement
spacing, s (mm)
Shear span,
a (mm)
Variable considered
3A 105 200 3 120 240 CG, SR
3B 105 200 3 120 240 CG, SR
3C 105 200 3 120 240 CG, SR
4A 105 200 4 80 240 CG, SR
4B 105 200 4 80 240 CG, SR, PL
4C 105 200 4 80 240 CG, SR
5A 105 200 5 60 240 CG, SR
5B 105 200 5 60 240 CG, SR
5C 105 200 5 60 240 CG, SR
4D 105 200 6 80 200 PL
4E 105 200 6 80 160 PL
Table 3.6 Details of NWC beam specimens cast with shear reinforcement
Specimen no.
Overall section width (mm)
Overall section
depth, h (mm)
No. of shear reinforcement within shear
span
Shear reinforcement
spacing, s (mm)
Shear span, a (mm)
To be compared with OPSC specimen
NWCA 150 200 3 120 240 3B
NWCB 150 200 4 80 240 4B
NWCC 150 200 5 60 240 5B
NWCD 150 200 4 80 160 4E
NWCE 150 200 4 80 240 4C
93
Table 3.7 Curing and concrete strength for OPSC beam specimens cast without shear reinforcement
OPSC beam Specimen No.
Mix design
w/c ratio
Curing duration (days)
Average cube compressive strength,
fcu (N/mm2)
10A B 0.37 28 30.05
S1 C 0.34 28 34.82
12A B 0.37 32 31.03
12B B 0.37 32 31.03
12C B 0.37 32 31.03
12D B 0.37 32 31.03
12E C 0.34 55 39.20
12F B 0.37 38 32.46
16A A 0.44 30 26.14
16B A 0.44 30 26.14
16C A 0.44 30 26.14
16D A 0.44 30 26.14
16E B 0.37 32 32.46
20A A 0.44 28 24.23
20B A 0.44 28 24.23
20C A 0.44 28 24.23
20D A 0.44 28 24.23
20E A 0.44 40 28.00
AD1 B 0.37 32 32.00
AD2 B 0.37 32 32.00
F1 B 0.37 32 32.00
F2 C 0.34 60 40.10
H2 B 0.37 37 32.46
S2 C 0.34 30 35.70
Table 3.8 Curing and concrete strength for NWC beam specimens cast without shear reinforcement
NWC beam Specimen no.
Mix design
w/c ratio
Curing duration (days)
Average cube compressive strength, fcu
(N/mm2)
NWC1 N 0.43 11 33.00
NWC2 N 0.43 11 33.00
NWC3 N 0.43 7 29.00
NWC4 N 0.43 7 29.00
NWC5 N 0.43 11 33.00
94
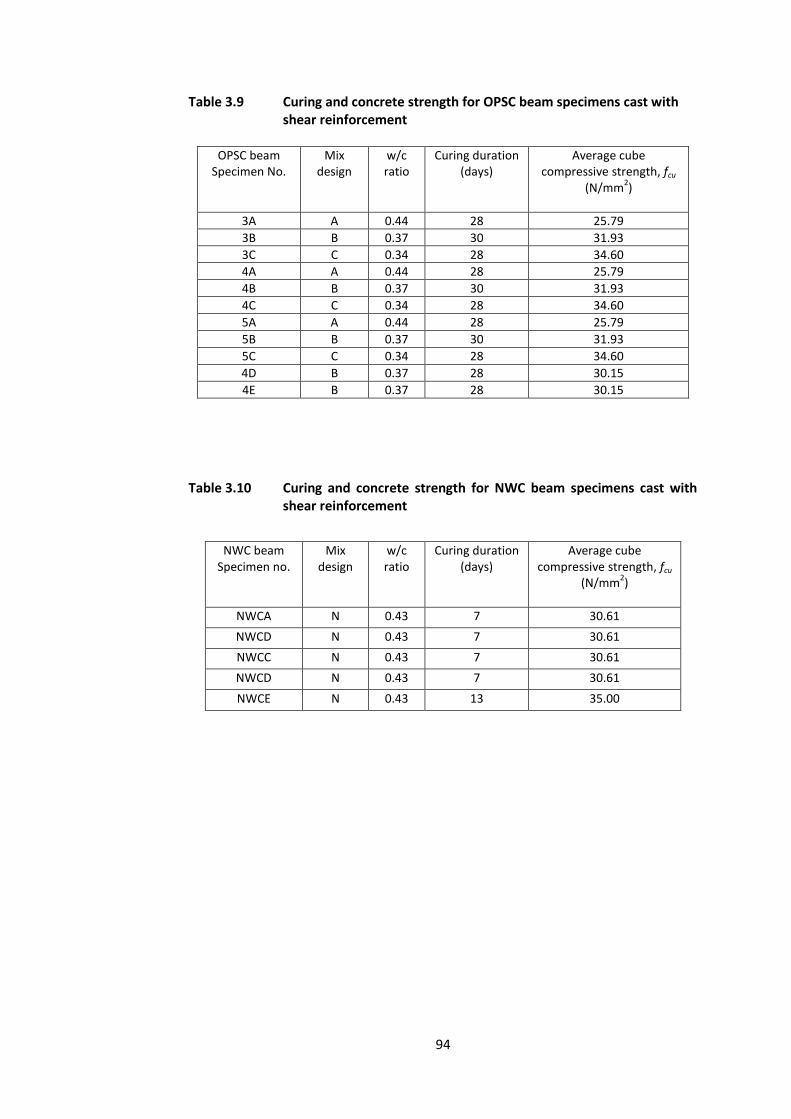
Table 3.9 Curing and concrete strength for OPSC beam specimens cast with shear reinforcement
OPSC beam
Specimen No.
Mix design
w/c ratio
Curing duration (days)
Average cube compressive strength, fcu
(N/mm2)
3A A 0.44 28 25.79
3B B 0.37 30 31.93
3C C 0.34 28 34.60
4A A 0.44 28 25.79
4B B 0.37 30 31.93
4C C 0.34 28 34.60
5A A 0.44 28 25.79
5B B 0.37 30 31.93
5C C 0.34 28 34.60
4D B 0.37 28 30.15
4E B 0.37 28 30.15
Table 3.10 Curing and concrete strength for NWC beam specimens cast with shear reinforcement
NWC beam Specimen no.
Mix design
w/c ratio
Curing duration (days)
Average cube compressive strength, fcu
(N/mm2)
NWCA N 0.43 7 30.61
NWCD N 0.43 7 30.61
NWCC N 0.43 7 30.61
NWCD N 0.43 7 30.61
NWCE N 0.43 13 35.00
95
Figure 3.1 Grading curve of OPS Aggregate for OPSC beam specimens.
Figure 3.2 Grading curves of Fine Aggregate for OPSC and NWC beam
specimens.
96
Figure 3.3 Grading curve of gravel Aggregate for NWC beam specimens.
Figure 3.4 General arrangements of beams without shear reinforcement.
97
Figure 3.5 General arrangements of OPSC (3A, 3B, 3C) and NWC (NWCA) beams reinforced with 2T14 (compression), 2T16 (tension), and R6@120 mm (shear reinforcement).
Figure 3.6 General arrangements of OPSC (4A, 4B, 4C, 4D, 4E) and NWC (NWCB, NWCD, NWCE) beams reinforced with 2T14 (compression), 2T16 (tension), and R6@80 mm (shear reinforcement).
98
Figure 3.7 General arrangements of OPSC (5A, 5B, 5C) and NWC (NWCC) beams reinforced with 2T(14+20) (compression), 2T(16+20) (tension), and R6@60 mm (shear reinforcement).
99
All dimensions in mm
Figure 3.8 General arrangements of steel mould for casting of specimens having overall section depth ≤ 200 mm.
100
All dimensions in mm
Figure 3.9 Bolting details of steel moulds shown in Figure 3.8.
101
All dimensions in mm
Figure 3.10 General arrangements of wooden mould for casting of specimens having overall section depth > 200 mm.
102
All dimensions in mm
Figure 3.11 Bolting details of wooden moulds shown in Figure 3.10.
103
Figure 3.12 Test setup for OPSC and NWC beam specimens.
Figure 3.13 Loading rig for OPSC and NWC beam specimens.
Deflection Gauge
104
Figure 3.14 Loading arrangement for all beam specimens cast without shear reinforcement.
Figure 3.15 Location of shear reinforcement were marked to ensure for correct positioning of loads and supports.
105
Figure 3.16 Loading arrangements for OPSC and NWC beam specimens cast with shear reinforcement spaced at 120 mm intervals and loaded with 240 mm shear span.
Figure 3.17 Loading arrangements for OPSC and NWC beam specimens cast with shear reinforcement spaced at 80 mm intervals and loaded with 240 mm shear span.
106
Figure 3.18 Loading arrangements for OPSC and NWC beam specimens cast with shear reinforcement spaced at 60 mm intervals and loaded with 240 mm shear span.
Figure 3.19 Loading arrangements for OPSC beam specimen cast with shear reinforcement spaced at 80 mm and loaded with 200 mm shear span.
107
Figure 3.20 Loading arrangements for OPSC and NWC beam specimens cast with shear reinforcement spaced at 80 mm intervals and loaded with 160 mm shear span.
Figure 3.21 Position of mechanical dial gauge for measurements of mid span deflection.
108
Chapter 4
Failure Mechanisms and Test Results
4.1 Introduction
Full details of beam specimens cast in this research and their test setup have been
described in Chapter 3. In this chapter, the observations made during tests, the
measured deflections, the failure mechanisms, and the ultimate failure loads of all
specimens are reported and discussed. In addition, the outcomes of comparative
studies carried out to investigate the observed variations between the Oil Palm
kernel Shell Concrete (OPSC) specimens and the Normal Weight Concrete (NWC)
specimens with regards to variables considered are also presented in this chapter.
In this research, a total of forty five beam specimens were tested, of which, thirty five
were cast from Oil Palm kernel Shell Concrete (OPSC) and ten were cast from Normal
Weight Concrete (NWC). Among the OPSC beams, twenty four were cast without
shear reinforcement, while the remaining eleven were cast with shear
reinforcement. For NWC beams, five were cast without shear reinforcement, while
the remaining five were cast with shear reinforcement.
In general, two distinct failure mechanisms were observed from tests on specimens
cast without shear reinforcement, that is, for specimens loaded with span to depth
ratio, a/d < 2.5, it is observed to fail in shear compression failure mechanism. Whilst
for specimens loaded with span to depth ratio, a/d ≥ 2.5, it is observed to fail in
diagonal tension failure mechanism. However, for specimens cast with shear
109
reinforcement, all specimens were observed to fail in diagonal tension failure
mechanism.
4.2 Specimens cast without shear reinforcement
A total number of twenty four OPSC beam specimens and five NWC beam specimens
cast without shear reinforcement were tested. These specimens were loaded with a
pair of concentrated loads on top of the beam at designated distances, a, away from
the supports, as shown in Figure 3.14.
The observations made during tests, in regard to failure mechanisms and crack
patterns, are presented from Figure 4.1 to Figure 4.24 and Figure 4.25 to Figure 4.29,
for OPSC beam specimens and NWC beam specimens, respectively. The failure loads
of OPSC and NWC beam specimens are presented in Table 4.1 and 4.2, respectively.
Detailed discussions on these observations are presented in Section 4.2.1 to 4.2.3, as
follows.
4.2.1 Overall behaviour of OPSC beams and NWC beams specimens
It is observed from tests that the entire twenty-nine beam specimens cast without
shear reinforcement failed in shear mode of failure at the vicinity of shear span with
the mid span of the beam displaced vertically by the loads applied. Three types of
shear failure were observed: shear compression failure for a/d < 2.5, diagonal tension
failure and shear failure, respectively, for a/d ≥ 2.5. The systematically details
observations from the flexural cracks initiation until the occurrence of the shear
failure for the beams without shear reinforcement are explained herein.
110
Except for specimens 20A and 20B (see Table 4.3), it is observed that the formations
of flexural cracks occurred prior to the shear cracks. The flexural cracks initiated from
the mid-span bottom fibre, coinciding with the maximum tensile stress, and
propagate through the section of the specimens as the applied load increases. The
flexural cracks were noted to occur at 18% to 78% of the ultimate failure loads for
OPSC beam specimens (see Table 4.3), and at 20% to 62% for NWC beam specimens
(see Table 4.4). However, inferred from load deflection curves, the cracking load are
noted to occur at 10% to 56% of the ultimate loads for OPSC beam specimens (see
Table 4.3) and at 12% to 59% of the ultimate loads for NWC beam specimens (see
Table 4.4). The load-deflection curves are presented from Figure 4.30 to Figure 4.34
and Figure 4.35 for OPSC beams and NWC beams, respectively. It is believed that the
discrepancies noted between the observed and the inferred cracking loads were due
to the formation of flexural micro-cracks that could not have been detected by the
naked eye but can be clearly observed via the change of inclination angle on the load
deflection curves.
Further analysis on the test results revealed that the formations of flexural cracks did
not take place under loads having similar percentages to their ultimate failure loads.
These inconsistencies derived from the fact that the percentages for formation of
flexural cracks were determined with respect to the ultimate shear failure loads (Vult)
instead of their flexural failure loads. That is, specimens failed in shear at higher
ultimate failure loads may in fact have been casted with high flexural resistance (such
as specimens 20A, 20B, 20C), thus, appeared to have their flexural cracks formed at
loads that are closer to their ultimate shear failure loads, hence, resulting the high
percentages. In contrast, specimens failed in shear at lower ultimate failure loads
were in fact casted with lower flexural resistance (such as Specimens 12A, 12B and
111
12C), thus, appeared to have their flexural cracks formed at loads that are further
away from the ultimate shear failure loads, hence, resulting the low percentages.
The implication is that the formations of flexural cracks are in fact independent to the
formation of shear failure mechanism.
Upon further loading, the formations of shear cracks were observed to have initiated
at the supports at 48% to 97% of the ultimate failure loads for OPSC beam specimens
(see Table 4.3), and at 60% to 75% of the ultimate failure loads for NWC beam
specimens (see Table 4.4). These inconsistencies deduced from the fact that
specimens failed in shear at higher percentages of the ultimate failure loads were, in
fact, loaded with high shear span to depth, a/d, ratio (such as Specimens 12C, 12D,
16C and 16D), thus, appeared to have their shear cracks formed at loads that are
closer to their ultimate shear failure loads. In contrast, specimens that failed in shear
at lower ultimate failure loads were loaded with low shear span to depth, a/d, ratio
(such as specimens 12A, 12B, 16A and 16B), thus, appeared to have their shear cracks
formed at loads that are far from the ultimate shear failure loads. The implication is
that the formation of shear cracks are dependent on the loading position, that is
beams loaded with high shear span to depth, a/d, ratio would have their shear cracks
formed at loads further from their ultimate as compared to those loaded with a
lower span to depth ratio. After formation of the initial shear cracks at the supports,
these inclining shear cracks were observed to propagate towards the loading
positions through the specimen’s section depth as the applied load increases, upon
further increases in the applied load, the formation of shear failure were observed
with a sudden increase in the width of the shear cracks.
Further comparisons of flexural and shear cracks between OPSC and NWC beam
specimens with similar variables (span to depth ratio (a/d), longitudinal steel ratio
112
(ρ), concrete strength (fcu) and overall section depth (h) ), such as OPSC specimen
AD1 and NWC specimen NWC1 (see Figure 4.19 and Figure 4.25, respectively), and
OPSC specimen F1 and NWC specimen NWC2 (see Figure 4.21 and Figure 4.26,
respectively) shown that the amount of flexural and shear cracks formed in OPSC
specimens were greater than NWC specimens, which it is observed during testing
that the visibility of flexural and shear cracks for OPSC beam specimens were more
evident, hence the shear failure indications in OPSC beam specimens are more
apparent with ample warning to be given before failure occurred.
In general, for specimens loaded with span to depth ratio, a/d < 2.5, it was noted that
shear compression failure occurred by crushing of the concrete at the compression
zone and the ultimate shear failure loads are higher than those specimens loaded
with span to depth ratio, a/d ≥ 2.5. This have been expected that the ultimate loads
are higher for a/d < 2.5 due to the fact that the loads from the loading position were
able to be transferred to the support reaction through the shorter shear span
distance, where diagonal shear cracks were observed to propagate towards the
loading position, prior to the ultimate occurrence of shear compression failure. It is
observed that the crushing of concrete at the compression zone were less evident for
specimens casted with lower percentage of longitudinal steel ratio (ρ) of less than
2.99% (such as Specimen 12A, 12B, 16A, 16B and NWC1) compared to specimens
casted with longitudinal steel ratio, ρ = 2.99% (Specimen 20A and 20B). For beams
casted with lower longitudinal steel ratio, the crushing of concrete at the
compression zone were less pronounced as the mid span of the longitudinal steel
reinforcement would have bent alongside with the vertical displacement of the
specimen as the load was increased, resulting in a limited concrete crushing at the
beam compression zone. In contrast, for specimens casted with higher longitudinal
113
steel ratio, ρ = 2.99%, specifically Specimen 20A and 20B (see Figure 4.14 and Figure
4.15, respectively) concrete crushing at the beam compression zone was more
apparent as the longitudinal steel reinforcement in each specimen would have
remained rigid due to the higher beam stiffness provided, hence, the bending of
longitudinal steel reinforcement were limited with the increment of applied loads.
For beam specimens loaded with span to depth ratio, a/d ≥ 2.5, it is observed that
shear failure took place at the shear span except for OPSC beam specimens cast with
ρ = 0.75% (Specimen 10A and S1 in Figure 4.1 and Figure 4.2, respectively), which
failed in diagonal tension mode. During testing, it is observed that for beams, which
failed in diagonal tension mode (Specimen 10A and S1), the diagonal cracks were
originated from the flexural cracks formed at the mid-span closest to the shear span,
and subsequently, developed into diagonal shear cracks, which propagated to the
loading position prior to diagonal tension failure. Whilst for beams that failed in
shear failure mode, it is observed during testing that the diagonal shear cracks were
initiated from the support reaction and propagated towards the loading position
prior to the shear failure.
The difference of failure mode observed for beams loaded with span to depth ratios,
a/d > 2.5 was due to the longitudinal steel ratio provided. For specimens casted with
lower longitudinal steel ratio, flexural cracks observed were more evident, hence
lower resistance against bending were provided by the lower beam stiffness of the
longitudinal steel reinforcement as bending of the beams were more significant
compared to specimens casted with higher longitudinal steel ratio. As the results, the
beams casted with lower longitudinal steel ratio were observed to fail in diagonal
tension failure mode instead of shear failure mode. The implication is that for beams
loaded with span to depth ratio, a/d > 2.5, the higher longitudinal steel ratio
114
provided increases the beam stiffness, which subsequently increased the resistance
against bending and hence, shear failure occurred.
Further, it is observed that for all beams loaded with span to depth ratio, a/d ≥ 2.5,
both the shear failure: diagonal tension failure and shear failure were abrupt and
explosive. In addition, it is observed that both types of failures also consist of beam
splitting, which horizontal splitting of concrete occurred due to dowel action
between the concrete and surface of longitudinal steel bar from the support reaction
to the shear span. Subsequently, the beam splitting propagated from the shear span
diagonally via the diagonal shear cracks to the loading position, where the concrete
beam were separated into two regions, which is observed in all specimens loaded
with a/d ≥ 2.5 (see Example Figure 4.1 for Specimen 10A, which failed in diagonal
tension failure and Figure 4.5 for Specimen 4.5, which failed in shear failure). After
shear failure, although splitting of the beam occurred, it is observed from all
specimens that the two regions of the beam remained intact as a beam due to the
presence of anchorage at bottom of both end of the beam, which would have
prevented the whole beam from splitting into two sections.
For OPSC specimens, two types of crack mechanisms were observed (see Figure 4.36
and 4.37) at the diagonal shear cracks: (1) crack sheared through the OPS aggregates
and (2) bond failure between cement paste and OPS aggregates in concrete (see
Figure 4.37 for illustrations). However, the occurrence of either one of these two
observed mechanisms depend on the natural alignment of OPS aggregates along
shear crack. The natural alignment of OPS aggregates was found to incline either
towards perpendicular or parallel axis of the diagonal shear crack. It was observed
that the OPS aggregates were sheared through by the crack when the alignment of
OPS aggregates inclined towards the perpendicular axis of the crack. Whilst the bond
115
failure between cement paste and OPS aggregates was observed when the OPS
aggregates inclined towards parallel axis of the diagonal shear cracks. Whilst for NWC
specimens, the crack mechanism was observed to shear through the cement paste
(See Figure 4.38) and in between the normal aggregates (see also Figure 4.60 for
illustration).
4.2.2 Central deflection
The central deflection of all beam specimens were recorded after every increment of
applied load. For every beam specimens cast without shear reinforcement, a graph of
load versus central deflection curve has been plotted and presented in Figure 4.31 to
Figure 4.34, and Figure 4.35, for OPSC beam specimens and NWC beam specimens,
respectively.
In general, these curves exhibit similar load deflection behaviour among the
specimens, that is, a linear elastic behaviour can be inferred up to approximately half
of the ultimate failure loads, and subsequently, the rate of increment in the applied
loads decreased until failure occurred. The increases in the rate of deflection were
due to the formation of flexural cracks at the mid-span bottom tension surface of the
beam specimens.
A comparison between the actual cracking loads inferred from the load-deflection
curves and the observed cracking loads are presented in Table 4.3 and Table 4.4 for
OPSC beam specimens and NWC beam specimens, respectively. From these
comparisons, it is observed that the inferred cracking loads were 4% to 25% and 3%
to 11% lower than the observed flexural cracking loads for OPSC beam specimens
and NWC beam specimens, respectively. It is believed that these discrepancies derive
116
from the fact that the early formation of the micro-cracks could not be detected by
the naked eye.
4.2.3 Ultimate Failure Loads
The ultimate failure loads of beam specimens were derived from the last recorded
loads applied to the specimens prior to failure. For beam specimens cast without
shear reinforcement, the ultimate shear failure loads of specimens cast from OPSC
and NWC are summarized and presented in Table 4.1 and 4.2, respectively. Among
the twenty-nine beam specimens, twenty four were casted from OPSC while the
remaining five were casted from NWC.
Among the twenty-four OPSC beam specimens, four variables were considered in the
tests (See Table 4.1): span to depth ratio (SP), longitudinal steel reinforcement ratio
(LR), concrete strength (CS) and overall section depth (HT). Of which, eighteen out of
the twenty four specimens derived with results that addresses for more than one
variables considered (see Table 4.1).
Whilst, among the five NWC beam specimens, four identical variables were
considered (See Table 4.2): span to depth ratio (SP), concrete strength (CS),
longitudinal steel reinforcement ratio (LR) and overall section depth (HT). These NWC
specimens were designed and tested to form the basis (control samples) from the
current research investigation.
In general, it is apparent that the load carrying capacities of both the OPSC beams
and NWC beams (cast without shear reinforcement) are influenced by the variables
considered. Details of the effects of variables and the comparisons of OPSC
117
specimens with control sample are described fully from Section 4.2.3.1 to Section
4.2.3.4.
4.2.3.1 Span to depth ratio
Among the twenty four OPSC beams casted without shear reinforcement, fifteen
beam specimens (see Table 4.1) were cast and tested to evaluate the effect of shear
span-depth ratio, a/d, with respect to the ultimate shear resistance. These fifteen
OPSC beam specimens have been further sub-categorised into: SP-LR12B, SP-LR16A,
SP-LR16B, and SP-LR20A; to take account for three longitudinal steel reinforcement
ratios and two range of concrete cube compressive strength (see Table 4.5). The
three longitudinal steel reinforcement ratios were: 1.08% (Category SP-LR12B),
1.92% (Category SP-LR16A and SP-LR16B) and 2.99% (Category SP-LR20A). Whilst the
two range of concrete cube compressive strength were: 24 N/mm2 to 26 N/mm2
(Category SP-LR16A and SP-LR20A) and 31 N/mm2 to 32 N/mm2 (Category SP-LR12B
and SP-LR16B).
In general, the observations made from tests indicate that the ultimate shear
resistance increases as the span to depth ratio (a/d) decreases (see Figure 4.38). Such
observations are to be expected, because as the shear span, a, reduces, the shear
inclination angle increases, which in turn, enhance the contribution of aggregate
interlocking towards the ultimate shear capacity, and as a result, a higher shear
resistance could be mobilised.
Comparisons with the NWC beam specimens reveal that the rate of increase in the
ultimate shear resistance of OPSC beam specimens as a result of the decreasing
shear span depth ratio, a/d, are observed to be less significant, as shown in Figure
118
4.39. That is, the shear resistance of NWC specimens (NWC2 to NWC1) increased by
100% as the span to depth ratio, a/d, reduces from 2.5 to 1.0, while the shear
resistance of OPSC specimens (F1 to AD1) increased only by 78% for the same
reduction in span depth ratio. Such discrepancy is believed to be attributed to the
smoother shear surface observed from the OPSC specimen (AD1) (see Figure 4.40
and 4.41), where a lower aggregate interlocking resistance could be mobilised.
However, observations made on specimens loaded with a/d = 2.5 revealed that
specimen cast with OPSC (F1) exhibited rougher shear surface than those cast with
NWC (NWC2) (see Figure 4.40 and 4.42). Although a rougher surface has been
observed in beams cast with OPSC, a lower shear resistance was observed (90% of
that observed in specimen cast with NWC-NWC2) (see Figure 4.39). It is believed that
the lower shear resistance found in OPSC beams is in fact attributed to the lower
aggregate strength found in Oil Palm Kernel Shell (OPSC), which in turn, provide a
lower aggregate interlocking capacity.
On the other hand, it was observed that for the same shear to depth ratio, a/d, the
ultimate failure load obtained by OPSC specimens casted with higher longitudinal
steel reinforcement ratio exhibited higher shear capacity (see Figure 4.39). This result
is as expected, because as the longitudinal steel reinforcement ratio increases, the
contribution of dowel shear capacity on the ultimate shear capacity of the OPSC
beams would have increases, and as a result, higher ultimate failure loads is
obtained.
119
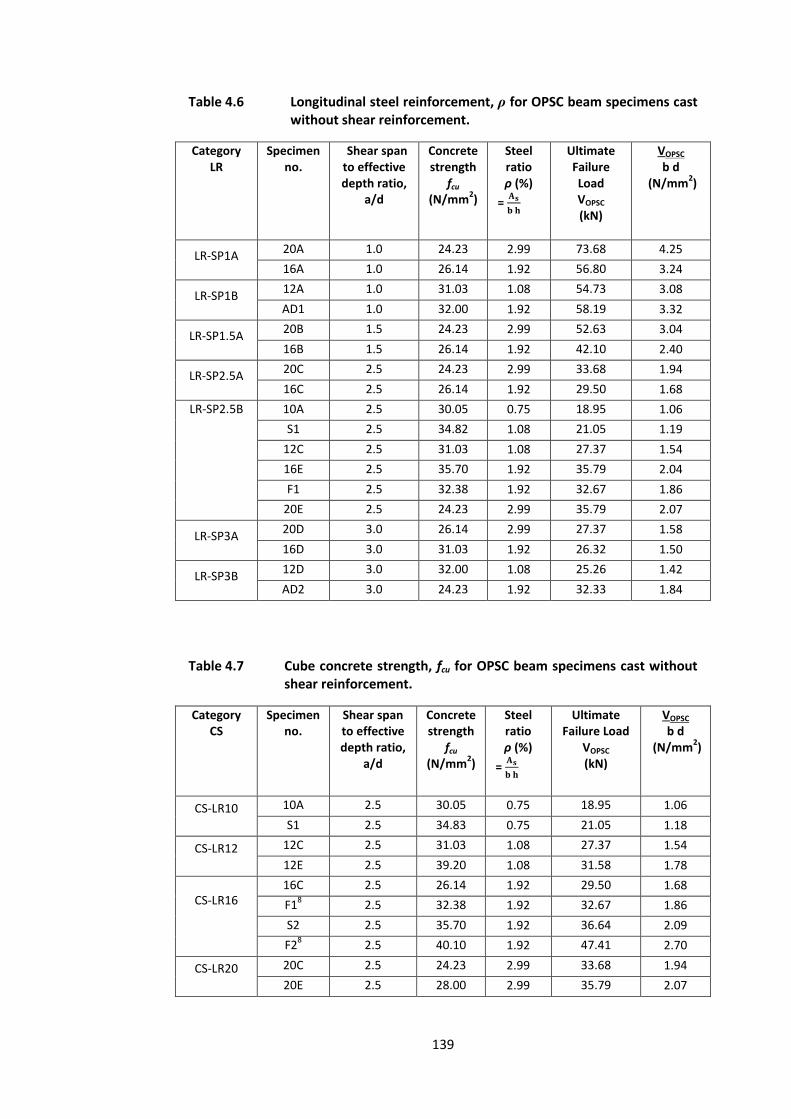
4.2.3.2 Longitudinal steel ratio
Eighteen OPSC beam specimens (see Table 4.6) were selected from the twenty four
OPSC beam specimens without shear reinforcement and are categorized under
Category LR to evaluate the effect of longitudinal steel ratio to the ultimate shear
resistance. These eighteen OPSC beam specimens have been further subcategorised
into: LR-SP1A, LR-SP1B, LR-SP1.5A, LR-SP2.5A, LR-SP2.5B, LR-SP3A and LR-SP3B; to
account for four span to depth ratios and two range of cube compressive strength.
The four shear span – depth ratios consist of a/d = 1 (Category LR-SP1A and LR-SP1B),
a/d = 1.5 (Category LR-SP1.5A), a/d = 2.5 (Category LR-SP2.5A and LR-SP2.5B) and a/d
= 3 (Category LR-SP3A and LR-SP3B). Whilst the two range of cube compressive
strength consists of 24 N/mm2 to 26 N/mm2 (Category LR-SP1A, LR-SP1.5A, LR-SP2.5A
and LR-SP3A) and 31 N/mm2 to 32 N/mm2 (Category LR-SP1B, LR-SP2.5B and LR-
SP3B).
Comparing the test results of ultimate failure load with respect to the variable of
longitudinal steel reinforcement ratio shown in Table 4.6, it is evident that the
ultimate shear resistance increases with the increment of longitudinal steel
reinforcement ratios (see also Figure 4.43). It is generally believed that when the
longitudinal steel reinforcement ratios provided for the beams decreases, the shear
force carried by the dowel action of longitudinal steel reinforcement decreases [27].
Hence, wider shear crack widths is observed on the beams casted with lower
longitudinal steel reinforcement ratio, which is shown on the OPSC specimen 12C
shown in Figure 4.6, compared with the beam casted with higher longitudinal steel
reinforcement ratio (OPSC specimen 20C shown in Figure 4.16). Subsequently, the
wider shear crack widths would reduce the aggregate interlock capacity [27], and, as
a result, the ultimate failure loads obtained are lower. In contrast, OPSC beams
120
casted with higher longitudinal steel reinforcement ratio would lead to increment of
dowel shear capacity, thus, higher aggregate interlock capacity and results in higher
ultimate load obtained.
In comparison to the NWC beam specimens, it was observed from tests that the
ultimate failure load obtained for OPSC beams are lower (See Figure 4.44), which the
ultimate failure load obtained for Specimen F1 and 20E is 10% and 47% lower with
respect to the NWC beam specimen NWC3 and NWC4 for longitudinal steel ratio of
1.92% and 2.99%. For NWC beam specimens casted with lower and higher
longitudinal steel reinforcement (NWC3 and NWC4), it is believed that higher
aggregate impact strength is provided by the gravel aggregates (see Table 2.1), which
observations from the sheared plane of diagonal shear cracks show that the gravel
aggregates remain rigid. This would allow sufficient dowel action of longitudinal steel
reinforcement to be mobilised and subsequently, leads to the increment of
aggregate interlock capacity in NWC beams. As a result, higher ultimate failure load is
obtained by NWC beams compared to OPSC beams. In contrast, lower OPS
aggregates impact strength are provided for OPSC beam specimens, which the OPS
aggregates are observed to be easily fractured in concrete. Therefore, this would
lead to lack of dowel action of the longitudinal steel reinforcement to be mobilised
and also leads to lower aggregate interlocking and as a result, lower ultimate failure
load is obtained by OPSC beams than NWC beams.
Further comparisons with the NWC beam specimens indicate that the increment in
the ultimate shear resistance of OPSC beam specimens as a result of the reduction of
longitudinal steel reinforcement, ρ, are less significant (see Figure 4.44). That is, a
comparisons of OPSC beam specimens (Specimen 16C and 20E) with NWC beam
specimens (Specimen NWC3 and NWC4), show that the shear resistance of NWC
121
specimens increased by 56% as longitudinal steel ratio increased from 1.92% to
2.99%, while the shear resistance of OPSC specimens increased only by 21%. It is
believed that for NWC beams, higher increment rate of dowel action capacity and
aggregate interlock capacity are provided by the contribution of rigid behaviour of
gravel aggregates compared to easily fractured behaviour of OPS aggregates in OPSC
beams. As a result, the rate of ultimate shear strength increment obtained from the
tests for NWC beams is higher than OPSC beams.
4.2.3.3 Concrete strength
From the twenty four OPSC beam specimens without shear reinforcement, ten beam
specimens (see Table 4.7) were selected and are categorized under Category CS to
evaluate the effect of concrete strength to the ultimate shear resistance of OPSC
beams. These ten OPSC beam specimens have been further subcategorised into: CS-
LR10, CS-LR12, CS-LR16 and CS-LR20; to account for four longitudinal reinforcement
ratios. The four longitudinal reinforcement ratios are 0.75% (Category CS-LR10),
1.08% (CS-LR12), 1.92% (CS-LR16) and 2.99% (CS-LR20).
In general, from test results of the selected ten OPSC beam specimens with
parameter of concrete strength (see last column in Table 4.7), it is apparent that as
the concrete strength, fcu, increases, the ultimate shear resistance increases (see
Figure 4.45). For increment of concrete strength in a beam, it is generally believed
that the tensile strength of concrete would increases, in which, bond within the
cement paste and interlocking between the cement paste and aggregates would
grow stronger. Hence, this would delay the rupture of concrete and as a result, the
ultimate failure load increases with the concrete strength.
122
In addition, in view of shear transfer mechanism, the concrete strength affects shear
strength because as concrete strength increases, the dowel action capacity would
increases [27]. Subsequently, this would lead to the smaller shear crack widths as
observed in OPSC beam specimens (for example specimen 12E shown in Figure 4.7)
compared with OPSC beams tested at lower concrete strength (for example OPSC
specimen 12C shown in Figure 4.5). Consequently, the smaller shear crack widths
would have increases the aggregate interlock capacity and compression zone
capacity. As a result, higher ultimate failure load is required to fail the OPSC beam,
which was tested at higher concrete strength.
Further comparisons with the NWC beam specimens reveal that for NWC beam
specimens, the ultimate shear strength obtained with respect to concrete strength
was higher than the OSPC beams with only a slightly lower rate of shear strength
increment observed compared to the OPSC beam specimens (see Figure 4.46). That
is, from comparing the OPSC beams (Specimens F1 and 16C) to NWC beams
(Specimens NWC2 and NWC3), it was revealed that the shear resistance of NWC
specimen increased 6% as the concrete strength increased from 29 N/mm2 to 33
N/mm2, while the shear resistance of OPSC specimen increased 10% as the concrete
strength increased from 26.14 N/mm2 to 32 N/mm2.
For OPSC specimens (Specimen 16C and F1), the lower shear strength achieved is
believed due to the lower aggregate strength provided by the OPS aggregates (see
Table 2.1) compared to gravel aggregates in NWC specimens. Hence, this led to lower
aggregate interlocking capacity and resulted in lower shear resistance. Whilst for
NWC beams, the rigid behaviour of gravel aggregates would have provided higher
aggregate interlocking capacity and thus, higher shear resistance was mobilised.
123
4.2.3.4 Section depth
Among the twenty four OPSC beam specimens, three beam specimens (see Table
4.8) were cast and tested (Category HT) to evaluate the effect of overall section
depth, h, with respect to the ultimate shear resistance of OPSC beams.
In general, the observations made from tests demonstrate that the ultimate shear
resistance increases as the section depth increases (see Figure 4.47). Such
observations are to be expected because the area of shear interface would be
increases as the section depth increases, higher shear stress would be transferred by
the aggregates across the shear cracks, and as a result, a higher ultimate shear
strength could be mobilised against shear failure.
However, when the ultimate shear stress is to be considered, it is observed that the
ultimate shear stress of OPSC beams decreases as the section depth increases (see
Figure 4.48). Such observations would be expected due to the fact that size effects
occur in shear mechanism of OPSC specimens (See also Section 2.3).
Comparison with test results of NWC beams indicates less significant increase in the
attainment of the ultimate shear resistance of OPSC beam specimens as the section
depth increases (see Figure 4.49). That is, the ultimate shear resistance of NWC
specimens (NWC5 to NWC2) increased by 42% as the overall section depth increases
from 113 mm to 200 mm, while the shear resistance of OPSC specimens (12F to F1)
increased only by 24% for the same increment of overall section depth. Such
discrepancy is believed to be attributed to the lower aggregate strength found in Oil
Palm kernel Shell (OPS) with respect to that in the normal aggregates. As a result, a
124
lower aggregate interlocking capacity could be mobilised, hence, resulting in a lower
ultimate shear resistance.
4.3 Specimens cast with shear reinforcement
A total of eleven OPSC beam specimens and five NWC beam specimens cast with
shear reinforcement were tested. These specimens were loaded with a pair of
concentrated loads on top of the beam at designated distance(s), a, away from the
supports, as shown in Figure 3.16 to 3.20 .
The observations made from tests, failure mechanisms and crack patterns, are
presented from Figure 4.50 to Figure 4.60 and Figure 4.61 to Figure 4.65, for OPSC
beam specimens and NWC beam specimens respectively. The failure loads of OPSC
and NWC beam specimens are presented in Table 4.9 and Table 4.10 respectively.
Detailed discussions on these observations are presented in the Sections 4.3.1 to
4.3.3 as follow.
4.3.1 Overall failure behaviour of OPSC and NWC beam specimens
It is observed from tests that, all the sixteen beam specimens cast with shear
reinforcement failed in mode of shear compression failure, which is evident and
foreseeable during failure. The systematically details of observations for the beams
with shear reinforcement from the flexural cracks initiation until the occurrence of
the shear failure are explained herein.
For all beam specimens, the formation of flexural cracks occurred prior to formation
of shear cracks during testing, which is observed to initiate from mid-span bottom
125
fibre of the specimens, this has been as expected, to coincide with the maximum
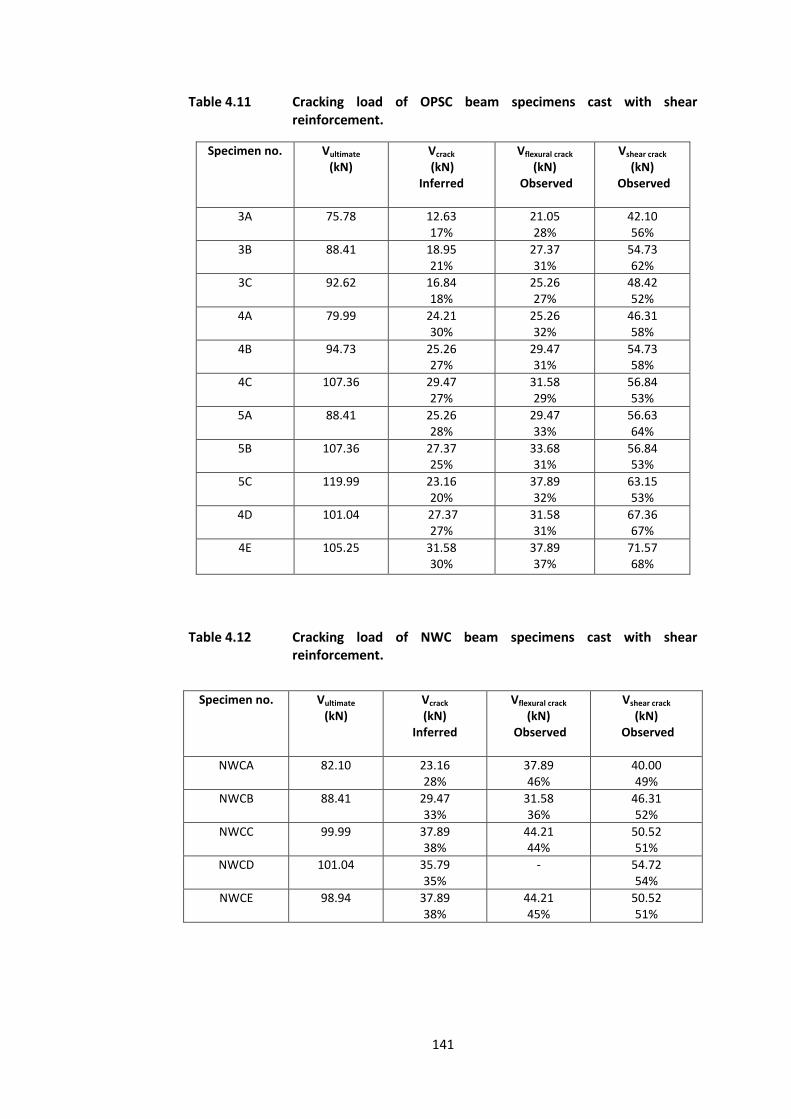
tensile stress. These appearances of flexural cracks were first noted from 28% to 37%
of the ultimate failure loads for OPSC beam specimens (see Table 4.11), and from
36% to 46% for NWC beam specimens (see Table 4.12). The load-deflection curves
are presented from Figure 4.66 to Figure 4.68 for OPSC beams and Figure 4.69 for
NWC beams. However, it was observed that the inferred cracking load deflection
curves occurred from 17% to 30% of the ultimate loads for OPSC beam specimens
(see Table 4.11) and from 28% to 38% of the ultimate loads for NWC beam
specimens (see Table 4.12). It is believed that the discrepancies noted between the
observed and the inferred cracking loads were due to the formation of micro-cracks,
which could not have been detected by the naked eye but can be visibly observed
through the change of inclination angle on the load deflection curves.
Further analysis on the test results revealed that the formations of flexural cracks did
not occur under loads having similar percentages to their ultimate failure loads.
These discrepancies derived from the fact that the percentages for formation of
flexural cracks were determined with respect to the ultimate shear failure loads (Vult)
instead of their flexural failure loads. That is, specimens failed in shear at higher
ultimate failure loads have been casted with high flexural resistances (such as
Specimens 5A, 5B, 5C), thus, appeared to have their flexural cracks formed at loads
that are close to their ultimate shear failure loads, hence resulted in the high
percentages. On the other hand, specimens failed in shear at lower ultimate failure
loads have been casted with lower flexural resistance (such as specimens 3A, 3B and
3C), hence, appeared to have their flexural cracks formed at loads that are further
away from the ultimate shear failure loads, hence resulting in the low percentages.
126
The implication is that the formations of flexural cracks are in fact independent to the
formation of shear failure mechanism.
As the applied loads were further increased, the formation of shear cracks were
observed to have appeared at the neutral axis of shear span vicinity, where shear
reinforcement are provided. The shear cracks were observed to occur from 53% to
68% of the ultimate failure loads for OPSC beam specimens (see Table 4.11), and
from 49% to 54% of the ultimate failure loads for NWC beam specimens (see Table
4.12). These inconsistencies deduced from the fact that, specimens which failed in
shear at higher ultimate failure loads were loaded with span distance closer to the
supports (such as specimens 4D, 4E, and NWCD), thus, the formation of shear cracks
were observed to appear at loads that are close to their ultimate shear failure loads.
On the other hand, specimens failed in shear at lower ultimate failure loads were
loaded with span distances further from the supports (such as Specimens 4A, 4B, 4C,
3A, 3B, 3C, 5A, 5B, 5C, NWCA, NWCB, NWCC, and NWCE), therefore, the formation of
shear cracks were observed to appear at loads that are far from their ultimate shear
failure loads. The inference is that the formations of shear cracks are in fact
subjected to the loading position, where higher percentage of shear cracks formation
were observed in beams tested with low a/d ratio compared to high a/d ratio. After
the formation of initial shear cracks at neutral axis section of the shear span vicinity,
it was observed that the diagonal shear cracks propagated diagonally towards the
loading positions and supports, respectively, which was as expected, to coincide with
the maximum shear stresses where shear compression finally took place. It was
observed that concrete crushes at the compression region of the beam where
loading was applied. All specimens were observed to remain intact even after failure
as the inclusion of shear reinforcement in the specimens would have formed a cage
127
with the presence of anchorage at both end of the beam, hence, keeping the
specimens to be intact (see Figure 4.50 to Figure 4.65).
In view of crack mechanism, beams with shear reinforcements exhibit similar
observations to those of beams without shear reinforcement (See Section 4.2.1). For
OPSC specimens with shear reinforcement, two types of crack mechanisms were
observed (see Figure 4.70 and 4.71) at the diagonal shear cracks: (1) cracks sheared
through the OPS aggregates and (2) bond failure between cement paste and OPS
aggregates in concrete (see Figure 4.37 for illustrations). Either one of these two
cracking mechanisms observed from OPSC specimens depend on the natural
alignment of OPS aggregates along shear cracks: (1) crack sheared through the OPS
aggregates when OPS is inclined perpendicular to the diagonal shear crack and (2)
bond failure between cement paste and OPS aggregates in concrete when OPS is
inclined parallel to the diagonal shear cracks, as mentioned in Section 4.2.1 (See also
Figure 4.37 for illustrations). Whilst for NWC specimens, the crack mechanism
occurred through the cement paste (See Figure 4.70 and 4.71), which the shear
cracks was observed to occur in between the normal aggregates (see also Figure 4.70
and 4.71).
4.3.2 Central deflection
The central deflection of all beam specimens were recorded after every increment of
applied load. For every beam specimen cast with shear reinforcement, the load-
deflection curves are plotted and presented in Figure 4.66 to Figure 4.68, and Figure
4.69, for OPSC beam specimens and NWC beam specimens, respectively.
128
In general, the curves exhibit similar load deflection behaviour among the specimens,
that is, a linear elastic behaviour up to approximately half of the ultimate failure
loads, and subsequently, the rate of increment in the applied loads decreases until
failure occurs. The increases in the rate of deflection were due to the formation of
flexural cracks at the mid-span bottom tension surface of the beam specimens.
A comparison between the actual cracking loads inferred from the load-deflection
curves and the observed cracking loads are presented in Table 4.11 and Table 4.12
for OPSC beam specimens and NWC beam specimens, respectively. From these
comparisons, it is observed that the inferred cracking loads were 2% to 12% and 3%
to 18% lower than the observed flexural cracking loads for OPSC beam specimens
and NWC beam specimens, respectively. It is believed that these discrepancies
between the observed and the inferred cracking loads were due to the formation of
flexural micro-cracks that could not have been detected by the naked eye but can be
clearly observed via the change of inclination angle on the load deflection curves.
4.3.3 Ultimate Failure Loads
The ultimate failure loads of beam specimens were derived from the last recorded
loads prior to failure. For beam specimens cast with shear reinforcement, the
ultimate failure loads of specimens cast from OPSC and NWC are summarized and
presented in Table 4.9 and Table 4.10, respectively. Among the sixteen beam
specimens, eleven were casted from Oil Palm kernel Shell (OPSC) while the remaining
five were casted from Normal aggregate Concrete (NWC).
Among the eleven OPSC beam specimens, three variables were considered in the
tests (see Table 4.9); shear reinforcement spacing (SR), inclination angle of shear
129
cracks (PL) and concrete strength (CG). Of which, nine of the eleven OPSC beam
specimens derived with results that addresses for more than one variables
considered (see Table 4.9).
On the other hand, three identical variables were also considered among the five
Table 4.2 Test results of NWC beams cast without shear reinforcement.
Specimen No.
Section width
b (mm)
Overall section depth
h (mm)
Shear span to
effective depth Ratio a/d
Cube compressive
strength fcu (N/mm
2)
Steel ratio ρ (%)
=
NWC Ultimate Failure Load VNWC
(kN)
Compared
with
OPSC
specimen
Variable
considered
NWC1 105 200 1 33.00 1.92 71.57 AD1
SP
NWC2 105 200 2.5 33.00 1.92 35.79 F1
SP, CS, HT
NWC3 105 200 2.5 29.00 1.92 33.69 16C LR, CS
NWC4 105 200 2.5 29.00 2.99 52.63 20E LR
NWC5 105 113 2.5 33.00 1.91 25.26 12F HT
137
Table 4.3 Cracking load of OPSC beam specimens cast without shear reinforcement.
Specimen No.
Vultimate (kN)
Vcrack
(kN)
Inferred
Vflexural crack
(kN)
Observed
Vshear crack (kN)
Observed
10A 18.95 2.11 11%
6.32 33%
10.53 56%
S1 21.05 2.11 10%
4.21 20%
12.63 60%
12A 54.73 10.53 19%
16.84 31%
33.68 62%
12B 40.00 6.32 16%
12.63 32%
31.58 79%
12C 27.37 4.21 15%
8.42 31%
5.26 92%
12D 25.26 10.53 42%
16.84 67%
23.16 92%
12E 31.58 8.42 27%
10.53 33%
25.26 80%
12F 26.31 10.53 40%
11.58 44%
12.63 48%
16A 56.80 10.53 19%
14.74 26%
35.77 63%
16B 42.10 18.95 45%
25.25 60%
33.68 80%
16C 29.50 6.32 21%
8.42 29%
21.05 71%
16D 26.32 6.32 24%
8.42 32%
25.26 97%
16E 35.79 8.42 24%
10.53 29%
31.58 88%
20A 61.05 21.05 35%
- 48.15 79%
20B 52.63 27.37 52%
40.00 76%
31.58 60%
20C 33.68 4.21 13%
12.63 38%
27.37 81%
20D 27.37 6.32 23%
12.63 46%
25.26 92%
20E 35.79 17.74 50%
- 31.58 88%
AD1 58.19 10.53 18%
14.74 25%
37.89 65%
AD2 32.33 21.05 65%
25.24 78%
27.37 85%
F1 32.67 8.42 26%
12.63 39%
25.26 77%
F2 47.41 8.42 18%
12.63 27%
27.37 58%
H2 52.53 25.26 48%
27.37 52%
29.47 56%
S2 36.64 6.32 17%
12.63 34%
33.68 92%
138
Table 4.4 Cracking load of NWC beam specimens cast without shear reinforcement.
Specimen No. Vultimate (kN)
Vrack
(kN) Inferred
Vflexural crack
(kN) Observed
Vshear crack (kN)
Observed
NWC1 71.57 42.1 59%
44.21 62%
48.42 68%
NWC2 35.79 8.42 24%
12.63 35%
25.26 71%
NWC3 33.69 14.74 44%
16.84 50%
23.16 69%
NWC4 52.63 6.32 12%
10.53 20%
31.58 60%
NWC5 25.26 6.32 25%
8.42 33%
16.84 66%
Table 4.5 Span to effective depth ratio, a/d for OPSC beam specimens cast without shear reinforcement.
Category SP
Specimen no.
Shear span to effective depth ratio,
a/d
Concrete strength
fcu (N/mm
2)
Steel ratio ρ (%)
=
Ultimate Failure Load
VOPSC (kN)
VOPSC b d
(N/mm2)
SP-LR12B
12A 1.0 31.03 1.08 73.68 4.15
12B 1.5 31.03 1.08 40.00 2.25
12C 2.5 31.03 1.08 27.37 1.54
12D 3.0 31.03 1.08 25.26 1.42
SP-LR16A
AD18 1.0 32.00 1.92 58.19 3.32
F1 2.5 32.38 1.92 32.67 1.86
AD28 3.0 32.00 1.92 32.33 1.84
SP-LR16B
16A 1.0 26.14 1.92 56.80 3.24
16B 1.5 26.14 1.92 42.10 2.40
16C 2.5 26.14 1.92 29.50 1.68
16D 3.0 26.14 1.92 26.32 1.50
SP-LR20A
20A 1.0 24.23 2.99 73.68 4.25
20B 1.5 24.23 2.99 52.63 3.04
20C 2.5 24.23 2.99 33.68 1.94
20D 3.0 24.23 2.99 27.37 1.58
139
Table 4.6 Longitudinal steel reinforcement, ρ for OPSC beam specimens cast without shear reinforcement.
Category LR
Specimen no.
Shear span to effective depth ratio,
a/d
Concrete strength
fcu (N/mm
2)
Steel ratio ρ (%)
=
Ultimate Failure Load VOPSC (kN)
VOPSC b d
(N/mm2)
LR-SP1A
20A 1.0 24.23 2.99 73.68 4.25
16A 1.0 26.14 1.92 56.80 3.24
LR-SP1B
12A 1.0 31.03 1.08 54.73 3.08
AD1 1.0 32.00 1.92 58.19 3.32
LR-SP1.5A
20B 1.5 24.23 2.99 52.63 3.04
16B 1.5 26.14 1.92 42.10 2.40
LR-SP2.5A
20C 2.5 24.23 2.99 33.68 1.94
16C 2.5 26.14 1.92 29.50 1.68
LR-SP2.5B
10A 2.5 30.05 0.75 18.95 1.06
S1 2.5 34.82 1.08 21.05 1.19
12C 2.5 31.03 1.08 27.37 1.54
16E 2.5 35.70 1.92 35.79 2.04
F1 2.5 32.38 1.92 32.67 1.86
20E 2.5 24.23 2.99 35.79 2.07
LR-SP3A
20D 3.0 26.14 2.99 27.37 1.58
16D 3.0 31.03 1.92 26.32 1.50
LR-SP3B
12D 3.0 32.00 1.08 25.26 1.42
AD2 3.0 24.23 1.92 32.33 1.84
Table 4.7 Cube concrete strength, fcu for OPSC beam specimens cast without shear reinforcement.
Category CS
Specimen no.
Shear span to effective depth ratio,
a/d
Concrete strength
fcu (N/mm
2)
Steel ratio ρ (%)
=
Ultimate Failure Load
VOPSC (kN)
VOPSC b d
(N/mm2)
CS-LR10
10A 2.5 30.05 0.75 18.95 1.06
S1 2.5 34.83 0.75 21.05 1.18
CS-LR12
12C 2.5 31.03 1.08 27.37 1.54
12E 2.5 39.20 1.08 31.58 1.78
CS-LR16
16C 2.5 26.14 1.92 29.50 1.68
F18 2.5 32.38 1.92 32.67 1.86
S2 2.5 35.70 1.92 36.64 2.09
F28 2.5 40.10 1.92 47.41 2.70
CS-LR20
20C 2.5 24.23 2.99 33.68 1.94
20E 2.5 28.00 2.99 35.79 2.07
140
Table 4.8 Overall sectional depth, h for OPSC beam specimens cast without shear reinforcement.
Category HT
Specimen no.
Overall section depth,
h (mm)
Shear span to overall height ratio, a/h
Concrete strength
fcu
(N/mm2)
Reinforcement ratio ρ (%)
=
Ultimate Failure Load VOPSC
(kN)
VOPSC b d
(N/mm2)
HT
12F 113 2.10 32.46 1.91 26.31 3.06
16E 200 2.10 32.46 1.92 35.79 2.04
H2 313 2.09 32.46 1.92 52.53 1.80
Table 4.9 Test results of OPSC beam specimens cast with shear reinforcement.
Specimen no.
Cube concrete strength, fcu
(N/mm2)
Shear reinforcement
spacing, s (mm)
Angle,
ϴ (degree)
Ultimate Failure Load
VOPSC (kN)
Assigned to variable
3A 25.79 120 39.8 75.78 CG, SR
3B 31.93 120 39.8 88.41 CG, SR
3C 34.60 120 39.8 92.62 CG, SR
4A 25.79 80 39.8 79.99 CG, SR
4B 31.93 80 39.8 94.73 CG, SR, PL
4C 34.60 80 39.8 107.36 CG, SR
5A 25.79 60 39.8 88.41 CG, SR
5B 31.93 60 39.8 107.36 CG, SR
5C 34.60 60 39.8 119.99 CG, SR
4D 30.15 80 45.0 101.04 PL
4E 30.15 80 51.3 105.25 PL
Table 4.10 Tests results of NWC beam specimens cast with shear reinforcement.
Specimen no.
Cube Concrete
strength, fcu
(N/mm2)
Shear reinforcement
spacing, s (mm)
Angle, ϴ (degree)
Ultimate Failure Load
VNWC (kN)
Compared with OPSC specimen
Variable considered
NWCA 30.61 120 39.8 82.10 3B SR
NWCB 30.61 80 39.8 88.41 4B CG, SR, PL
NWCC 30.61 60 39.8 99.99 5B SR
NWCD 30.61 80 51.3 101.04 4E PL
NWCE 35.00 80 39.8 98.94 4C CG
141
Table 4.11 Cracking load of OPSC beam specimens cast with shear reinforcement.
Specimen no.
Vultimate (kN)
Vcrack
(kN) Inferred
Vflexural crack (kN)
Observed
Vshear crack (kN)
Observed
3A 75.78 12.63 17%
21.05 28%
42.10 56%
3B 88.41 18.95 21%
27.37 31%
54.73 62%
3C 92.62 16.84 18%
25.26 27%
48.42 52%
4A 79.99 24.21 30%
25.26 32%
46.31 58%
4B 94.73 25.26 27%
29.47 31%
54.73 58%
4C 107.36 29.47 27%
31.58 29%
56.84 53%
5A 88.41 25.26 28%
29.47 33%
56.63 64%
5B 107.36 27.37 25%
33.68 31%
56.84 53%
5C 119.99 23.16 20%
37.89 32%
63.15 53%
4D 101.04 27.37 27%
31.58 31%
67.36 67%
4E 105.25 31.58 30%
37.89 37%
71.57 68%
Table 4.12 Cracking load of NWC beam specimens cast with shear reinforcement.
Specimen no.
Vultimate (kN)
Vcrack
(kN) Inferred
Vflexural crack (kN)
Observed
Vshear crack (kN)
Observed
NWCA 82.10 23.16 28%
37.89 46%
40.00 49%
NWCB 88.41 29.47 33%
31.58 36%
46.31 52%
NWCC 99.99 37.89 38%
44.21 44%
50.52 51%
NWCD 101.04 35.79 35%
- 54.72 54%
NWCE 98.94 37.89 38%
44.21 45%
50.52 51%
142
Table 4.13 Shear reinforcement spacing, s for OPSC beam specimens cast with shear reinforcement.
Category SR
Specimen no.
Spacing of shear
reinforcement, s (mm)
Cube concrete
strength, fcu
(N/mm2)
Angle, ϴ
(deg)
Ultimate Failure Load VOPSC (kN)
VOPSC b d
(N/mm2)
SR-CG26 5A 60 25.79 39.8 88.41 5.36
4A 80 25.79 39.8 79.99 4.48
3A 120 25.79 39.8 75.78 4.25
SR-CG32 5B 60 31.93 39.8 107.36 6.51
4B 80 31.93 39.8 94.73 5.31
3B 120 31.93 39.8 88.41 4.95
SR-CG35 5C 60 34.60 39.8 119.99 7.28
4C 80 34.60 39.8 107.36 6.01
3C 120 34.60 39.8 92.62 5.19
Table 4.14 Inclination angle of shear cracks, ϴ for OPSC beam specimens cast with shear reinforcement.
Category PL
Specimen no.
Cube concrete strength, fcu
(N/mm2)
Shear span, a (mm)
Angle, ϴ
(deg)
Ultimate Failure Load
VOPSC-S (kN)
VOPSC-S b d
(N/mm2)
PL 4B 31.93 240 39.8 94.73 5.31
4D 30.15 200 45.0 101.04 5.66
4E 30.15 160 51.3 105.25 5.90
143
Table 4.15 Cube concrete strength, fcu (N/mm2) for OPSC beam specimens cast with shear reinforcement.
Category CG
Specimen no.
Spacing of shear
reinforcement, s (mm)
Concrete strength,
fcu
(N/mm2)
Angle, ϴ (deg)
Ultimate Failure Load VOPSC (kN)
VOPSC b d
(N/mm2)
CG-S60
5A 60 25.79 39.8 88.41
107.36
5.36
5B 60 31.93 39.8 107.36 6.51
5C 60 34.60 39.8 119.99 7.28
CG-S80
4A 80 25.79 39.8 79.99 4.48
4B 80 31.93 39.8 94.73 5.31
4C 80 34.60 39.8 107.36 6.01
CG-S120
3A 120 25.79 39.8 75.78 4.25
3B 120 31.93 39.8 88.41 4.95
3C 120 34.60 39.8 92.62 5.19
144
Figure 4.1 Failure mechanism of OPSC beam cast without shear reinforcement,
10A.
Figure 4.2 Failure mechanism of OPSC beam cast without shear reinforcement,
S1.
Figure 4.3 Failure mechanism of OPSC beam cast without shear reinforcement,
12A.
Figure 4.4 Failure mechanism of OPSC beam cast without shear reinforcement,
12B.
Figure 4.5 Failure mechanism of OPSC beam cast without shear reinforcement,
12C.
145
Figure 4.6 Failure mechanism of OPSC beam cast without shear reinforcement,
12D.
Figure 4.7 Failure mechanism of OPSC beam cast without shear reinforcement,
12E.
Figure 4.8 Failure mechanism of OPSC beam cast without shear reinforcement,
12F.
Figure 4.9 Failure mechanism of OPSC beam cast without shear reinforcement,
16A.
Figure 4.10 Failure mechanism of OPSC beam cast without shear
reinforcement, 16B.
146
Figure 4.11 Failure mechanism of OPSC beam cast without shear reinforcement,
16C.
Figure 4.12 Failure mechanism of OPSC beam cast without shear reinforcement,
16D.
Figure 4.13 Failure mechanism of OPSC beam cast without shear reinforcement,
16E.
Figure 4.14 Failure mechanism of OPSC beam cast without shear reinforcement,
20A.
Figure 4.15 Failure mechanism of OPSC beam cast without shear reinforcement,
20B.
147
Figure 4.16 Failure mechanism of OPSC beam cast without shear reinforcement,
20C.
Figure 4.17 Failure mechanism of OPSC beam cast without shear reinforcement,
20D.
Figure 4.18 Failure mechanism of OPSC beam cast without shear reinforcement,
20E.
Figure 4.19 Failure mechanism of OPSC beam cast without shear reinforcement,
AD1.
Figure 4.20 Failure mechanism of OPSC beam cast without shear reinforcement,
AD2.
148
Figure 4.21 Failure mechanism of OPSC beam cast without shear reinforcement,
F1.
Figure 4.22 Failure mechanism of OPSC beam cast without shear
reinforcement, F2.
Figure 4.23 Failure mechanism of OPSC beam cast without shear reinforcement,
H2.
Figure 4.24 Failure mechanism of OPSC beam cast without shear reinforcement,
S2.
Figure 4.25 Failure mechanism of NWC beam cast without shear reinforcement, NWC1.
149
Figure 4.26 Failure mechanism of NWC beam cast without shear
reinforcement, NWC2.
Figure 4.27 Failure mechanism of NWC beam cast without shear reinforcement,
NWC3.
Figure 4.28 Failure mechanism of NWC beam cast without shear reinforcement,
NWC4.
Figure 4.29 Failure mechanism of NWC beam cast without shear reinforcement,
NWC5.
150
Figure 4.30 Load (kN) vs Central deflection (mm) for OPSC beam specimens cast without shear reinforcement of a/d = 1 and ρ = 1.08%, 1.92% and
2.99%.
Figure 4.31 Load (kN) vs Central deflection (mm) for OPSC beam specimens cast without shear reinforcement of a/d = 1.5 and ρ = 1.08%, 1.92%
and 2.99%.
151
Figure 4.32 Load (kN) vs Central deflection (mm) for OPSC beam specimens cast without shear reinforcement of a/d = 2.5 and ρ =1.92%.
Figure 4.33 Load (kN) vs Central deflection (mm) for OPSC beam specimens cast without shear reinforcement of a/d = 2.5 and ρ = 0.75%, 1.08%,
and 2.99%.
152
Figure 4.34 Load (kN) vs Central deflection (mm) for OPSC beam specimens cast without shear reinforcement of a/d = 3 and ρ = 1.08%, 1.92% and
2.99%.
Figure 4.35 Load (kN) vs Central deflection (mm) for NWC beam specimens cast without shear reinforcement.
153
Figure 4.36 Surface texture of diagonal shear cracks interface of OPSC and NWC beams cast without shear reinforcement (Sectional View).
Figure 4.37 Diagonal shear cracks of OPSC and NWC beams cast without shear reinforcement (Side view).
Shear cracks passed through the OPS aggregate when OPS aggregate is perpendicular to the breakage path.
Shear cracks occurred between cement paste and OPS aggregate when OPS aggregate is parallel to the breakage path.
OPSC NWC
Shear cracks occurred between the cement paste and gravel aggregates.
154
Figure 4.38 VOPSC (kN) vs Shear span to effective depth ratio, a/d for OPSC beam specimens cast without shear reinforcement.
Figure 4.39 VTest (kN) vs Shear span to effective depth ratio, a/d for OPSC and NWC beam specimens cast without shear reinforcement.
155
Figure 4.40 Surface texture of diagonal shear interface of OPSC beams cast without shear reinforcement tested at a/d=1.5 and a/d=2.5 (Sectional view).
Smooth surface of sheared plane were observed for OPSC beams with a/d <2.5.
Rough surface of sheared plane were observed for OPSC beams with a/d=2.5.
156
Figure 4.41 Surface texture of diagonal shear interface of OPSC and NWC beams cast without shear reinforcement tested at a/d ratio = 1 (Sectional view and Isometric view).
NWC beam tested at a/d =1, Rougher surface texture of
gravel aggregates
OPSC beam tested at a/d =1, Smoother surface texture of
OPS aggregates
157
Figure 4.42 Surface texture of diagonal shear interface of OPSC and NWC beams cast without shear reinforcement tested at a/d ratio = 2.5 (Sectional view and Isometric view).
OPSC beam tested at a/d = 2.5, Rougher surface texture of OPS
aggregates
NWC beam tested at a/d =2.5, Smoother surface texture of
gravel aggregates
158
Figure 4.43 VOPSC (kN) vs Longitudinal steel ratio, ρ (%) for OPSC beam specimens cast without shear reinforcement.
Figure 4.44 VTest (kN) vs Longitudinal steel ratio, ρ (%) for OPSC and NWC beam specimens cast without shear reinforcement.
159
Figure 4.45 vOPSC (N/mm2) vs Concrete strength, fcu (N/mm2) for OPSC beam specimens cast without shear reinforcement.
Figure 4.46 VTest (kN) vs Concrete strength, fcu (N/mm2) for OPSC and NWC beam specimens cast without shear reinforcement.
160
Figure 4.47 VOPSC (kN) vs Overall section depth, h (mm) of OPSC beam specimens without shear reinforcement.
Figure 4.48 vOPSC (N/mm2) vs Overall section depth, h (mm) of OPSC beam specimens without shear reinforcements.
161
Figure 4.49 VTest (kN) vs Overall section depth, h (mm) for OPSC and NWC beam specimens cast without shear reinforcement.
Figure 4.50 Failure mechanisms of OPSC beam cast with shear reinforcements,
3A.
Figure 4.51 Failure mechanisms of OPSC beam cast with shear reinforcements,
3B.
Figure 4.52 Failure mechanisms of OPSC beam cast with shear reinforcements,
3C.
162
Figure 4.53 Failure mechanisms of OPSC beam cast with shear reinforcement,
4A.
Figure 4.54 Failure mechanisms of OPSC beam cast with shear reinforcement,
4B.
Figure 4.55 Failure mechanisms of OPSC beam cast with shear reinforcement,
4C.
Figure 4.56 Failure mechanisms of OPSC beam cast with shear reinforcement,
5A.
Figure 4.57 Failure mechanisms of OPSC beam cast with shear reinforcement,
5B.
163
Figure 4.58 Failure mechanisms of OPSC beam cast with shear reinforcement,
5C.
Figure 4.59 Failure mechanisms of OPSC beam cast with shear reinforcement,
4D.
Figure 4.60 Failure mechanisms of OPSC beam cast with shear reinforcement,
4E.
Figure 4.61 Failure mechanisms of NWC beam cast with shear reinforcement,
NWCA.
Figure 4.62 Failure mechanisms of NWC beam cast with shear reinforcement,
NWCB.
164
Figure 4.63 Failure mechanisms of NWC beam cast with shear reinforcement,
NWCC.
Figure 4.64 Failure mechanisms of NWC beam cast with shear reinforcement,
NWCD.
Figure 4.65 Failure mechanisms of NWC beam cast with shear reinforcement,
NWCE.
165
Figure 4.66 Load (kN) vs Central deflection (mm) for OPSC beam specimens with shear reinforcement of shear reinforcement spacing = 120 mm.
Figure 4.67 Load (kN) vs Central deflection (mm) for OPSC beam specimens with shear reinforcement of shear reinforcement spacing = 80 mm.
166
Figure 4.68 Load (kN) vs Central deflection (mm) for OPSC beam specimens with shear reinforcement of shear reinforcement spacing = 60 mm.
Figure 4.69 Load (kN) vs Central deflection (mm) for NWC beam specimens with shear reinforcement.
167
Figure 4.70 Surface texture of diagonal shear interface of OPSC and NWC beam
specimens cast with shear reinforcement (Sectional view).
Bond failure between gravel aggregates and
cement paste
Shear force sheared through OPS aggregates
Bond failures between OPS aggregates and
cement paste
NWC beam OPSC beam
168
Figure 4.71 Surface texture of diagonal shear interface of OPSC and NWC beam
specimens cast with shear reinforcement (Isometric View).
NWC beam
OPSC beam
Bond failure between gravel aggregates and cement
paste
Shear force sheared through OPS aggregates
Bond failures between OPS
aggregates and cement paste
169
Figure 4.72 VOPSC (kN) vs Shear reinforcement spacing, s (mm) for OPSC beam specimens cast with shear reinforcement.
Figure 4.73 VTest (kN) vs Shear reinforcement spacing, s for OPSC and NWC beam specimens cast with shear reinforcement.
170
Figure 4.74 VOPSC (kN) vs Inclination angle of shear cracks, ϴ (degree) for OPSC beam specimens cast with shear reinforcement.
Figure 4.75 VTest (kN) vs Inclination angle of shear cracks, ϴ (degree) for OPSC and NWC beam specimens cast with shear reinforcement.
171
Figure 4.76 VOPSC (kN) vs Concrete strength, fcu (N/mm2) for OPSC beam specimens cast with shear reinforcement.
Figure 4.77 VTest (kN) vs Concrete strength, fcu (N/mm2) for OPSC and NWC beam specimens cast with shear reinforcement.
172
Chapter 5
Theoretical Plastic Models
5.1 Introduction
In Chapter 4, the test observations, the test results, the failure mechanisms and the
effect of parameters were fully described. It was noted that variations on the
ultimate shear strength do occurred between the Oil Palm kernel Shell Concrete
(OPSC) beams and Normal Weight Concrete (NWC) beams, both cast with and
without shear reinforcement. Since the existing upper bound plastic models have
been proposed for the predictions of shear resistance of NWC beams, both with and
without shear reinforcement, it is therefore sensible to adopt these models as the
basis of the theoretical models proposed in this chapter.
As mentioned in Section 2.2, although the upper bound plastic approach for
predicting concrete shear resistance of reinforced concrete structural beam elements
was first introduced in 1975 by Braestrup [45], agreement with the test results were
only found with the inclusion of effectiveness factor, υ, in 197 for beams without
shear reinforcement) 8 by Neilsen et.al [46]. For concrete beam specimens cast
without shear reinforcement, better agreement with tests were found when the
effectiveness factor, υ, was considered to be a function of concrete cylindrical
compressive strength (σc), overall section depth (h), longitudinal steel ratio (ρ), and
span to overall depth ratio (a/h). Whilst for concrete beam specimens cast with shear
reinforcement, the effectiveness factor, υ, was considered to be limited to the
function of concrete cylindrical compressive strength (σc), as the effects of other
parameters were considered to be nominal [46]. However, as described in Chapter 4,
173
it was found that the shear reinforcement’s ratio, and the inclination angle of
shear cracks, ϴ, influenced the shear resistance of the OPSC beam cast with shear
reinforcement. Hence, further investigations were carried out in the current research
to determine the need for modification to the existing prediction model.
In this chapter, investigations on the requirements for modification on shear strength
parameters’ are reported for both cases of casting with and without shear
reinforcement. From the current research, two theoretical concrete plastic model:
CP-I Model and CP-II Model, which adopt the upper bound plastic approach as their
fundamental basis, are proposed for OPSC cast without and with shear
reinforcement, respectively.
For OPSC beam without shear reinforcement, CP- I Model modified the parameters’
equations of concrete compressive strength (σc), overall section depth (h),
longitudinal steel ratio (ρ), and span to overall depth ratio (a/h). Whilst for OPSC
beam with shear reinforcement, CP-II modified the parameter’s equation: concrete
compressive strength (σc). Full detail of the prediction models, CP-I Model and CP-II
Model,, are presented in Section 5.2 and 5.3, respectively.
5.2 Beams cast without shear reinforcement
5.2.1 Theoretical plastic model for concrete beam without shear reinforcement,
(CP-I Model)
The proposing (CP-I Model) is developed to predict for the ultimate shear resistance
of a reinforced concrete beam element cast using Oil Palm kernel Shell (OPSC) as
coarse aggregate. The model is essentially the existing upper bound plastic approach
174
(Eqn 2.15) with some modifications to its effectiveness parameters. That is, both the
concrete and the reinforcement are assumed to be rigid plastic materials with plastic
strains and yield condition assumed to follow the associated flow law (normality
condition) and modified Coulomb failure criterion, respectively. At failure, a concrete
beam is assumed to be separated into rigid regions by the shear failure surfaces (as
shown in Figure 2.14). These regions are considered to remain rigid and to move
relative to each other. The discontinuities are assumed to be narrow rigid-plastic
region of concrete as shown in Figure (2.14).
Since a significant similarity has been adopted in the failure mechanism, the test
results were then compared with the predictions of the existing model (Eqn 2.16.1 to
2.16.4) to evaluate whether the existing model is relevant (see Column 2 and 3 in
Table 5.1). The comparisons have been summarised and presented in Table 5.1 (see
Column 5). It can be noted that the existing model overestimate the test results by
11%. The test results were then further evaluated with respect to the associating
parameters of the effectiveness factor (as shown in Figure 5.1 to Figure 5.4). The
outcomes of these evaluations review that the existing model, as it is, does not give
good agreement with the ultimate shear resistance of OPSC beam specimens. As a
result, it is decided to carry out modifications to the effectiveness parameters to
reflect the observation derive from tests. The parameters modified are; span to
overall depth ratio (a/h), longitudinal steel ratio (ρ), concrete compressive strength
(σc), and overall section depth (h). Such modifications are required to accommodate
for the variations observed from tests, such as overestimations of the parameters
shear span to depth ratio (a/h) ≤ 2, longitudinal steel ratio, concrete strength and
underestimation of overall section depth (h) < 150 mm.
175
5.2.2 Modification on parameters
5.2.2.1 Span to overall depth ratio, a/h
It can be noted from Figure 5.1 that, the shear failure loads of OPSC specimens
loaded with span to overall depth ratio, a/h ≤ 2, are observed to be lower than those
casted with NWC. As such, the prediction values derived from the existing theoretical
plastic model (CP-NS Model) (Eqn 2.16.1) are therefore observed to overestimate the
failure loads of OPSC specimens. It is believed that such phenomenon was attributed
to the lower aggregate interlock ability resulting from the smoother shear crack
interface observed in OPSC specimen AD1 with respect to NWC specimen NWC1 (see
Figure 4.41).
Whilst for OPSC specimens loaded with a/h > 2 (a/d ≥ 2.5), the shear failure loads
were noted to be similar to that of NWC specimens. As such, the prediction values
derived from the existing theoretical plastic model (CP-NS Model) (Eqn 2.16.1) agree
with the failure loads of OPSC specimens. Such phenomenon is believed to be
attributed to the higher aggregate interlock ability resulting from the rougher shear
interface observed in OPSC specimen F1 with respect to NWC specimen NWC2 (See
Figure 4.42), as highlighted in Section 4.2.3.1.
In view of the discrepancy noted in shear behaviour of OPSC specimens as the shear
span reduces, modification to the existing parameter, a/h, is required. The existing
expression was therefore revised to be Eqn 5.1.1 to accommodate for the smoother
shear crack interface observed in the OPSC specimens. With the revised expression
for span ratio (Eqn 5.1.1), good agreement with test results are achieved, as shown in
Figure 5.1.
176
f(
) = 1 + 0.05 (
- 2.6)2 (
≤ 2.54) (Eqn 5.1.1)
5.2.2.2 Longitudinal steel ratio, ρ
In general, it can be noted from Figure 5.2 that the test results with respect to the
longitudinal steel ratio, f(ρ), of OPSC beam specimens cast without shear
reinforcement are observed to be lower than the predictions derived from the
existing theoretical plastic model (CP-NS Model) (Eqn 2.16.2). Furthermore, it is
observed that the rate of increases in shear strength of OPSC specimens with respect
to the longitudinal steel ratio (ρ) were observed to be less significant for beam
specimens casted with ρ = 2.99%, while the control samples (NWC) were observed to
be consistent with the theoretical prediction (see figure 4.44).
Such discrepancies are believed to be attributed to the differences found in the
fracture strength of coarse aggregates (See Section 2.1). That is, a lower fracture
strength found in Oil Palm kernel Shell (OPS) (see Table 2.1) would have led to a
lower shear stress being transferred across the shear crack interface, which in turn,
resulted in a lower shear resistance been mobilised.
In view of the discrepancies noted in OPSC, a modification has been proposed to the
existing plastic model (CP-NS Model) (Eqn 2.16.2) to account for the losses observed
in shear strength, which would resulted from the increase in reinforcement ratio.
With the revised expression for longitudinal steel ratio (Eqn 5.1.2), good agreement
with test results are achieved, as shown in Figure 5.2.
f(ρ) = 0.13 ρ + 0. 53 (ρ <3.14 %) (Eqn 5.1.2)
177
5.2.2.3 Cylindrical concrete strength, σc
In general, it can be noted from Figure 5.3 that the shear strength of OPSC with
respect of the cylindrical concrete strength, f(σc), of specimens cast without shear
reinforcement are observed to be lower than the predictions of the existing
theoretical plastic model (CP-NS Model) (Eqn 2.16.3). As such, the prediction values
derived from the existing theoretical plastic model (CP-NS Model) (Eqn 2.16.3) are
therefore observed to overestimate the failure loads of OPSC specimens. It is
believed that such phenomenon was attributed to the lower fracture strength of OPS
aggregates (see Section 2.1). That is, a lower fracture strength found in Oil Palm
kernel Shell (OPS) (see Table 2.1) would have led to a lower shear stress being
transferred across the shear cracks interface, and hence, resulted in a lower shear
resistance been mobilised.
In view of the discrepancies noted in OPSC, a modification has been proposed to the
existing plastic model (CP-NS Model) with respect to the influence of cylindrical
concrete strength in shear strength, to accommodate for the shear strength
provided. With the revised expression for concrete strength (Eqn 5.1.3), good
agreement with test results are achieved, as shown in Figure 5.3.
f(σc) =
√ (19 < σc <33 MPa) (Eqn 5.1.3)
5.2.2.4 Overall section depth, h
It can be noted from Figure 5.4 that, the shear failure loads of OPSC specimens
loaded with overall section depth, h < 160 mm, are observed to be higher than those
casted with NWC. As for OPSC specimens with increase of overall section depth, it is
178
observed that the rate of reduction in shear strength of OPSC specimens with respect
to the overall section depth are more significant, while the control samples (NWC)
were observed to be consistent with the theoretical prediction of existing plastic
model (CP-NS Model) (Eqn 2.16.4).
Such discrepancies are believed to be attributed to the differences found in the
fracture strength of coarse aggregates (See Section 2.1). That is, a lower fracture
strength found in Oil Palm kernel Shell (OPS) (see Table 2.1) would have led to a
lower aggregate interlock capacity accumulated as the overall section depth
increases, which in turn, resulted in a lower ultimate shear resistance.
In view of the discrepancies noted in OPSC, a modification has been proposed to the
existing plastic model (CP-NS Model) to account for the losses observed in shear
strength, which would resulted from the increase in overall section depth. With the
revised expression for overall section depth (Eqn 5.1.4), good agreement with test
results are achieved, as shown in Figure 5.4.
f(h) =
) (0.113m ≤ h ≤ 0.313m) (Eqn 5.1.4)
5.2.3 Comparisons with test results
It can be observed from the Figure 5.5 to Figure 5.8 that with the proposing
theoretical plastic model (CP-I Model) with respect to the parameters: span to overall
depth ratio (a/h), longitudinal steel ratio (ρ), concrete strength (σc), and overall
section depth (h) (Eqn 5.1.1 to 5.1.4) exhibits good agreement (mean value of 1.07
and standard deviation of 0.15) with the test results (see also Table 5.1 Column 6).
179
5.3 Beams cast with shear reinforcement
5.3.1 Theoretical plastic model for concrete beam with shear reinforcement, (CP-
II Model)
The proposing (CP-II Model) is developed to predict for the ultimate shear resistance
of a reinforced concrete element with shear reinforcement cast using Oil Palm kernel
Shell (OPSC) as coarse aggregate. The model is essentially the existing upper bound
plastic approach (Eqn 2.41) with some modifications to its effectiveness parameter.
That is, both the concrete and the reinforcement are assumed to be rigid plastic
materials with plastic strains and yield condition assumed to follow the associated
flow law (normality condition) and modified Coulomb failure criterion, respectively. A
concrete beam is assumed to be separated into rigid regions by the shear failure
surfaces at failure (as shown in Figure 2.19). These regions are considered to remain
rigid and to move relative to each other and the discontinuities are assumed to be
narrow rigid-plastic region of concrete as shown in Figure 2.19.
Since similarity has been observed in the failure mechanism of OPSC and NWC
beams, the test results of OPSC beams were compared with the predictions of the
existing model (Eqn 2.42) to evaluate whether the existing model is relevant (see
Column 2 and 3 in Table 5.2). It can be noted that the existing model overestimate
the test results by 8%. The test results were then further evaluated with respect to
the associating parameter of the effectiveness factor (as shown in Figure 5.9). In
addition to the effectiveness parameter, additional parameters of shear
reinforcement ratio and inclination angle of shear cracks were investigated (see
Figure 5.10 and 5.11). The outcomes of these evaluations review that the existing
model, as it is, does not give good agreement with the ultimate shear resistance of
OPSC beam specimens. The model is essentially the existing upper bound plastic
180
model (Eqn 2.41) with a modification to its effectiveness parameter: concrete
strength.
Hence, detailed investigations were carried out on the shear strength predictions
given by the existing theoretical plastic model (CP-S Model) with respect to the OPSC
beam’s test results to investigate the requirement for modifications on the shear
strength parameters. The results of these investigations are shown in Table 5.2
(Column 5), which it is found that the existing theoretical plastic model (CP-S Model)
overestimated the shear strength capacity of OPSC beam specimens cast with shear
reinforcement with a mean value of 0.92 and standard deviation of 0.05.
5.3.2 Modification on parameter
From Section 5.3.1, it was found that the existing theoretical plastic model (CP-S
Model) overestimated the shear strength of the OPSC beam cast with shear
reinforcement. Hence, detailed investigations were carried out on the parameter of
cylindrical concrete strength (σc), which governed the effectiveness factor, υ to
investigate the requirement for modification on parameter. Apart from the concrete
strength parameter suggested by Nielsen et.al [46], it is observed from the test
results in Section 4.3.3 that two other parameters: (1) shear reinforcement ratio (ρs)
and (2) inclination angle of shear cracks(ϴ), also influence the ultimate shear
strength obtained for the OPSC beam with shear reinforcement.
Hence, further investigations on the two parameters: (1) cylindrical concrete strength
(σc) (see Figure 5.21) (2) inclination angle of shear cracks (ϴ) (see Figure 5.22), and (3)
shear reinforcement ratio (ρs) (see Figure 5.23) were carried out to observe the
comparisons between the shear failure loads of the OPSC beams without shear
181
reinforcement and the shear strength predictions derived from the existing
theoretical plastic model (CP-S Model), to examine the requirement for the
modification.
5.3.2.1 Cylindrical concrete strength, σc
It can be noted from Figure 5.9 that the shear failure loads of OPSC beams with shear
reinforcement with respect to the parameter: cylindrical concrete strength are lower
than the predictions derived from the existing CP Model (CP-S Model) (Eqn 2.42).
However, it is observed from tests that the ultimate shear strength achieved by the
OSPC beam specimens (Specimen 4B and 4C) are slightly higher compared to the
ultimate shear strength by NWC beam specimens (Specimen NWCB and NWCE) (see
Figure 4.77). It is believed the that the higher shear strength achieved by OPSC
beams is due to the rougher shear cracks interface of OPSC beams (See Figure 4.70
and 4.71) compared to those of NWC beams. Therefore, this would lead to higher
aggregate interlocking capacity and resulted in higher shear resistance in OPSC
beams. Hence, it can be noted that the existing plastic model (CP-S Model)
overestimated the shear failure loads of the OPSC beams.
A modification has therefore been proposed to the existing plastic model (CP-S
Model) to account for the variations observed between the shear strength of the
OPSC specimens and the predictions by CP-S Model. With the revised expression for
concrete strength (Eqn 5.2), good agreement with test results are achieved, as shown
in Figure 5.9.
f( ) =
( 20.5 MPa ≤ fck ≤ 27.7 MPa) (Eqn 5.2)
182
5.3.2.2 Shear reinforcement ratio, ρs
It can be noted from Figure 5.10 that the shear failure loads of OPSC beams with
respect to shear reinforcement ratio are higher than those of NWC control specimens
(See also Figure 4.73). It is believed that such discrepancy is due to the rougher
surface interface observed at the surface texture of diagonal shear cracks of the
OPSC beams compared to NWC beams (see Figure 4.70 and 4.71), which in turn,
would have enhanced the aggregate interlocking capacity, and resulted in higher
shear resistance of OPSC beams.
However, it can be noted from Figure 5.10 that the shear failure loads of the OPSC
beams are in good agreement with the predictions derived from the existing plastic
model (CP-S Model) (Eqn 2.42). Therefore, there is no requirement for the parameter
shear reinforcement modification. The predictions of the CP-S Model with respect to
the parameter: shear reinforcement ratio are reasonable to be included to the
proposed modified plastic model (CP-II Model) without any requirement of
modification to the parameter.
5.3.2.3 Inclination angle of shear cracks, ϴ
It can be noted from Figure 5.11 that the shear failure loads of OPSC beams with
respect to shear reinforcement ratio are higher than those of NWC control specimens
(See also Figure 4.75). Such discrepancy is believed attributed to the rougher surface
interface observed at the surface texture of diagonal shear cracks of the OPSC beams
compared to NWC beams (see Figure 4.70 and 4.71), which in turn, would have
enhanced the aggregate interlocking capacity, and resulted in higher shear resistance
of OPSC beams.
183
However, it can be noted from Figure 5.11 that the shear failure loads of OPSC beams
with respect to inclination angle of shear cracks, f(ϴ) are in good agreement with the
predictions derived from the existing plastic model (CP-S Model) (Eqn 2.41). Hence,
no requirement of modification on the parameter: inclination angle of shear cracks is
recommended. The existing parameter formula is therefore acceptable to be
included to the proposed modified plastic model (CP-II Model).
5.3.3 Comparisons with test results
It can be observed from Figure 5.12 to Figure 5.14 that good agreement between the
test results and the prediction derived from the proposed modified theoretical plastic
model with respect to parameters: cylindrical concrete strength (σc), inclination angle
of shear cracks (ϴ) and shear reinforcement ratio (ρs) are achieved (mean value of
1.03 and standard deviation of 0.05, as shown Table 5.2 Column 6).
5.4 Summary
Two theoretical models based upon the modification of the existing theoretical
concrete plastic models via the parameters equations were proposed in this chapter
for the shear strength predictions of the OPSC beams cast with and without shear
reinforcement, respectively.
For OPSC beams cast without shear reinforcement, the proposed CP-I Model took
into account the variables: concrete cylindrical compressive strength (σc), overall
section depth (h), longitudinal steel ratio (ρ), and span to overall depth ratio (a/h),
which governed the effectiveness factor, υ, from the existing plastic model (CP-NS
184
Model), which each shear strength parameters were modified for the ultimate shear
strength predictions of the OPSC beams without shear reinforcement.
Whilst for OPSC beams cast with shear reinforcement, the proposed CP-II Model are
the results of the modified parameter equations of cylindrical compressive strength
(σc) for the ultimate shear strength predictions of the OPSC beams with shear
reinforcement. In general, all the modified theoretical concrete plastic models (CP-I
Model and CP-II Model) achieved good agreement with the OPSC beam test results.
185
Table 5.1 Comparisons of shear strength predictions with respect to the test results of OPSC beams cast without shear reinforcement
1 2 3 4 5 6
Specimen No
VOPSC
(kN) VCP-NS
(kN)
VCP-I
(kN)
VOPSC VCP-NS
VOSPC VCP-I
10A 18.95 25.30 22.44 0.75 0.84
S1 21.05 27.23 24.16 0.77 0.87
12A 54.73 83.91 57.73 0.65 0.95
12B 40.00 53.59 40.71 0.75 0.98
12C 27.37 27.74 24.51 0.99 1.12
12D 25.26 22.57 20.49 1.12 1.23
12E 31.58 31.18 27.54 1.01 1.15
12F 26.31 23.16 21.30 1.14 1.24
16A 56.80 91.12 62.17 0.62 0.91
16B 42.10 58.37 43.93 0.72 0.96
16C 29.50 30.22 26.46 0.98 1.11
16D 26.32 24.52 22.11 1.07 1.19
16E 35.79 33.68 29.49 1.06 1.21
20A 73.68 105.29 71.27 0.70 1.03
20B 52.63 67.65 50.46 0.78 1.04
20C 33.68 35.04 30.43 0.96 1.11
20D 27.37 28.35 25.41 0.97 1.08
20E 35.79 37.67 32.71 0.95 1.09
AD1 58.19 100.81 68.78 0.58 0.85
AD2 32.33 27.13 24.47 1.19 1.32
F1 32.67 33.63 29.45 0.97 1.11
F2 47.41 37.43 32.78 1.27 1.45
H2 52.53 52.43 23.69 1.00 0.80
S2 36.64 35.32 30.93 1.04 1.18
Mean 0.89 1.07
S.D. 0.19 0.15
VOPSC (kN) = Ultimate shear failure load of OPSC beam specimens cast without shear reinforcement
VCP-NS (kN) = Shear resistance of Existing Concrete Plastic Model (CP-NS Model)
VCP-NS
Which, υ = f1 (σc) f2 (h) f3 (ρ) f4 (
Where, f1(σc) =
√ (σc in N/mm
2)
f2(h) = 0.27 (1 +
√ ) (h in m)
f3(ρ) = 0.15ρ +0.58 (ρ < 4.5%)
f4(
= 1 + 0.17 (
(
186
VCP-I (kN) = Shear resistance of proposing Modified Concrete Plastic Model (CP-I
Model)
VCP-I
Which, υ = f1 (σc) f2 (h) f3 (ρ) f4 (
Where, f1(σc) =
√ (19 MPa ≤ σc ≤ 33 MPa)
f2(h) = 0.25 (1.1 +
) (0.113m ≤ h ≤ 0.313 m)
f3(ρ) = 0.13ρ +0.53 (ρ < 3.14%)
f4(
= 1 + 0.17 (
(
187
Table 5.2 Comparisons of shear strength predictions with respect to the test results of OPSC beams cast with shear reinforcement
1 2 3 4 5 6
Specimen No
VOPSC
(kN) VCP-S
(kN)
VCP-II
(kN)
VOPSC VCP-S
VOSPC VCP-II
3A 75.78 78.04 72.70 0.97 1.04
3B 88.41 88.67 82.89 0.95 1.07
3C 92.62 93.01 87.14 0.95 1.06
4A 79.99 89.73 84.29 0.87 0.95
4B 94.73 100.36 94.49 0.91 1.00
4C 107.36 104.70 98.73 0.98 1.09
5A 88.41 101.42 95.88 0.81 0.92
5B 107.36 112.05 106.08 0.89 1.01
5C 119.99 116.39 110.33 0.95 1.09
4D 101.04 98.94 93.98 0.95 1.08
4E 105.25 103.15 98.61 0.93 1.07
Mean 0.92 1.03
S.D. 0.05 0.05
VOPSC (kN) = Ultimate shear failure loads of OPSC beam specimens cast with shear reinforcement
VCP-S (kN) = Shear resistance of Existing Concrete Plastic Model (CP-S Model)
VCP-S = σf b h cot ϴ +
Where, υ = 0.8 -
VCP-II (kN) = Shear resistance of proposing Modified Concrete Plastic Model (CP-
II Model)
VCP-II = σf b h cot ϴ +
Where, υ = 0.7 -
188
Figure 5.1 f(a/h) vs a/h for Existing plastic model (CP-NS Model) and Modified
plastic model (CP-I Model).
Figure 5.2 f(ρ) vs ρ(%) for Existing plastic model (CP-NS Model) and Modified
plastic model (CP-I Model).
f(𝒂 𝒉
) =
𝐕𝐓𝐞𝐬𝐭
𝐬𝐢𝐧
𝜭
𝟎 𝟓
𝝈𝒄 𝟏
𝐜𝐨𝐬𝚹
𝐛 𝐡
𝐟 𝝆
𝐟 𝐡 𝐟 𝝈𝒄
f(ρ
) =
𝐕𝐓𝐞𝐬𝐭
𝐬𝐢𝐧
𝜭
𝟎 𝟓
𝝈𝒄 𝟏
𝐜𝐨𝐬𝚹
𝐛 𝐡
𝐟(𝐚 𝐡) 𝐟 𝐡 𝐟 𝝈𝒄
189
Figure 5.3 f(σc) vs σc (N/mm2) for Existing plastic model (CP-NS Model) and Modified plastic model (CP-I Model).
Figure 5.4 f(h) vs h (mm) for Existing plastic model (CP-NS Model) and
Modified plastic model (CP-I Model).
f (σ
c) =
𝐕𝐓𝐞𝐬𝐭
𝐬𝐢𝐧
𝜭
𝟎 𝟓
𝝈𝒄 𝟏
𝐜𝐨𝐬𝚹
𝐛 𝐡
𝐟(𝐚 𝐡) 𝐟 𝝆 𝐟 𝒉
f(h
) =
𝐕𝐓𝐞𝐬𝐭
𝐬𝐢𝐧
𝜭
𝟎 𝟓
𝝈𝒄 𝟏
𝐜𝐨𝐬𝜭
𝐛 𝐡
𝐟(𝐚 𝐡) 𝐟 𝝆 𝐟 𝝈𝒄
190
Figure 5.5 VOPSC/VCP vs Span to overall depth ratio, a/h.
Figure 5.6 VOPSC/VCP vs Longitudinal steel ratio, ρ (%).
191
Figure 5.7 VOPSC/VCP vs Cylindrical concrete strength, σc (N/mm2).
Figure 5.8 VOPSC/VCP vs Overall sectional depth, h (mm).
192
Figure 5.9 f(σc) vs σc (N/mm2) for Existing CP Model (CP-S Model) and Modified
CP Model (CP-II Model).
Figure 5.10 f(ρs) vs ρs (%) for Existing CP Model (CP-S Model).
f(𝝆𝒔)
= 𝐕𝐓𝐞𝐬𝐭
(𝟎
𝟓 𝟏−𝐜𝐨𝐬𝜭
𝛖 𝛔𝐜 𝐛
𝐡
𝐬𝐢𝐧𝜭
)
𝒇𝒚𝒌𝐛𝐡
𝟏
𝐭𝐚𝐧𝜭
f(𝛔𝐜)
= 𝐕𝐓𝐞𝐬𝐭
(𝒇
𝒚𝒌𝐛 𝐡
𝛖 𝝆𝒔
𝟏
𝐭𝐚𝐧𝜭)
𝐬𝐢𝐧
𝜭
𝟎 𝟓
𝟏 𝐜𝐨𝐬𝚹
𝛔𝐜𝐛 𝐡
193
Figure 5.11 f(
) vs ϴ(rad) for Existing CP Model (CP-S Model).
Figure 5.12 VOPSC/VCP vs Cylindrical concrete compressive strength, σc (N/mm2).
f(
𝛳)
= 𝐕𝐓𝐞𝐬𝐭
(𝟎
𝟓 𝟏−𝐜𝐨𝐬𝜭
𝛖 𝛔𝐜 𝐛
𝐡
𝐬𝐢𝐧𝜭
)
𝒇𝒚𝒌 𝐛
𝐡 𝝆𝒔
f(
vs ϴ(rad)
194
Figure 5.13 VOPSC/VCP vs Shear reinforcement ratio, ρs (%).
Figure 5.14 VOPSC/VCP vs Inclination angle of shear cracks, ϴ (rad).
195
Chapter 6
BS8110 Design Models
6.1 Introduction
In Chapter 4, the test observations, the test results, the failure mechanism and the
effect of parameters were fully described. It was noted that variations on the
ultimate shear strength was observed between the Oil Palm kernel Shell Concrete
(OPSC) beams and Normal Weight Concrete (NWC) beams, both cast with and
without shear reinforcement. Hence, in Chapter 5, two modified theoretical models
based on upper bound plastic approach were proposed for predicting the ultimate
shear capacity of Oil Palm kernel Shell Concrete (OPSC) beams cast with and without
shear reinforcement, respectively, which good agreement with test results have been
achieved
The existing BS8110 design model (BS8110-NS Model) [46] took into account the
parameter of span to effective depth ratio (a/d), longitudinal steel ratio (ρ), cube
concrete compressive strength (fcu), and effective section depth (d), for the ultimate
shear strength predictions of NWC beam cast without shear reinforcement (see
Section 2.2.1.4.1). Whilst for NWC beam cast with shear reinforcement, the existing
BS8110 model (BS8110-S Model) considered the parameter of concrete cylinder
compressive strength (fck), span to effective depth ratio (a/d) and shear
reinforcement ratio (ρs) to be the function of the ultimate shear strength predictions
(see Section 2.2.2.4.1).
196
In this chapter, investigations on the requirements for modification on shear strength
parameters are reported for both cases of beams cast with and without shear
reinforcement. From the current investigations, two BS8110 design model: BS8110-I
Model and BS8110-II Model are proposed for OPSC beam cast without and with
shear reinforcement, respectively.
For OPSC beam without shear reinforcement, BS8110-I Model modified the
parameters’ equations of span to effective depth ratio (a/d), and effective section
depth (d). Whilst for OPSC beam with shear reinforcement, BS8110-II Model
modified the parameter: span to effective depth ratio (a/d). Full detail of the
predictions models: BS8110-I Model and BS8110-II Model are presented in Section
6.2 and 6.3, respectively.
A point to note in this chapter is that the partial safety factor, for both concrete
and steel reinforcement is equal to 1 in the ultimate shear strength equation.
Furthermore, it is to be noted that the concrete strength, fcu in both the existing and
modified BS8110 design models is based on the cube compressive strength of
concrete, which were obtained from the tested 100 mm cubes specimens. The tested
100 mm cube specimens were casted from the same concrete batch with the
concrete beam specimens.
197
6.2 Beams cast without shear reinforcement
6.2.1 BS8110 design model for concrete beam without shear reinforcement,
(BS8110-I Model)
The proposing “BS8110-I” Model is developed to predict the ultimate shear
resistance of a reinforced concrete beam element cast using Oil Palm kernel Shell
(OPS) as coarse aggregate. Since a significant similarity has been observed in Section
4.2.1 for both failure mechanisms of OPSC and NWC beams cast without shear
reinforcement, the test results of OPSC beams were then compared with the
predictions of the existing BS8110 design model (BS8110-NS Model) to evaluate
whether the model is relevant (see Column 2 and 3 in Table 6.1).
Summary of the comparisons are presented in Table 6.1 (Column 5). It can be noted
that the existing model underestimated the ultimate shear strength capacity of OPSC
beam specimens cast without shear reinforcement with a mean value of 1.35 and
standard deviation of 0.16. The test results were then further evaluated with respect
to the associating parameters: span to effective depth ratio (a/d), longitudinal steel
ratio (ρ), cube concrete compressive strength (fcu), and effective section depth (d).
The results of these evaluations review that the existing BS8110 model (BS8110-NS
Model) does not give good agreement with the ultimate shear resistance of OPSC
beam specimens. Therefore, it is decided to carry out modifications to the
parameters to reflect the observations made from the test. The modifications of
parameters consist of span to effective depth ratio (a/d), and effective section depth
(d). The parameters modified are; span to effective depth ratio (a/d), and effective
section depth (d). Such modifications are required to accommodate for the variations
198
observed from tests, such as underestimations of the parameters span to effective
depth ratio, a/d ≤ 2.5, and effective section depth, d = 82 mm.
6.2.2 Modification on parameters
In was noted from Section 6.2.1 that the existing BS8110 design model (BS8110-NS
Model) underestimated the ultimate shear strength of OPSC beams cast without
shear reinforcement. Hence, further analyses were carried out to assess the
relevancy of the parameters: (1) span to effective depth ratio (a/d), (2) cube concrete
strength (fcu), (3) longitudinal steel ratio (ρ) and (4) effective section depth (d),
governing the existing BS8110 design model and to provide with appropriate
modifications, which full details are elaborated in Section 6.2.2.1 to 6.2.2.4.
6.2.2.1 Span to effective depth ratio, a/d
It can be noted from Figure 6.1 that the existing BS8110 design model (BS8110-NS
Model) underestimated the rate of increase in the ultimate shear strength of OPSC
beams as span to effective depth, a/d, decreases. Such discrepancy is believed to be
attributed to expression (Eqn 2.19.1) given by the existing BS8110 model (BS8110-NS
Model), which took into account the increment of ultimate shear strength with the
reduction of span to effective depth ratio for beams loaded with a/d ≤ 2.
In general, from the current research (Section 4.2.3.1), it is noted that the failure
modes varied for OPSC beams loaded with a/d < 2.5 and a/d ≥ 2.5, respectively. That
is, shear compression failure occurred for beams loaded with a/d < 2.5 whilst shear
failure or diagonal tension failure occurred for beams loaded with a/d ≥ 2.5.
Therefore, the existing expression was revised to be Eqn 6.1.1 to accommodate for
199
both the rate of increase in shear capacity as span to effective depth (a/d) reduces
and the two distinct failure modes observed for beams loaded with a/d < 2.5 and a/d
≥ 2.5. With the revised expression for span ratio (Eqn 6.1.1), good agreement with
test results are achieved (see Figure 6.1).
f(
) = 2.5
(
< 2.5) (Eqn 6.1.1)
6.2.2.2 Longitudinal steel ratio, ρ
It can be noted in Figure 6.2 that the shear failure loads of OPSC specimens are lower
than the NWC control specimens. Test observations also indicate that the ultimate
shear strength obtained by OPSC specimens (Specimen 16C and 20E) were lower
than those of NWC beam specimens (Specimen NWC1 and NWC4) (see Figure 4.44).
It is believed such discrepancy observed in the shear strength between NWC and
OPSC beams is due to the variations found in the fracture strength of coarse
aggregates. That is, lower fracture strength found in the OPS aggregates (see Table
2.1) would have led to lower aggregate interlocking capacity, and resulted in lower
shear resistance mobilised by OPSC beam.
However, it can be observed from Figure 6.2 that the shear failure loads of OSPC
specimens are slightly higher than the predictions derived from the existing BS8110
design model (BS8110-NS Model) (Eqn 2.19.2).Thus, the existing expression (Eqn
2.19.2) are satisfactory since the f(ρ) of the ultimate shear strength predictions
derived from the existing BS8110 design model (BS8110-NS Model) slightly
underestimated the shear failure loads of the OPSC beams. Hence, adequate
predictions of shear strength increment would be provided for the OPSC beams as
longitudinal steel ratio increases. The existing parameter longitudinal reinforcement
200
ratio’s equation (Eqn 2.19.2) is therefore adopted into the modified BS8110 design
model (BS8110-I Model) to accommodate for the increment of the ultimate shear
strength of OPSC beam as longitudinal steel ratio increases.
6.2.2.3 Cube concrete strength, fcu
It can be noted from Figure 6.3 that the shear failure loads of OPSC specimens with
respect to cube concrete strength parameter, f(fcu) were observed to be lower to
those of NWC control specimens. Observations found from test indicate that the
ultimate shear strength obtained by OPSC beam specimens (Specimen 16C and F1)
were lower than those of NWC control specimens (Specimen NWC2 and NWC3) (see
Figure 4.46). It is believed that the lower shear failure loads of OPSC beams is
believed due to the lower fracture strength found in the OPS aggregates (see Table
2.1) would have led to shear stress to be transferred across the shear cracks, and
resulted in lower shear resistance mobilised by OPSC beam.
However, it can be noted from Figure 6.3 that the shear failure loads of OPSC
specimens with respect to the cube concrete strength f(fcu) are slightly higher in
comparison to the predictions derived from the existing BS8110 model (BS8110-NS
Model) (Eqn 2.19.3). Since the predictions derived from the existing BS8110 design
model (BS8110-NS Model) with respect to f(fcu) slightly underestimated the shear
failure loads of the OPSC beams, the existing expression are therefore acceptable.
Hence, the existing parameter cube concrete strength’s equation (Eqn 2.19.3) are
adopted into the modified BS8110 design model (BS8110-I Model) to take into
account for the increment in the ultimate shear strength of OPSC beam as the
concrete compressive strength increase.
201
6.2.2.4 Beam effective depth, d
It can be noted from Figure 6.4 that the shear failure loads of both OPSC specimens
and NWC control specimens with effective section depth, d = 82 mm (h=113 mm) are
higher compared to the existing BS8110 design model (BS8110-NS model) (Eqn
2.19.4). However, observations from test observations indicate that for beams with d
= 82mm, the ultimate shear failure loads obtained by the OPSC and NWC beams
(Specimen 12F and NWC5) are comparable with variances of 4% (see Figure 4.48).
Whilst for beams with effective depth, 165 ≤ d ≤ 167, the shear failure loads of OPSC
beam specimens were noted to be lower than those of NWC control specimens (See
Figure 6.4). It is believed that such discrepancy is due to the lower aggregate strength
found in Oil Palm kernel Shell (OPS) compared to that found in normal aggregates.
Hence, this would have led to lower aggregate interlocking capacity, and as a result,
lower ultimate shear resistance was mobilised.
Therefore, the existing equation was revised to be Eqn 6.1.2 to take into account for
the rate of increase in shear capacity with respect to the reduction in effective
section depth, d. With the revised expression for effective section depth (Eqn 6.1.2),
good agreement with test results are achieved, as shown In Figure 6.4.
f(d) =
⁄ (d in mm) (Eqn 6.1.4)
202
6.2.3 Comparisons with test results
From the modifications of parameters proposed in Section 6.2.2 for the shear
strength predictions of OPSC beams without shear reinforcement, the proposing
modified BS8110 design model (BS8110-I Model) is given as:
For a/d ≤ 2,
VRdc =
⁄
⁄
⁄
b d (Eqn 6.2)
For a/d > 2,
VRdc =
⁄
⁄
⁄
b d (Eqn 6.3)
Where,
= partial factor of material
It can be noted from Figure 6.5 to 6.8 that the modified BS8110 design model
(BS8110-I Model) (Eqn 6.2 and 6.3 for beams loaded with a/d < 2.5 and a/d ≥ 2.5,
respectively), with respect to parameters: shear span to height ratio (a/h),
longitudinal steel ratio (ρ), concrete strength (σc), and overall section depth (h),
exhibited good agreement with the test results (mean value of 1.03 and standard
deviation of 0.15 as shown in see Table 6.1 Column 6).
203
6.3 Beams cast with shear reinforcement
6.3.1 BS8110 design model for concrete beam with shear reinforcement, (BS8110-II
Model)
The proposing (BS8110-II Model) is developed to predict for the ultimate shear
resistance of a reinforced concrete beam element with shear reinforcement cast
using Oil Palm kernel Shell (OPS) as coarse aggregate. The BS8110-II model is
basically the existing upper bound BS8110 design model (BS8110-S Model) (Eqn 2.44
and 2.45) with approximate modifications to its parameters.
Since both of the OPSC and NWC beams exhibited similar failure mechanism (see
Chapter 4.3), hence, the test results were then compared with the predictions of the
existing BS8110-S model (Eqn 2.44 and Eqn 4.45) to determine whether the relevancy
of the existing model (see Column 2 and 3 in Table 6.2). The comparisons have been
summarized and presented in Column 5 of Table 6.2. It can be noted that the existing
model underestimated the ultimate shear strength capacity of OPSC beam specimens
cast with shear reinforcement with a mean value of 1.25 and standard deviation of
0.18. The results of these evaluations indicate that the existing model does not give
good agreement with the ultimate shear resistance of OPSC beam specimens. The
test results were then further evaluated with respect to the parameters (see Section
6.3.2.1 to 6.3.2.4). As a result, a modification to the parameter was carried out on the
parameters to reflect the observations derive from the analyses and test. The
parameter modified is span to depth ratio (a/d). Such modification is required to
allow better agreement to be achieved between the BS8110 design model and OPSC
beams with shear reinforcement for the increased rate of shear failure when the
specimens as the load was loaded near to the support, a/d < 2.5.
204
6.3.2 Modification on parameters
From Section 6.3.1, it was noted that the existing BS8110 design model (BS8110-S
Model) for the ultimate shear strength predictions of OPSC beam with shear
reinforcement underestimated the ultimate shear strength of the OPSC beams with
shear reinforcement. Hence, further analyses were carried out to evaluate the
relevancy of the parameters: (1) Shear reinforcement ratio (
), (2) Cube concrete
strength, (fcu) and (3) span to effective depth ratio (a/d), and to provide appropriate
modifications of the parameters as described in Section 6.3.2.1 to 6.3.2.3,
respectively.
6.3.2.1 Shear reinforcement ratio,
In general, it can be noted from Figure 6.11 that the shear failure loads of OPSC
beam specimens with respect to Shear reinforcement ratio, f(
were observed to
be slightly higher to those of NWC control samples. It is believed that higher shear
strength noted in OPSC beams is attributed to the rougher surface texture observed
in OPSC beams compared to NWC beams (See figure 4.70 and 4.71). Therefore, this
would have led to higher shear stress to be transferred across the shear cracks, and
as a result, higher shear resistance was mobilised.
However, it can be noted from Figure 6.11 that the mean shear failure loads of OPSC
beams is slightly higher than the predictions derived from the existing BS8110 design
model (BS8110-S Model). Therefore, modification was not recommended for the
parameter shear reinforcement ratio since the existing expression (Eqn 2.46.1) is
satisfactory. The existing expression (Eqn 2.46.1) is therefore adopted into the
205
proposed modified BS8110 design model (BS8110-II Model) to take into account for
the increment of ultimate shear strength of OPSC beam as the shear reinforcement
ratio increases.
6.3.2.2 Cube concrete strength, fcu
In general, it can be noted from Figure 6.12 that the shear failure loads of OPSC beam
specimens with respect to cube concrete strength parameter, f(fcu) were observed to
be slightly higher to those of NWC control samples. It is believed that such
discrepancy in shear strength between NWC and OPSC beams is attributed to the
rougher surface texture observed in OPSC beams compared to NWC beams, as
shown in Figure 4.70 and 4.71. Hence, this would have led to higher shear stress to
be transferred across the shear cracks, and as a result, higher shear resistance was
mobilised.
However, from the Figure 6.12, observation exhibit that the mean shear failure loads
of OPSC specimens with respect to the cube concrete strength f(fcu), of specimens
cast with shear reinforcement is slightly higher than the predictions derived from the
existing BS8110 design model (BS8110-S Model) (Eqn 2.46.2). Since the predictions
derived from the existing BS8110 design model (BS8110-S Model) with respect to
f(fcu) marginally underestimated the mean of shear failure loads of OPSC beams, the
existing expression are therefore acceptable. Hence, the existing parameter concrete
compressive strength’s equation (Eqn 2.46.2) are adopted into the proposed
modified BS8110 design model (BS8110-II Model) to account for the increment in the
ultimate shear strength of OPSC beam as concrete compressive strength increases.
206
6.3.2.3 Span to effective depth ratio, a/d
In general, it can be noted from Figure 6.13 that as the span to effective depth ratio
(a/d) decreases, the rate of increase of ultimate shear strength for OPSC specimens
are more pronounce than the prediction derived from the existing BS8110 design
model (BS8110-S Model) (Eqn 2.46.3). That is, the existing BS8110 design model
(BS8110-S Model) underestimated the increment of the ultimate shear strength of
OPSC beams with respect to low a/d ratio of 2.5. Such discrepancies arose due to the
existing expression given by the existing BS8110 model (BS8110-S Model), which took
into account for the rate of increment in ultimate shear strength as the span to
effective depth ratio reduces for beams loaded at a/d ≤ 2.
Therefore, the existing expression (Eqn 2.46.3) was revised to be Eqn 6.4 to allow for
better agreement with the test results for the rate of increase in shear capacity as
span to effective depth ratio (a/d) decreases. With the revised expression for span
ratio (Eqn 6.4), good agreement with test results are achieved (see Figure 6.14).
f(
) = 2.5
(
< 2.5) (Eqn 6.4)
6.3.3 Comparisons with test results
From the modifications of parameters proposed in Section 6.3.2 for the shear
strength predictions of OPSC beams with shear reinforcement, the proposing
modified BS8110 design model (BS8110-II Model) is given as:
For
VBS8110-I = [
⁄
⁄
⁄
(Eqn 6.5)
207
For
VBS8110-I = [
⁄
⁄
⁄
] b d (Eqn 6.6)
From Figure 6.15 to Figure 6.17, it can be observed that the modified BS8110 design
model based upon upper bound approach (BS8110-II Model) (Eqn 6.5 and 6.6), which
adopted the modification via the parameter’s equation of span to effective depth
(a/d), exhibited good agreement with the test results, where a mean value of 1.11
and standard deviation of 0.16 is achieved (see also Table 6.2 Column 6).
6.4 Summary
Two empirical BS8110 design models based upon the modification of existing BS8110
design models have been proposed in this chapter: BS8110-I Model for OPSC cast
without shear reinforcement and BS8110-II Model for OPSC cast with shear
reinforcement.
The BS8110-I Model were proposed for OPSC beams cast without shear
reinforcement, which resulted from the modification of parameters’ equations of the
existing BS8110 Model. The modified parameters’ equations were the span to
effective depth ratio (a/d), and the effective section depth (d), for the ultimate shear
strength predictions.
Whilst for OPSC beams cast with shear reinforcement, modified BS8110-II Model
were proposed, which were based upon the modified parameter’s equation of span
to effective depth (a/d) of the existing BS8110 Model, for the ultimate shear strength
predictions. In general, all the modified BS8110 design models have achieved good
agreement with Author’s test results for OPSC beams.
208
Table 6.1: Comparisons of shear strength predictions with respect to the test results of OPSC beams cast without shear reinforcement
1 2 3 4 5 6
Specimen No
VOPSC
(kN) VBS8110-NS
(kN)
VBS8110-I
(kN)
VOPSC VBS8110-NS
VOSPC VBS8110-I
10A 18.95 16.80 21.48 1.06 0.88
S1 21.05 18.69 22.56 1.13 0.93
12A 54.73 40.52 61.24 1.35 0.89
12B 40.00 26.02 40.83 1.48 0.98
12C 27.37 20.26 24.50 1.35 1.12
12D 25.26 20.26 24.50 1.25 1.03
12E 31.58 21.90 26.48 1.44 1.19
12F 26.31 15.22 22.04 1.73 1.19
16A 56.80 46.13 69.92 1.23 0.81
16B 42.10 30.76 46.62 1.37 0.90
16C 29.50 23.07 26.97 1.28 1.05
16D 26.32 23.07 26.97 1.14 0.94
16E 35.79 24.79 30.06 1.44 1.19
20A 73.68 52.48 78.96 1.40 0.93
20B 52.63 34.99 52.64 1.50 1.00
20C 33.68 26.24 31.58 1.28 1.07
20D 26.37 26.24 31.58 1.04 0.87
20E 35.79 26.25 33.14 1.31 1.08
AD1 58.19 49.35 74.80 1.18 0.78
AD2 32.33 24.68 29.92 1.31 1.08
F1 32.67 24.77 30.04 1.32 1.09
F2 47.41 26.60 32.26 1.78 1.47
H2 52.53 35.58 45.21 1.48 1.16
S2 36.64 25.05 31.03 1.43 1.18
Mean 1.35 1.03
S.D. 0.18 0.15
VOPSC (kN) = Ultimate shear failure load of OPSC beam specimens cast without shear
reinforcement
VBS8110-NS (kN) = Shear resistance of Existing BS8110 design Model (BS8110-NS Model)
For a/d ≤ 2, V BS8110-NS =
⁄
⁄
⁄
b d
For a/d > 2, V BS8110-NS =
⁄
⁄
⁄
b d
VBS8110-I (kN) = Shear resistance of proposing Modified BS8110 design Model (BS8110-I Model)
For a/d < 2.5, VBS8110-I=
⁄
⁄
⁄
b d
For a/d ≥ 2.5, VRdc =
⁄
⁄
⁄
b d
209
Table 6.2: Comparisons of shear strength predictions with respect to the test results of OPSC beams cast with shear reinforcement
1 2 3 4 5 6
Specimen No
VOPSC
(kN) VBS8110-S
(kN)
VBS8110-II
(kN)
VOPSC VBS8110-S
VOSPC VBS8110-II
3A 75.78 57.41 65.00 1.32 1.17
3B 88.41 59.65 67.79 1.48 1.30
3C 92.62 60.53 68.90 1.53 1.34
4A 79.99 70.94 78.53 1.13 1.02
4B 94.73 73.18 81.33 1.29 1.16
4C 107.36 74.07 82.43 1.45 1.30
5A 88.41 98.35 110.24 0.90 0.80
5B 107.36 101.86 114.63 1.05 0.94
5C 119.99 103.24 116.36 1.16 1.03
4D 101.04 78.96 88.55 1.28 1.14
4E 105.25 88.55 100.53 1.19 1.05
Mean 1.25
1.11
S.D. 0.18 0.16
VOPSC (kN) = Ultimate shear failure load of OPSC beam specimens cast with shear reinforcement
VBS8110-S (kN) = Shear resistance of Existing BS8110 design Model (BS8110-S
Model) For
VBS8110-S = [
⁄
⁄
⁄
For
VBS8110-S = [
⁄
⁄
⁄
] b d
VBS8110-II (kN) = Shear resistance of proposing Modified BS8110 design Model
(BS8110-II Model) For
VBS8110-I = [
⁄
⁄
⁄
For
VBS8110-I = [
⁄
⁄
⁄
] b d
210
Figure 6.1 f(a/d) vs a/d for Existing BS8110 design Model (BS8110-NS Model)
and Modified BS8110 design Model (BS8110-I Model).
Figure 6.2 f(ρ) vs ρ(%) for Existing BS8110 design Model (BS8110-NS Model).
f(𝝆
𝐕𝐓𝐞𝐬𝐭
𝟎 𝟏𝟖
𝐛 𝐝
𝟐𝐝𝐚⁄
𝟒𝟎𝟎
𝒅
𝟏𝟒⁄ 𝒇𝒄𝒖
𝟐𝟓
𝟏𝟑
f(𝐚 𝐝
𝐕𝐓𝐞𝐬𝐭
𝟎 𝟕𝟗
𝒃 𝒅
𝟒𝟎𝟎
𝒅
𝟏𝟒⁄
𝝆𝟏𝟑
⁄𝒇𝒄𝒖
𝟐𝟓
𝟏𝟑
211
Figure 6.3 f(fcu) vs fcu (N/mm2) for Existing BS8110 design Model (BS8110-NS
Model).
Figure 6.4 f(d) vs d (mm) for Existing BS8110 design Model (BS8110-NS Model)
and Modified BS8110 design Model (BS8110-I Model).
f(𝒇𝒄𝒖
𝐕𝐓𝐞𝐬𝐭
𝟎 𝟕𝟗
𝐛 𝐝
𝟐𝐝𝐚⁄
𝟒𝟎𝟎
𝒅
𝟏𝟒⁄ 𝝆𝟏𝟑
f(
𝐕𝐓𝐞𝐬𝐭
𝟎 𝟕𝟗
𝐛 𝐝
𝟐𝐝𝐚⁄
𝝆𝟏𝟑⁄𝒇𝒄𝒖
𝟐𝟓
𝟏𝟑
212
Figure 6.5 VOPSC/VBS8110 vs Shear span to effective section depth, a/d.
Figure 6.6 VOPSC/VBS8110 vs Longitudinal steel ratio, ρ (%).
213
Figure 6.7 VOPSC/VBS8110 vs Cube concrete strength, fcu (N/mm2).
]
Figure 6.8 VOPSC/VBS8110 vs Effective section depth, d (mm).
214
Figure 6.9 f(
vs
for Existing BS8110 design Model (BS8110-S Model)
and Modified BS8110 design Model (BS8110-II Model).
Figure 6.10 f( 1/3) vs ( ⁄
) for Existing BS8110 design Model
(BS8110-S Model).
f(𝒇𝒄𝒖𝟏 𝟑
) =
𝐕𝐓𝐞𝐬𝐭
𝟎
𝟖𝟕 𝒇𝒚𝒗 𝐀𝐬𝐰
𝐛 𝐬
𝟎 𝟕𝟗
𝐛 𝐝
𝟐𝐝𝐚⁄
𝟒𝟎𝟎
𝒅
𝟏𝟒⁄ 𝝆𝟏𝟑
f(𝑨𝒔𝒘 𝒔
) = 𝐕𝐓𝐞𝐬𝐭
(𝟎 𝟕𝟗 𝝆𝟏 𝟑𝒇𝒄𝒖
𝟐𝟓
𝟏 𝟑
√𝟒𝟎𝟎
𝒅
𝟒)
𝟎 𝟖𝟕 𝒇𝒚𝒗
𝐛 𝐬
f(
vs
215
Figure 6.11 f( vs for Existing BS8110 design Model (BS8110-S Model)
and Modified BS8110 design Model (BS8110-II Model).
Figure 6.12 VOPSC/VBS8110 vs Shear reinforcement ratio,
.
VOPSC/VBS8110 vs
f(
vs
f(𝐚 𝐝)
= 𝐕𝐓𝐞𝐬𝐭
(𝟎
𝟖𝟕 𝒇𝒚𝒗 𝐀𝐬𝐰
𝐛 𝐬
)
𝟎 𝟕𝟗 𝝆𝟏 𝟑𝒇𝒄𝒖
𝟐𝟓
𝟏 𝟑
√𝟒𝟎𝟎
𝒅
𝟒
216
Figure 6.13 VOPSC/VBS8110 vs Cube Concrete strength, fcu (N/mm2).
Figure 6.17 VOPSC/VBS8110 vs Span to effective depth ratio, a/d.
217
Chapter 7
Eurocode 2 Design Models
7.1 Introduction
The test observations, the test results, the failure mechanisms and the effect of
parameters were fully described in Chapter 4. It was noted that variations on the
ultimate shear strength do occurred between the Oil Palm kernel Shell Concrete
(OPSC) beams and Normal Weight Concrete (NWC) beams, both cast with and
without shear reinforcement. In Chapter 5 and 6, two theoretical plastic models and
two empirical BS8110 design models were presented, respectively. In Chapter 5 and
6, a model was proposed each for OPSC beams with and without shear reinforcemen
and it was noted that good agreement with the test results were achieved.
In this chapter, Eurocode 2 design model are considered for the shear strength
predictions of the OPSC beam specimens. As mentioned in Section 2.2.1.4.2, the
existing Eurocode 2 design model (EC2-NS Model) considered the shear strength
predictions to be a function of parameters: (1) shear span to effective section depth
ratio (a/d), (2) longitudinal steel ratio (ρ), (3) concrete cylindrical compressive
strength (fck), and (4) effective section depth (d), to account for common variations
that would occur in NWC beam cast without shear reinforcement. Whilst for NWC
beam cast with shear reinforcement, the existing EC2 design model (EC2-S Model)
considered the (1) concrete cylindrical compressive strength (fck), (2) inclination angle
of shear cracks (Θ), and (3) shear reinforcement ratio (ρs) as the parameters, which
218
influenced the ultimate shear resistance of NWC Beams with shear reinforcement
(see Section 2.2.2.4.2).
In this chapter, investigations on the requirements for modification on shear strength
parameters are reported for both cases of OPSC beams casting with and without
shear reinforcement. From the investigations, two empirical design models (EC2-I
Model and EC2-II Model), which are the results of modifications of the parameters,
are proposed to predict for the ultimate shear capacity of Oil Palm kernel Shell
Concrete (OPSC) beams cast without and with shear reinforcement, respectively.
For OPSC beam without shear reinforcement, EC2-I Model modified the parameters’
equations of shear span to effective section depth ratio (a/d), longitudinal steel ratio
(ρ), concrete compressive strength (fck), and effective section depth (d). Whilst for
OPSC beam with shear reinforcement, EC2-II Model modified the parameter of shear
reinforcement ratio (ρs) for the prediction of ultimate shear capacity of the beams.
Full detail of the prediction models, EC2-I Model and EC2-II Model are presented in
Section 7.2 and 7.3, respectively.
A point to note in this chapter is that the partial safety factor, for both concrete
and steel reinforcement is equal to 1 in the ultimate shear strength equation. In
addition, it is to be noted that the concrete strength, fck in both the existing and
modified Eurocode 2 design models is based on the cylindrical compressive strength
of concrete, fck. Hence, a multiplication of 0.8 to the cube compressive strength, fcu
from the test data were adopted to convert the cube size of 100 mm wide and 100
mm height to cylindrical size of 150 mm diameter and 300 mm height to obtain the
cylindrical compressive strength of concrete, fck, as suggested by Bill et. al [63] for
concrete strength conversion of 100 mm cube to 150 diameter cylindrical.
219
7.2 Beams cast without shear reinforcement
7.2.1 Eurocode 2 design model for OPSC beam without shear reinforcement,
“EC2- I model”
The proposing “EC2-I” Model is developed to predict for the ultimate shear
resistance of a reinforced concrete beam element without shear reinforcement cast
using Oil Palm kernel Shell Concrete (OPSC) as coarse aggregate.
The existing Eurocode 2 (EC2-NS Model) presented a formula for the ultimate shear
strength predictions of NWC beam without shear reinforcement. The parameters
considered by EC2-NS Model are (1) shear span to effective section depth ratio (a/d),
(2) longitudinal steel ratio (ρ), (3) concrete cylindrical compressive strength (fck), and
(4) effective section depth (d).
Since a significant similarity has been observed in Section 4.2.1 for both failure
mechanisms of OPSC and NWC beams cast without shear reinforcement, the test
results of OPSC beams were therefore compared with the predictions of the existing
EC2 Model (Eqn 2.19) to evaluate whether the existing model is relevant (see Column
2 and 3 in Table 7.1). Summary of the comparisons are presented in Table 7.1
(Column 5), which it can be noted that the existing Eurocode 2 design model (EC2-NS
Model) underestimated the ultimate shear capacity of OPSC beam specimens cast
without shear reinforcement with a mean value of 1.29 and standard deviation of
0.17. As a result, modifications were decided to be carried out to the parameters to
reflect the observation derived from the tests. The parameters modified are; span to
effective depth ratio (a/d), and effective section depth (d). Such modifications are
required to accommodate for the variations observed from tests, such as
220
underestimations of the parameters span to effective depth ratio, a/d ≤ 2.5, and
effective section depth, d = 82 mm.
7.2.2 Modification on parameters
From Section 7.2.1, it was noted that the existing Eurocode 2 model (EC2-NS Model)
underestimated the ultimate shear strength of OPSC beam cast without shear
reinforcement. As a result, further analyses were carried out to evaluate the
relevancy of the parameters: (1) span to effective section depth ratio (a/d), (2)
longitudinal steel ratio (ρ), (3) cylindrical concrete strength (fck), and (4) effective
section depth (d), which influence the shear capacity predictions of the beams.
7.2.2.1 Span to effective depth ratio, a/d
It can be noted from Figure 7.1 that as the span to effective depth ratio (a/d)
decreases, the rate of increase of ultimate shear strength for both OPSC and NWC
beam specimens are more pronounce than the prediction values derived from the
existing EC2 design model (EC2-NS Model). That is, the existing EC2 design model
(EC2-NS Model) (Eqn 2.22.1) underestimated the increment of the ultimate shear
strength with respect to a/d ratio of less than 2.5. It is believed that such discrepancy
arose due to the existing expression given by the existing EC2 model (EC2-NS Model),
which took into account the increment of ultimate shear strength for the reduction
of span to effective depth ratio for beams loaded with a/d ≤ 2 instead of a/d ≤ 2.5.
In view from the observations from experiments (Section 4.2.1), it is noted that the
failure modes for concrete beams without shear reinforcement, varied for a/d < 2.5
221
and a/d ≥ 2.5, respectively, which shear compression failure occurred at a/d < 2.5
whilst shear failure and diagonal tension failure occurred at a/d ≥ 2.5. Therefore, the
existing expression was revised to be Eqn 7.1.1 to accommodate for both the rate of
increase in shear capacity as span to effective depth (a/d) reduces and the two
distinct failure modes observed for a/d < 2.5 and a/d ≥ 2.5. With the revised
expression for span ratio (Eqn 7.1.1), good agreement with test results are achieved
(see Figure 7.1).
f(
) = 2.5
(
< 2.5) (Eqn 7.1.1)
7.2.2.2 Longitudinal steel ratio, ρ
In general, it can be noted in Figure 7.2 that shear strength of OPSC specimens with
respect to longitudinal steel ratio’s parameter, f(ρ) were observed to be lower to
those of NWC control samples as observations from tests indicate that for beams
casted with higher longitudinal steel ratio (ρ = 3.63 %) (see Figure 4.44), higher
ultimate shear strength were obtained by NWC beam (Specimen NWCE) compared to
OPSC beam (Specimen 20E). It is believed such discrepancies occurred due to the
higher aggregate impact strength provided by the gravel aggregates (See Table 2.1),
and, as a result, higher shear resistance was mobilised by NWC beam.
It can also be noted from Figure 7.2 that the shear failure loads of OPSC beams with
respect to the longitudinal steel ratio’s are slightly higher in comparison to the
predictions derived from the existing EC2 design model (EC2-NS Model) (Eqn 2.22.2).
Since the f(ρ) of the ultimate shear strength predictions derived from the existing EC2
design model (EC2-NS Model) marginally underestimated the shear failure loads of
the OPSC beams, the existing expression are therefore acceptable. That is, adequate
222
predictions of the shear strength increment with respect to the increment of
longitudinal steel ratio are provided for OPSC beams. Thus, the existing parameter
longitudinal reinforcement ratio’s equation (Eqn 2.22.2) are adopted into the
modified EC2 design model (EC2-I Model) to account for the increment of the
ultimate shear strength of OPSC beam as longitudinal steel ratio increases.
7.2.2.3 Cylindrical concrete strength, fck
In general, it can be observed that the shear strength of OPSC beam specimens
without shear reinforcements with respect to cube concrete strength parameter,
f(fcu) were observed to be lower to those of NWC control samples as observations
from tests indicate that the ultimate shear strength obtained by NWC beam
specimens (Specimen NWC2 and NWC3) were higher than those of OPSC beam
specimens (Specimen 16C and F1) (see Figure 4.46). It is believed that such
discrepancy in shear strength between NWC and OPSC beams is due to the
differences in the fracture strength of coarse aggregates. That is, higher fracture
strength found in the gravel aggregates (see Table 2.1) would have enhance the
aggregate interlocking capacity, and, as a result, higher shear resistance was
mobilised by NWC beam.
In addition, it can be noted from Figure 7.3 that the shear failure loads of OPSC
beams with respect to the cylindrical concrete strength are f(fck), are slightly higher in
comparison to the predictions derived from existing Eurocode 2 model (EC2-NS
Model) (Eqn 2.22.3). Furthermore, since the predictions derived from the existing
EC2 design model (EC2-NS Model) with respect to f(fck) marginally underestimated
the shear failure loads of the OPSC beams, the existing expression therefore
223
satisfactory. Therefore, the existing parameter concrete compressive strength’s
equation (Eqn 2.22.3) are adopted into the modified EC2 design model (EC2-I Model)
to account for the increment in the ultimate shear strength of OPSC beam as
concrete compressive strength increases.
7.2.2.4 Beam effective depth, d
In Figure 7.4, it is observed that the predictions derived from the existing EC2 design
model (EC2-NS model) (Eqn 2.22.4) with respect to effective section depth, f(k), were
lower than the shear failure loads of OPSC specimens with effective section depth, d
= 82 mm (h=113 mm). Test observations show that for d = 82mm, the ultimate shear
failure loads obtained by both beams (Specimen 12F and NWC5) are comparable
with differences of 4% (see Figure 4.49).
Whilst for OPSC specimens with effective depth, 165 ≤ d ≤167, the shear failure loads
were noted to be lower to that of NWC control specimens. Such discrepancy is
believed to be attributed to the lower aggregate strength found in Oil Palm kernel
Shell (OPS) compared to that found in normal aggregates, which in turn, would have
led to lower aggregate interlocking capacity, and as a result, lower ultimate shear
resistance could be mobilised. In addition, from Figure 7.5, for effective section
depth, d ≥ 165, it is noted that the predictions of the existing EC2 design model is
lower than shear failure loads of OPSC specimens.
Hence, the existing equation was revised to be Eqn 7.1.2 to accommodate for both
the rate of increase in shear capacity as the effective section depth, d reduces. With
the revised expression for effective section depth (Eqn 7.1.2), good agreement with
test results is achieved, as shown In Figure 7.4.
224
f(k) =
(d in mm) (Eqn 7.1.2)
7.2.3 Comparisons with test results
From the modifications of parameters proposed in Section 7.2.2 for the shear
strength predictions of OPSC beams without shear reinforcement, the proposing
modified EC2 design model (EC2-NS Model) is given as:
For a/d < 2.5,
VRdc = [0.18
(100 ρ fck)
1/3 + k1 σ cp] bw d (
) (Eqn 7.2)
For a/d ≥ 2.5,
VRdc = [0.18
(100 ρ fck)
1/3 + k1 σcp] bw d (Eqn 7.3)
Where,
k1 = 0.15
Crd,c =
, where = partial factor of concrete
It can be observed from Figure 7.5 to 7.8 that the proposing Eurocode 2 design
model (EC2-I Model) (Eqn 7.2 and 7.3 for beams loaded with a/d < 2.5 and a/d ≥ 2.5,
respectively) with respect to parameters: shear span to height ratio (a/h),
longitudinal steel ratio (ρ), concrete strength (σc), and overall section depth (h)
exhibit good agreement with the test results, in which a mean value of 1.05 and
standard deviation of 0.15 are achieved (see also Table 7.1 Column 6).
225
7.3 Beams cast with shear reinforcement
7.3.1 Eurocode 2 design model for cocnrete beam with shear reinforcement, (EC2-
II Model)
The proposing “EC2-II” Model is developed to predict for the ultimate shear
resistance of a reinforced concrete beam element with shear reinforcement cast
using Oil Palm kernel Shell Concrete (OPSC) as coarse aggregate.
The existing Eurocode 2 (EC2-S Model) presented two formulas for the predictions of
ultimate shear strength for NWC beam with shear reinforcement (see Eqn 2.48 and
Eqn 2.49). Eqn 2.47 considered the yielding of shear reinforcement via the
parameters: (1) inclination angle of shear cracks (ϴ) and (2) the shear reinforcement
ratio (
), whilst Eqn 2.48 considered the crushing of concrete compression strut via
the parameters: (1) concrete strength (2) inclination angle of shear cracks (ϴ).
Since a significant similarity has been observed in Section 4.3.1 for both failure
mechanisms of OPSC and NWC beams cast with shear reinforcement, hence, further
analyses were carried out to examine the relevancy of the existing EC2 model (EC2-S
Model) (Eqn 2.48 and 2.49) for the predictions of shear strength of OPSC beam
specimens. Comparisons were summarized and presented in Table 7.2. which it is
observed that the ultimate shear strength predictions given by the Equation 2.49
achieved good agreement with the test results of OPSC beam specimens with shear
reinforcement (see Table 7.2 Column 8) with a mean of 1.02 and standard deviation
of 0.21. Whilst for the shear strength predictions given by Equation 2.48 (see Table
7.2 Column 4), it is noted that the existing EC2 design model underestimated the
226
shear strength of OPSC beam with shear reinforcement (see Table 7.2 Column 7) with
a mean of 2.43 and standard deviation of 0.48.
7.3.2 Modification on parameter
It was noted from Section 7.3.1 that the Eqn 2.47 in the existing Eurocode 2 design
model (EC2-S Model) underestimated the ultimate shear capacity of OPSC beams
with shear reinforcement. Hence, further analysis were carried out to evaluate the
relevancy of parameters: (1) inclination angle of shear cracks (ϴ) and (2) the shear
reinforcement ratio (
), governing the shear strength predictions of EC2-S Model
and to provide with appropriate modifications (see Section 7.3.2.1 and 7.3.2.2).
7.3.2.1 Inclination angle of shear cracks, ϴ
In general, it can be noted from Figure 7.9 that the predictions derived from the
existing EC2 design model (EC2-S Model) (Eqn 2.50.1) with respect to f(ϴ) are in good
agreement with the shear failure loads of the OPSC beams. Therefore, the existing
expression (Eqn 2.50.1) are acceptable and are adopted into the proposed EC2 design
model (EC2-II Model) to account for the increment of the ultimate shear strength of
OPSC beam as inclination angle of shear cracks increases.
7.3.2.2 Shear reinforcement ratio,
It can be noted in Figure 7.10 that the prediction values derived from the existing EC2
design model (EC2-S Model) are observed to underestimate the failure loads of OPSC
specimens. Test results indicate that the shear failure loads achieved by OPSC beams
227
are slightly higher than those of NWC control specimens (see Figure 4.73). It is
believed that such discrepancy was attributed to the rougher surface texture
observed from the OSPC beams compared to NWC beams (see Figure 4.70 and 4.71).
Consequently, this would have led to higher aggregate interlocking resistance, and,
as a result, higher shear resistance was mobilised.
In view of the discrepancies noted between the test results and the existing EC2-S
Model (Eqn 2.50.2), a revised expression has been proposed to the EC2-S Model (See
Eqn 7.4) to account for the increment of shear strength observed, which would be
resulted from the increase of shear reinforcement ratio. With the revised expression
for shear reinforcement ratio (Eqn 7.4), better agreement with test results are
achieved, as shown in Figure 7.10.
f(
(Eqn 7.4)
7.3.3 Comparisons with test results
From the modifications of parameters proposed in Section 7.3.2 for the shear
strength predictions of OPSC beams with shear reinforcement, the proposing
modified EC2 design model (EC2-II Model) is given as:
VEC2-II = 0.87 (
(Eqn 7.5)
Comparisons between the modified Eurocode 2 design model (EC2-II Model) (Eqn
7.5) and the test results with respect to parameters: (1) inclination angle of shear
cracks (ϴ) and (2) the shear reinforcement ratio (
), indicate that agreement are
228
achieved (see Figure 7.11 and 7.12) (mean value of 1.10 and standard deviation of
0.21 as shown in see Table 7.2, Column 9).
7.4 Summary
Two Eurocode 2 (EC2) design models (EC2-I Model and EC2-II Model) based upon the
modification of the existing Eurocode 2 design models have been proposed in this
chapter for the ultimate shear strength predictions of OPSC beams cast with and
without shear reinforcement, respectively.
The proposed EC2-I Model took into account the parameters: span to effective
section depth ratio (a/d), cylindrical concrete strength (fck), longitudinal steel ratio (ρ)
and effective section depth (d), which each parameter were modified for the
ultimate shear strength predictions of the OPSC beams without shear reinforcement.
Whilst for OPSC beams with shear reinforcement, the proposed EC2-II Model are the
outcomes of the modified parameter of shear reinforcement ratio
) for the
ultimate shear strength predictions.
Generally, the modified EC2 design models (EC2-I Model and EC2-II Model) achieved
good agreement with the test results for OPSC beams without and with shear
reinforcement, respectively.
229
Table 7.1 Comparisons of shear strength predictions with respect to the test results of OPSC beam specimens cast without shear reinforcement
1 2 3 4 5 6
Specimen No
VOPSC
(kN) VEC2-NS
(kN)
VEC2-I
(kN)
VOPSC VEC2-NS
VOSPC VEC2-I
10A 18.95 18.53 20.23 1.02 0.94
S1 21.05 19.46 21.25 1.08 0.99
12A 54.73 42.19 57.68 1.30 0.95
12B 40.00 28.13 38.45 1.42 1.04
12C 27.37 21.09 23.07 1.30 1.19
12D 25.26 21.09 23.07 1.20 1.09
12E 31.58 22.80 24.94 1.38 1.27
12F 26.31 17.22 22.41 1.62 1.17
16A 56.80 48.04 65.87 1.18 0.86
16B 42.10 32.02 43.91 1.31 0.96
16C 29.50 24.02 26.35 1.23 1.12
16D 26.32 24.02 26.35 1.10 1.00
16E 35.79 25.82 28.32 1.39 1.26
20A 73.68 54.08 74.40 1.36 0.99
20B 52.63 37.06 49.60 1.46 1.06
20C 33.68 27.04 29.76 1.25 1.13
20D 27.37 27.04 29.76 1.01 0.92
20E 35.79 28.38 31.23 1.26 1.15
AD1 58.19 51.39 70.47 1.13 0.83
AD2 32.33 25.69 28.19 1.26 1.15
F1 32.67 25.79 28.30 1.27 1.15
F2 47.41 27.70 30.39 1.71 1.56
H2 52.53 37.13 43.52 1.41 1.21
S2 36.64 27.65 29.23 1.38 1.25
Mean 1.29 1.09
S.D. 0.17 0.16
VOPSC (kN) = Ultimate shear failure loads of OPSC beam specimens cast without shear
reinforcement
VEC2-NS (kN) = Shear resistance of Existing EC2 design model (EC2-I Model)
For a/d ≤ 2, VRdc = [0.18( √
(100 ρ fck)
1/3 + k1 σ cp] bw d (
)
For a/d> 2, VRdc = [0.18 √
(100 ρ fck)
1/3 + k1 σcp] bw d
VEC2-I (kN) = Shear resistance of proposing Modified EC2 design model (EC2-I Model)
For a/d < 2.5, VRdc = [0.18( √
(100 ρ fck)
1/3 + k1 σ cp] bw d (
)
For a/d ≥ 2.5, VRdc = [0.18 √
(100 ρ fck)
1/3 + k1 σcp] bw d
230
Table 7.2 Comparisons of shear strength predictions with respect to the test results of OPSC beams cast with shear reinforcement
1 2 3 4 5 6 7 8 9
Specimen No
Measured angle
inclination of shear cracks
(degree)
Test results
EC2-S Model
VEC-S (kN) EC2-II Model
VOPSC V EC-S
VOSPC VEC2-II
VOPSC VRd,s
VOPSC VRd,max
VOPSC
(kN) VRd,s
(kN) Eqn 2.48
VRd,max
(kN) Eqn 2.49
VEC2-II
(kN)
3A 34 75.78 36.11 80.11 79.44 2.10 0.95 0.95
3B 35 88.41 34.78 98.37 76.52 2.54 0.90 1.16
3C 40 92.62 29.03 110.65 63.86 3.19 0.84 1.45
4A 41 79.99 42.03 85.56 92.46 1.90 0.93 0.87
4B 41 94.73 42.03 103.66 92.46 2.25 0.91 1.02
4C 45 107.36 36.53 112.35 80.37 2.94 0.96 1.34
5A 38 88.41 58.47 78.63 128.64 1.51 1.12 0.69
5B 42 107.36 50.74 97.64 111.62 2.12 1.10 0.96
5C 44 119.99 47.31 105.31 104.08 2.54 1.14 1.15
4D 50 101.04 36.53 90.76 80.37 2.77 1.11 1.26
4E 53 105.25 36.53 85.49 80.37 2.88 1.23 1.31
Mean 2.43 1.02
0.97
1.10
S.D. 0.48 0.21 0.21
VOPSC (kN) = Ultimate shear capacity of the tested OPSC beam with shear reinforcement
VEC-S (kN) = Shear resistance of Existing EC2 design model (EC2-S Model)
VRd,s (kN) = Shear resistance of Existing EC2 design model (EC2-S Model), which considered the yielding of shear reinforcement
VEC2-II = 0.87 (
VRd,max (kN) = Maximum shear resistance of Existing EC2 design model (EC2-S Model),
which considered the crushing of compression struts
Vrd,max =
VEC2-II (kN) = Shear resistance of proposing Modified EC2 design model of VRd,s (EC2-II
Model)
VEC2-II = 0.87 (
231
Figure 7.1 f(a/d) vs a/d for Existing EC2 design model (EC2-NS Model) and Modified EC2 design model (EC2-I Model).
Figure 7.2 f(ρ) vs ρ(%) for Existing EC2 design model (EC2-NS Model).
f(𝝆
𝐕𝐓𝐞𝐬𝐭
𝟎 𝟏𝟖
𝐛 𝐝
𝟐𝐝𝐚⁄
𝟏 𝟐𝟎𝟎
𝒅
𝒇𝒄𝒌
𝟏𝟑
f(𝐚 𝐝
𝐕𝐓𝐞𝐬𝐭
𝟎 𝟏𝟖
𝐛 𝐝
𝐤 𝝆
𝟏𝟑⁄
𝒇𝒄𝒌
𝟏𝟑
232
Figure 7.3 f(fck) vs fck (N/mm2) for Existing EC2 design model (EC2-NS Model).
Figure 7.4 f(k) vs d (mm) for Existing EC2 design model (EC2-NS Model) and Modified EC2 design model (EC2-I Model).
f(𝒇𝒄𝒌
𝐕𝐓𝐞𝐬𝐭
𝟎 𝟏𝟖
𝐛 𝐝
𝟐𝐝𝐚⁄
𝟏 𝟐𝟎𝟎
𝐝 𝝆𝟏𝟑
f(𝐤
𝐕𝐓𝐞𝐬𝐭
𝟎 𝟏𝟖
𝐛 𝐝
𝟐𝐝𝐚⁄
𝝆𝟏𝟑⁄
𝒇𝒄𝒌
𝟏𝟑
233
Figure 7.5 VOPSC/VEC2 vs Shear span to effective section depth, a/d.
Figure 7.6 VOPSC/VEC2 vs Longitudinal steel ratio, ρ (%).
234
Figure 7.7 VOPSC/VEC2 vs Cylindrical concrete strength, fck (N/mm2).
Figure 7.8 VOPSC/VEC2 vs Effective section depth, d (mm).
235
Figure 7.9 f(cot ϴ) vs ϴ (degree) for Existing EC2 design model (EC2-S Model).
Figure 7.10 f(
) vs (
for Existing EC2 design model (EC2-S Model) and
Modified EC2 design model (EC2-II Model).
f(co
t θ
) =
𝐕𝐓𝐞𝐬𝐭
𝟎 𝟖𝟕 𝒇𝒚𝒘
𝐳 𝐀𝐬𝐰 𝐬
f(𝑨𝒔𝒘 𝒔
) =
𝐕𝐓𝐞𝐬𝐭
𝟎 𝟖𝟕 𝒇𝒚𝒘 𝐳
𝐜𝐨𝐭 𝜽
f(
) vs
f(cot θ) vs Θ (degree)
236
Figure 7.11 VOPSC/VEC2 vs Inclination of shear cracks, ϴ (degree).
Figure 7.12 VOPSC/VEC2 vs Shear reinforcement ratio,
.
VOPSC/VEC2 vs
VOPSC/VEC2 vs (degree)
ϴ (degree)
237
Chapter 8
Conclusions and Future Work
8.1 Summary of current study
In recent years, Oil Palm Shell Concrete (OPSC), which use the oil palm kernel shell
(OPS) aggregate as the full replacement for coarse aggregate, has received a great
deal of attention from researchers. Considerable amount of research have been
carried out to aid the understanding of its concrete mixture designs [1-6] and its
material properties [7-11]. However, only limited amount of works have been carried
out to aid the understanding of the OPSC structural resistance, such as bending
resistance [12-14] and shear resistance [15-16]. It is apparent that more research is
required to develop a comprehensive understanding for its structural element,
particularly in the shear transfer mechanism.
The main objective of this research was to explore the shear resistance of OPSC
beams cast with and without shear reinforcement through experimental and
analytical study. Mix designs of OPSC were proposed for structural applications. The
experimental work carried out in this research involved destructive testing of OPSC
beams and NWC beams casted with and without shear reinforcements. Three distinct
failure mechanisms were observed from the tests: the shear compression
mechanism; the diagonal tension mechanism; and the shear mechanism. The effect
of variables on the ultimate shear failure loads of OPSC beams case with and without
shear reinforcement were investigated.
238
Comparisons were carried out on the ultimate shear failure capacities and shear
failure mechanisms between the OPSC beams and NWC beams cast with and without
shear reinforcements, respectively, which it was found that the shear strength of
OPSC beams and NWC beams were comparable when the beams were tested with
respect to the variables: effective depth (for beams without shear reinforcements),
and shear reinforcement ratio and inclination angle of shear cracks (for beams with
shear reinforcements).
Since significant similarity were observed for both OPSC and NWC beams in term of
failure mechanism, the test results of OPSC were therefore compared with respect to
the theoretical plastic model, Eurocode 2 design model, and BS8110 design model, to
investigate the requirement for the model’s parameters’ modification. As results,
two models were developed each from the modification of the existing models with
respect to theoretical plastic model, Eurocode 2 design model, and BS8110 design
model, for the ultimate shear failure predictions of OPSC beams with and without
shear reinforcements, respectively. In all cases, the proposed models achieved good
agreement with the test results.
8.2 Mix Design of Oil Palm kernel Shell Concrete (OPSC)
Three mix designs had been proposed for Oil Palm kernel Shell concrete (OPSC) for
structural applications. The proposed mix designs include: 3:1:3 and 4:1:3 and 5:1:3
of Ordinary Portland Cement: Sand: OPS aggregate.
239
8.3 Failure Mechanisms and Effect of Variables on OPSC beams
The experimental work carried out in this research involved destructive testing of
twenty-four numbers of OPSC beam specimens casted without shear reinforcement
and eleven numbers of OPSC beams casted with shear reinforcement. For OPSC
beams casted without shear reinforcements, three distinct failure mechanisms were
observed from the tests: the shear compression mechanism; the diagonal tension
mechanism; and the shear mechanism. Whilst for OPSC beams casted with shear
reinforcements, shear failure mechanism was observed from the tests.
It was observed from tests that all the beam specimens cast without shear
reinforcement failed in shear mode of failure. Three modes of shear failure were
observed: shear compression failure for a/d < 2.5, diagonal tension failure and shear
failure, respectively, for a/d ≥ 2.5 for OPSC beams without shear reinforcement.
Whilst for OPSC beams with shear reinforcement, shear compression failure were
observed.
The effect of variables to the ultimate failure loads of OPSC beams with and without
shear reinforcement were investigated, respectively. For OPSC beams without shear
reinforcement, the ultimate failure loads increases with respect to the reduction of
span to depth ratio (a/d), increment of concrete strength (fcu), longitudinal steel ratio
(ρ) and section depth (h). Whilst for OPSC beams with shear reinforcement, the
ultimate failure loads increases with the inclination angle of shear cracks (ϴ),
concrete strength (fcu) and shear reinforcement spacing (s), respectively.
240
8.4 Comparisons between OPSC and NWC beams
Comparisons were carried out on the ultimate shear failure capacities and the shear
failure mechanisms between OPSC beams and NWC beams cast with and without
shear reinforcement, respectively. It was found that the ultimate shear strength of
OPSC beams and NWC beams are comparable for the parameters: section depth (for
beams without shear reinforcement), and shear reinforcement spacing and
inclination angle of shear cracks (for beams with shear reinforcement). However,
discrepancies in ultimate shear strength between the OPSC beams and NWC beams
were observed for the parameters: span to depth ratio, longitudinal steel ratio and
concrete strength (for beams without shear reinforcement) and concrete strength
(for beams with shear reinforcement).
8.5 Theoretical models
The existing plastic models: CP-NS Model and CP-S Model presented by Braestrup
[45] and Neilsen et.al [46] were developed for NWC beams without and with shear
reinforcements, respectively. Since significant similarity was observed for OPSC and
NWC beams in the failure mechanism, therefore, investigations were carried out
using the existing CP models to evaluate the relevancy of the models for the shear
resistance predictions of OPSC beams. It was found that the CP-NS Model and CP-S
Model underestimated the ultimate shear capacity of the OPSC beams cast with and
without shear reinforcements, respectively. Hence, further analytical studies were
carried out using the existing models with respect to each tested variables.
As a result, appropriate modifications were carried out as required on the existing
parameters to allow for the ultimate shear strength predictions of OPSC beams with
241
and without shear reinforcement, respectively. Two theoretical models were
proposed for predicting the ultimate shear failure load of the OPSC beams: CP-I
Model for OPSC beams without shear reinforcements and CP-II Model for OPSC
beams with shear reinforcements.
8.5.1 CP-I Model
From the analytical studies carried out by comparisons of test results with the
existing concrete plastic Model (CP-NS Model), it was found that the existing plastic
model overestimated the ultimate shear failure load of OPSC beams without shear
reinforcements with a mean value of 0.89 and standard deviation of 0.19. Therefore,
analytical studies were carried out respect to each parameter (span overall depth
ratio, longitudinal steel ratio, concrete strength and overall section depth) to
determine the requirement for modifications on the parameters.
Hence, CP-I Model, which was the results of the modification on each parameter, was
proposed for the ultimate shear strength predictions of OPSC beams without shear
reinforcements. The proposed CP-I model achieved good agreement (mean of 1.07
and standard deviation of 0.15) with the test results.
8.5.2 CP-II Model
Comparison studies were carried out between the ultimate shear strength
predictions of OPSC beams with shear reinforcements given by the existing CP-S
Model and the test results of OPSC beams with shear reinforcements. It was found
that the existing plastic model overestimated the ultimate shear failure load of OPSC
242
beams without shear reinforcements with a mean value of 0.92 and standard
deviation of 0.05. Hence, analytical studies were carried out respect to each tested
parameters (shear reinforcement ratio, concrete strength and inclination angle of
shear cracks) to determine the requirement for the modification of the parameters.
It was found that modification was required for parameter: concrete strength and
subsequently, the modified parameter was incorporated into the proposed modified
CP design model (CP-II Model) for the ultimate shear strength predictions of OPSC
beams with shear reinforcements. It was found that very good agreement between
the proposed CP-II model and the test results is achieved (mean of 1.03 and standard
deviation of 0.05).
8.6 BS8110 design models
The existing BS8110 design models (BS8110-NS Model and BS8110-S Model) are
based on the ultimate shear strength predictions of NWC beams with and without
shear reinforcements, respectively. Since significant similarity were observed for
both OPSC and NWC beams for its failure mechanism, the test results were therefore
compared with the existing BS8110 design models to evaluate the relevancy of the
model in predicting the shear failure loads of OPSC beams. It was found that these
EC2 models underestimated the ultimate shear strength of OPSC beams cast with
and without shear reinforcements, respectively. Therefore, investigations were
carried out using the existing BS8110 design models with respect to each tested
variables.
Hence, the existing BS8110 design models were modified to allow for the ultimate
shear strength predictions of OPSC beams with and without shear reinforcement,
243
respectively. Two BS8110 design models were proposed for predicting the ultimate
shear failure load of the OPSC beams: BS8110-I Model for OPSC beams without shear
reinforcements and BS8110-II Model for OPSC beams with shear reinforcements.
8.6.1 BS8110-I Model
Analytical studies were carried out using the existing BS8110 design model (BS8110-
NS Model) for the ultimate shear strength predictions of OPSC beams without shear
reinforcements, which the predicted values were compared with the test results of
OPSC specimens. It was found that the existing BS8110 design model underestimated
the ultimate shear failure load of OPSC beams without shear reinforcements with a
mean of 1.35 and standard deviation of 0.18. Therefore, further investigations were
carried out to identify the requirement for the parameters’ modification with respect
to parameters considered: (span to effective depth ratio, longitudinal steel ratio,
concrete strength and effective section depth).
It was found that modification was required for the parameters: span to effective
depth ratio (a/d), and effective section depth (d). The modified BS8110 design model
(BS8110-I Model), which incorporated both the modified parameters and unaltered
parameters, was proposed for the ultimate shear strength predictions of OPSC beams
without shear reinforcements. It was found that the proposed BS8110-I Model
achieved good agreement with the test results (mean of 1.03 and standard deviation
of 0.15).
244
8.6.2 BS8110-II Model
Comparison studies were carried out between the ultimate shear strength
predictions of OPSC beams with shear reinforcements given by the existing BS8110
design model (BS8110-S Model) and the test results of OPSC beams with shear
reinforcements, which it was found that the existing plastic model underestimated
the ultimate shear failure load of OPSC beams without shear reinforcements with a
mean value of 1.25 and standard deviation of 0.18. Hence, analytical studies were
carried out respect to each tested parameter (shear reinforcement ratio, concrete
strength and span to effective depth ratio) to determine the requirement for the
modification of parameters.
It was found that modification was required for the parameter: span to effective
depth ratio and subsequently, the modification was adopted into the proposed
BS8110-II Model for the shear strength predictions of OPSC beams with shear
reinforcements. A good agreement was found between the proposed BS8110-II
model and the test results are achieved (mean of 1.11 and standard deviation of
0.16).
8.7 Eurocode 2 design models
The existing Eurocode 2 design models (EC2-NS Model and EC2-S Model) are based
on the ultimate shear strength predictions of NWC beams with and without shear
reinforcements. Since significant similarity was observed for OPSC and NWC beams in
the failure mechanism, therefore, the relevancy of the existing Eurocode 2 design
models for the shear strength predictions of OPSC beams were evaluated. It was
found that the models underestimated the ultimate shear strength of OPSC beams
245
cast with and without shear reinforcements, respectively. Further investigations were
carried out with respect to each tested variables to determine the requirement for
the shear strength parameters’ modification.
Hence, the existing Eurocode 2 design models were modified to allow for the
ultimate shear strength predictions of OPSC beams with and without shear
reinforcement, respectively. Two Eurocode 2 design models were proposed for
predicting the ultimate shear failure load of the OPSC beams: EC2-I Model for OPSC
beams without shear reinforcements and EC2-II Model for OPSC beams with shear
reinforcements.
8.7.1 EC2-I Model
Investigations were carried out using the existing EC2 design model (EC2-NS Model)
for the ultimate shear strength predictions of OPSC beams without shear
reinforcements, which the predicted values were compared with the test results of
OPSC specimens.
It was found that the existing EC2 design model (EC2-NS Model) underestimated the
ultimate shear failure load of OPSC beams without shear reinforcements with a mean
of 1.29 and standard deviation of 0.17. Therefore, further investigations were carried
out to identify the requirement for modification with respect to the parameters. It
was found that modification were required for the parameters’ of span to effective
depth ratio (a/d) and effective section depth (d).
Upon modification, EC2-I Model, which incorporated both the modified parameters
and unaltered parameters, was proposed for the ultimate shear strength predictions
246
of OPSC beams without shear reinforcements. It was found that very good
agreement between the proposed EC2-I Model and the test results is achieved (mean
of 1.09 and standard deviation of 0.16).
8.7.2 EC2-II Model
Investigations were carried out using the existing Eurocode 2 design model (EC2-S
Model) for the shear strength predictions of OPSC beams without shear
reinforcements, which the test results achieved by OPSC beams were compared with
the shear strength predictions derived from the EC2-S Model.
It was found that the EC2-S Model, which considered the yielding of shear
reinforcement, has underestimated the ultimate shear failure loads of OPSC beams
with shear reinforcements (mean of 2.43 and standard deviation of 0.48). Hence,
further investigations were carried out on each parameter (shear reinforcement ratio
and inclination angle of shear cracks) to determine the requirement for the
parameters’ modification.
Subsequently, a modified EC2 design model (EC2-II Model) was proposed as the
results of the modification on the parameter: shear reinforcement ratio
for the
ultimate shear strength predictions of OPSC beams with shear reinforcements. It was
found that good agreement between the proposed EC2-I Model and the test results
is achieved (mean of 1.10 and standard deviation of 0.21).
247
8.8 Future work
The following work is proposed for the future,
1. Since this study has not involved uniform loading, it is proposed to carry out
experimental testing to study the effect of uniform loading on the shear
transfer mechanism of OPSC beams cast with and without shear
reinforcements.
2. Since this study has only involved small-scale model specimen testing, it is
desirable to carry out testing on larger scale model specimens, because it is
known that significant size effects are associated with shear failure.
3. Since this study has only carried out on rectangular OPSC beams with and
without shear reinforcements and promising results were noted, it is
desirable to carry out further testing on other type of structural concrete
elements, for example T beams, slabs, columns, and other concrete elements
to expand the use of OPS aggregates as coarse aggregates in concrete. With
these studies, new design equations specifically for the structural concrete
elements can be proposed if required.
248
References:
1. Okpala D.C., Palm Kernel Shell as Lightweight Aggregate in Concrete.
Construction and Building Materials, Vol.25, No.4, 1990, pp. 291-296.
2. Basri. H.B., Mannan.M.A., and Zain. M. F. M.., Concrete using waste oil palm
shells as aggregate. Cement and Concrete Research, Vol.29, 1999, pp. 619-622.
3. M.A.Mannan, C. Ganapathy, Mix design for Oil Palm Shell Concrete. Cement and
Concrete Research, Vol. 31, 2001, pp. 1323-1325.
4. Teo D.C.L., Mannan M. A., and Kurian V.J., Production of Lightweight Conrete
Using Oil Palm Shell (OPS) Aggregates. s.l., 4th International Conference on
Construction Materials: Performance, Innovations and Structural Implications.
5. Teo D.C.L., Mannan M. A., Kurian V.J., and Ganapathy C., Lightweight concrete
made from oil palm shell (OPS): Structural bond and durability properties.
Building and Environment, Vol. 42, 2007, pp. 2614-2621.
6. Alengaram U.J., and Muhit B.A.A., and Jumaat M.Z., Utilization of oil palm kernel
shell as lightweight aggregate in concrete- A review. Construction and Building
Materials, Vol. 38, 2013, pp. 161-172.
7. Mannan M.A., and Ganapathy C.,. Long-term strengths of concrete with oil palm
shell as coarse aggregates. Cement and Concrete Research, Vol. 31, 2001, pp.
1319-1321.
8. Mannan M.A,, and Ganapathy C.,. Engineering properties of concrete with oil
palm shell as coarse aggregate. Construction and Building Materials, Vol. 16,
2002, pp. 29-34.
9. Mannan M.A., Basri H.B., Zain M.F.M, and Islam M.N., Effect of curing
conditioons on the properties of OPS concrete. Building and Environment, Vol.
37, pp. 2002, 1167-1171.
10. Mannan M.A., Alexander J., Ganapathy C., and Teo D.C.L. Quality improvement
of oil palm shell (OPS) as coarse aggregate in lightweight concrete. Building and
Environment, Vol. 41, 2006, pp. 1239-1242.
249
11. Alengaram U.J, Mahmud H., and Jumaat M.Z., Comparison of mechanical and
bond properties of oil palm kernel shell concrete with normal weight concrete.
International Journal of the Pyysical Sciences, Vol.5, No.8, 2010, pp. 1231-1239.
12. Teo D.C.L., Mannan M. A., and Kurian V.J, Structural Concrete Using Oil Palm
Shell (OPS) as Lightweight Aggregate,Turkish J. Eng. Env. Sci, Vol. 30, 2006, pp.
251-257.
13. Teo D.C.L., Mannan M. A., and Kurian V.J, Flexural Behaviour of Reinforced
Lightweight Concrete Beams Made with Oil Palm Shell (OPS). Journal of
Advanced Concrete Technology, Vol. 4, No.3, 2006, pp. 459-468.
14. Alengaram U.J, Mahmud H., and Jumaat M.Z., Ductility Behaviour of Reinforced
Palm Kernel Shell Concrete Beams. European Journal of Scientific Research, Vol.
23, No.3, 2008, pp. 406-420.
15. Jumaat M.Z., Alengaram U. J, and Mahmud H.., Shear strength of oil palm shell
foamed concrete beams. Materials and Design, Vol. 30, 2009, pp. 2227-2236.
16. Alengaram U.J., Jumaat M.Z., Mahmud H., and Fayyadh M.M.. Shear behaviour
of reinforced palm kernel shell concrete beams. Construction and Building
Mateials, Vol. 25, 2011, pp. 2918-2927.
17. Choong M.Y., Waste not the palm oil biomass, The Star Online, 27 March 2012.
18. Ritter, W. , Die Bauweise Hennebique.” Schweizerische Bauzeitung , Zurich,