SHEAR RESISTANCE ON EPS GEOFOAM BLOCK SURFACES Dimitrios K. Atmatzidis 1 , Emmanuel G. Missirlis 2 and Elias B. Theodorakopoulos 3 ABSTRACT Direct shear tests were conducted in order to quantify the shear resistance at geofoam-geofoam, geofoam– geosynthetics, and geofoam-soils interfaces. EPS geofoam samples were obtained from the surfaces of blocks with nominal densities of 10, 15, 20 and 30kg/m 3 . Five geotextiles, five geomembranes and three soils were tested. Applied normal stresses varied from as low as 5 kPa to approximately the yield stress of the geofoam blocks. Results are presented in the form of failure envelopes having a bilinear shape as a good first order approximation. At relatively low normal stress levels, the shear resistance obtained is a purely “frictional” phenomenon while at higher normal stress levels it can be considered as purely “adhesional”. The apparent angle of friction at geofoam- geofoam, geofoam-geotextile, geofoam-geomembrane and geofoam-soil interfaces ranges from 35 o to 43 o , from 21 o to 34 o , from 16 o to 46 o and from 22.5 o to 55.5 o , respectively. The effect of geofoam density on the apparent friction angle between geofoam blocks and geosynthetics or soils is insignificant. The maximum shear resistance on any type of contact surface tested is a relatively small percentage (15% to 35%) of the shear strength of the geofoams. KEYWORDS: EPS geofoam, geotextiles, geomembranes, soils, interface, shear resistance, direct shear 1 Professor, Geotechnical Engineering Laboratory, Department of Civil Engineering, University of Patras GR–265 00 Rio, Patra, GREECE 2 Graduate Student, Geotechnical Engineering Laboratory, Department of Civil Engineering, University of Patras GR–265 00 Rio, Patra, GREECE 3 Graduate Student, Geotechnical Engineering Laboratory, Department of Civil Engineering, University of Patras GR–265 00 Rio, Patra, GREECE
Transcript
SHEAR RESISTANCE ON EPS GEOFOAM BLOCK SURFACES
Dimitrios K. Atmatzidis1, Emmanuel G. Missirlis2 and Elias B. Theodorakopoulos3
ABSTRACT Direct shear tests were conducted in order to quantify the shear resistance at geofoam-geofoam, geofoam–geosynthetics, and geofoam-soils interfaces. EPS geofoam samples were obtained from the surfaces of blocks with nominal densities of 10, 15, 20 and 30kg/m3. Five geotextiles, five geomembranes and three soils were tested. Applied normal stresses varied from as low as 5 kPa to approximately the yield stress of the geofoam blocks. Results are presented in the form of failure envelopes having a bilinear shape as a good first order approximation. At relatively low normal stress levels, the shear resistance obtained is a purely “frictional” phenomenon while at higher normal stress levels it can be considered as purely “adhesional”. The apparent angle of friction at geofoam-geofoam, geofoam-geotextile, geofoam-geomembrane and geofoam-soil interfaces ranges from 35o to 43o, from 21o to 34o, from 16o to 46o and from 22.5o to 55.5o, respectively. The effect of geofoam density on the apparent friction angle between geofoam blocks and geosynthetics or soils is insignificant. The maximum shear resistance on any type of contact surface tested is a relatively small percentage (15% to 35%) of the shear strength of the geofoams. KEYWORDS: EPS geofoam, geotextiles, geomembranes, soils, interface, shear resistance, direct shear
1 Professor, Geotechnical Engineering Laboratory, Department of Civil Engineering, University of Patras GR–265 00 Rio, Patra, GREECE 2 Graduate Student, Geotechnical Engineering Laboratory, Department of Civil Engineering, University of Patras GR–265 00 Rio, Patra, GREECE 3 Graduate Student, Geotechnical Engineering Laboratory, Department of Civil Engineering, University of Patras GR–265 00 Rio, Patra, GREECE
INTRODUCTION Major applications of expanded polystyrene (EPS geofoam) products include construction of light-weight embankments or fills, improvement of slope stability, reduction of lateral earth pressures on retaining structures, protection of utilities and thermal insulation of foundations and highway or airport pavements. Due to the nature and size of such construction projects, geofoam blocks are placed in contact to each other as well as in contact with other materials such as geosythetics, soils, coarse aggregates and concete. Accordingly the internal and/or the overall stability of a structure may be governed by the interaction mechanisms at the interfaces between geofoam blocks or geofoam blocks and other materials. However, pertinent information is very limited in available literature. Kuroda et al. (1996) processed data from shaking table tests and computed an apparent friction angle equal to 31o between geofoam blocks with nominal density of 20kg/m3. Hotta et al. (1996) have recommended the use of a design value of about 27o for the apparent friction angle between geofoam blocks and soils. Horvath (1995) summarized the results of other investigations and reported that the apparent friction angle between geofoam blocks ranges between 27o and 35o and is independent of nominal density and applied normal stress. GRC (2001) reports that according to results obtained by Sheeley (2000), the apparent angle friction at dry or wet interfaces between geofoam blocks with nominal densities of 20kg/m3 and 30kg/m3 under normal stresses up to 25kPa ranges from to 37o to 40o. Finally, for normal stresses up to 25kPa, the same source (GRC, 2001; Sheeley, 2000) reports apparent friction angle of 45o at the interface between geofoam and rough HDPE, which is reduced to about 39o for normal stresses of about 45kPa, 16o at geofoam-smooth HDPE interfaces, and 35o at geofoam PVC interfaces. The information presented herein is part of an extensive experimental investigation of the mechanical properties and behavior of commercially produced EPS geofoam blocks. Scope of this presentation is to offer additional information on the shear resistance at the interfaces between geofoam blocks as well as between geofoam blocks and geotextiles, geomembranes and soils. MATERIALS AND EXPERIMENTAL PROCEDURES The shear resistance at the interface between EPS geofoam blocks, EPS geofoam blocks and geosynthetics and EPS geofoam blocks and soils was quantified by conducting direct shear tests. Commercially produced EPS geofoam blocks measuring 2.5m Χ 1.0m X 0.5m were obtained for the purposes of the investigation reported herein. The blocks had a nominal density of 10, 15, 20 and 30 kg/m3. Samples obtained from these blocks are referred to in this text using the symbol EPS and the nominal density (i.e. EPS 20). Typical results of unconfined compression tests on 50mm cube samples at a stain rate of 10%/minute are presented in Figure 1 and average values for yield stress, compressive strength and initial modulus of elasticity are summarized in Table 1. These results are in very good agreement with the range of values expected for EPS geofoam (Horvath, 1995; Duskov, 1997; PES, 1997; BASF, 1998). Presented also in Table 1 are shear strength values which were obtained by direct shear testing of relatively thin (10mm) samples and are within the range of values reported in available literature (Horvath, 1995; BASF 1998). The interface shear resistance between EPS geofoam blocks and geosynthetics was measured for five different geotextiles and five different geomembranes. The geotextiles group included one nonwoven needle punched product, two nonwoven thermally bonded products and two woven products. The geomembranes group included three HDPE products, one PVC product and one PP product. These products were selected in order to cover a relatively wide range of frequently used products in terms of polymer type, manufacturing process and surface roughness. Brief descriptions of these geosynthetics are presented in Table 2. The soils tested were a laboratory prepared clay, a medium sand and a fine gravel. The soil classified as clay was prepared by mixing kaolinite (liquid and plastic limits equal to 43 and 26, respectively) with distilled water and
curing for 24 hours. As placed in the shear box, the clay had void ratio of 1.1, water content of 35% and cohesion equal to 14kPa. The sand used had subangular grains with sizes between 0.60mm and 0.85mm, was placed in the shear box at a void ratio of 0.65 and had an angle of internal friction, as measured by direct shear testing, of 46o at this void ratio. The fine gravel had angular grains with sizes between 4.75mm and 9.52mm, was placed in the shear box at a void ratio of 0.72 and had an angle of internal friction of 49o, as measured by direct shear testing, at this void ratio. Interface shear resistance was measured by conducting direct shear tests using 100mm and 300mm square shear boxes. All EPS geofoam samples were cut and shaped using hot wires, as shown in Figure 2. In order to simulate field conditions, all samples were obtained from the outer surfaces of the EPS blocks. Thus, the as-produced roughness and shape of the EPS block surfaces was retained. Shown schematically in Figure 3 is the configuration of samples in the direct shear box. When testing for shear resistance at the interface between EPS geofoam blocks, the interface did not coincide with the shear plane defined by the two parts of the shear box because of the compressibility of the geofoam samples. To overcome this deficiency, the upper EPS geofoam sample was reduced in length, in the direction of shearing, by an amount equal to the maximum displacement between the two parts of the shear box. The applied shear rate was 1.0mm/min for all tests conducted. The applied normal stresses ranged from as low as 5 kPa to approximately the yield stress of each EPS geofoam. With the exception of shear resistance tests on EPS geofoam-clay interaces, all test were conducted with dry interfaces. The results obtained are presented herein in the form of failure envelopes (applied normal stress-maximum shear resistance). For most, if not all, of the failure envelopes obtained, a bilinear shape is a good first order approximation. SHEAR RESISTANCE AT EPS GEOFOAM INTERFACES Presented in Figure 4 are the failure envelopes obtained from direct shear tests at the interfaces between geofoam blocks. It can be observed that the shear resistance increases in proportion to the increase of the applied normal stress up to a “limit” value of the normal stress and remains practically constant thereafter. Accordingly, the first segment of the bilinear failure envelope indicates a purely “frictional” phenomenon and the second segment a purely “adhesional” phenomenon. The observed limiting value of the applied normal stress ranges from 17kPa to 80kPa, increases with increasing geofoam nominal density, and corresponds to about 30% to 60% of the measured yield stress in unconfined compression. The initial segment of the failure envelope indicates that the apparent friction angle increases with increasing nominal density and attains values equal 35o, 36o, 40o and 43o for EPS10, EPS15, EPS20 and EPS30, respectively. Compared to results obtained by other researchers, the values for EPS20 and EPS30 are higher by a few degrees. The second (final) segment of the failure envelopes yields values which increase with increasing nominal density and range from 11.5kPa to 77.7kPa. Accordingly, the maximum shear resistance which may develop at the interface between geofoam blocks corresponds approximately to 15% to 35% of the shear strength of the geofoam blocks. This indicates the need to use binder plates in order to avoid relative movement between adjacent geofoam blocks. SHEAR RESISTANCE AT EPS GEOFOAM-GEOSYNTHETICS INTERFACES The results presented in Figure 5 indicate that, for most of the geotextiles and geomembranes tested, the bilinear failure envelope is a good first order approximation. In some cases, it appears that the experimental data could be fitted better by a failure envelope which would have a transitional, curved, part between the purely frictional and the purely adhesional segments. However, the bilinear interpretation was selected for the purposes of this presentation. It should be noted that the results presented in Figure 5 are limited to interfaces between the geosynthetics and EPS20 in order to exclude the possible effects of geofoam nominal density.
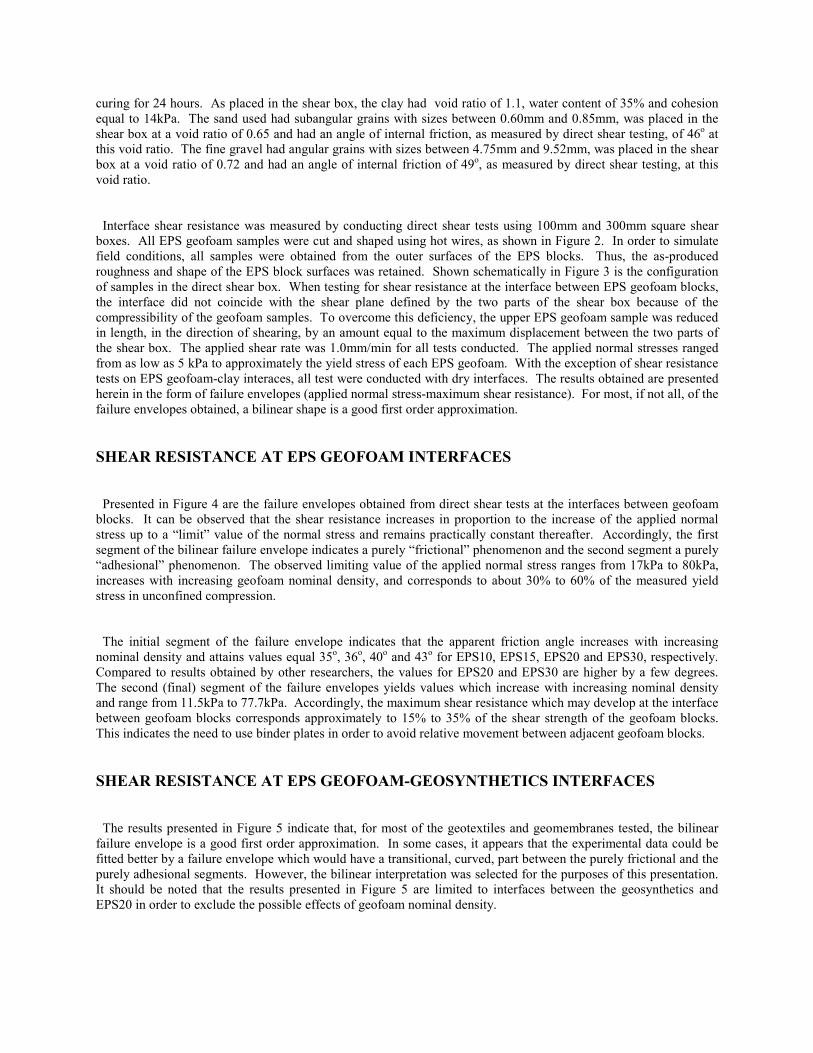
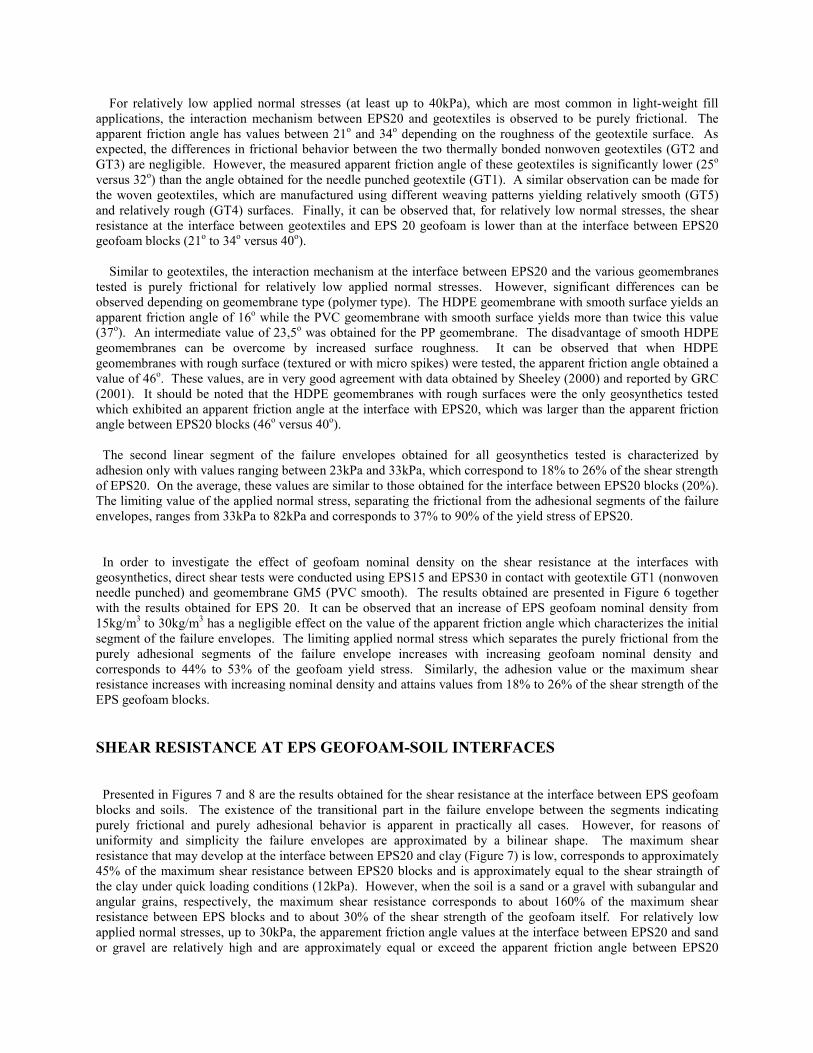
For relatively low applied normal stresses (at least up to 40kPa), which are most common in light-weight fill applications, the interaction mechanism between EPS20 and geotextiles is observed to be purely frictional. The apparent friction angle has values between 21o and 34o depending on the roughness of the geotextile surface. As expected, the differences in frictional behavior between the two thermally bonded nonwoven geotextiles (GT2 and GT3) are negligible. However, the measured apparent friction angle of these geotextiles is significantly lower (25o versus 32o) than the angle obtained for the needle punched geotextile (GT1). A similar observation can be made for the woven geotextiles, which are manufactured using different weaving patterns yielding relatively smooth (GT5) and relatively rough (GT4) surfaces. Finally, it can be observed that, for relatively low normal stresses, the shear resistance at the interface between geotextiles and EPS 20 geofoam is lower than at the interface between EPS20 geofoam blocks (21o to 34o versus 40o). Similar to geotextiles, the interaction mechanism at the interface between EPS20 and the various geomembranes tested is purely frictional for relatively low applied normal stresses. However, significant differences can be observed depending on geomembrane type (polymer type). The HDPE geomembrane with smooth surface yields an apparent friction angle of 16o while the PVC geomembrane with smooth surface yields more than twice this value (37o). An intermediate value of 23,5o was obtained for the PP geomembrane. The disadvantage of smooth HDPE geomembranes can be overcome by increased surface roughness. It can be observed that when HDPE geomembranes with rough surface (textured or with micro spikes) were tested, the apparent friction angle obtained a value of 46o. These values, are in very good agreement with data obtained by Sheeley (2000) and reported by GRC (2001). It should be noted that the HDPE geomembranes with rough surfaces were the only geosynthetics tested which exhibited an apparent friction angle at the interface with EPS20, which was larger than the apparent friction angle between EPS20 blocks (46o versus 40o). The second linear segment of the failure envelopes obtained for all geosynthetics tested is characterized by adhesion only with values ranging between 23kPa and 33kPa, which correspond to 18% to 26% of the shear strength of EPS20. On the average, these values are similar to those obtained for the interface between EPS20 blocks (20%). The limiting value of the applied normal stress, separating the frictional from the adhesional segments of the failure envelopes, ranges from 33kPa to 82kPa and corresponds to 37% to 90% of the yield stress of EPS20. In order to investigate the effect of geofoam nominal density on the shear resistance at the interfaces with geosynthetics, direct shear tests were conducted using EPS15 and EPS30 in contact with geotextile GT1 (nonwoven needle punched) and geomembrane GM5 (PVC smooth). The results obtained are presented in Figure 6 together with the results obtained for EPS 20. It can be observed that an increase of EPS geofoam nominal density from 15kg/m3 to 30kg/m3 has a negligible effect on the value of the apparent friction angle which characterizes the initial segment of the failure envelopes. The limiting applied normal stress which separates the purely frictional from the purely adhesional segments of the failure envelope increases with increasing geofoam nominal density and corresponds to 44% to 53% of the geofoam yield stress. Similarly, the adhesion value or the maximum shear resistance increases with increasing nominal density and attains values from 18% to 26% of the shear strength of the EPS geofoam blocks. SHEAR RESISTANCE AT EPS GEOFOAM-SOIL INTERFACES Presented in Figures 7 and 8 are the results obtained for the shear resistance at the interface between EPS geofoam blocks and soils. The existence of the transitional part in the failure envelope between the segments indicating purely frictional and purely adhesional behavior is apparent in practically all cases. However, for reasons of uniformity and simplicity the failure envelopes are approximated by a bilinear shape. The maximum shear resistance that may develop at the interface between EPS20 and clay (Figure 7) is low, corresponds to approximately 45% of the maximum shear resistance between EPS20 blocks and is approximately equal to the shear straingth of the clay under quick loading conditions (12kPa). However, when the soil is a sand or a gravel with subangular and angular grains, respectively, the maximum shear resistance corresponds to about 160% of the maximum shear resistance between EPS blocks and to about 30% of the shear strength of the geofoam itself. For relatively low applied normal stresses, up to 30kPa, the apparement friction angle values at the interface between EPS20 and sand or gravel are relatively high and are approximately equal or exceed the apparent friction angle between EPS20
blocks (38.5oand 55,5o versus 40o). As shown in Figure 8, an increase of the nominal density of the EPS geofoam blocks from 15kg/m3 to 30kg/m3 has a negligible effect on the apparent friction angle at the interface with sand. The value of the limiting normal stress separating the purely frictional from the purely adhesional segments of the failure envelope increases with increasing nominal density as does the maximum shear resistance that may develop at EPS20-sand interfaces. DISCUSSION When EPS geofoam blocks are used as light-weight fill, the applied normal stresses frequently do not exceed 25kPa to 30kPa or the equivalent of approximately 1.5m of soil. It has been recommended that, to minimize creep, the applied normal stresses should not exceed 50% of the yield stress of the geofoam used (Horvath, 1995; 1998; Hillman, 1996; Duskov, 1997). More recently, it has been suggested that, in order to prevent any deformations due to creep, the initial elastic deformation should not exceed 0.5% (Duskov and Houben, 2000). Based on the information presented in Figures 4 through 8, it can be observed that the interaction mechanism at all interfaces tested is purely frictional for applied normal stresses which frequently exceed the value of 30kPa. Based on the typical property values of the EPS geofoams tested during this investigation (Table 1), it can be stated that the forementional criterion of maximum allowable elastic deformation of 0.5% corresponds to applied normal stresses which do not exceed 30kPa for any of the EPS geofoams. Considering, for example, the results obtained for EPS 20, which is a material frequently used in construction, for an applied normal stress of 20kPa, and for purely frictional shear resistance at the interfaces, it can be easily computed that the shear resistance between geofoam blocks will be 18kPa, at the interfaces between geofoam and various polypropylene geotextiles will range from 8 to 14kPa, at the interfaces between geofoam and smooth HDPE,PP and PVC geomembranes will range from 6 to 15kPa, at the interface between geofoam and rough HDPE geomembranes will be approximately 21kPa and at the interface between geofoam and clay, subangular sand and angular gravel will be 8kPa, 16kPa and 29kPa, respectively. Each of these shear resistance values is a small percentage (5% to 23%) of the shear strength of EPS20. Accordingly, any shear failures will appear at interfaces between geofoam blocks or between geofoam blocks and other materials. Since it is frequently recommended that special binder plates be used between geofoam blocks, similar consideration should be given to interfaces between geofoam blocks and other construction materials. Furthermore, these values indicate that the resistance at interfaces between geofoam blocks is exceeded only by the resistance at interfaces between geofoam blocks and soils with angular grains or very rough geosynthetics. SUMMARY Based on the results of the limited experimental investigation reported herein, the following conclusions can be advanced: 1. The shear resistance at the interface between EPS geofoam blocks, EPS geofoam blocks and geosynthetics, and
EPS geofoam blocks and soils is dependent on the magnitude of the applied normal stress. 2. As a first order approximation, failure envelopes have a bilinear shape, with an initial segment indicating purely
frictional behavior and a final segment indicating purely adhesive behavior. It is recognized that a transitional segment (combined frictional and adhesive behavior) my exist.
3. For relatively low normal stresses, characteristic of light-weight fill applications, the shear resistance at all interfaces tested is purely frictional. The shear resistance at the interface between geofoam blocks can be exceeded only by the shear resistance at interfaces between geofoam blocks and soils with angular grains or geosynthetics with very rough surface.
4. Futher consideration should be given to interface shear resistance under high normal stresses in order to generate appropriate design information for such applications.
ACKNOWLEDGMENTS This research was supported by the European Union and the Hellenic General Secretariat on Research through grant YPER 97 (YP 3-67), as well as by the Hellenic Association of Expanded Polystyrene Producers and the companies MONOSTYR, MONOTEZ and UNISOL. REFERENCES BASF (1998), “Construction with Styropore”, Technical Information Leaflet, BASF A.G., Ludwigshafen, Germany. Duskov, M. (1997), “Materials Research on EPS20 and EPS15 under Representative Conditions in Pavement
Structure”, Geotextiles and Geomembranes, Vol.15, Nos. 1-3, pp. 147-181. Duskov, M. and Houben, L.J.M. (2000), “New Dutch Design Manual for Ligth-Weight Road Structures with EPS
Geofoam”, Proceedings, 2nd European Geosynthetics Conference, Bologna, Italy, Vol. 1, pp.391-395. GRC (2001), “EPS Properties – Interface Friction”, Geofoam Research Center, Syracuse University, Syracuse, New
York, USA, http://geofoam.syr.edu. Hillman, R. (1996), “Research Projects on EPS in Germany. Material Behavior and Full Scale Model Studies”,
Proceedings, International Sumposium on EPS Construction Method, Tokyo, Japan, pp. 105-115. Horvath, J.S. (1995), “Geofoam Geosynthetic”, Horvath Engineering, P.C., Scarsdale, N.Y., U.S.A. Horvath, J.S. (1998), “Mathematical Modeling of the Stress-Strain-Time Behavior of Geosynthetics Using the
Findley Equation: General Theory and Application to EPS-Block Geofoam”, Manhattan College, N.Y., Research Report No CE/GE-98-3, 35 p.
Hotta, H., Nishi, T. and Kuroda, S. (1996), “Report of Results of Assessments of Damage to EPS Embankments Caused by Earthquakes”, Proceedings, International Symposium on EPS Construction Method, Tokyo, Japan, pp. 307-318.
Kuroda, S., Hotta, H. and Yamazaki, F. (1996), “Simulation of EPS Shaking Table Test for EPS Embankment Model of Distinct Element Method”, Proceedings, International Symposium on EPS Construction Method, Tokyo, Japan, pp. 83-92.
PES (1997), “Isolare le Fondazioni con l’ EPS”, Polistirene Espanso Sinterizzato, BEMA editrice, 113p. Sheeley, M. (2000), “Slope Stabilization Utilizing Geofoam”, M.Sc. Thesis, Syracuse University, Syracuse, N.Y.,
U.S.A.
Table 1. Properties of EPS geofoam blocks
Geofoam Property EPS 10 EPS 15 EPS 20 EPS 30 Nominal density (kg/m3) Mean density (kg/m3) Density range (kg/m3) Yield stress (kPa) Compressive strength (kPa) (at 10% axial strain) Initial modulus of elasticity (kPa) Shear strength (kPa)
10
9.97
8.87 – 12.78
26.5
36.5
1250
80.2
15
15.07
13.85 – 18.74
65.5
78.0
3040
123.5
20
19.90
17.90 – 23.04
89.0
100.0
3980
129.4
30
31.97
26.80 – 37.30
186.0
210.0
6033
220.2
Table 2. Description of geosynthetics used for testing