Federico Baltar González Shedding light on the role of the prokaryotic assemblage in the biogeochemical cycles of the dark ocean Tesis Doctoral Las Palmas de Gran Canaria Marzo 2010 Departamento de Biología
Transcript
Federico Baltar González
Shedding light on the role of the prokaryotic assemblage in the biogeochemical cycles of
the dark ocean
Tesis Doctoral
Las Palmas de Gran Canaria
Marzo 2010 Departamento de Biología
D/Dª Juan Luis Gómez Pinchetti SECRETARIO/A DEL DEPARTAMENTO DE Biología DE LA UNIVERSIDAD DE LAS PALMAS DE GRAN CANARIA, CERTIFICA, Que el Consejo de Doctores del Departamento en sesión extraordinaria tomó el acuerdo de dar el consentimiento para su tramitación, a la tesis doctoral titulada “Shedding light on the role of the prokaryotic assemblage in the biogeochemical cycles of the dark ocean” presentada por el/la doctorando/a D/Dª. Federico Baltar González y dirigida por el Dr. Javier Arístegui Ruiz, el Dr. Gerhard J. Herndl y el Dr. Josep M. Gasol Piqué. Y para que así conste, y a efectos de lo previsto en el Artº 73.2 del Reglamento de Estudios de Doctorado de esta Universidad, firmo la presente en Las Palmas de Gran Canaria, a 25 de Enero de 2010
Programa de doctorado de Oceanografía. Bienio 2005-2007. Con Mención de Calidad de la ANECA. Título de la Tesis: Shedding light on the role of the prokaryotic assemblage in the biogeochemical cycles of the dark ocean (Arrojando luz sobre el papel de los procariotas en los ciclos biogeoquímicos del océano oscuro) Tesis doctoral presentada por D. Federico Baltar González para obtener el grado de Doctor por la Universidad de Las Palmas de Gran Canaria.
Dirigida por Dr. D. Javier Arístegui Ruiz Dr. D. Gerhard Herndl
Dr. D. Josep María Gasol Piqué El/la Director/a El/la Co-Director/a El/la Co-Director/a El/la Doctorando
A mis padres, hermanos y Ángela
Cover and back-cover explanation:
The proportional size of the surface epipelagic layer (< 200 m depth, bright blue) and the dark ocean (> 200 m depth, dark blue and black) is depicted in the cover to illustrate the greater importance of the dark ocean in terms of size despite the disproportional low number of studies done in the dark ocean as compared to the shallower waters. A DAPI image is also shown where no information is available concerning the prokaryotic function, community structure,… In the back-cover (after “shedding some light” with this Thesis) the DAPI image turns into a more specific picture where different kind of prokaryotes are painted interacting with each other, with particles,… Explicación de la portada y contraportada:
En la portada se ha dibujado proporcionalmente el tamaño que ocupa la capa superficial epipelágica (< 200 m de profundidad, en azul claro) y el océano oscuro (> 200 m de profundidad, de azul oscuro a negro). Esta distinción se ha hecho para ilustrar la mayor importancia del océano oscuro en lo que al tamaño se refiere al compararlo con las aguas someras. También se muestra una imagen de DAPI de la que no es posible obtener información sobre la función de los procariotas, sobre la estructura de la comunidad,… En la contraportada (después de “arrojar algo de luz” con esta Tesis) la imagen de DAPI se transforma en una más específica donde se pueden distinguir distintos tipos de procariotas interactuando entre ellos, con partículas,…
AGRADECIMIENTOS / ACKNOWLEDGEMENTS Esta tesis se ha llevado a cabo gracias a la financiación del Ministerio de Educación de una beca de Formación del Personal Universitario (AP2005-3932) en el marco del proyecto de investigación RODA (CTM 2004-06842-C03/MAR), concedido al Dr. Javier Arístegui. El trabajo de tesis se ha visto también beneficiado por campañas llevadas a cabo en el marco de los proyectos CONAFRICA (CTM2004-02319/MAR) y ARCHIMEDES (ALW-NWO; 835.20.023), este último otorgado por la División de Ciencias de la Tierra y de la Salud de la Fundación Holandesa de la Ciencia. ¡Qué alegría!....por fin aquí puedo escribir lo que me apetezca, sin necesidad de tener en cuenta la estructura general, la expresión o incluso que la cita elegida sea la correcta… Pido de antemano disculpas porque tengo tanta gente a la que agradecer que probablemente se me olvide alguien. Intentaré condensar y ser breve, dificultando aún más esta complicada tarea. Antes que nada me gustaría agradecer a mis directores de tesis, a quienes yo considero “Los tres mosqueteros” (Fig. 1). ¡Qué suerte tuve al tener a estas tres personas como directores y como amigos!. Me gustaría empezar por Javier (o Athos). ¿Qué puedo decir?. Probablemente todo lo que diga sea poco. Ha sido él quien, desde que en el verano de tercero a cuarto de carrera, cuando me atreviera a ofrecerle colaborar, siempre me ha guiado por el “buen camino”. Durante todo este tiempo me ha enseñado muchísimas cosas, no limitándose a la ciencia, sino también relacionado con la vida. Ha sido todo un ejemplo a seguir. Siempre ha confiado en mí, desde un principio, dotándome de unas herramientas valiosísimas para afrontar los desafíos que están aun por llegar. Además de todo esto (y de lo que me olvido…) hemos desarrollado una muy buena amistad, de la cual me siento muy orgulloso. Muchas gracias a mi “padre científico”. Me gustaría también agradecer mucho a Pep (o Porthos). ¡Qué grande eres Pep!...en todos los sentidos. Desde un principio siempre estuviste cuando se te necesitaba. He aprendido muchísimas cosas de ti, y muchas me gustaría también ser capaz de desarrollarlas más aún en los próximos años. Por ejemplo, tu manera, tan amena, de hacer las presentaciones…siempre soltando una coña en el momento más inesperado…Eso es precisamente algo que intentaré seguir haciendo, reduciendo esa “seriedad excesiva” (desde mi punto de vista) que parece ser inherente a este mundo de la ciencia… Intentaré seguir riéndome y disfrutando todo lo que pueda, poniendo cada cosa en su debido lugar.
Y como no agradecer a Gerhard (permítanme escribir las siguientes líneas en inglés porque van dedicadas a su persona). Thank you very much Gerhard (Aramis). I could not describe precisely enough with words all the good moments we have shared together and all the great things I have learnt from you. You have been always there, at any time and for every issue. Thank you very much not only for allowing me to visit your group in Texel and in Vienna all this 4 years, and for inviting me to join the 3 ARCHIMIDES cruises, and for allowing me to give a talk in the Euroceans
Fig. 1. “Los tres mosqueteros y D’Artagnan”. Imagen usada como diapositiva final en mis primeras comunicaciones orales en congresos
Workshop, and so on… so many things to thank you that I would need the space of another full PhD to be able to finish….Thank you so much!!!. But beside all this “scientific education” you have shown me, I really appreciate (actually even more) the great friendship we have developed during all this time. I have really enjoyed a lot the thousands of tennis matches we have played (although I never won any single match), as well as the after-match’s beers or smoothies. We still have a lot of places to conquer with our racquets … Agradecer también a toda la gente de la Facultad de Ciencias del Mar, los que están y los que se han ido, por toda su ayuda y consejos. Empezando por el laboratorio B-201: desde los 2 Carlitos, Juan Carlos, Sebastien, Pierick, Pascal, Iraida, Minerva, Nandi, Iván (y Vero), Martita, Ted, May, Claire, Paula, Mar, Valeria, Ico, Inma, Gara, Federico, Igor, Natalia, Alicia, Manuela… Por supuesto agradecer también a una persona que me conoce desde que era un renacuajo: al señor Chago… del que aprendiera una frase célebre que no se me olvidará: “No somos nadie, y menos…”, ¡qué bien lo pasamos en Miami!. Me gustaría también darle las gracias a los profesores Antonio M., Pepe M., Alonso H. y a Nacho. Los cuales siempre me alegraban el día cuando me los encontraba por el pasillo y nos poníamos al día. Por cierto Pepe, muchas gracias también por los partiditos de tenis en tu casa y por las fantásticas limonadas al acabar cada partidillo. Gracias a todos los alumnos de la Facultad de Ciencias del Mar que tuvieron que sufrirme en las prácticas de la carrera durante estos años, gracias por su paciencia y por permitírme pasármelo “pipa”. No me puedo olvidar de la gente que me acogió tan amablemente, cuando empezaba a hacer mis primeros pinitos: la gente de “Algología” (ahora conocido como Centro de Biotecnología Marina). Muchísimas gracias a Juan Luis, Antera, Emilio, Águeda, Elena, Leire, Guillermo, Sonia… por echarle una mano al pesado de Fede cada vez que le hizo falta (que era muchas veces). Aún en la Universidad, me gustaría agradecer a Francis por estar siempre ahí, desde hace más de 6 añitos, aconsejándome y, de cuando en cuando, aguantando mis chistes malos…!viva el Bienmasabe!...Por cierto, mamá, Francis es “el de la corriente de Canarias”… Sí, Francis, así es como te conoce mi madre cuando hablamos de ti… Otro que ha tenido que sufrir demasiadas veces mis chistes ha sido Pedrito…Muchas gracias Pedrito por esos descansitos que nos tomamos para coger aire fresco cuando estamos trabajando en nuestra “oficina” (vamos, la biblioteca de la Facultad)… No puedo olvidarme de la gente de Investigación y Tercer Ciclo de la ULPGC. Es especial Alejandro y Cristina. Muchísimas gracias por ser tan pacientes y serviciales. También me gustaría agradecer a Laura Alonso y a María Vila, antiguos miembros del CMIMA (Barcelona) por ayudarme siempre que me hizo falta. Gracias también a Txetxu (IMEDEA) por toda la ayuda y los truquillos que me enseño cuando yo empezaba. Muchísimas gracias también a Pere (en el IMEDEA actualmente). El señor Pere y yo coincidimos al comienzo y al final de esta andadura. Tuve el privilegio de hacer la tesina de último año de carrera con él. Y también tuve la fortuna de hacer mi última campaña con él a bordo. ¡Qué bien nos lo pasamos haciendo “ciencia” juntos! Gracias también a los UTM (Kim, Xavi, Jose, Alberto, Dulce,...), que tanto nos ayudaron en las campañas. Muchas gracias Kim por motivarme siempre y por todas las palabras bonitas que me dices cuando nos vemos. Por cierto Xavi, que rico estaba el guacamole y la tortilla “a fuego lento” que nos preparaste en tu casa…
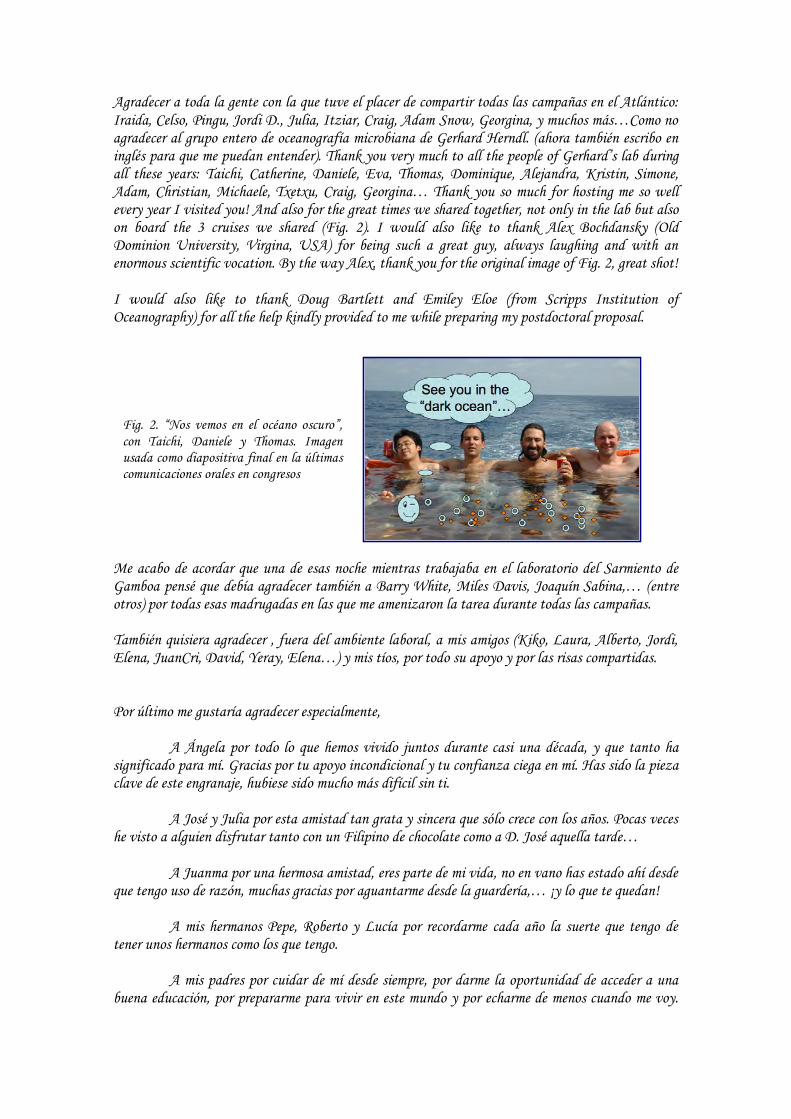
Agradecer a toda la gente con la que tuve el placer de compartir todas las campañas en el Atlántico: Iraida, Celso, Pingu, Jordi D., Julia, Itziar, Craig, Adam Snow, Georgina, y muchos más…Como no agradecer al grupo entero de oceanografía microbiana de Gerhard Herndl. (ahora también escribo en inglés para que me puedan entender). Thank you very much to all the people of Gerhard’s lab during all these years: Taichi, Catherine, Daniele, Eva, Thomas, Dominique, Alejandra, Kristin, Simone, Adam, Christian, Michaele, Txetxu, Craig, Georgina… Thank you so much for hosting me so well every year I visited you! And also for the great times we shared together, not only in the lab but also on board the 3 cruises we shared (Fig. 2). I would also like to thank Alex Bochdansky (Old Dominion University, Virgina, USA) for being such a great guy, always laughing and with an enormous scientific vocation. By the way Alex, thank you for the original image of Fig. 2, great shot! I would also like to thank Doug Bartlett and Emiley Eloe (from Scripps Institution of Oceanography) for all the help kindly provided to me while preparing my postdoctoral proposal.
Me acabo de acordar que una de esas noche mientras trabajaba en el laboratorio del Sarmiento de Gamboa pensé que debía agradecer también a Barry White, Miles Davis, Joaquín Sabina,… (entre otros) por todas esas madrugadas en las que me amenizaron la tarea durante todas las campañas. También quisiera agradecer , fuera del ambiente laboral, a mis amigos (Kiko, Laura, Alberto, Jordi, Elena, JuanCri, David, Yeray, Elena…) y mis tíos, por todo su apoyo y por las risas compartidas. Por último me gustaría agradecer especialmente, A Ángela por todo lo que hemos vivido juntos durante casi una década, y que tanto ha significado para mí. Gracias por tu apoyo incondicional y tu confianza ciega en mí. Has sido la pieza clave de este engranaje, hubiese sido mucho más difícil sin ti. A José y Julia por esta amistad tan grata y sincera que sólo crece con los años. Pocas veces he visto a alguien disfrutar tanto con un Filipino de chocolate como a D. José aquella tarde… A Juanma por una hermosa amistad, eres parte de mi vida, no en vano has estado ahí desde que tengo uso de razón, muchas gracias por aguantarme desde la guardería,… ¡y lo que te quedan! A mis hermanos Pepe, Roberto y Lucía por recordarme cada año la suerte que tengo de tener unos hermanos como los que tengo. A mis padres por cuidar de mí desde siempre, por darme la oportunidad de acceder a una buena educación, por prepararme para vivir en este mundo y por echarme de menos cuando me voy.
Fig. 2. “Nos vemos en el océano oscuro”, con Taichi, Daniele y Thomas. Imagen usada como diapositiva final en la últimas comunicaciones orales en congresos
“If I have seen further it is only by standing on the shoulders of giants.”
Sir Isaac Newton
15
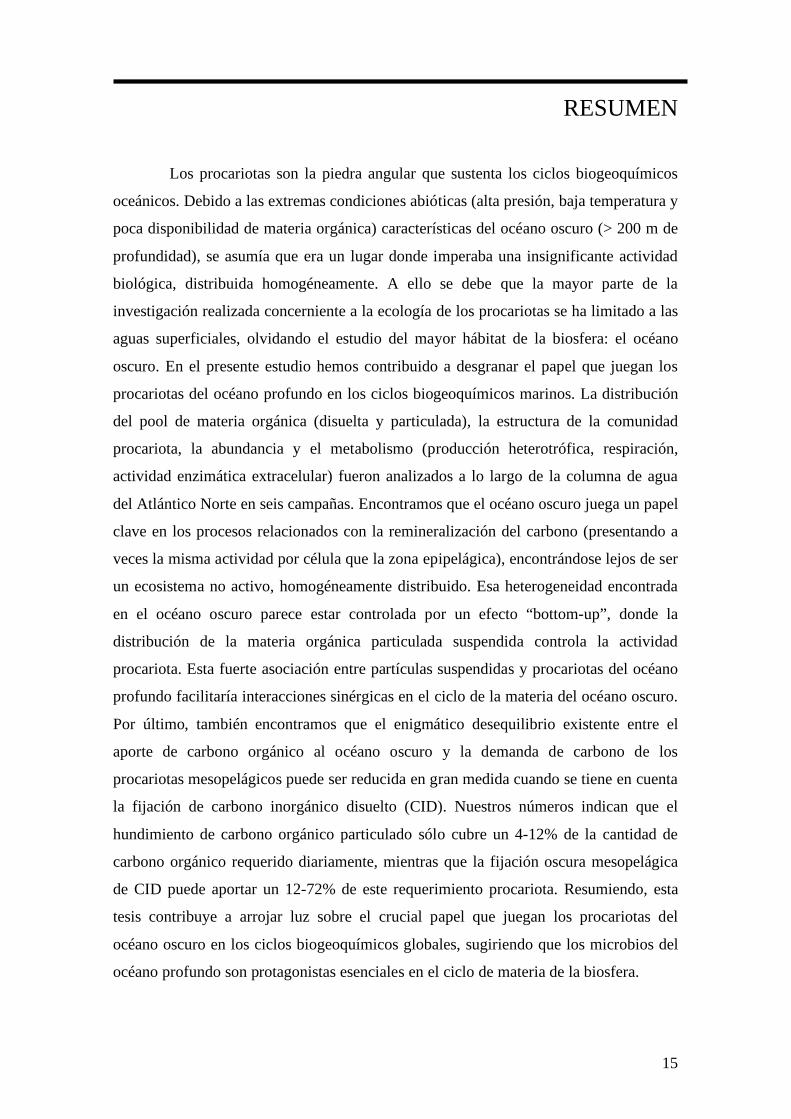
RESUMEN Los procariotas son la piedra angular que sustenta los ciclos biogeoquímicos
oceánicos. Debido a las extremas condiciones abióticas (alta presión, baja temperatura y
poca disponibilidad de materia orgánica) características del océano oscuro (> 200 m de
profundidad), se asumía que era un lugar donde imperaba una insignificante actividad
biológica, distribuida homogéneamente. A ello se debe que la mayor parte de la
investigación realizada concerniente a la ecología de los procariotas se ha limitado a las
aguas superficiales, olvidando el estudio del mayor hábitat de la biosfera: el océano
oscuro. En el presente estudio hemos contribuido a desgranar el papel que juegan los
procariotas del océano profundo en los ciclos biogeoquímicos marinos. La distribución
del pool de materia orgánica (disuelta y particulada), la estructura de la comunidad
procariota, la abundancia y el metabolismo (producción heterotrófica, respiración,
actividad enzimática extracelular) fueron analizados a lo largo de la columna de agua
del Atlántico Norte en seis campañas. Encontramos que el océano oscuro juega un papel
clave en los procesos relacionados con la remineralización del carbono (presentando a
veces la misma actividad por célula que la zona epipelágica), encontrándose lejos de ser
un ecosistema no activo, homogéneamente distribuido. Esa heterogeneidad encontrada
en el océano oscuro parece estar controlada por un efecto “bottom-up”, donde la
distribución de la materia orgánica particulada suspendida controla la actividad
procariota. Esta fuerte asociación entre partículas suspendidas y procariotas del océano
profundo facilitaría interacciones sinérgicas en el ciclo de la materia del océano oscuro.
Por último, también encontramos que el enigmático desequilibrio existente entre el
aporte de carbono orgánico al océano oscuro y la demanda de carbono de los
procariotas mesopelágicos puede ser reducida en gran medida cuando se tiene en cuenta
la fijación de carbono inorgánico disuelto (CID). Nuestros números indican que el
hundimiento de carbono orgánico particulado sólo cubre un 4-12% de la cantidad de
carbono orgánico requerido diariamente, mientras que la fijación oscura mesopelágica
de CID puede aportar un 12-72% de este requerimiento procariota. Resumiendo, esta
tesis contribuye a arrojar luz sobre el crucial papel que juegan los procariotas del
océano oscuro en los ciclos biogeoquímicos globales, sugiriendo que los microbios del
océano profundo son protagonistas esenciales en el ciclo de materia de la biosfera.
16
ABSTRACT
Prokaryotes are the cornerstone mediating the oceanic biogeochemical cycles.
Due to the typical extreme abiotic conditions (e.g. high pressure, low temperature, low
availability of organic matter) found in the dark ocean (> 200 m depth), it was
generally assumed to be a site holding negligible, homogeneously-distributed biological
activity. That is why most of the research done concerning the ecology of prokaryotes
have been carried out in surface waters, further leaving behind the study of the largest
habitat in the biosphere: the dark ocean. In this study we assessed the actual role of the
deep-sea prokaryotes in the marine biogeochemical cycles. The distribution of the
organic matter pool (dissolved and particulate), the prokaryotic assemblage structure,
abundance and metabolism (heterotrophic production, respiration, extracellular
enzymatic activity) were analyzed along the water column of the North Atlantic, in six
different research cruises. We found that the dark ocean plays a key role in the carbon
mineralization processes (sometimes being, on a per-cell level, as active as the
epipelagic waters), being far from a homogenously-distributed non-active ecosystem.
The heterogeneity found in the dark ocean seemed to be controlled by a “bottom-up”
effect, where the suspended particulate organic matter distribution modulates the
prokaryotic activity. This stronger association between suspended particles and deep-
sea prokaryotes than assumed hitherto, would facilitate synergistic interactions in the
cycling of matter in the dark ocean. Finally, we also found that the enigmatic imbalance
between the organic carbon supply to the dark ocean and the mesopelagic prokaryotic
carbon demand could be greatly reduced when taking into account the dissolved
inorganic carbon (DIC) fixation. Our numbers indicates that the sinking particulate
organic carbon could only account for 4-12% of the daily-required organic carbon, while
the mesopelagic dark fixation of DIC can supply 12% to 72% of this prokaryotic carbon
demand. Overall, this thesis contributes to shed light on the actual paramount role that
dark ocean’s prokaryotes play in the global biogeochemical cycles, suggesting that the
deep-sea microbes are principal characters in the material cycling of the biosphere.
17
PRESENTACIÓN DE LA TESIS
La presente tesis titulada Arrojando luz sobre el papel de los procariotas en los
ciclos biogeoquímicos del oceáno oscuro, resulta de la recopilación de una serie de
trabajos encuadrados dentro de los proyectos de investigación RODA (CTM 2004-
06842-C03/MAR), ARCHIMEDES (ALW-NWO; 835.20.023) y CONAFRICA
(CTM2004-02319/MAR), dirigidos los doctores Javier Arístegui, Gerhard Herndl y
Santiago Hernández León, respectivamente. El Dr. Arístegui (Universidad de Las Palmas
de Gran Canaria) ha dirigido esta tesis en co-dirección con el Dr. Gerhard Herndl
(Universidad de Viena) y el Dr. Josep Gasol Piqué (Instituto de Ciencias del Mar-CSIC
de Barcelona).
Esta tesis consta de una primera parte realizada íntegramente en inglés,
estructurada en Introducción, Objetivos, Contribuciones originales, Síntesis de
resultados y Discusión General, Conclusiones y Líneas futuras de investigación. De este
modo, el resumen y las conclusiones de la tesis se encuentran en una lengua distinta a la
lengua Española (Inglés), de acuerdo a la normativa para la obtención de la Mención
europea del Título de Doctor (BOULPGC. Art.1 Cap. 4, 5 de noviembre 2008).
La segunda parte de la tesis está escrita en castellano y, por lo tanto, consta de las
50 páginas en castellano requeridas por el Reglamento de Elaboración, Tribunal, Defensa
y Evaluación de Tesis Doctorales de la Universidad de Las Palmas de Gran Canaria
(BOULPGC. Art.2 Cap.1, 5 de noviembre 2008). Además, sigue la estructura exigida
por este Reglamento: Introducción, Objetivos, Planteamiento y Metodología,
Resultados, Discusión General, Conclusiones y Futuras Líneas de Investigación.
18
THESIS PREVIEW
This thesis entitled Shedding light on the role of the prokaryotic assemblage in
the biogeochemical cycles of the dark ocean compiles different studies carried out in the
frame of the research projects RODA (CTM 2004-06842-C03/MAR), ARCHIMEDES
(ALW-NWO; 835.20.023) and CONAFRICA (CTM2004-02319/MAR). These projects
were granted to Dr. Javier Arístegui, Dr. Gerhard Herndl and Dr. Santiago Hernández
León, respectively. Dr. Arístegui (Universidad de Las Palmas de Gran Canaria) has co-
supervised this thesis together with Dr. Gerhard Herndl (University of Viena) and Dr.
Josep Gasol Piqué (Instituto de Ciencias del Mar-CSIC, Barcelona).
This thesis is structured into a general introduction that explains the role of
prokaryotes in the oceanic ecosystems, their main carbon sources, and introduces the
main questions that are the focus of the present thesis against the actual background of
each topic. Then, the original contributions are compiled in manuscript format and are at
different stages in the peer-review publication process. Afterwards, there is a synthesis
of results and general discussion section, which precedes conclusions. Finally, further
research studies on the microbial ecology of the dark ocean are suggested.
At the end, a summary in Spanish is included, containing more than 50 pages.
This is a requirement from the PhD Thesis Regulations from the Universidad de Las
Palmas de Gran Canaria (BOULPGC. Art.2 Chap.1, November 5th 2008). Besides, in
order to obtain the Doctor Europeus Mention (BOULPGC. Art.1 Chap.4, November
5th 2008), the Summary and Conclusions have been translated into English.
19
“We have widely explored the shallow layer of the ocean, but only some robots and
a handful of men, inside especial immersion vehicles, have been in the deep waters. If
we compare these occasional incursions with needles, then we would have to imagine
a haystack of the size of our planet. It is like if some extraterrestrial organisms would
bring down to the deep ocean some cameras that could just cover a few meters. One of
these cameras films a piece of the Mongolia’s desert, and the other ones from the
Kalahari and the Antarctica. Another one reaches to a big city, for instance the New
York’s Central Park, where it films a couple of square meters of green grass and a dog
peeing beside a tree. What would then be the conclusion that the extraterrestrial
organisms would obtain? That this is an inhabited planet where it is possible to find
sporadically primitive living forms.”
Frank Schätzing, The Swarm (2004)
Índice / Contents
21
INDICE / CONTENTS RESUMEN/ ABSTRACT PRESENTACIÓN DE LA TESIS/THESIS PREVIEW I. INTRODUCTION GENERAL INTRODUCTION
Role of prokaryotes in the oceanic ecosystem
Main carbon sources for prokaryotes in the ocean
Prokaryotes in the dark ocean: the largest but least studied habitat of the biosphere
AIM & OUTLINE OF THESIS METHODOLOGY II. CHAPTER I. Strong coast–ocean and surface–depth gradients in prokaryotic assemblage structure and activity in a coastal transition zone region. III. CHAPTER II. Evidence of prokaryotic metabolism on suspended particulate organic matter in the dark waters of the subtropical North Atlantic. IV. CHAPTER III. Prokaryotic extracellular enzymatic activity in relation to biomass production and respiration in the meso- and bathypelagic waters of the (sub)tropical Atlantic. V. CHAPTER IV. High dissolved extracellular enzymatic activity in the deep Central Atlantic Ocean. VI. CHAPTER V. Mesoscale eddies: hotspots of prokaryotic activity and differential community structure in the ocean VII. CHAPTER VI. Determining prokaryotic carbon utilization in the dark ocean: growth efficiency, leucine-to-carbon conversion factors and their relation. VIII. DISCUSSION SYNTHESIS OF RESULTS AND GENERAL DISCUSSION
Dark ocean prokaryotic activity and assemblage structure: homogeneous or heterogeneous distribution?
Preferential particle-attached life mode of dark-ocean prokaryotes
Significant contribution of dark CO2 fixation to heterotrophic carbon demand in the mesopelagic Atlantic
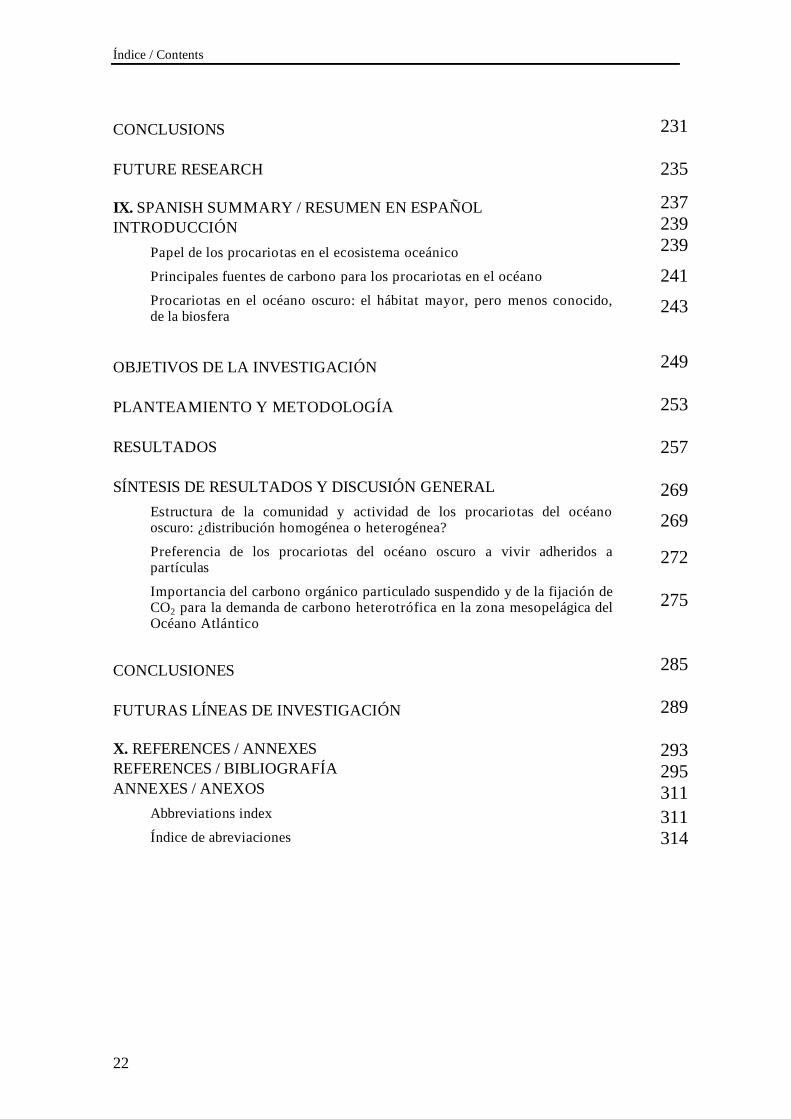
CONCLUSIONS FUTURE RESEARCH IX. SPANISH SUMMARY / RESUMEN EN ESPAÑOL INTRODUCCIÓN
Papel de los procariotas en el ecosistema oceánico
Principales fuentes de carbono para los procariotas en el océano
Procariotas en el océano oscuro: el hábitat mayor, pero menos conocido, de la biosfera
OBJETIVOS DE LA INVESTIGACIÓN PLANTEAMIENTO Y METODOLOGÍA RESULTADOS SÍNTESIS DE RESULTADOS Y DISCUSIÓN GENERAL
Estructura de la comunidad y actividad de los procariotas del océano oscuro: ¿distribución homogénea o heterogénea?
Preferencia de los procariotas del océano oscuro a vivir adheridos a partículas
Importancia del carbono orgánico particulado suspendido y de la fijación de CO2 para la demanda de carbono heterotrófica en la zona mesopelágica del Océano Atlántico
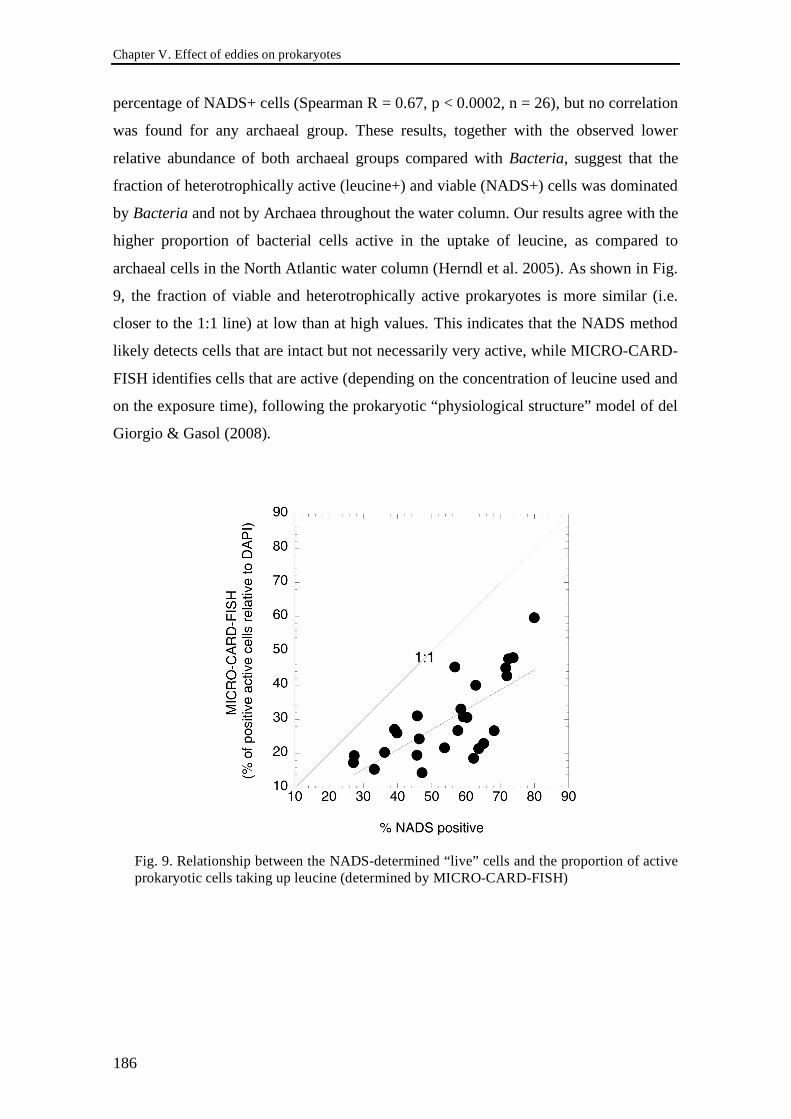
MUF-β-D-glucoside and MUF-phosphate (Hoppe 1983). The fluorescence resulting
from the cleavage of MUF or MCA and was detected spectrofluorometrically using a
Fluorolog-3 fluorometer with a MicroMax 384 microwell plate reader (Horiba) at an
excitation and emission wavelength of 365 nm and 445 nm, respectively.
Fluorescence in situ hybridization and catalyzed reporter deposition
(CARD-FISH), and MICRO-CARD-FISH (CARD-FISH combined with micro-
autoradiography) for the identification of marine Bacteria and Archaea was done
hybridizing with horseradish peroxidase (HRP)-labeled oligonucleotide probes, and
tyramide-Alexa488 for signal amplification, following the protocol described in Teira et
al. (2004)
For DNA fingerprinting of prokaryotic communities (both Bacteria and
Archaea), DNA extraction was performed using the UltraClean Soil DNA Isolation Kit
MoBio kit (MoBIO laboratories, Carlsbad, CA, USA) and the protocol of the
Introduction
39
manufacturer. Terminal-restriction fragment length polymorphism (T-RFLP) was
done as described in Moeseneder et al. (2001b). Automated ribosomal intergenic
spacer analysis (ARISA) was done according to Fisher & Triplett (1999) and Hewson
& Fuhrman (2004). Both fingerprinting techniques (T-RFLP and ARISA) were
deployed using an ABI Prism 310 capillary sequencer (Applied Biosystem) and the
resulting electropherograms were analyzed using the ABI Genescan software. The
output from the ABI Genescan software was transferred to the Fingerprinting II (Bio-
Rad) software to determine peak area and for standardization using size markers. The
obtained matrix was further analyzed with the Primer software (Primer-E) to determine
similarities of the fingerprints between samples.
Chapter I. Gradients in prokaryotic assemblage structure and activity
41
Chapter I
Strong coast–ocean and surface–depth gradients in prokaryotic assemblage structure and activity in a coastal transition zone region
F. Baltar, J. Arístegui, J. M. Gasol, S. Hernández-León, G. J. Herndl
Aquatic Microbial Ecology 50, 63-74 (2007)
Chapter I. Gradients in prokaryotic assemblage structure and activity
43
Abstract
The distribution of marine Crenarchaeota Group I, marine Euryarchaeota
Group II and some major groups of Bacteria (SAR 11, Roseobacter,
Gammaproteobacteria and Bacteroidetes) was investigated in the North Atlantic water
column (surface to 2000 m depth) along a transect from the coastal waters of the NW
African upwelling to the offshore waters of the Canary Coastal Transition Zone (CTZ).
Catalyzed reporter deposition-fluorescence in situ hybridization (CARD-FISH) was
used to describe the prokaryotic assemblages. Bulk picoplankton abundance and leucine
incorporation were determined. Pronounced changes in prokaryotic assemblage
composition were observed from the coast to the open ocean and at the deep chlorophyll
maximum (DCM) with decreasing bulk heterotrophic activity. All bacterial groups
decreased in absolute abundances from the coast to the open ocean; both archaeal
groups increased towards the open ocean. Prokaryotic abundance and activity decreased
2 and 3 orders of magnitude, respectively, from the surface to 2000 m. Prokaryotic
growth rates were high in the mesopelagic zone (~0.13 d-1). SAR11 in total
picoplankton abundance decreased from 42% in the DCM to 4% at 2000 m, while
marine Crenarchaeota Group I increased from 1% in the DCM to 39% in the oxygen
minimum layer. A clear influence of the different intermediate water masses was
observed on the bulk heterotrophic picoplankton activity, with lower leucine
incorporation rates corresponding to layers where patches of Antarctic Intermediate
Water were detected. Coast–ocean and surface–depth gradients in bulk prokaryotic
abundance and production and assemblage composition were comparable to changes
observed in basin-scale studies, pinpointing the CTZs as regions of strong variability in
microbial diversity and metabolism.
Introduction Over the past few decades it has become clear that prokaryotes are an important
component of marine plankton communities, playing a key role in mediating a range of
biogeochemical cycles (Azam et al. 1983). Prokaryotic plankton has been enumerated in
a 'black-box' approach, firmly establishing that they represent the largest pool of living
biomass in the sea (Gasol et al. 1997). With the advent of molecular biology techniques,
Chapter I. Gradients in prokaryotic assemblage structure and activity
44
marine microbiologists have been able to analyze the prokaryotic communities from a
'Gleasonian' point of view (Gleason 1926), focusing on distinct prokaryotic groups that
can be reliably identified and quantified in marine assemblages.
Small-subunit ribosomal RNA (rRNA) genes, analyzed by molecular techniques,
have become the universal phylogenetic markers and the main criteria by which
microbial plankton groups are identified (Giovannoni & Rappé 2000). Most of these
groups were first identified by sequencing 16S rRNA genes cloned from seawater (e.g.
Giovannoni et al. 1990). It soon became apparent that <20 microbial clades accounted
for most of the genes recovered (Mullins et al. 1995). Nevertheless, 16S rRNA gene-
clone libraries do not accurately reflect the abundance of microbes from particular
phylogenetic clades in the environment. Such analyses need to be complemented by
other strategies aimed at studying single populations in situ. Hybridization techniques
such as catalyzed reporter deposition-fluorescence in situ hybridization (CARD-FISH;
Pernthaler et al. 2002) became an indispensable tool in determining the abundance of
specific prokaryotic groups in the natural environment. Indeed, some groups of marine
bacteria had been known for years from their 16S rRNA gene sequences before their
abundances could be determined. Paradigmatic examples are bacteria related to the
marine SAR11 (Morris et al. 2002), SAR86 (Pernthaler et al. 2002), SAR116 (Fuchs et
al. 2005), SAR202 (Morris et al. 2004), or the SAR406 (Fuchs et al. 2005) clades.
The presence of planktonic prokaryotes in a given oceanic habitat is thought to
be determined by local environmental conditions and not by restricted dispersal
(Pedrós-Alió 2006). Members of the SAR11 clade are among the most common
prokaryotes in the marine plankton. They can contribute >50% to the total picoplankton
abundance in the surface waters of the northwestern Sargasso Sea, and 25% of
mesopelagic picoplankton assemblages (Morris et al. 2002). Bacteria related to
Roseobacter, also referred to as the SAR83 cluster (Rappe et al. 2000), are another
common component of coastal and offshore picoplankton assemblages constituting up
to 25% of marine picoplankton (González & Moran 1997, Eilers et al. 2001). The
seasonal dynamics in the abundance of Roseobacter closely follows the development of
phytoplankton biomass in the North Sea (Eilers et al. 2001). Furthermore, it has been
shown that members of these 2 clades (SAR11 and Roseobacter) efficiently utilize
dimethylsulfoniopropionate (Malmstrom et al. 2004a,b). The Bacteroidetes cluster has
been associated with upwelling events (Fandino et al. 2001, Alonso-Sáez et al. 2007a),
and members show a high ability to degrade high-molecular-weight compounds
Chapter I. Gradients in prokaryotic assemblage structure and activity
45
(Cottrell & Kirchman 2000). Members of the SAR86 lineage, related to the
Gammaproteobacteria, are characterized by high growth rates, probably efficiently
exploiting nutrient pulses (Eilers et al. 2000).
Archaea are widespread among marine prokaryotic plankton (DeLong et al.
1994, Massana et al. 1998). Quantitative studies using FISH have shown the dominance
of Crenarchaeota in meso- and bathypelagic waters, whereas Euryarchaeota were
thought to comprise less than 5 to 8% of total picoplankton abundance in deep waters of
the Pacific and the Antarctic Oceans (Karner et al. 2001, Church et al. 2003). Using
CARD-FISH, in combination with the Proteinase-K permeabilization of the archaeal
cell wall, Teira et al. (2004, 2006a,b) and Herndl et al. (2005) found higher (10 to 20%)
abundances of Euryarchaeota in deep waters of the North Atlantic Ocean than reported
by Karner et al. (2001) for the subtropical North Pacific Gyres. All these studies support
the view that diverse prokaryotic groups are linked to different environmental
conditions and, hence, changes in assemblage structure are likely to be more
pronounced in regions with strong oceanographic gradients.
Most of the studies describing variability in the composition of picoplankton
have been carried out in surface oceanic waters (e.g. Alonso-Sáez et al. 2007a). Only a
few have quantified the different groups of prokaryotes in the dark ocean. Among these,
some studies used PCR-based fingerprinting techniques (Hewson et al. 2006) to identify
components of the prokaryotic community, while others applied PCR-independent
group-level FISH. The latter, however, have used 2 or 3 prokaryotic probes targeting
Bacteria, Crenarchaeota and Euryarchaeota (Karner et al. 2001, Teira et al. 2004,
2006b, Herndl et al. 2005). Information regarding the activity of deep-water prokaryotic
communities is rather scarce compared to that of surface-water prokaryotic assemblages
(Reinthaler et al. 2006). Measurements on depressurized samples indicate a decrease in
picoplankton production of 1 to 2 orders of magnitude from the euphotic zone to the
bathypelagic waters (Reinthaler et al. 2006), declining with depth slightly more than
picoplankton abundance.
Variations in bulk prokaryotic activity may be related to changes in the
abundance of specific groups. Some studies have shown a clear link between the
distribution of the major prokaryotic groups to bulk (Massana et al. 1998) and group-
specific prokaryotic activity in the dark ocean (Teira et al. 2004, 2006b, Herndl et al.
2005). This relationship might be more evident in regions with strong environmental
gradients and relatively high picoplankton activity. Arístegui et al. (2005) measured
Chapter I. Gradients in prokaryotic assemblage structure and activity
46
high prokaryotic activities in the mesopelagic waters of the subtropical NE Atlantic, a
region characterized by strong hydrological variability, with most pronounced gradients
close to the NW African coastal upwelling (Arístegui et al. 2003).
In the present study, we report the distribution of both the bulk prokaryotic
activity and the abundance of major prokaryotic groups (marine Crenarchaeota Group
I, marine Euryarchaeota Group II, SAR 11, Roseobacter, Gammaproteobacteria and
Bacteroidetes) along a transect from the coastal waters of the NW African upwelling to
the offshore waters of the Canary region. We used CARD-FISH to determine the
composition of the prokaryotic community and relate it to bulk leucine incorporation.
We hypothesized that the contribution of marine Crenarchaeota Group I and marine
Euryarchaeota Group II to total picoplankton abundance increases along the coastal-
ocean transect in the mesopelagic waters and, overall, that the surface-depth patterns of
abundance and metabolism of Bacteria and Archaea are related to local hydrographic
conditions.
Materials and methods Location and sampling
A zonal section of 10 stations was sampled from the coastal waters of the NW
Africa upwelling (27.9°N, 13.1°W) to the offshore waters of the Canary Coastal
Transition Zone (CTZ) region (27.5° N, 15.3° W) (Fig. 1) during the CONAFRICA
cruise (22 March to 7 April 2006) on board the RV 'Hespérides'. At each station,
temperature, salinity and fluorescence were recorded down to 2000 m depth using a
SeaBird 911 plus CTD system, mounted on a General Oceanics rosette sampler,
equipped with twenty-four 12 l Niskin bottles. Samples for prokaryotic heterotrophic
production and abundance were collected at each station from 5 depths ranging from 5
to 2000 m, including the deep chlorophyll maximum (DCM; 30 to 82 m), 200 m and the
oxygen minimum zone (OMZ; 740 to 760 m). Samples for CARD-FISH were only
collected at 6 selected stations and at 3 depths (DCM, OMZ and 2000 m).
Chapter I. Gradients in prokaryotic assemblage structure and activity
47
A
B
Fig. 1. (A) Near sea-surface temperature, and (B) Sea-viewing Wide Field-of-view Sensor (SeaWiFS) chlorophyll image from 7 April 2006. Station positions (4 to 70) overlaid on maps. Note the upwelling filament extending offshore from the coast
Chapter I. Gradients in prokaryotic assemblage structure and activity
48
Prokaryotic abundance and biomass
Prokaryotic abundance was determined by flow cytometry (FCM) using a
FACSCalibur (Becton Dickinson) with a laser emitting at 488 nm wavelength. Samples
(1.5 ml) were fixed with paraformaldehyde (1% final concentration), incubated at 4°C
for 15 to 30 min and then stored frozen in liquid nitrogen until analysis. Prior to
counting the cells by FCM, 200 µl of sample was stained with a DMS-diluted SYTO-13
(Molecular Probes) stock (10:1) at 2.5 µM final concentration. Prokaryotes were
identified by their signatures in a plot of side scatter (SSC) versus green fluorescence
(FL1). High and low nucleic acid cells (H1-NA, H2-NA, L-NA) were separated in the
scatter plot (Gasol et al. 1999). H1-NA cells exhibited slightly lower SSC and higher
FL1 than L-NA cells. H2-NA cells showed high SSC and high FL1 (see Fig. 2).
Picocyanobacteria were discriminated in a plot of FL1 versus red fluorescence (FL3).
When the fluorescence signal of the prochlorophytes was very low, they were first
enumerated in an unstained sample and their abundance subtracted from the total
prokaryotic abundance determined by SYTO-13 staining. Prokaryotic carbon biomass
was estimated from prokaryotic abundance assuming a conversion factor of 12 fg C cell-
1 (Fukuda et al. 1998). A suspension of yellow-green 1 µm latex beads (106 beads ml-1)
was added as an internal standard (Polysciences). The concentration of beads was
determined under an epifluorescence microscope. Overall, picoplankton abundance
determined by FCM and by DAPI staining and epifluorescence microscopy gave very
similar abundance values (FCM = 0.99 DAPI – 0.226, R2 = 0.84, p < 0.001, n = 14).
Prokaryotic heterotrophic production
Prokaryotic heterotrophic production was estimated from the rates of protein
synthesis determined by the incorporation of tritiated leucine using the centrifugation
method (Smith & Azam 1992). 3H-Leucine (Leu, Amersham, specific activity = 171 Ci
mmol-1) was added at saturating concentration (40 nmol l-1) to 4 replicate subsamples of
1.2 ml. Duplicate controls were established by adding 120 µl of 50% trichloroacetic
acid (TCA) 10 min prior to isotope addition. The Eppendorf tubes were incubated at in
situ temperature in temperature-controlled chambers for 2 to 7 h. Incorporation of
leucine in the quadruplicate sample was stopped by adding 120 µl ice-cold 50% TCA.
Subsequently, the subsamples and the controls were kept at –20°C until centrifugation
(at ca. 12 000 g) for 20 min, followed by aspiration of the water. Finally, 1 ml of
scintillation cocktail was added to the Eppendorf tubes before determining the
Chapter I. Gradients in prokaryotic assemblage structure and activity
49
incorporated radioactivity after 24 to 48 h on a Wallac scintillation counter with
quenching correction using an external standard. Leucine incorporated into prokaryotic
biomass was converted to carbon production using the theoretical conversion factor of
1.5 kg C mol-1 Leu assuming no isotope dilution (Simon & Azam 1989). Since both
Bacteria and Archaea incorporate leucine, it is more appropriate to refer to the term
'prokaryotic heterotrophic production' instead of the commonly used 'bacterial
production' (Herndl et al. 2005).
CARD-FISH
Immediately after collecting the samples from the Niskin bottles, 10 to 40 ml
subsamples were fixed with paraformaldehyde (2% final concentration) and stored at
4°C in the dark for 12 to 18 h. The cells were collected on a 0.2 µm polycarbonate filter
(Millipore, GTTP, 25 mm filter diameter) supported by a cellulose nitrate filter
and stored in a microfuge vial at –20°C until further processing in the laboratory. Filters
for CARD-FISH were embedded in low-gelling-point agarose and incubated either with
lysozyme for the Bacteria probes Eub338-III (mixture of probes Eub338, Eub II and
Eub III; Amann et al. 1990, Daims et al. 1999), for Roseobacter using Ros537 (Eilers et
al. 2001), for Gammaproteobacteria Gam42a (Manz et al. 1992), for Bacteroidetes
CF319a (Amann et al. 1990) and for SAR11 using SAR11-441R (Morris et al. 2002), or
Proteinase-K for the marine Euryarchaeota Group II probe Eury806 and for the marine
Crenarchaeota Group I probe Cren537 (Teira et al. 2004). Filters were cut in sections
and hybridized with horseradish peroxidase (HRP)-labeled oligonucleotide probes and
tyramide-Alexa488 for signal amplification, following the protocol described in Teira et
al. (2004). Cells were counterstained with a DAPI mix: 5.5 parts Citifluor, 1 part
Vectashield (Vector Laboratories) and 0.5 parts phosphate-buffered saline (PBS) with
DAPI (final concentration 1 µg ml-1). The slides were examined under a Zeiss Axioplan
2 microscope equipped with a 100 W Hg lamp and appropriate filter sets for DAPI and
Alexa488. More than 800 DAPI-stained cells were counted per sample in a minimum of
30 fields of view. For each microscopic field, 2 different categories were enumerated:
(1) total DAPI-stained cells, (2) cells stained with the specific probe. The counting
error, expressed as the percentage of the standard error between replicates, was 2% for
DAPI counts.
Chapter I. Gradients in prokaryotic assemblage structure and activity
50
Results
Regional oceanographic settings
The stations were placed along a coast–ocean transect crossing an upwelling
filament and an offshore anticyclonic eddy centered at Stn 57 (Fig. 1A). Filament-eddy
systems have been described in previous studies for the same region (Barton et al.
2004). The eddy entrained filament-water with a higher chlorophyll content in a
meandering fashion, giving rise to sharp fronts in chlorophyll and temperature. Fig. 1B
(from 7 April 2006) illustrates the advection of high chlorophyll-containing water along
Fig. 2. Abundance of low and high nucleic-acid (NA) content cells as percentage of total prokaryotic abundance, at (A) the oxygen minimum zone (OMZ), and (B) 2000 m depth. The inset in (A) shows the 3 prokaryotic populations (Low, High-1 and High-2) according to their size (side scatter; SSC-H) and NA content (green fluorescence; FL1-H)
Chapter I. Gradients in prokaryotic assemblage structure and activity
51
the filament, coinciding with a low surface temperature field (Fig. 1A) recorded during
the course of the study (22 March to 7 April 2006). Fig. 3A shows the vertical cross-
section of density and chlorophyll concentrations. The DCM was located between 20
and 40 m depth near the upwelling region and deepened slightly towards the open
ocean, with the most pronounced deepening of the DCM in the eddy center at Stn 57.
The sharpest gradients in density and chlorophyll were found between Stns 11 and 20
(upwelling front), Stns 57 and 64 (eddy-filament front) and Stns 64 and 70 (eddy-open
ocean water front).
A
B
AAIW AAIW
NACW
Fig. 3. (A) potential density (kg m-3, grey lines) and chlorophyll fluorescence (relative units, in grey scale), and (B) salinity. AAIW, Antarctic Intermediate Water; NACW, North Atlantic Central Water
Chapter I. Gradients in prokaryotic assemblage structure and activity
52
The North Atlantic Central Water (NACW) occupied the main thermocline (Fig.
3B). Below the NACW, 2 intermediate water masses dominated the 600 to 1500 m
depth range: the Antarctic Intermediate Water (AAIW) with its fresh anomaly values
(salinity values <35.3), and the warm, high-salinity Mediterranean Sea Outflow Water
(MSOW). The AAIW was manifested as tongues of lower-salinity water, centered at
750 to 900 m depth, in the eastern part of the section (Stns 20, 36 and 43; Fig. 3B). The
AAIW is transported northward by a current wider than the usual along-shore poleward
undercurrent (Hernández-Guerra et al. 2001). All stations from the western part of the
section (Stns 70, 64, 57, 51) as well as Stn 27 were dominated by MSOW. The water
masses below the intermediate waters represented a mixture between North Atlantic
Deep Water (NADW) and intermediate waters. The presence of the different
hydrographic structures or water masses clearly influenced the distribution and activity
of the prokaryotic community.
Prokaryotic abundance and activity
Generally, prokaryotic abundance in the surface waters and the DCM decreased
from the upwelling region to the open ocean while for the 200 m depth horizon, the
OMZ and the 2000 m depth horizon, no distinct lateral trend was detectable (Fig. 4A).
Prokaryotic abundance in the surface and the DCM ranged from 1.5 to 8.3 105 cells
ml-1, decreasing exponentially to 0.8 to 3.7 104 cells ml-1 at 2000 m depth (Fig. 4A).
Similar to prokaryotic abundance, leucine incorporation rates were highest in the
surface waters and the DCM in the coastal upwelling region (398 pmol Leu l-1 h-1),
decreasing more than 20-fold towards the oceanic stations (16.7 pmol Leu l-1 h-1) and by
3 orders of magnitude with depth (Fig. 4B). The highest values of cell-specific
production were also found at the stations close to the upwelling region in the surface
and the DCM layer (3.8 and 3.6 fmol C cell-1 d-1, respectively), decreasing towards the
open ocean stations (Stn 70: 0.3 fmol C cell-1 d-1) (Fig. 4C). Interestingly, leucine
incorporation and cell-specific production followed a similar pattern in the OMZ and at
2000 m depth, albeit 1 order of magnitude lower than in the epipelagic zone (Fig.
4B,C). Cell-specific leucine incorporation between the 200 m layer and the OMZ was
not significantly different (Student's t-test; p = 0.24, n = 8) (Table 1); however, it was
only half at 2000 m depth (Table 1, Fig. 4C). The prokaryotic biomass turnover time
(prokaryotic abundance divided by production; Kirchman 2002) increased with depth
(from <2 d in the surface waters to >30 d at 2000 m depth; Table 1). The longest
Chapter I. Gradients in prokaryotic assemblage structure and activity
53
turnover times were observed at Stn 70, where prokaryotic activity was very low at all
depths but cell numbers were higher in the deeper layers compared to the other stations,
coinciding with the presence of large prokaryotic populations with H-NA content (Fig.
2).
At this station, a pronounced decrease in the percentage of L-NA cells and in
one of the groups of the H-NA (H1-NA) was observed compared to the same depth
A
B
C
Fig. 4. (A) Prokaryotic abundance, (B) bulk leucine incorporation rates, and (C) cell-specific heterotrophic production along the coast–offshore transect in the surface waters (5 m), deep chlorophyll maximum (DCM), 200 m depth, oxygen minimum zone (OMZ) and 2000 m depth. Standard errors are not visible since they are smaller than the symbols. Note that the coastal stations have no deep samples
Chapter I. Gradients in prokaryotic assemblage structure and activity
54
layer of other stations. This decrease in the percentage of L-NA coincided with the
highest relative abundance of the other H-NA group (H2-NA). Remarkably, the
percentage of the H2-NA cells was higher in the 2000 m layer than in the OMZ (Fig. 2).
As a general pattern, the dynamics of the individual NA groups followed a similar trend
in the OMZ and the 2000 m layer along the transect.
Depth CSHP (fmol C cell-1 d-1) PGR (d-1) Turnover time (d) % H-NA
The recovery efficiency of the prokaryotic community measured using CARD-
FISH, i.e. the sum of the relative abundance of Bacteria, Crenarchaeota and
Euryarchaeota, was 77 ± 3% (mean ± SD, n = 14) of total DAPI-stainable cells. On
average, Bacteria accounted for 54 ± 2% (n = 6) in the DCM and 45 ± 2% (n = 8) at
2000 m depth of DAPI-stained cells.
Bacteria were relatively more abundant in the upwelling region and decreased in
contribution to total prokaryotic abundance towards the oceanic stations, particularly in
the layers between the DCM and the OMZ, while the archaeal contribution increased
towards the open ocean (Fig. 5). The most abundant prokaryotic group in the DCM was
SAR11, with a relative contribution to total DAPI-stainable cells ranging from 36 to
42% (Fig. 5). In the OMZ, the relative contribution of marine Crenarchaeota Group I
and Bacteroidetes increased from the upwelling region towards the open ocean, while
Table 1. Mean (±SE) prokaryotic activity along the coast–offshore transect. CSHP: cell-specific heterotrophic production; PGR: prokaryotic growth rate; H-NA: high nucleic acid content prokaryotes; DCM: deep chlorophyll maximum; OMZ: oxygen minimum zone. Number of measurements in parentheses. Ten measurements were made at 5 m (surface) depth; 8 measurements were made at all other depths
Chapter I. Gradients in prokaryotic assemblage structure and activity
55
the contribution of SAR11 decreased and marine Euryarchaeota Group II and
Roseobacter remained almost invariant along the transect (Fig. 5). The abundance of
SAR11 declined steeply with depth, reaching the lowest relative abundance at 2000 m
depth (Fig. 5). Marine Crenarchaeota Group I showed a contrasting trend with a low
relative contribution in the DCM and the highest relative abundance in deep waters,
where they accounted for up to 39.5% of the DAPI-stained cells. The highest abundance
of marine Crenarchaeota Group I, Bacteroidetes (with the exception of Stn 20) and
Gammaproteobacteria were found in the OMZ. Marine Euryarchaeota Group II
contributed up to 13 and 20% to the DAPI-stained cells in the DCM and 2000 m depth
layer, respectively, without a clear vertical distribution pattern. Roseobacter, however,
exhibited highest relative abundance in the DCM, particularly in the upwelling region,
and lowest in the deep waters.
Fig. 5. Relative abundances of prokaryotic groups detected by horseradish peroxidase-oligonucleotide probes and CARD-FISH scaled to DAPI counts at the deep chlorophyll maximum (DCM), the oxygen minimum zone (OMZ) and at 2000 m depth. C: marine Crenarchaeota Group I; E: marine Euryarchaeota Group II; S11: SAR11; CF: Bacteroidetes; R: Roseobacter; g: Gammaproteobacteria
Chapter I. Gradients in prokaryotic assemblage structure and activity
56
Discussion
Variability in bulk prokaryotic abundance and heterotrophic production
The range of variability in leucine incorporation rates (16.7 to 398 pmol Leu l-1
h-1) measured in the surface waters along the coast–ocean transect (13 to 15.3°W) was
similar to other studies covering much larger spatial scales. For instance, Alonso-Sáez
et al. (2007b) found leucine incorporation rates from 15 to 331 pmol Leu l-1 h-1 in the
eastern boundary region of the North Atlantic Ocean (14.5 to 26°W), and Hoppe et al.
(2006) reported a range of 2 to 141 pmol Leu l-1 h-1 along a meridional transect across
the central Atlantic Ocean (53°N to 65°S). The highest prokaryotic activities in the
present study were measured in the upwelling stations (Fig. 4B), while the lowest
activities were measured in the most oceanic station. Leucine incorporation at the 200 m
depth horizon was highest in the upwelling region and decreased to Stn 20, remarkably
increasing thereafter towards Stn 64 (Fig. 4B), probably reflecting the accumulation of
organic matter in the core of the anticyclonic eddy. Arístegui et al. (2003) observed
large accumulations of dissolved organic carbon in the center of anticyclonic eddies in
this region.
The most pronounced changes in the incorporation rate of leucine and cell-
specific production were the decrease observed from Stn 64 to Stn 70 (Fig. 4B,C). In
contrast, prokaryotic abundance did not decrease significantly (in the DCM), or it
increased (in the OMZ and at 2000 m depth) (Fig. 4A). As indicated in Fig. 1, Stn 64 is
located within the offshore extension of the filament while Stn 70 represents open ocean
waters. Arístegui & Montero (2005) reported high abundance of prokaryotes in the
epipelagic zone at frontal regions between filaments and eddies. In their study, an
increase in prokaryotic abundance was noticed at the 200 m depth horizon and deeper,
but not in shallower waters. Excursions of isopycnals down to 800 m depth in eddy-pair
fronts have been reported previously (e.g. Arístegui et al. 2003). This would explain the
high abundance of prokaryotes at Stn 70, although surprisingly, this increase is
observed even at 2000 m depth (Fig. 4A). None of the prokaryotic groups enumerated
by CARD-FISH seemed to contribute specifically to this increase in prokaryotic
abundance. However, it is evident that large cells with H-NA content contributed to the
increase in prokaryotic abundance in the OMZ and 2000 m depth (Fig. 2).
These patterns may be related to the differences in the water masses. In
intermediate waters such as the OMZ, prokaryotic activity was lower in the AAIW than
Chapter I. Gradients in prokaryotic assemblage structure and activity
57
in the MSOW, except at Stn 70, which exhibited the lowest prokaryotic activity in
almost all depth layers. The lower activity in the AAIW is presumably the result of
lower (or more refractory) organic carbon concentrations in this old water mass. At
2000 m depth, the prokaryotic activity pattern paralleled that of the OMZ, suggesting
mixing of the NADW with the intermediate waters (Fig. 4B).
Cell-specific prokaryotic production in surface waters was about 1 order of
magnitude higher than in deep waters (Table 1), resulting in an average prokaryotic
growth rate of 1.0 ± 0.2 d-1 for surface waters. Our growth rates are substantially higher
than the 0.4 ± 0.1 d-1 reported by Arístegui et al. (2005) for the Canary Current region
using the same approach as in the present study, although their stations were more
oceanic. For Stn 70, the most oceanic station occupied in the present study, prokaryotic
growth rate in surface waters was 0.26 d-1, comparable to those reported by Arístegui et
al. (2005).
The average cell-specific prokaryotic production in the mesopelagic (~0.14 fmol
C cell-1 d-1) and bathypelagic (0.08 fmol C cell-1 d-1) zones is considerably higher than
the range of 0.01 to 0.06 fmol C cell-1 d-1 obtained by Reinthaler et al. (2006) for the
meso- and bathypelagic realms of the eastern and western North Atlantic basin.
Consequently, their estimated turnover times of 34 to 54 d are longer than the turnover
times of 24 and 30 d obtained in the present study for the OMZ and 2000 m depth,
respectively (Table 1). Moreover, Reinthaler et al. (2006) used a conversion factor of
3.1 kg C mol-1 Leu (assuming a 2-fold isotopic dilution), whereas we used 1.5 kg C
mol-1 Leu (assuming no isotopic dilution). If we recalculate their data with 1.5 kg C
mol-1 Leu, the cell-specific prokaryotic production would be even lower and,
consequently, the turnover times longer, increasing the differences with our results even
more. Hence, the variability in the metabolic rates between these 2 studies must be
caused by factors other than the carbon-to-leucine conversion factors used to calculate
prokaryotic production.
Differences in prokaryotic activity between the deep waters of the central North
Atlantic and the eastern boundary region of the subtropical North Atlantic are likely
caused by the greater supply of organic matter to prokaryotic communities closer to the
continental margin. Arístegui et al. (2005) estimated an average prokaryotic growth rate
of 0.13 ± 0.02 d-1 for the mesopelagic zone of the Canary Current, which is in
agreement with the growth rate obtained in the present study for the 200 m horizon
(0.14 ± 0.02 d-1) and the OMZ (0.12 ± 0.03 d-1). Arístegui et al. (2005) concluded, after
Chapter I. Gradients in prokaryotic assemblage structure and activity
58
analyzing a set of metabolic indices, that prokaryotic communities in the mesopelagic
zone are very active, acting as major sinks for organic carbon in the subtropical NE
Atlantic Ocean.
Prokaryotic assemblage variability
One of the main goals of our study was to decipher patterns in distribution in
bulk prokaryotic properties and assemblage structure linked to water mass
characteristics and hydrographic regimes, particularly in the deep ocean. Previous
studies using PCR-independent methods have identified and quantified the dominant
bacterial groups in surface waters (Eilers et al. 2001, Fuchs et al. 2005); however, only
rather rudimentary information is available on the abundance of the major bacterial
groups in the meso- and bathypelagic zones using FISH (see 'Introduction'). In some of
the surface-water studies, minor differences in the proportion of major phylogenetic
groups, but larger differences in the proportion of more specific groups such as SAR86,
SAR11, SAR116 (Fuchs et al. 2005) and SAR202 (Morris et al. 2004), were found.
Alonso-Sáez et al. (2007a), using CARD-FISH, found that bacterial assemblage
structure in surface waters of the subtropical NE Atlantic was highly influenced by
environmental factors, with a distinct community in the upwelling region different from
the more oceanic waters. In the present study, we observed a large variability in the
prokaryotic assemblage along the coast–ocean transect. At the DCM, the relative
contributions of SAR11, marine Euryarchaeota Group II and marine Crenarchaeota
Group I to DAPI-stained cells increased towards the open ocean, while
Gammaproteobacteria, Roseobacter and Bacteroidetes were more abundant towards the
upwelling region (Fig. 5), where bulk prokaryotic activity was generally higher (Fig.
4B,C). This is in agreement with other studies, which also report high contributions of
the Bacteroidetes cluster to total prokaryotic abundance in upwelling systems (Fandino
et al. 2001, Alonso-Sáez et al. 2007a). Roseobacter was also related previously to the
presence of high phytoplankton biomass (González & Moran 1997, Eilers et al. 2001),
while the Gammaproteobacteria were associated with nutrient pulses (Eilers et al. 2000,
Alonso-Sáez et al. 2007a). SAR11 was the most abundant group in the DCM, as also
described in previous studies (Morris et al. 2002, Alonso-Sáez et al. 2007a). This
cosmopolitan group represents >50% of the prokaryotic abundance in the surface waters
of the NW Sargasso Sea and 25% of the mesopelagic microbial assemblages (Morris et
Chapter I. Gradients in prokaryotic assemblage structure and activity
59
al. 2002), declining in its contribution to prokaryotic abundance with depth, however
(Morris et al. 2004; our Fig. 5).
In the OMZ, the SAR11 clade showed a different distribution pattern than in the
DCM, being more abundant at Stn 20 affected by upwelling AAIW (Fig. 5). Marine
Crenarchaeota Group I and Bacteroidetes increased in their relative abundance towards
the open ocean, with Stns 51 to 70 (affected by MSOW) exhibiting very similar
community composition (Fig. 5). At 2000 m depth, no clear gradient in prokaryotic
community composition was discernable, although Bacteroidetes and the marine
Crenarchaeota Group I were more abundant in the more oceanic waters (Fig. 5). The
estimated relative abundance of marine Euryarchaeota Group II (4 to 13% in the DCM
and 6 to 20% in deep waters) is in agreement with the observations reported by Teira et
al. (2006b) for the North Atlantic Ocean, where marine Euryarchaeota Group II ranged
from <10 to >30% in subsurface waters and <15% of the total picoplankton community
at the 100 m layer. While SAR11 decreased in relative abundance with depth, marine
Crenarchaeota Group I increased with depth (Fig. 5). The highest relative abundance of
marine Crenarchaeota Group I, Bacteroidetes and Gammaproteobacteria were found in
the OMZ, except for Stn 20, where the OMZ was influenced by AAIW. Teira et al.
(2006a) also found the highest absolute abundance of marine Crenarchaeota Group I
(accounting for >40% of DAPI-stained cells) in the OMZ of the North Atlantic. The
increase of marine Crenarchaeota Group I and Gammaproteobacteria in the OMZ
might be related to nitrification processes in the OMZ. Marine nitrification is mediated
by 3 different groups of prokaryotes belonging to the Beta- and Gammaproteobacteria
(Ward 2002), although recently, evidence has been accumulating that Crenarchaeota
also contribute to marine nitrification (Könneke et al. 2005, Wuchter et al. 2006). It is
noteworthy, however, that Wuchter et al. (2006) did not find any gamma-
proteobacterial amoA genes, a gene indicative for the potential to oxidize ammonia.
Only betaproteobacterial and marine crenarchaeotal Group I.1a amoA genes were
retrieved (Wuchter et al. 2006). It is worth noting that crenarchaeal amoA gene copy
numbers determined by q-PCR dominated over betaproteobacterial amoA gene copy
numbers throughout the North Atlantic mesopelagic waters (Wuchter et al. 2006). In
soils, the copy numbers of crenarchaeal amoA genes also outnumber beta-
proteobacterial amoA genes (Leininger et al. 2006). Crenarchaeota oxidizing ammonia
could play an important, previously unrecognized, role in the biogeochemical cycling of
Chapter I. Gradients in prokaryotic assemblage structure and activity
60
nitrogen in the ocean, although their actual nitrification rates in natural environments
remain to be determined.
Bacteria versus Archaea
Recent reports on the distribution of Bacteria and Archaea in the oceans indicate
that planktonic marine Crenarchaeota Group I increase in their relative contribution to
prokaryotic abundance with depth, reaching cell numbers similar to or higher than those
of Bacteria in the mesopelagic zone (Karner et al. 2001, Teira et al. 2006b). Marine
Euryarchaeota Group II, the other major archaeal group, is, however, commonly more
abundant in surface than deep waters (Massana et al. 2000, Karner et al. 2001, Church
et al. 2003), comprising up to 10 to 30% of picoplankton abundance in subsurface
waters (Herndl et al. 2005, Teira et al. 2006b). Some Euryarchaeota in surface waters
harbor proteorhodopsin, a light-harvesting pigment that allows light to be used as an
additional energy source, while deep-water Euryarchaeaota lack proteorhodopsin
(Frigaard et al. 2006).
The fact that marine Crenarchaeota Group I increase in their relative abundance
with depth while bacterial abundance decreases (e.g. Massana et al. 1997, Herndl et al.
2005, Teira et al. 2006a) suggests that they occupy different ecological niches, likely
caused by environmental conditions and different substrate requirements. These
different ecological niches, however, cannot be deciphered at the moment, as both
marine Crenarchaeota Group I and Bacteria are capable of utilizing similar model
substrates (Teira et al. 2006a, Kirchman et al. 2007). Our results show a relative
increase with depth (Fig. 5) of both marine Crenarchaeota Group I and marine
Euryarchaeota Group II, although absolute archaeal abundances were always higher at
the DCM. In all cases the ratio of total Archaea : Bacteria was ≤ 1 (average ± SD: 0.24
± 0.08 for the DCM, 0.82 ± 0.11 for the OMZ and 0.68 ± 0.17 for the 2000 m depth
layer).
An even more pronounced trend in the distribution of Bacteria versus Archaea
than over depth was observed laterally along the coast–offshore gradient in the DCM
(Fig. 5). Although Archaea were always 2 to 7 times lower in abundance than Bacteria,
the decrease in bacterial abundance from the upwelling region towards the open ocean
coincided with a concomitant increase in Archaea as described by the equation:
Bacteria (cells ml-1) = 0.61 Archaea (cells ml-1) – 60255 (R2 = 0.98, p < 0.00001). A
similar, although less pronounced, contrasting abundance pattern of archaeal and
Chapter I. Gradients in prokaryotic assemblage structure and activity
61
bacterial abundance was found for the OMZ (data not shown). Marine Crenarchaeota
Group I constituted 79% of the total abundance of Archaea in the OMZ, while in the
DCM both archaeal groups contributed roughly equally. Lateral gradients in the relative
abundance of Bacteria versus Archaea have not been reported thus far. The decrease in
bulk leucine uptake along the coast–ocean gradient was positively related (R2 = 0.72, n
= 6) to the decrease in bacterial abundance in the DCM, and negatively related (R2 = –
0.76, n = 6) to the increase in archaeal abundance. This suggests that most of the bulk
prokaryotic heterotrophic production, as estimated by leucine incorporation, was due to
bacterial activity. In addition, SAR11 was the most abundant prokaryotic group in the
DCM, decreasing 2-fold from Stn 4 to Stn 70, although increasing in the relative
contribution to prokaryotic abundance towards the oceanic stations. Thus, this group is
probably the major contributor to the bulk prokaryotic metabolism in the open ocean’s
surface waters.
Conclusions A high variability was observed in bulk prokaryotic abundance and metabolism,
as well as in changes in community structure, in the surface waters from the NW Africa
upwelling region towards the open ocean. This variability was comparable to the
variability reported for ocean-basin studies. Bacteria (SAR11, Roseobacter,
Gammaproteobacteria and Bacteroidetes) were relatively more abundant in coastal than
in oceanic regions, in contrast to the distribution of marine Euryarchaeota Group II and
marine Crenarchaeota Group I. SAR11 was mainly responsible for the surface-water
variability in bulk prokaryotic abundance. Prokaryotic abundance decreased about 2
orders of magnitude from surface to 2000 m deep waters, whereas prokaryotic
production decreased by 3 orders of magnitude. Both archaeal groups contributed up to
50% to the total prokaryotic abundance in the dark ocean. AAIW exhibits lower
prokaryotic activity than MSOW, presumably due to lower organic matter content of the
AAIW. Prokaryotic growth rates in the deep ocean were considerably higher than those
reported for the central Atlantic, but comparable to previous studies from the same
region. This supports the view that prokaryotic communities in the deep waters of the
subtropical NE Atlantic maintain higher metabolic rates than in the central Atlantic due
to lateral input of organic matter from the continental margins.
Chapter I. Gradients in prokaryotic assemblage structure and activity
62
Acknowledgements Fieldwork was supported by the CONAFRICA (CTM2004-02319) and RODA
(CTM 2004-06842-C03/MAR) projects. This is a contribution to the MarBEF European
Network of Excellence funded by the European Union (GOCE-CT-2003-505446) and
to EUR-OCEANS, a European Network of Excellence funded by the European
Commission (6th Framework Programme, contract no. 511106). Financial support was
provided by a PhD fellowship from the Spanish government to F.B. We thank the crew
and other scientists aboard the RV ‘BIO-Hesperides’ for their help during the cruise.
The authors thank 2 anonymous reviewers whose comments and suggestions helped
Archaeal nitrification in the ocean. Proc. Nat. Acad. Sci. USA 103 (33):12317-
12322
Chapter II. Evidences of dark ocean’s prokaryotic metabolism on suspended POM
69
Chapter II
Evidence of prokaryotic metabolism on suspended particulate organic matter in the dark waters of the (sub)tropical North Atlantic F. Baltar, J. Arístegui, J. M. Gasol, E. Sintes, G. J. Herndl
Limnology and Oceanography 54 (1), 182-193 (2009)
Chapter II. Evidences of dark ocean’s prokaryotic metabolism on suspended POM
71
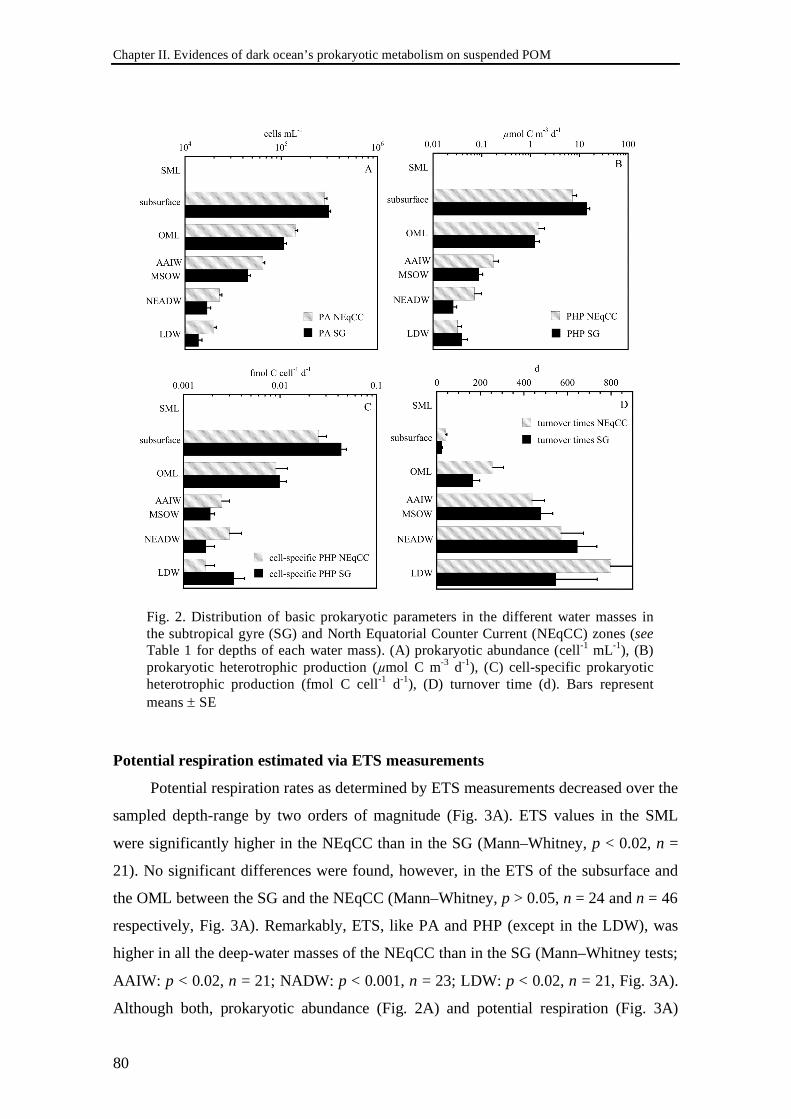
Abstract The distribution of prokaryotic abundance (PA), respiratory activity (ETS),
heterotrophic production (PHP), and suspended particulate (POM) and dissolved
(DOM) organic matter was determined in the meso- and bathypelagic waters of the
(sub)tropical North Atlantic. PA decreased by one order of magnitude from the lower
euphotic zone to the bathypelagic waters, while ETS decreased by two and PHP by
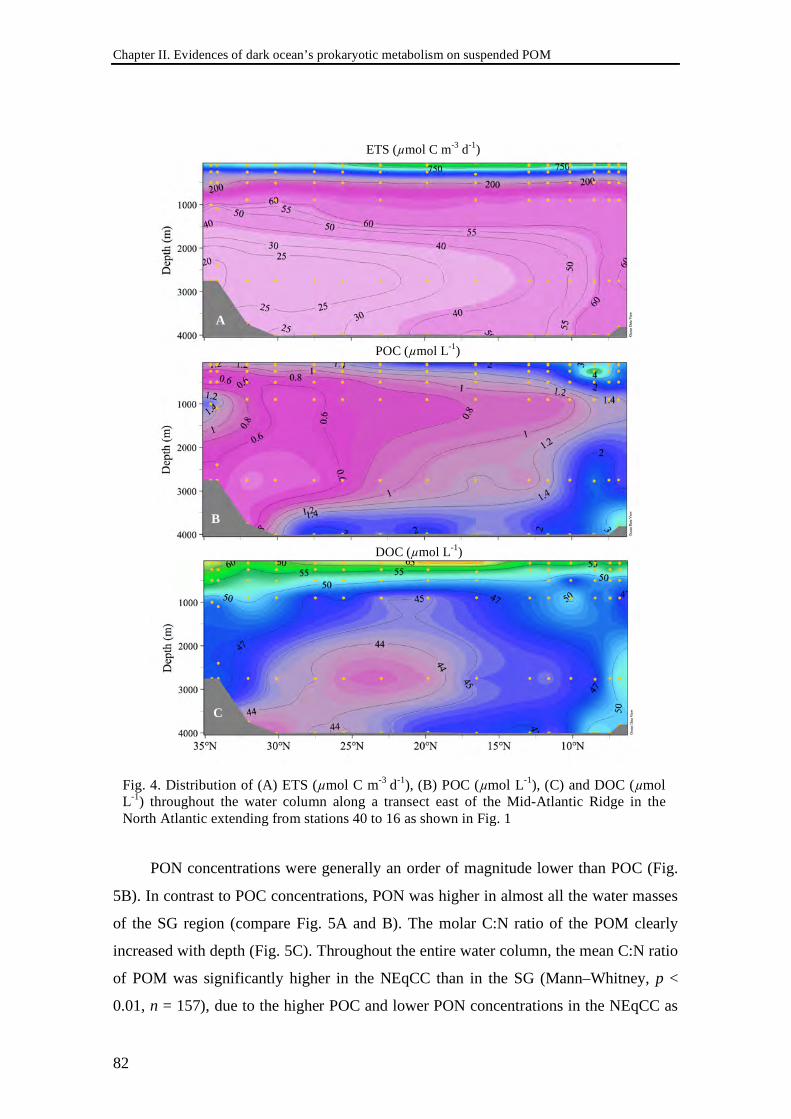
three orders of magnitude. On a section following the Mid-Atlantic Ridge from 35°N to
5ºN, ETS below 1000 m depth increased southwards up to three-fold. This latitudinal
gradient in the deep-waters was paralleled by a six-fold increase in Particulate Organic
Carbon (POC), whereas no trend was apparent in the DOM distribution. Significant
correlations between POM and ETS were obtained in the water masses between 1000 m
and 3000 m depth, the Antarctic Intermediate Water and the North East Atlantic Deep
Water. A strong imbalance in the dark ocean was found between prokaryotic carbon
demand (estimated through two different approaches) and the carbon sinking flux
derived from sediment trap records corrected with 230Th. The imbalance was greater
when deeper in the water column, suggesting that the suspended carbon pool must
account for most of the carbon deficit. Our results, together with other recent findings
discussed in this chapter, indicate that microbial life in the dark ocean is likely more
dependent on slowly sinking or buoyant, laterally advected suspended particles than
hitherto assumed.
Introduction For a long time, the dark ocean was considered to be a site of almost negligible
biological activity due to the harsh environmental conditions (Morita 1984). Over the
last two decades, however, the relatively intense microbial activity taking place in the
dark ocean has been recognized (Cho & Azam 1988, Karl et al. 1988, Nagata et al.
2000). In particular, deep ocean respiration has been estimated to account for one third
of the biological CO2 production in the ocean (del Giorgio & Duarte 2002, Arístegui et
al. 2005a). These high respiration rates, however, largely exceed the downward export
flux of dissolved (DOC) and sinking particulate organic carbon (POC) (Reinthaler et al.
Chapter II. Evidences of dark ocean’s prokaryotic metabolism on suspended POM
72
2006). Arístegui et al. (2002) showed, based on the relation between DOC and apparent
oxygen utilization (AOU) in a large global-ocean data set, that DOC accounts for only
10-20% of oxygen consumption in the dark ocean, supporting the view that the bulk of
dark ocean respiration is driven by particulate material (McCave 1975, Honjo 1980,
1986, Arístegui et al. 2005a). Their results agree with the study of Hansell & Carlson
(1998), who inferred extremely low remineralization rates from basin-scale gradients of
DOC in the deep ocean. However, the sinking POC supply collected with sediment
traps, commonly used for inferring remineralization rates in the ocean, does not explain
the remaining oxygen consumption in the dark waters (Arístegui et al. 2005a; Reinthaler
et al. 2006). One explanation of this discrepancy could be that the suspended (or low-
buoyancy) fraction of the POM pool is underestimated (or simply not collected) with
sediment traps. This pool is quantitatively far larger than the sinking pool (McCave
1984; Verdugo et al. 2004), and might account for the excess oxygen consumption
rates. This suspended POM might be laterally transported through intermediate and
deep waters while being remineralized. Bauer & Druffel (1998) concluded from a study
comparing the natural radiocarbon abundance in two coastal and open ocean profiles in
the North Atlantic and North Pacific Oceans, that the POC inputs from ocean margins
to the ocean interior could be more than one order of magnitude higher than the input of
recently produced organic carbon derived from the surface ocean. Regardless, whether
the suspended carbon in the dark ocean is transported from ocean margins or originates
from sinking particles, this pool has been largely ignored in ocean carbon budgets.
In this study we investigated regional gradients and the depth distribution of the
dissolved (DOM) and particulate organic matter (POM) pools, as well as the microbial
metabolism in the dark ocean to determine the relation between changes in the OM
pools and the activity of deep-water microbes in the (sub)tropical North Atlantic. To
address this question, we determined the potential respiration via electron transport
system (ETS) measurements along with particulate and dissolved organic carbon (POC
and DOC) and nitrogen (PON and DON), as well as prokaryotic abundance and
production in the mixed layer (≈ 50 m depth), the upper thermocline (≈ 100 m depth),
the mesopelagic (200-1000 m depth) and bathypelagic (1000-4500 m depth) waters of
the (sub)tropical North Atlantic. DOC is largely refractory below the mixed layer of the
(sub)tropical regions (Hansell & Carlson 2002) where overturning circulation is greatly
restricted, and the sinking fluxes are low in open ocean waters. Thus, we hypothesized
that the metabolism of prokaryotes in the dark ocean largely relies on suspended
Chapter II. Evidences of dark ocean’s prokaryotic metabolism on suspended POM
73
particles, which we would be able to measure as POM. Hence, variations in the
distribution of POM collected with oceanographic bottles, considered to be mostly
suspended detrital material, should be related to variations in prokaryotic metabolism in
the dark ocean.
Material and methods
Study site and sampling
To resolve the areal variability in organic matter and prokaryotic activity in the
meso- and bathypelagic waters of the eastern North Atlantic, more than 9000 km were
covered comprising the subtropical gyre region (SG) and the North Equatorial Counter
Current region (NEqCC) (Fig. 1) on board RV Pelagia (November-December 2005).
The study area was divided into two regions (SG and NEqCC) (Varela et al. 2008)
separated by the latitudinal front of the intermediate and central waters (see Fig. 1). The
circulation pattern of the bathypelagic water masses, however, did not differ across the
two regions. Samples were taken at 25 out of 43 stations occupied during the
ARCHIMEDES-I cruise from seven depths: the surface mixed layer (SML, average
depth 50 m) for POM and ETS only, the base of the mixed layer (“subsurface”, 100 m
layer), the oxygen minimum layer (OML; average depth 400 m), the Mediterranean Sea
Overflow Water (MSOW; average depth 900 m) in the SG, the Antarctic Intermediate
Water (AAIW; average depth 900 m) in the NEqCC, the North East Atlantic Deep
Water (NEADW; average depth 2750 m) and the Lower Deep Water (LDW; average
depth 4000 m). The specific water masses were identified based on their distinct
temperature-salinity characteristics, oxygen content and inorganic nutrient signatures
(Table 1). The LDW, characterized by low salinity (34.9) and temperature (2.3-2.6ºC),
consisted mainly of Antarctic Bottom Water coming from the south and mixed with
some NEADW. Iceland Scotland Overflow Water and Labrador Sea Water principally
form the NEADW (Varela et al. 2008). Samples from the distinct water masses were
collected with 12 L NOEX (no oxygen exchange) bottles mounted on a CTD
Chapter II. Evidences of dark ocean’s prokaryotic metabolism on suspended POM
74
(conductivity, temperature, depth) frame to determine total picoplankton abundance,
leucine incorporation, POM, DOM, and ETS as described below.
Prokaryotic abundance (PA) determined by flow cytometry
Picoplankton collected from the different depth layers of the water column were
enumerated using flow cytometry. Samples (2 mL) were fixed with 1%
paraformaldehyde (final concentration), shock-frozen in liquid nitrogen for 5 min and
stored at -80°C. Picoplankton cells were stained with SYBR-Green I and enumerated
within 3 months with a FACSCalibur flow cytometer (Becton Dickinson) equipped with
a 488 nm laser. Immediately before analysis, the thawed picoplankton samples were
diluted 5- to 10-fold in TE buffer (10 mmol L-1 Tris, 1 mmol L-1 EDTA, pH 8) and
stained with SYBR-Green I at room temperature in the dark for 15 min. Fluorescent
microspheres (Molecular Probes) with a diameter of 1 µm were added to all samples as
an internal standard. Picoplankton cells were differentiated according to their right
angle scatter and green fluorescence. The counting window of the flow cytometer was
set to exclude the occasionally present eukaryotic picoplankton. Prokaryotic carbon
500 m
1000 m
2000 m
3000 m
4000 m
5000 m
6000 m
50ºW 40ºW 30ºW 20ºW 10ºW
40ºN
30ºN
20ºN
10ºN
AAIW MSOW SML, subsurface and OML
NEADW
SG
NEqCC
LDW
23
30
36
33 2 4
5 7 8 9 11
13 14 16 18
20 22
25
26 28
32
35
38 40 42 43
Fig. 1. Stations occupied during ARCHIMEDES-I. Sampled stations are indicated by numbered dots. Horizontal line at about 15°N separates the stations of the subtropical gyre (SG) from those in the North Equatorial Counter Current (NEqCC). The section plotted in Fig. 4 extends from Sta. 40 to Sta. 16. Lines indicate the flow pattern of the main water masses. For water mass abbreviation see Table 1
Chapter II. Evidences of dark ocean’s prokaryotic metabolism on suspended POM
75
biomass was calculated assuming a carbon content of 10 fg C per cell, which seems to
be most suitable for dark ocean prokaryotes (Ducklow et al. 2000).
Zone Water mass Depth
(m)
Temperature
(ºC) Salinity
Oxygen
(µmol kg-1)
SG
SML
subsurface
OML
50
100
250-500
20.1-26.8
17.7-24.1
10.1-17.9
36.5-37.2
36.4-37.5
35.3-36.5
178.5-213.1
138.9-221.5
87.5-207.2
MSOW
NEADW
900-1000
2750
7.6-9.2
2.8-3.0
35.1-35.6
34.9
121.2-197.7
223.8-250.8
LDW
3500-5000
2.4-2.6
34.9
223.7-242-5
NEqCC
SML
subsurface
OML
50
100
250-500
19.4-27.8
14.2-18.5
7.9-12.0
35.9-36.1
35.5-36.4
34.7-35.3
118-184.5
79.6-132.7
44.0-122.3
AAIW
NEADW
900-1000
2750
5.1-6.5
2.8-3.0
34.6-34.7
34.9
102.4-129.5
234.3-247.1
LDW
3750-4000
2.3-2.4
34.9
227.7-246.8
Prokaryotic heterotrophic production (PHP) estimated by [3H] leucine
incorporation
Bulk picoplankton heterotrophic production was measured by incubating triplicate
10–40 mL of samples and formaldehyde killed blanks (2% final concentration) with 10
Table 1. Characteristics of the main water masses sampled during the ARCHIMEDES-I cruise based on CTD profiles at individual stations. Ranges are given for each water mass where samples were collected. SG: Subtropical Gyre, NEqCC: North Equatorial Counter Current, SML: surface mixed layer, OML: oxygen minimum layer, MSOW: Mediterranean Sea Overflow Water, NEADW: North East Atlantic Deep Water, LDW: Lower Deep Water, AAIW: Antarctic Intermediate Water
Chapter II. Evidences of dark ocean’s prokaryotic metabolism on suspended POM
76
nmol L-1 [3H]leucine (final concentration, specific activity 157 Ci mmol-1; Amersham)
in the dark at in situ temperature for 1-12 h depending on the water mass and the
expected prokaryotic activity (Kirchman et al. 1985). Thereafter, the incubation was
terminated by adding formaldehyde (2% final concentration) to the samples. The fixed
samples were filtered through 0.2 µm polycarbonate filters (25 mm filter diameter;
Millipore) supported by Millipore HAWP filters. Subsequently, the filters were rinsed
three times with 10 mL of 5% ice-cold trichloroacetic acid, dried and placed in
scintillation vials. Scintillation cocktail (8 mL Canberra-Packard Filter Count) was
added and after 18 h, counted in a liquid scintillation counter (LKB Wallac Model
1212). The mean disintegrations per minute (DPM) of the formaldehyde-fixed blanks
were subtracted from the mean DPM of the respective samples and the resulting DPM
converted into leucine incorporation rates. Prokaryotic carbon biomass production was
estimated using the conservative theoretical conversion factor of 1.55 kg C mol-1 Leu
incorporated assuming no internal isotope dilution (Kirchman & Ducklow 1993).
Respiratory activity of the electron transport system (ETS)
ETS activity was measured following the modifications of the tetrazolium
reduction technique as described in Arístegui & Montero (1995). Some minor
modifications of the method were made to increase its sensitivity. Briefly, about 10 L of
sample was filtered through a Whatman GF/F filter (47-mm diameter). Filters were
folded into cryovials and immediately stored in liquid nitrogen until analysis in the
laboratory. Back in the laboratory, the filters with the collected material were
homogenized in 2.5 mL phosphate buffer with a Teflon-glass tissue grinder at 0–4ºC for
1.5 min. A 0.9 mL aliquot of the crude homogenate was incubated in duplicate with 0.5
mL of substrate solution and 0.35 mL of 2-(4-iodophenyl)-3-(4-nitrophenyl)-5-
phenyltetrazolium chloride (INT) at 18ºC for 20 min. The reaction was quenched by
adding 0.25 mL of a mixture of formalin and phosphoric acid. The quenched reaction
mixture was centrifuged at 4000 g at 4ºC for 20 min and the absorbance of the particle-
free solution measured in a Beckman DU-650 spectrophotometer at 490 and 750 nm
wavelength after adjusting the sample to room temperature. Readings at 750 nm, to
correct for turbidity, were always negligible. In addition to the samples, duplicate
controls were run by replacing the crude extract with a clean Whatman GF/F filter
homogenized in phosphate buffer. ETS activity was calculated using the equation given
in Packard & Williams (1981):
Chapter II. Evidences of dark ocean’s prokaryotic metabolism on suspended POM
77
ETSASSAY (mmol O2 m-3 h-1) = H × S × (ODcorr ) / (1.42 × V × f × t/60) × 22.4 (1)
where H is the volume of the homogenate (in mL), S is the volume of the
quenched reaction mixture (in mL), ODcorr is the absorbance of the sample measured at
490 nm wavelength and corrected for blank absorbance, V is the volume (in L) of the
seawater filtered through the Whatman GF/F filter, f is the volume of the homogenate
used in the assay (in mL), t is the incubation time (in min), 60 converts minutes to
hours, the factor 1.42 converts the INT-formazan formed to oxygen units (in µL) and
22.4 converts the µL O2 to µmol O2. ETS activity was corrected to in situ temperature
where Ea is the Arrhenius activation energy (in kJ mol-1), R is the gas constant,
and Tass and Tis are the temperatures (in degrees Kelvin) in the assay and in situ,
respectively. A calculated activation energy of 67 kJ mol-1 was used (Arístegui &
Montero 1995). Actual rates of oxygen consumption in carbon units (R) were calculated
assuming a R:ETS = 0.09 (see details in the discussion section) and a respiratory
quotient of 1.
Particulate organic carbon (POC) and organic nitrogen (PON)
Samples (4-6 L) for POC and PON were filtered through combusted (450ºC for
12 h) 25-mm Whatman GF/F filters. The filters were wrapped in combusted aluminum
foil and kept frozen at -20ºC until processed. In the laboratory, the filters were thawed
and dried overnight at 65ºC in a desiccator under HCl fumes to remove carbonates and
finally, dried overnight in a desiccator with silica gel. Prior to analysis, samples were
packed into ultraclean tin caps. The carbon analyses were performed on a Perkin-Elmer
2400 CHN (carbon, hydrogen, nitrogen) elemental analyzer according to the JGOFS
(Joint Global Ocean Flux Study) protocol (UNESCO 1994). Measurements of organic
material from low volume filtrations may be questionable due to the possible sorption
of DOM on the filter material (Moran et al. 1999, Turnewitsch et al. 2007). Hence,
sorption blanks were determined for each station by placing 2 Whatman GF/F filters
together on the filter holder while filtering the water sample. The adsorbed organic C
Chapter II. Evidences of dark ocean’s prokaryotic metabolism on suspended POM
78
and N collected by these filters was measured as described above and subtracted from
the POC- and PON-content of the corresponding particulate samples.
Total organic carbon (TOC)
For TOC determinations, 8 mL of the unfiltered sample was pipetted into
combusted (450°C for 4 h) glass ampoules, immediately acidified with 3 – 4 drops of 45
% H3PO4 and the ampoule sealed. Samples were stored at –20°C until analysis. TOC
analysis was performed using the high temperature combustion method on a modified
Shimadzu TOC-5000A. The absorbance of the CO2 evolving from the combusted TOC
was detected with an external infrared cell (LiCor Model LI-6252) and quantified as
peak area by the Shimadzu integrator. Per sample, 100 µL was automatically injected in
quadruplicate with a Shimadzu ASI-5000A autosampler on a platinized aluminum
catalyst (Elemental Microanalysis) at a combustion temperature of 680°C (Benner &
Strom 1993). Standards were prepared with potassium hydrogen phthalate (Baker) in
Milli-Q water. The overall analytical precision was always < 3 %. The reported TOC
concentrations resemble DOC (water filtered through rinsed 0.2 µm polycarbonate
filters) since there was no significant difference between corresponding TOC and DOC
samples (data not shown). Occasionally, the DOC samples were even slightly higher
than the corresponding TOC values.
Dissolved organic nitrogen (DON)
For DON determinations, 10-100 mL of filtered (through combusted Whatman
GF/F glass fiber filters) water was collected in acid-rinsed polyethylene bottles. The
DON and DOP (data not shown) analyses were performed simultaneously according to
the method of Valderrama (1981). This procedure is based on an alkaline persulfate
digestion (at 120°C in an autoclave for 90 min) over a wide pH range starting at pH 9
and ending at pH 4 using boric acid and sodium hydroxide. The resulting NH4+ was
measured using an autoanalyzer (TRAACS). DON concentrations were obtained by
subtracting the sum of the concentration of the inorganic nitrogen species (NH4+ + NO3
-
+ NO2-) from the corresponding total dissolved N concentrations. To check the
efficiency of DON determinations, 10 different compounds containing organic N were
measured in parallel with the samples. For this reference material, the recovery
efficiency of organic nitrogen was 92 % of the calculated organic nitrogen
concentration.
Chapter II. Evidences of dark ocean’s prokaryotic metabolism on suspended POM
79
Statistical analysis
To check the normality of the individual data sets, the Kolmogorov–Smirnoff test
was used. If normality was not attained, the non-parametric Mann–Whitney test (for
comparison of two independent variables) was applied. Data were log transformed to
attain normality before Spearman’s rank correlation coefficients were calculated.
Results Prokaryotic abundance (PA) and prokaryotic heterotrophic production (PHP)
PA ranged between 2.2 – 3.9 x 10⁵ cells mL-1 at 100 m depth and from 0.1 – 0.8 x
105 cells mL-1 in the meso- and bathypelagic waters, decreasing exponentially with
depth (Fig. 2A). No significant differences were found in the PA of the subsurface layer
(100 m depth) between the SG and the NEqCC (Mann–Whitney, p > 0.05, n = 42, Fig.
2A). In the OML, intermediate and deep-water masses, PA was, however, significantly
higher in the NEqCC than in the corresponding water masses of the SG (Mann–
Whitney tests; OML: p < 0.01, n = 44; AAIW: p < 0.001, n = 22; NEADW: p < 0.001, n
= 22; LDW: p < 0.001, n = 43, Fig. 2A).
PHP decreased with depth by three orders of magnitude (Fig. 2B) and followed
the same vertical distribution as PA. The difference in PHP between both regions was
not significant in the NEADW even though PHP was about twice as high in the NEqCC
than in the SG. Cell-specific PHP decreased only by one order of magnitude (Fig. 2C)
following the same pattern as bulk PHP. Cell-specific PHP was higher in the subsurface
waters of the SG than in the NEqCC (Mann–Whitney, p < 0.01, n = 22), but not
significantly different in the intermediate water masses and NEADW (Mann–Whitney,
p > 0.05, n = 22 and n= 19 for intermediate water masses and NEADW, respectively).
Remarkably, cell-specific PHP was about three times higher in the LDW of the SG than
of the NEqCC and higher than the cell-specific PHP of NEADW and intermediate
waters (Fig. 2C). Prokaryotic turnover time (C-biomass/PHP) increased from 22 ± 3 d
in the subsurface layer to 798 ± 193 d in the LDW with no significant differences
between the water masses in the NEqCC and the SG (Fig. 2D).
Chapter II. Evidences of dark ocean’s prokaryotic metabolism on suspended POM
80
Potential respiration estimated via ETS measurements
Potential respiration rates as determined by ETS measurements decreased over the
sampled depth-range by two orders of magnitude (Fig. 3A). ETS values in the SML
were significantly higher in the NEqCC than in the SG (Mann–Whitney, p < 0.02, n =
21). No significant differences were found, however, in the ETS of the subsurface and
the OML between the SG and the NEqCC (Mann–Whitney, p > 0.05, n = 24 and n = 46
respectively, Fig. 3A). Remarkably, ETS, like PA and PHP (except in the LDW), was
higher in all the deep-water masses of the NEqCC than in the SG (Mann–Whitney tests;
AAIW: p < 0.02, n = 21; NADW: p < 0.001, n = 23; LDW: p < 0.02, n = 21, Fig. 3A).
Although both, prokaryotic abundance (Fig. 2A) and potential respiration (Fig. 3A)
Fig. 2. Distribution of basic prokaryotic parameters in the different water masses in the subtropical gyre (SG) and North Equatorial Counter Current (NEqCC) zones (see Table 1 for depths of each water mass). (A) prokaryotic abundance (cell-1 mL-1), (B) prokaryotic heterotrophic production (µmol C m-3 d-1), (C) cell-specific prokaryotic heterotrophic production (fmol C cell-1 d-1), (D) turnover time (d). Bars represent means ± SE
Chapter II. Evidences of dark ocean’s prokaryotic metabolism on suspended POM
81
decreased with depth, cell-specific ETS showed a different trend: first decreasing with
depth to reach the lowest values in the intermediate water masses (AAIW and MSOW)
and then increasing again, reaching the highest cell-specific ETS of all the water masses
in the LDW (Fig. 3B). Cell-specific ETS was significantly higher in the deep water
masses (NEADW: Mann–Whitney, p < 0.02, n = 23; LDW: Mann–Whitney, p < 0.05, n
= 21) of the NEqCC than in the SG, with a cell-specific ETS in the LDW of the NEqCC
being two times higher than in the subsurface waters (Fig. 3B). A pronounced
latitudinal gradient in ETS was detectable below 1000 m depth with increasing values
towards the south, particularly in the NEADW (core around 2750 m depth) (Fig. 4A).
Particulate (POM) and dissolved organic matter (DOM) distribution in the water
column
Like ETS, also POC but not DOC (compare Fig. 4B and C) increased towards the
south along the Mid-Atlantic Ridge in the deep waters, except in the LDW, where the
influence of POC resuspended from the ocean bottom (as inferred from the high C:N
ratios) was apparent. Overall, POC concentrations were significantly higher in the water
masses of the NEqCC than of the SG (Mann–Whitney, p < 0.0001, n = 163, Fig. 5A)
except in the LDW (Mann–Whitney, p > 0.05, n = 22). Strikingly, POC concentrations
were higher in the OML than in the water masses above and below (Fig. 5A), a fact that
could be due to increasing density and reduced sinking rates in micro-density gradients
between water masses.
Fig. 3. Distribution of (A) ETS (µmol C m-3 d-1) and (B) cell-specific ETS (fmol C cell-1 d-1) throughout the water column along the subtropical gyre (SG) and North Equatorial Counter Current (NEqCC) zones (see Table 1 for depths of each water mass). Bars represent mean ± SE
Chapter II. Evidences of dark ocean’s prokaryotic metabolism on suspended POM
82
PON concentrations were generally an order of magnitude lower than POC (Fig.
5B). In contrast to POC concentrations, PON was higher in almost all the water masses
of the SG region (compare Fig. 5A and B). The molar C:N ratio of the POM clearly
increased with depth (Fig. 5C). Throughout the entire water column, the mean C:N ratio
of POM was significantly higher in the NEqCC than in the SG (Mann–Whitney, p <
0.01, n = 157), due to the higher POC and lower PON concentrations in the NEqCC as
ETS (µmol C m-3 d-1)
POC (µmol L-1)
DOC (µmol L-1)
A
B
C
Fig. 4. Distribution of (A) ETS (µmol C m-3 d-1), (B) POC (µmol L-1), (C) and DOC (µmol L-1) throughout the water column along a transect east of the Mid-Atlantic Ridge in the North Atlantic extending from stations 40 to 16 as shown in Fig. 1
Chapter II. Evidences of dark ocean’s prokaryotic metabolism on suspended POM
83
compared to the SG.
In contrast to POC, DOC concentrations remained rather stable throughout the
water column (Fig. 5D). There was no significant difference in DOC concentrations
between the NEqCC and SG water masses (Mann–Whitney, p > 0.05 for all water
masses; Fig. 4C, Fig. 5D). DON concentrations were generally one order of magnitude
lower than DOC values, slightly decreasing with depth (Fig. 5E). Higher DON
concentrations were obtained for the deep-water masses of the NEqCC than of the SG,
except in the LDW (Mann–Whitney tests; OML: p < 0.02, n = 48; AAIW: p < 0.03, n =
24; NADW: p < 0.05, n = 26; LDW: p > 0.20, n = 22). In contrast to the POM pool
(Fig. 5C), the C:N molar ratio of the DOM pool (Fig. 5F) showed essentially no
Fig. 5. Distribution of basic prokaryotic parameters in the different water masses of the subtropical gyre (SG) and North Equatorial Counter Current (NEqCC) zones. (A) POC (µmol L-1), (B) PON (µmol L-1), (C) POC:PON molar ratio, (D) DOC (µmol L-1), (E) DON (µmol L-1), (F) DOC:DON molar ratio. See Table 1 for depths of each water mass. Bars represent means ± SE
Chapter II. Evidences of dark ocean’s prokaryotic metabolism on suspended POM
84
variation with depth. The C:N of the DOM was significantly lower in the NEqCC than
in the SG (Mann–Whitney, p < 0.0002, n = 141).
Discussion The average depth distribution of the C:N molar ratio of the POM pool (Fig. 5C)
shows that the ratio is substantially higher in the meso- and bathypelagic waters than in
the upper 200 m layer, but without a clear depth gradient across these layers. Only the
LDW of the Subtropical Gyre shows a significant increase in the C:N ratio due to a
marked enhancement in the POC concentrations (but not in PON), possibly caused by
lateral advection of N-depleted POM. The high C:N ratios of the POM pool in the dark
ocean (about two times higher than the average C:N ratio of DOM; Fig. 5F) indicate a
preferential utilization of PON by the microbial assemblages. However, the lack of a
clear depth gradient in the C:N ratios suggests that the source of this POM may not be
related to the sinking flux from the overlying surface ocean. Fig. 4B illustrates a
latitudinal POC gradient, increasing from 35°N to 5°N, with higher POC concentrations
in the deep-ocean near the equator. The gradient is more apparent below 1000 m depth,
coinciding with a similar latitudinal trend in ETS (Fig. 4A). Taken together, this
suggests a predominant lateral transport of suspended particles. Although the ranges of
variability in POC and ETS are low, POC is strongly positively correlated with ETS
(Spearman’s rho = 0.70, p < 0.02, Fig. 6A) in the NEADW of the SG but not in the
NEqCC. The lack of a correlation between POC and ETS in the NEqCC is probably a
consequence of the more refractory POM compared to the SG (Fig. 5A-C). The AAIW
also shows a strong correlation between POM and microbial activity. POC (Fig. 6B)
and PON are both correlated with ETS (Spearman’s rho = 0.82, p < 0.0001 for POC and
0.93, p < 0.0001 for PON) and cell-specific ETS (Spearman’s rho = 0.83, p < 0.002 for
POC and 0.66, p < 0.02 for PON). The fact that POM and ETS activity are strongly
correlated along these water masses supports the hypothesis that deep-water prokaryotic
activity depends to a large extent on suspended particles.
Chapter II. Evidences of dark ocean’s prokaryotic metabolism on suspended POM
85
There are very few published studies relating particle flux and deep-water
microbial metabolism, and these report contradictory results. Nagata et al. (2000)
concluded from a study in the subarctic Pacific that the deep-water microbial activities
are related to the sinking POC fluxes. Also, Simon et al. (2004) found that prokaryotic
production in the mesopelagic waters was significantly correlated to primary production
and surface chlorophyll in the Southern Ocean. Moreover, Anderson et al. (2007)
concluded for the oxygen minimum zone of the Arabian Sea, that the modeled vertical
export flux of detritus was sufficient to account for the measured bacterial production
below the euphotic zone in the Arabian Sea. Ducklow (1993) found that the rates of
DOC release from the sinking particle flux is sufficient to support bacterial production
in the Gulf of Oman, however, insufficient to meet the bacterial carbon demand in the
Fig. 6. Relation between ETS (µmol C m-3 d-1) and POC (µmol L-1) in the NEADW of the (A) SG and in the (B) AAIW. Data are derived from Fig. 5A (for POC) and Fig. 3A (for ETS)
Chapter II. Evidences of dark ocean’s prokaryotic metabolism on suspended POM
86
open Arabian Sea. Additionally, Hansell & Ducklow (2003) found that only prokaryotic
abundance and not activity was related to the POC flux in the Arabian Sea, suggesting
that deep-ocean prokaryotic abundance and activity might depend on the long-term
averages of POC flux and not on the more immediate flux. Recently, Steinberg et al.
(2008), found that the POC flux is too low to meet the bacterial and mesozooplankton
carbon demand at two sites in the Pacific. These authors proposed diel vertical
migration of zooplankton and the associated POC transfer as a mechanism to provide
additional organic carbon for mesopelagic metabolism to resolve the discrepancy
between the POC flux and the mesopelagic carbon demand. Taken together, these
contradictory findings may reflect variability in the transfer efficiency of organic
material from the euphotic layer to the deep sea (Francois et al. 2002) or differences in
the magnitude of other carbon sources, like lateral transport of suspended POM and
DOM. Arístegui et al. (2005b) invoked a coastal-ocean lateral transport of POM to
explain the high prokaryotic metabolic rates measured in the mesopelagic zone of the
Canary Current, where POM concentrations are several times higher than in the open
ocean waters of the Subtropical Gyre (Neuer et al. 2007). A recent box-model study of
the Canary Current region (Alonso-González et al. 2009) supports this view, providing
evidence that suspended POM may account for up to 60 % of the remineralization rates
in the mesopelagic zone.
In order to examine the balance between vertical carbon flux and the prokaryotic
carbon demand (PCD = PHP + R), we estimated the sinking POC flux using the model
of Antia et al. (2001), based on sediment trap data collected from the subpolar region to
the oligotrophic subtropical North Atlantic. The POC available at a depth “z” (in m) is
Turnewitsch R, B. M. Springer, K. Kiriakoulakis, J. C. Vilas, J. Arístegui, G. Wolff, F.
Peine, S Werk, Graf G, Waniek JJ (2007) Determination of particulate organic
carbon (POC) in seawater: The relative methodological importance of artificial
gains and losses in two glass-fiber-filter-based techniques. Mar. Chem. 105:208-
228
UNESCO (1994) Protocols for the Joint Global Ocean Flux Study (JGOFS) Core
Measurement. Intergovernmental Oceanographic Commission, Manual and
Guides 29:169
Varela M, van Aken HM, Sintes E, Herndl GJ (2008) Latitudinal trends of
Crenarchaeota and Bacteria in the meso- and bathypelagic water masses of the
Eastern North Atlantic. Environ. Microb. 10:110-124
Chapter II. Evidences of dark ocean’s prokaryotic metabolism on suspended POM
97
Chapter III
Prokaryotic extracellular enzymatic activity in relation to biomass production and respiration in the meso- and bathypelagic waters of the (sub)tropical Atlantic
F. Baltar, J. Arístegui, E. Sintes, H. M. van Aken, J. M. Gasol, G. J. Herndl
Chapter III. Extracellular enzymatic activity in the deep Atlantic
99
Abstract
Prokaryotic extracellular enzymatic activity, abundance, heterotrophic production
and respiration were determined in the meso- and bathypelagic (sub)tropical North
Atlantic. While prokaryotic heterotrophic production (PHP) decreased from the lower
euphotic layer to the bathypelagic waters by two orders of magnitude, prokaryotic
abundance and cell-specific PHP decreased only by one order of magnitude. In contrast
to cell-specific PHP, cell-specific extracellular enzymatic activity (alpha- and beta-
glucosidase, leucine aminopeptidase, alkaline phosphatase) increased with depth as did
cell-specific respiration rates. Cell-specific alkaline phosphatase activity increased from
the intermediate water masses to the deep waters up to 5-fold. Phosphate
concentrations, however, varied only by a factor of two between the different water
masses, indicating that phosphatase activity is not related to phosphate availability in
the deep waters. Generally, cell-specific extracellular enzymatic activities were
inversely related to cell-specific prokaryotic leucine incorporation. Thus, it is apparent
that the utilization of deep ocean organic matter is linked to higher cell-specific
extracellular enzymatic activity and respiration and lower cell-specific PHP than in
surface waters.
Introduction The main source of dissolved organic matter (DOM) in the open ocean is
phytoplankton extracellular release and grazing processes either directly on
phytoplankton (‘sloppy feeding’) or within the microbial food web (Nagata 2000). Also,
heterotrophic prokaryotes release copious amounts of DOM via their polysaccharidic
envelope surrounding the cells (Heissenberger & Herndl 1994, Heissenberger et al.
1996, Stoderegger & Herndl 1998). Most of the grazing-related DOM release is in the
form of high molecular weight DOM (HMW-DOM, >1000 Da) and also senescent
phytoplankton release mainly HMW-DOM (Lignell 1990). This HMW-DOM, although
comprising only about 20% of the total euphotic DOM pool and even less in the meso-
and bathypelagic waters (Benner et al. 1992), is preferentially utilized by heterotrophic
Chapter III. Extracellular enzymatic activity in the deep Atlantic
100
prokaryotes over the bulk of the low molecular weight DOM (LMW-DOM) (Amon &
Benner 1996). The preferential prokaryotic utilization of HMW-DOM requires cleavage
of the substrate prior to uptake since only molecules <600 Da can be transported
through the prokaryotic cell wall (Weiss et al. 1991).
Thus, prokaryotic plankton synthesize extracellular enzymes to hydrolyze organic
matter (Hoppe et al. 2002). Commonly, macromolecules are cleaved by a consortium of
hydrolases: endohydrolases cleave off oligomers and exohydrolases cleave the terminal
ends of the oligomers to produce monomers (Hoppe et al. 2002). Fluorogenic substrate
analogs are used to quantify in situ extracellular enzymatic activity (Hoppe et al. 2002).
While fluorogenic model substrates lack the chemical complexity of natural substrates
(Arnosti et al. 2005), they have been commonly applied to determine potential
extracellular enzymatic activities over a broad range of aquatic environments (Chrost
1989, Rath et al. 1993, Misic et al. 2006, Misic & Fabiano 2006, Williams & Jochem
2006) since they were introduced to microbial ecology (Hoppe 1983). Most of the
previous studies on extracellular prokaryotic activity focused on the euphotic zone and,
in the marine environment, on coastal areas (e.g., Sala et al. 2001, Zaccone et al. 2003,
Misic & Fabiano 2006, Williams & Jochem 2006). Only very few vertical profiles of
extracellular enzymatic activities are available for the open oceans extending from the
euphotic zone to the meso- or bathypelagic realm (Hoppe et al. 1993, Koike & Nagata
1997, Hoppe & Ullrich 1999, Fukuda et al. 2000).
Generally, heterotrophic prokaryotes in the meso- and bathypelagic layers of the
ocean are limited by the availability of easily metabolizable organic matter. A specific
sequence in the utilization of DOM has been shown for the oceanic water column as
indicated by the increasing C:N:P ratio of the DOM in different depth layers
(Hopkinson & Smith 2005). From the changes in the elemental composition of the
DOM with depth, it appears that the phosphorus compounds are preferentially utilized,
followed by nitrogenous compounds (Benner 2002, Hopkinson & Smith 2005).
Consequently, the deep-ocean DOM is depleted in N and P but rich in C which is,
however, rather refractory as indicated by its average age of about 6000 yrs (Bauer et al.
1992).
Sedimenting particulate organic matter (POM) might represent a major source of
organic matter for deep-water microheterotrophic communities (Tamburini et al. 2003).
As in DOM, POM also exhibits an increase in the C:N ratio with depth (Schneider et al.
2003, Chapter II). In contrast to organic N and P in the deep ocean, inorganic N and P
Chapter III. Extracellular enzymatic activity in the deep Atlantic
101
are readily accessible to heterotrophic prokaryotes (Kirchman 2000). Hence, it is
reasonable to assume that deep-water prokaryotic extracellular enzymatic activity is
primarily expressed to target the carbon moieties in the available deep-water organic
matter. Hoppe & Ullrich (1999) detected high phosphatase activity in the mesopelagic
waters of the Arabian Sea coinciding with high concentrations of phosphate. These
authors suggested that heterotrophic prokaryotes might use phosphatase activity to
mitigate C limitation.
In this study, we addressed the question whether deep-water prokaryotes maintain
the same relation between extracellular enzymatic and metabolic activity as at the base
of the euphotic waters (≈100 m depth). Therefore, we determined the extracellular
enzymatic activity of two glycolytic enzymes (α-glucosidase and β-glucosidase), one
proteolytic enzyme (leucine aminopeptidase) and alkaline phosphatase, along with
prokaryotic abundance, production and potential respiration via ETS (electron transport
system) measurements at ≈ 100 m depth, in the mesopelagic (200-1000 m depth) and
bathypelagic (1000-4500 m depth) waters of the (sub)tropical Atlantic. We
hypothesized that with increasing depth, heterotrophic prokaryotic communities express
higher cell-specific extracellular enzymatic activity while cell-specific biomass
production decreases in response to the increasingly recalcitrant organic matter.
Material and Methods
Study site and sampling
During the ARCHIMEDES-2 cruise with RV Pelagia (November to December
2006), extracellular enzymatic activity was measured on 16 out of 20 stations occupied
in total in the eastern (sub)tropical Atlantic along an eastern and a western N-S transect
(Fig. 1). Meso- and bathypelagic samples were taken from the main water masses down
to 4500 m depth and additionally, one subsurface sample per station was taken at the
base of the euphotic layer at around 100 m depth. Sampling was performed with 22 10-
L NOEX bottles mounted in a frame also holding sensors for conductivity, temperature,
depth, chlorophyll fluorescence, and optical backscattering. Subsurface waters consisted
Chapter III. Extracellular enzymatic activity in the deep Atlantic
102
of the more saline subtropical and the less saline tropical subsurface waters. The waters
below the thermocline (250 to 500 m depth) were formed by either North Atlantic
Central Water (NACW; only found at the northernmost station – St. 50) or South
Atlantic Central Water (SACW; rest of the stations). Underneath these central waters,
the high salinity Mediterranean Sea Outflow Water (MSOW) at the northern stations,
and the low salinity Antarctic Intermediate Water (AAIW) at the southern stations
(from St. 13 – 37) were found between 700 to 900 m depth. Deeper in the water
column, Upper Northeast Atlantic Deep Water (UNEADW), Middle Northeast Atlantic
Deep Water (MNEADW) and Lower Northeast Atlantic Deep Water (LNEADW) is
flowing southwards with cores at around 1800 m, 2500-2750 m and 4000 m depth,
respectively. The specific water masses were identified based on their distinct
temperature-salinity characteristics, oxygen content and inorganic nutrient signatures
(Table 1).
Water from the NOEX bottles was collected in acid-rinsed (0.1 N HCl)
polycarbonate flasks rinsed three times with sample water prior to collecting samples
for prokaryotic abundance, prokaryotic heterotrophic production, potential respiration
Fig. 1. (A) Stations occupied during ARCHIMEDES-II. Both transects (eastern and western) began at Station 50, but the eastern transect finished at St. 28 and the western at St 30
Chapter III. Extracellular enzymatic activity in the deep Atlantic
103
and extracellular enzymatic activities. The samples were either immediately processed
for specific measurements aboard the ship or stored for subsequent analyses in the home
lab as described below.
Tab
le 1
. Mea
n (±
SE
) va
lues
of
phys
ical
, che
mic
al a
nd b
iolo
gica
l pr
oper
ties
, cha
ract
eriz
ing
the
diff
eren
t w
ater
mas
ses
sam
pled
dur
ing
AR
CH
IME
DE
S-II
. PA
: Pro
kary
otic
abu
ndan
ce. P
HP:
Pro
kary
otic
het
erot
roph
ic p
rodu
ctio
n. E
TS: E
lect
ron
trans
port
syst
em. N
umbe
r of
mea
sure
men
ts g
iven
in
pare
nthe
sis.
Subs
urfa
ce: ≈1
00 m
dep
th,
SAC
W:
Sout
h A
tlant
ic C
entra
l W
ater
, A
AIW
: A
ntar
ctic
In
term
edia
te W
ater
, M
SOW
: M
edite
rran
ean
Sea
Out
flow
Wat
er,
UN
EAD
W:
Upp
er N
orth
east
Atla
ntic
Dee
p W
ater
, M
NEA
DW
: M
iddl
e N
orth
east
Atla
ntic
Dee
p W
ater
, LN
EAD
W: L
ower
Nor
thea
st A
tlant
ic D
eep
Wat
er
Chapter III. Extracellular enzymatic activity in the deep Atlantic
104
Prokaryotic abundance (PA) determined by flow cytometry
Prokaryotic plankton collected from the different depth layers of the water
column were enumerated using flow cytometry. Samples (2 ml) were fixed with 1%
paraformaldehyde (final concentration), shock-frozen in liquid nitrogen for 5 min and
stored at -80°C (Kamiya et al., 2007). Picoplankton cells were stained with SYBR-
Green I and enumerated with a FACSCalibur flow cytometer (Becton Dickinson) within
2 months. Immediately before analysis, the thawed picoplankton samples were stained
with SYBR-Green I at room temperature in the dark for 15 min. Fluorescent
microspheres (Molecular Probes Inc.) with a diameter of 1 µm were added to all
samples as an internal standard. Counts were performed with an argon laser at 488 nm
wavelength. Prokaryotic cells were enumerated according to their right angle scatter and
green fluorescence. The counting window of the flow cytometer was set to exclude
eukaryotic picoplankton.
Prokaryotic heterotrophic production (PHP) by [3H] leucine incorporation
Bulk PHP was measured by incubating triplicate 10-40 mL samples and
formaldehyde-killed blanks (2% final concentration) with 10 nM [3H]-leucine (final
concentration, specific activity 160 Ci mmol-1; Amersham) in temperature-controlled
incubators in the dark at in situ temperature for 4-10 h (Kirchman et al. 1985).
Incubations were terminated by adding formaldehyde (2% final concentration) before
filtering the samples and the blanks through 0.2-µm polycarbonate filters (25 mm filter
diameter; Millipore). Subsequently, the filters were rinsed three times with 5% ice-cold
trichloroacetic acid, dried, and placed in scintillation vials. Scintillation cocktail (8 ml
Canberra-Packard Filter Count) was added, and after 18 h, counted in a liquid
scintillation counter (LKB Wallac model 1212). The mean disintegrations per minute
(DPM) of the formaldehyde-fixed blanks were subtracted from the mean DPM of the
respective samples, and the resulting DPM converted into leucine incorporation rates.
Prokaryotic carbon biomass production was estimated using a conservative theoretical
conversion factor of 1.55 kg C mol-1 Leu assuming no internal isotope dilution
(Kirchman & Ducklow 1993).
Activity of the ETS
ETS activity was measured following the modifications of the tetrazolium
Chapter III. Extracellular enzymatic activity in the deep Atlantic
105
reduction technique as described earlier (Arístegui & Montero 1995). Some minor
modifications of the method were made to increase its sensitivity. Briefly, about 10 l of
sample was filtered through a Whatman GF/F filter (47-mm diameter). Filters were
folded into cryovials and immediately stored in liquid nitrogen until analysis in the
laboratory. Back in the laboratory, the filters with the collected material were
homogenized in 2.5 ml phosphate buffer with a Teflon-glass tissue grinder at 0–4ºC for
1.5 min. A 0.9 ml aliquot of the crude homogenate was incubated in duplicate with 0.5
ml of substrate solution (NADH, NADPH) and 0.35 ml of 2-(4-iodophenyl)-3-(4-
nitrophenyl)-5-phenyltetrazolium chloride (INT) at 18ºC for 20 min. The reaction was
quenched by adding 0.25 ml of a mixture of formalin and phosphoric acid. The
quenched reaction mixture was centrifuged at 4000g at 4ºC for 20 min and the
absorbance of the particle-free solution measured in a Beckman DU-650
spectrophotometer at 490 and 750 nm wavelength after adjusting the sample to room
temperature. Readings at 750 nm, to correct for turbidity, were always negligible. In
addition to the samples, duplicate controls were run by replacing the crude extract with
a clean Whatman GF/F filter homogenized in phosphate buffer. ETS activity was
calculated using the equation given in Packard & Williams (1981):
ETSASSAY (mmol O2 m-3 h-1) = H × S × (ODcorr ) / (1.42 × V × f × t/60) × 22.4
where H is the volume of the homogenate (in ml), S is the volume of the
quenched reaction mixture (in ml), ODcorr is the absorbance of the sample measured at
490 nm wavelength and corrected for blank absorbance, V is the volume (in l) of the
seawater filtered through the Whatman GF/F filter, f is the volume of the homogenate
used in the assay (in ml), t is the incubation time (in min), 60 converts minutes to hours,
the factor 1.42 converts the INT-formazan formed to oxygen units (in µl) and 22.4
converts the µl O2 to µmol O2. ETS activity was corrected to in situ temperature using
glucoside, 4-MUF-β-D-glucoside and MUF-phosphate was measured to estimate
potential activity rates of α-, β-glucosidase, aminopeptidase and alkaline phosphatase
(Hoppe 1983). All the chemicals were obtained from Sigma and appropriate stocks
prepared in methyl-cellosolve. The activity of the enzymes is linearly related to the
fluorescence resulting from the cleavage of MUF or MCA and was detected
spectrofluorometrically using a Fluorolog-3 fluorometer with a MicroMax 384
microwell plate reader (Horiba) at an excitation and emission wavelength of 365 nm
and 445 nm, respectively. The samples (145 µl) were incubated in microwell plates, in
the dark and at in situ temperature for 24 h. The linearity of the increase in fluorescence
upon addition of fluorogenic substrate over time was checked by incubating samples up
to 48 h. The increase in the relative fluorescence over time was transformed to cleavage
activity using a standard curve established with different concentrations of the
fluorochromes MUF and MCA added to 0.2-µm filtered sample water. In order to
determine enzyme kinetics, model substrate concentrations should cover a sufficiently
wide range. In this study, 12 different concentrations were used for the different
substrates ranging from 0.6 µM to 1200 µM. For routine measurements of α- and β-
glucosidase activities, a final concentration of 10 µM was applied, previously
determined as saturating concentration. As a consequence of adding saturating
concentrations, the rates measured with this technique are potential rates.
Profiles of enzyme kinetics for alkaline phosphatase and leucine-aminopeptidase
were determined at each station. The saturation curves were transformed into a
Lineweaver-Burk or Hanes-Woolf plot to reveal maximum enzyme activity (Vmax, nmol
l-1 h-1) and substrate affinity (Michaelis-Menten half saturation constant; Km, µM). Cell-
specific ectoenzyme activity (amol cell-1 h-1) was calculated by dividing Vmax by
prokaryotic abundance. The ratio cell-specific Vmax/Km, which is the slope of the
Michaelis–Menten equation at low substrate concentrations, was also calculated
Chapter III. Extracellular enzymatic activity in the deep Atlantic
107
(Healey 1980). This ratio is an indicator of the ability of prokaryotes to attain a high
hydrolysis rate at low substrate concentrations since organisms might compensate for a
high Km by a high Vmax.
Statistical analysis
Data were log transformed to attain normality before the t-student test was
applied. To check the normality of the individual data sets, the Kolmogorov–Smirnoff
test was used. For calculating uncertainties on ratios, error propagation was taking into
account; standard deviations were calculated using the formula for the propagation of
error (Bevington & Robinson 2003) as follows:
Δz / z = √ [((Δx)2 / x) + ((Δy)2 / y)]
where z is the percent abundance or the percent assimilating and is equal to x divided by
y, as described above. Δx and Δy are the standard deviations associated with x and y,
respectively. Δz is the standard deviation calculated for z. Standard deviations were then
converted to standard errors for each calculation.
Results
Prokaryotic abundance (PA) and prokaryotic heterotrophic production (PHP)
Total PA (Fig. 2A) decreased exponentially with depth by one order of
magnitude in both the eastern and western section of the transect in the North Atlantic
(R2=0.73, n=65 and R2=0.89, n=60, respectively). In all the water masses, PA was
higher in the western than the eastern section (t-test; p = 0.03, n = 60) with the largest
difference between the two sections detected in the Antarctic Intermediate Water
(AAIW).
As PA, also PHP (Fig. 2B) decreased exponentially with depth (R2=0.31, n=59
and R2=0.52, n=49 for the eastern and western transect, respectively), however, by two
orders of magnitude from the subsurface layer (≈100 m depth) to the Lower Northeast
Chapter III. Extracellular enzymatic activity in the deep Atlantic
108
Atlantic Deep Water (LNEADW) (Table 1). No significant difference in the mean PHP
was detectable between the individual water masses of the eastern and western transect
(t-test; p = 0.53, n = 49). In the subsurface layer, PHP was about two times higher in the
eastern than in the western section, probably because of the proximity to the upwelling
waters at the continental slope (Fig. 2B). Cell-specific PHP decreased also
exponentially with depth (R2=0.42, n=59 and R2=0.57, n=49 for the eastern and western
transect, respectively), albeit only by one order of magnitude (Fig. 2C). Mean cell-
specific PHP was not significantly different between both transects (t-test; p = 0.30, n =
49).
Potential respiration estimated via ETS measurements
Potential respiration rates as determined by ETS measurements decreased over the
sampled depth-range by one order of magnitude (204 – 30.3 µmol C m-3 d-1; Table 1,
A B C
D E
Fig. 2. Distribution of basic prokaryotic parameters in the different water masses through the eastern and western transect (see Table 1 for water depths of each water mass) (A) prokaryotic abundance (cell-1 ml-1) (B) prokaryotic heterotrophic production (µmol C m-3 d-1), (C) Cell-specific heterotrophic prokaryotic production (fmol C cell-1 d-1), (D) ETS (µmol C m-3 d-1), (E) cell-specific ETS (fmol C cell-1 d-1). Error bars represent SE of 7 - 42 measurements
Chapter III. Extracellular enzymatic activity in the deep Atlantic
109
Fig. 2D). Although ETS activity was higher in the eastern than in the western transect in
all the water masses, except in the AAIW, overall, ETS activity was not significantly
different between both transects (t-test; p = 0.30, n = 60). Individual water masses,
however, exhibited pronounced differences in ETS activity such as the Middle
Northeast Atlantic Deep water (MNEADW) and the Mediterranean Sea Outflow Water
(MSOW) with 2 and 2.5 times higher ETS activity in the eastern than in the western
transect, respectively. Although both prokaryotic abundance (Fig. 2A) and ETS
measurements (Fig. 2D) decreased with depth, cell-specific ETS showed no systematic
trend with depth, with the averages of the different water masses ranging from 0.42-1.8
fmol C cell-1 d-1 (Fig. 2E). Cell-specific ETS was significantly higher (t-test; p =
0.00001, n = 53) in all the water masses of the eastern than in the western transect
(including the AAIW, in contrast to bulk ETS activity). In the MNEADW and MSOW,
cell-specific ETS activity was more than three times higher in the eastern than in the
western transect (Fig. 2E).
Extracellular enzymatic activity (EEA)
In contrast to prokaryotic heterotrophic production, EEA decreased only slightly
with depth at the two transects (Fig. 3). α-glucosidase (AGase; Fig. 3A, B) and β-
phosphatase (APase; Fig. 3G, H) activities were generally higher than AGase and
BGase, particularly at the base of the euphotic layer. LAPase and APase, however,
decreased more with depth than AGase and BGase.
In contrast to cell-specific biomass production, cell-specific EEA generally
increased with depth at both transects (Fig. 4). On average, cell-specific AGase
increased from 0.14 amol cell-1 h-1 at the base of the euphotic layer to 2.21 amol cell-1 h-
1 in the LNEADW, cell-specific BGase from 0.22 to 1.02 amol cell-1 h-1, cell-specific
LAPase from 25.5 to 129.2 amol cell-1 h-1, and APase from 3.5 to 28.2 amol cell-1 h-1.
No significant differences between the eastern and the western transect for any of the
cell-specific EEA were detectable (t-test; p = 0.74, n = 26 for AGase; t-test; p = 0.89, n
= 32 for BGase; and t-test; p = 0.24, n = 49 for LAPase) except for APase which was
significantly higher in the eastern than in the western transect (t-test; p = 0.0028, n =
48).
Chapter III. Extracellular enzymatic activity in the deep Atlantic
110
Dynamics in kinetics of APase and LAPase
The maximum rates of hydrolysis (Vmax) of APase and LAPase decreased with
depth (Fig. 5A, B). Vmax of APase was about one order of magnitude lower than the
Vmax of LAPase. No significant difference was discernable between the eastern and
western transects for the Vmax of APase (t-test; p = 0.53, n = 50) and for LAPase Vmax
(t-test; p = 0.54, n = 46). In the AAIW, however, the decreasing trend with depth was
not observed, as we measured a lower APase Vmax and higher LAPase Vmax in this water
mass than in its adjacent water masses (Fig. 5A, B).
A B
C D
E F
G H
Eastern Western
AGase AGase
BGase BGase
LAPase LAPase
APase APase
[nmol l-1 h-1] [nmol l-1 h-1]
Fig. 3. Distribution of AGase (alpha-glucosidase) (A, B), BGase (beta-glucosidase) (C, D), LAPase (leucine aminopeptidase) (E, F) and APase (alkaline phosphatase) (G, H) activity throughout the water column along the western (left panels) and eastern (right panels) transect in the North Atlantic; values are given in nmol l-1 h-1. Note the different depth range in both transects
Chapter III. Extracellular enzymatic activity in the deep Atlantic
111
The half-saturation constant (Km) of APase was higher in subsurface waters only
in the upwelling regions, showing a relative minimum in intermediate waters (especially
in the MSOW for APase and LAPase) and then increasing with depth (Fig. 5C, D).
There were no significant differences discernable between the eastern and western
transect in the Km of APase and LAPase (t-test; p = 0.24, n = 49 for APase Km; and t-
test; p = 0.89, n = 47 for LAPase Km).
A B
C D
E F
G H
Eastern Western
AGase AGase
BGase BGase
LAPase LAPase
APase APase
[amol cell-1 h-1] [amol cell-1 h-1]
Fig. 4. Distribution of cell-specific AGase (A, B), BGase (C, D), LAPase (E, F) and APase (G, H) activity throughout the water column along the western (left panels) and eastern (right panels) transect in the North Atlantic; values are given in amol cell-1 h-1. Note the different depth range in both transects
Chapter III. Extracellular enzymatic activity in the deep Atlantic
112
Cell-specific potential hydrolytic activity (Vmax cell-1) increased with depth for
both APase and LAPase (Fig. 6A, B), and was significantly higher (cell-specific APase
Vmax: t-test; p = 0.00001, n = 62; cell-specific LAPase Vmax: t-test; p = 0.00001, n = 64)
in the deep-water masses (UNEADW, MNEADW and LNEADW) than in the
subsurface to intermediate water masses (subsurface, SACW, AAIW and MSOW).
Significantly higher cell-specific potential hydrolytic activity was found at the eastern
transect (t-test; p = 0.0015, n = 49 for APase Vmax) but not for cell-specific LAPase
Vmax (t-test; p = 0.11, n = 46). The ratio of cell-specific Vmax : Km was significantly
higher for both enzymes at the eastern than the western transect (t-test; p = 0.001, n =
49 for APase and p = 0.038, n = 46 for LAPase). This ratio increased with depth for
both enzymes, ranging from 0.018-4.25 cell-1 h-1 for APase (Fig. 6C) and 0.024-0.75
cell-1 h-1 for LAPase (Fig. 6D), and was significantly higher (cell-specific APase Vmax :
Km: t-test; p = 0.0004, n = 56; cell-specific LAPase Vmax : Km: t-test; p = 0.0002, n = 64)
in the deep water masses (UNEADW, MNEADW and LNEADW) than in the
subsurface to intermediate water masses (subsurface, SACW, AAIW and MSOW).
D
A B
C
Fig. 5. Ectoenzyme kinetics of APase (A, C) and LAPase (B, D) throughout the water column along the eastern and western transect in the North Atlantic; (A, B) Vmax (nmol h-1), (C, D) Km (µM). Error bars represent SE of 6 - 40 measurements
Chapter III. Extracellular enzymatic activity in the deep Atlantic
113
Thus, bulk maximum rates of hydrolysis decreased with depth while the half-
saturation constant, cell-specific hydrolytic activity and cell-specific Vmax : Km ratio
increased.
Discussion
Uncertainties in the estimation of the prokaryotic activity rates in the deep ocean
All the methods applied here to determine the different prokaryotic activity
parameters have their own inherent limitations. Prokaryotic biomass production was
assessed by the incorporation of leucine. While most of the bacterial groups are
incorporating leucine (Cottrell & Kirchman 2003), at least some Archaea, reported to be
similarly important in terms of abundance in the deep North Atlantic (Teira et al. 2006),
might be chemoautotrophic and hence, not take up leucine. However, it has been shown
for the North Atlantic and the Arctic Ocean that the percentage of Archaea taking up
leucine is roughly similar to that of Bacteria (Herndl et al. 2005, Kirchman et al. 2007).
Moreover, a large variation in the conversion factor of incorporated leucine to produced
carbon biomass has been reported for surface Atlantic waters (Alonso-Saéz et al. 2007).
Also, the determination of respiration via ETS relies on a conversion factor to convert
the measured absorption of the assay into oxygen consumption or carbon dioxide
A B C D
Fig. 6. Cell-specific (A) APase Vmax (amol cell-1 h-1) (B) LAPase Vmax (amol cell-1 h-1) and (C) APase Vmax/Km (pl cell-1 h-1) (D) LAPase Vmax/Km (pl cell-1 h-1) in the different water masses of the eastern and western transect in the North Atlantic. Error bars represent SE of 6-40 measurements
Chapter III. Extracellular enzymatic activity in the deep Atlantic
114
production (Packard et al. 1996).
The use of fluorogenic substrate analogs to estimate extracellular enzymatic
activity (EEA) bears at least three problems. First, it targets only the exohydrolase
activity which cleaves the terminal end of oligomers while the rate-limiting step in the
cleavage of macromolecular DOM is likely the endohydrolase activity cleaving
polymers into oligomers (Hoppe et al. 2002). The second problem associated with the
fluorogenic substrate analogs is that they are model compounds and do not reflect the
enormous diversity of potential extracellular enzyme substrates in nature. Third, with
the enzyme assay applied here, we did not discriminate among potentially present
different types of each extracellular enzyme. Using a zymography approach and
capillary electrophoresis, up to 8 different beta-glucosidases were detectable at specific
times in the coastal North Sea, all of them with specific enzyme kinetics (Arrieta &
Herndl 2001, 2002).
We have normalized leucine incorporation, respiration and EEA to total
prokaryotic abundance to compare the cell-specific activity of prokaryotes of sub-
surface waters with that in deep-waters. This assumes that all the prokaryotic cells have
similar activity levels, which is certainly not the case. A part of the enumerated cells
might be dormant or dead (Heissenberger et al. 1996) and different prokaryotic groups
might express different activity levels (Martínez et al. 1996, Cottrell & Kirchman 2003)
and even intraspecific differences in activity levels exist (Sintes & Herndl 2006). For
the study area in the North Atlantic, Varela et al. (2008) report a contribution of
Bacteria (determined by FISH using the Eub338I-III oligonucleotide probe) to total
picoplankton abundance ranging from about 40 to 65% with no pronounced trend with
depth while the contribution of Archaea was generally below 10% of total picoplankton
abundance. Hence, despite all the uncertainties concerning the inter- and intraspecific
variability of the different activity levels measured here, there are no major differences
in the contribution of Bacteria and Archaea to total prokaryotic abundance from about
100 m depth to the deep-waters in the study area. Taken together, the contrasting depth-
related patterns in cell-specific leucine incorporation versus cell-specific EEA and
respiration indicate that these differences are real and not methodological artifacts. The
observed contrasting pattern in cell-specific leucine incorporation versus cell-specific
EEA and respiration is most likely also not caused by measuring these parameters under
surface pressure rather than under in situ pressure conditions. While the absolute values
of the individual parameters measured at surface pressure conditions might deviated
Chapter III. Extracellular enzymatic activity in the deep Atlantic
115
from those in situ, there is no reason to assume that prokaryotic biomass production and
respiration would show opposite trends under in situ than under surface pressure
conditions. Otherwise, the measured growth efficiencies for bathypelagic prokaryotic
communities of around 2% (Reinthaler et al. 2006) would be unrealistically deviating
from this value which seems reasonable considering the comparably low growth
efficiencies reported for prokaryotic communities of oligotrophic surface waters (del
Giorgio et al. 1997, del Giorgio & Cole 1998). Also, until now, there is no consistent
trend reported in the literature on the effect of pressure on bathypelagic prokaryotic
activity including extracellular enzymatic activity. There is evidence that deep water
prokaryotic activity is overestimated if measured under decompressed conditions
(Jannasch & Wirsen 1982). However, other authors report inhibition of prokaryotic
activity because of decompression (Tamburini et al. 2003). It is well known that
prokaryotic enzymes might be adapted to a specific hydrostatic pressure (Jannasch &
Taylor 1984, Somero 1992). If this holds true on a community level our bulk
extracellular enzymatic activity would be underestimated under decompressed
conditions. In fact, Tamburini et al. (2002) showed that LAPase and APase rates
measured in samples maintained under in situ pressure conditions were around 2.3 times
higher than those measured in their decompressed counterparts. Thus, our reported
increase in cell-specific extracellular enzymatic activity with depth might be even
higher under in situ conditions. Hence, we are confident that the general trend of
increasing cell-specific extracellular enzymatic activity with depth is real and if there is
a bias due to decompressing the samples, the reported rates are likely underestimations
of the actual rates under in situ pressure conditions.
Alkaline phosphatase utilization in the deep: the paradox of high APase at high
endproduct concentrations
It is well documented that the expression of many prokaryotic ectoenzymes is
regulated by the concentration of its endproduct (Chrost 1991). Chrost & Overbeck
(1987) observed in lake Plußsee, that APase significantly decreased when the ambient
phosphate concentrations were higher than 0.5 µM. Ammerman & Azam (1991)
reported that APase activity was usually low and sometimes undetectable in P-rich
waters, and Nausch et al. (1998) observed a significant decrease in APase at ambient
phosphate concentrations higher than 1 µM in the Baltic Sea. Also Zaccone et al. (2003)
found an inverse relation between APase and phosphate concentrations from the surface
Chapter III. Extracellular enzymatic activity in the deep Atlantic
116
to deep waters in the Mediterranean Sea.
We found distinct water mass- and depth-related patterns of cell-specific APase in
relation to PO4 concentrations (Fig. 7). While phosphate concentrations varied only 2-
fold over all the water masses, cell-specific APase activity varied more than 7-fold with
lowest average cell-specific APase in the upper and intermediate waters increasing with
depth (Fig. 7). This specific pattern indicates that the expression of APase is not
regulated by the concentration of its endproduct in deep Atlantic waters, a pattern also
identified by Hoppe & Ullrich (1999) in the mesopelagic waters of the Arabian Sea. It
indicates that shifts in the functioning of APase might take place from the upper
mesopelagic waters with their relatively higher contribution of reactive organic matter
to the deeper water masses characterized by old, refractory organic matter. As
hypothesized by Hoppe & Ullrich (1999), C-limited prokaryotes in the deep strata of the
water column might use APase to access organic C moieties from organic matter, rather
than phosphate directly.
Relation between EEA and prokaryotic activity parameters in the deep oceanic
water column
There are only few reports available on the EEA in the meso- and bathypelagic
realm of the open–ocean while considerable information is available for open surface
waters. The bulk APase activity reported in this study (0.04-3.7 nmol l-1 h-1) is in the
same range as reported by Hoppe & Ullrich (1999) for the deep Indian Ocean (2-4.5
nmol l-1 h-1 at 800 m), but is higher than that the range of APase activity (0.03-0.3 nmol
Fig. 7. Cell-specific APase (amol cell-1 h-1) versus phosphate concentration (µmol.kg-1) in the different water masses. Error bars represent SE of 6-40 measurements
Chapter III. Extracellular enzymatic activity in the deep Atlantic
117
l-1 h-1 at 1000-4000 m) reported by Koike & Nagata (1997) for the deep central Pacific
Ocean. The difference between the APase activity reported by Koike & Nagata (1997)
and our data might be due to the fact that Koike & Nagata (1997) measured APase
activity associated with particles (>0.2 µm) only and thus, excluding dissolved APase
activity. Cell-specific EEA in the meso- and bathypelagic zones have been only
reported in a few studies (Table 2). Our ranges of EEA are similar to the data from the
northwestern Mediterranean Sea (Tamburini et al. 2002, Misic & Fabiano 2006), the
Oman coast and the Arabian Sea (Hoppe & Ullrich 1999), and the central North
Atlantic (Chapter IV). In all the studies (except in Misic & Fabiano 2006), an increase
of cell-specific EEA was observed with depth. This increase in cell-specific EEA with
depth corresponds to the increase in cell-specific respiration with depth reported for
different regions (Table 3). In contrast to that, cell-specific PHP exhibits a larger
variability depending on the sampling conditions and location (Table 4). Generally, cell-
specific PHP decreases with depth to the bathypelagic layers (Table 4).
Rhone river plume Euphotic zone (0-100 m) 0.34-0.40 Kirchman et al. 1989
Mesopelagic zone (150-700 m) 0.14-0.34
Natural diatom aggregates in
Øresund (Denmark) Natural diatom aggregates 18.0-51.8 Grossart et al. 2003
Surrounding waters 4.3-16.3
Dona Paula bay (west coast
of India)
13-month field observations from
surface waters (1 m) 0.26-3.9 Bhaskar & Bhosle 2008
Coastal transition zone North
Atlantic Surface layer (5-82 m) 0.57-4.68 Chapter I
Mesopelagic zone (200-760 m) 0.016-0.50
2000 m 0.020-0.33
SE Mediterranean Sea Euphotic zone (0-100 m) 0.03-0.09 Robarts et al. 1996
Mesopelagic zone (100-1000 m) 0.03-0.20
Gulf of Mexico 0-300 m 0.01-1.33 Skoog et al. 1999
Sevastopol Bay
(SB; Black Sea, Ukraine) Coastal water 6.63 ± 4.51
North Wales <0.8 um 0.4–6.8 Blight et al. 1995
Louisiana (USA) shelf
waters <1 um 2.4–8.7 Biddanda et al. 1994
Southern North Sea Seasonal Cycle 0.3-3.6 Reinthaler et al. 2005
Elbe Estuary, Germany Aggregate on sampling day 22.0 Ploug et al. 2002
Aggregate on day 6 of incubation 2.6
Kerguelen Plateau
(Southern Ocean) Mean value upper 100m of <0.8 um 0.5-1.9 Obernosterer et al. 2008
Bathypelagic zone (1000-4500 m) 0.23-6.90
Temperate North
Atlantic Subsurface Layer (100-135 m) av. 0.85 Reinthaler et al. 2006
Oxygen minimum (402-725 m) av. 1.67
Bathypelagic zone (1800-3000 m) av. 2.74
Subtropical North
Atlantic Subsurface Layer (100) 0.04-3.82 Chapter II
Mesopelagic zone (200-1000 m) 0.12-5.23
Bathypelagic zone (1000-5000 m) 0.43-7.66
Sub(tropical) North
Atlantic Subsurface Layer (100) 0.17-1.18 This chapter
Mesopelagic zone (200-1000 m) 0.14-2.88
Bathypelagic zone (1800-4500 m) 0.23-6.90
Chapter III. Extracellular enzymatic activity in the deep Atlantic
120
Tasman Sea Euphotic zone (0-100 m) 0.01-0.086 Moriarty & O'Donohue 1995
Mesopelagic zone (100-1200 m) 0.002-0.091
East Sea, Korea Euphotic zone (0-200 m) 0.028-1.75 Cho et al.2000
Mesopelagic zone (200-1000 m) 0.014-0.23
Southern North Sea Seasonal Cycle 0.41-3.0 Reinthaler et al. 2005
Global data set Epipelagic (0-200) av. 0.199 ± 0.018 Arístegui et al. 2009
Mesopelagic zone (200-1000 m) av. 0.112 ± 0.017
Bathypelagic zone (1000-4000 m) av. 0.076 ± 0.010
Subarctic Pacific Euphotic zone (0-100 m) 0.0016-0.402 Nagata et al. 2000b
Mesopelagic zone (100-1000 m) 0.0005-0.0050
Bathypelagic zone (1000-5834 m) 0.0003-0.0011
Indian Ocean Euphotic zone (0-200 m) 0.007-0.308 Ducklow 1993
Mesopelagic zone (200-1000 m) 0.002-0.007
Southern Ocean Euphotic zone (0-200 m) 0.005-0.21 Simon et al. 2004
Mesopelagic zone (200-1000 m) 0.003-0.56
Temperate North Atlantic Subsurface Layer (100-135 m) 0.004-0.12 Reinthaler et al. 2006
Oxygen minimum (402-725 m) 0.002-0.14
Bathypelagic zone (1800-3000 m) 0.0005-0.26
Subtropical North Atlantic Subsurface Layer (100) 0.01-0.07 Chapter II
Mesopelagic zone (200-1000 m) 0.001-0.05
Bathypelagic zone (1000-5000 m) 0.0004-0.01
Central Atlantic Subsurface Layer (100) 0.26-1.61 Chapter IV
Mesopelagic zone (200-1000 m) 0.012-1.33
Bathypelagic zone (1000-7000 m) 0.0017-0.046
Sub(tropical) North Atlantic Subsurface Layer (100) 0.01-0.05 This chapter
Mesopelagic zone (200-1000 m) 0.0005-0.03
Bathypelagic zone (1800-4500 m) 0.0001-0.004
Cell-specific LAPase activity decreases exponentially with increasing cell-
specific leucine incorporation (Fig. 8). Thus, biomass production decreases with
increasing expression of extracellular enzymes.
Generally, the oceanic DOM pool is characterized by increasing C:N:P ratios with
depth (Hopkinson & Smith 2005). Also, it has been observed that the amino acid :
carbohydrate ratio of sinking POM decreases with depth (Haake et al. 1993), indicating
that proteinaceous components of sinking POM are more rapidly degraded than the
polysaccharide fraction (Skoog & Benner 1997). Experiments have consistently shown
that bacteria degrade proteins faster than polysaccharides during decomposition of
phytoplankton-derived detritus (Skopintsev 1981) and, thus, that the LAPase : BGase
ratios (which can be interpreted as the degradation of protein relative to that of
Chapter III. Extracellular enzymatic activity in the deep Atlantic
121
polysaccharides) decrease during phytoplankton decay (Middelboe et al. 1995). These
general trends suggest that the relative concentration of polysaccharides in sinking POM
increases with depth, resulting in an intensive supply of polysaccharide-rich material to
deeper waters and a decrease in the LAPase : BGase ratio with depth as observed in the
present study (Fig. 9), where the LAPase : BGase ratio was significantly higher (t-test; p
< 0.001, n = 44) in the deep water masses (UNEADW, MNEADW and LNEADW) than
in the subsurface to intermediate water masses (subsurface, SACW, AAIW and
MSOW).
Davey et al. (2001), in the only other study where extracellular enzyme kinetics
have been measured below the euphotic zone, report an increase in the Km with depth in
distinct profiles of LAPase to 200 m depth in the North Atlantic, while the Vmax
decreased. This trend is in agreement with our study for the full depth range (Fig. 5).
Fig. 8. Relation between cell-specific leucine incorporation and cell-specific leucine aminopeptidase (LAPase) activity. Data are derived from Fig. 2C (for cell-specific leucine incorporation) and Fig. 4E, F (for cell-specific leucine aminopeptidase)
Fig. 9. Ratio of LAPase:BGase in the different water masses of the eastern and western transect in the North Atlantic. Error bars represent SE of 3-10 measurements
Chapter III. Extracellular enzymatic activity in the deep Atlantic
122
Azúa et al. (2003) studied the influence of the quality of the organic matter on the
hydrolysis of polymers by marine prokaryotes in microcosms. They found that the cell-
specific Vmax/Km ratio, which describes the ability of enzymes to compete at low
substrate concentration (Healey 1980), was higher in the unamended seawater
microcosm than in seawater enriched in easily utilizable DOM. These experimentally
obtained results agree with our findings from the meso- and bathypelagic waters of the
Atlantic characterized by major differences in the DOM reactivity between surface and
deep waters. Deep-water prokaryotes require apparently a high Km and a high cell-
specific Vmax/Km ratio because of the refractory nature of the organic matter present in
the deep ocean.
In summary, the decrease in the availability of labile organic matter (dissolved
and particulate) with increasing depth leads to an increase in cell-specific extracellular
enzymatic expression and concomitantly, to a reduction in the prokaryotic growth yield.
The increase in the Km and the Vmax/Km ratio of LAPase and APase with depth further
indicates an adaptation of the extracellular prokaryotic enzymes to the refractory nature
of the deep-water organic matter.
Chapter III. Extracellular enzymatic activity in the deep Atlantic
123
Acknowledgements We thank the captain and crew of R/V Pelagia for their help during work at sea.
This research was supported by a predoctoral Fellowship of the Spanish Ministry of
Education and Science (AP2005-3932) to F.B., a grant of the Spanish Ministry of
Education and Science to J.A. (Remolinos Oceánicos y Deposiciones Atmosféricas
(RODA) project; CTM 2004-06842-C03/MAR), and a grant of the Earth and Life
Science Division of the Dutch Science Foundation (ALW-NWO; ARCHIMEDES
project, 835.20.023) to G.J.H. The work was carried out within the frame of the
‘Networks of Excellence’ MarBef and EurOceans supported by the 6th Framework
Program of the European Union.
References Alonso-Saéz L, Gasol JM, Arístegui J, Vilas JC, Vaqué D, Duarte CM, Agusti S (2007)
Large-scale variability in surface bacterial carbon demand and growth efficiency
in the subtropical northeast Atlantic Ocean. Limnol. Oceanogr. 52:533-546
Ammerman JW, Azam F (1991) Bacterial 5´-nucleotidase activity in estuarine and
coastal marine waters: characterization of enzyme activity. Limnol. Oceanogr.
36:1427-1436
Amon RMW, Benner R (1996) Bacterial utilization of different size classes of dissolved
Teira E, Lebaron P, Aken Hv, Herndl GJ (2006) Distribution and activity of Bacteria
and Archaea in the deep water masses of the North Atlantic. Limnol. Oceanogr.
51:2131-2144
Weiss M, Abele U, Weckesser J, Welte W, Schiltz E, Schulz GE (1991) Molecular
architecture and electrostatic properties of bacterial porin. Science 254:1627-
1630
Williams C, Jochem FJ (2006) Ectoenzyme kinetics in Florida Bay: Implications for
bacterial carbon source and nutrient status. Hydrobiologia 569:113-127
Zaccone R, Monticelli LS, Seritti A, Santinelli C, Azzaro M, Boldrin A, LaFerla R,
D'Alcala MR (2003) Bacterial processes in the intermediate and deep layers of
Chapter III. Extracellular enzymatic activity in the deep Atlantic
128
the Ionian Sea in winter 1999: vertical profiles and their relationship to the
different water masses. J. Geophys. Res. 108:8117
Chapter III. Extracellular enzymatic activity in the deep Atlantic
129
Chapter IV
High dissolved extracellular enzymatic activity in the deep Central Atlantic Ocean F. Baltar, J. Arístegui, J. M. Gasol, E. Sintes, H. M. van Aken, G. J. Herndl
Aquatic Microbial Ecology (in press)
Chapter IV. High dissolved extracellular enzymatic activity in the deep Atlantic
131
Abstract
The distribution of prokaryotic abundance (PA), prokaryotic heterotrophic
production (PHP), and suspended particulate organic material (POM), as well as total
and dissolved (operationally defined as passing through 0.2 µm pore size filters)
potential extracellular enzymatic activities (EEA) (alpha- and beta-glucosidase [AGase
and BGase], leucine aminopeptidase [LAPase], and alkaline phosphatase [APase]) were
determined in the meso- and bathypelagic waters of the (sub)tropical Atlantic along an
eastern zonal transatlantic transect and a western N-S transect. Significant differences
between both transects were found for POM concentration but not for PA, PHP (except
in the subsurface and oxygen minimum layer), and dissolved and total EEA. PHP
decreased by three orders of magnitude from the lower euphotic zone to the
bathypelagic waters, while PA and cell-specific PHP only by one and 2 orders of
magnitude respectively. The proportion of dissolved to total extracellular enzymatic
activity was high in the dark ocean for all the enzymes, ranging from 54-100%, 56-
100%, 65-100% and 57-97% for AGase, BGase, LAPase and APase, respectively. The
kinetic parameters (Vmax and Km) of both the dissolved and total fraction of LAPase and
APase were very similar throughout the water column, suggesting a similar origin of the
dissolved and particulate EEA. Significant correlations between both, dissolved and
total EEA were found with prokaryotic metabolism and the POM pool. Based on the
previous notion that the fraction of dissolved EEA is higher in particle-attached than in
free-living microbes, our results suggest, in agreement with recent genomic evidence,
that microbial activity in the dark ocean occurs mainly on colloidal and particulate
material, which is prone to disruption during the sampling process. Hence, more
selective sampling techniques are needed to specifically collect these deep-water
aggregates representing probably hotspots of microbial activity in the deep ocean.
Introduction Prokaryotes play a major role as biomass producers and transformers of
dissolved organic matter (DOM) in the sea (Azam & Cho 1987). Heterotrophic
Chapter IV. High dissolved extracellular enzymatic activity in the deep Atlantic
132
prokaryotes express extracellular enzymes (EE) to hydrolyze high molecular weight
DOM into lower molecular weight (MW) compounds of < 600 MW, which is the MW
threshold of DOM that can be taken up by prokaryotes (Weiss et al. 1991).
Since Hoppe (1983) introduced the fluorescent substrates analogues in aquatic
microbial ecology to quantify potential extracellular enzymatic activity (EEA), this
technique has been applied to a wide range of aquatic environments (Chrost 1989, Rath
et al. 1993, Misic et al. 2006). However, most of these studies were restricted to the
euphotic zone and coastal seas (Sala et al. 2001, Zaccone et al. 2003, Williams &
Jochem 2006). Only a few profiles of EEA are available for the whole water column of
the open ocean (Koike & Nagata 1997,Hoppe & Ullrich 1999, Chapter III).
The activity of EE in the dark ocean is likely related to the composition of
sinking particulate organic matter (POM). Previous studies suggest that a substantial
fraction of sinking POM is solubilized to DOM, fueling prokaryotic production in the
meso- and bathypelagic zones (Cho & Azam 1988). The observation that particulate
organic carbon (POC) decreases faster with depth than prokaryotic carbon demand, led
to the formulation of the “particle decomposition paradox” by Karl et al. (1988). Cho &
Azam (1988) proposed that the underlying reason for this is an over-expression of EE
by the particle-associated prokaryotic community, which releases the EE into the
particles. This over-expression of dissolved EE results in a loose hydrolysis – uptake
coupling of cleavage products and consequently, to the potential release of these
products into the surrounding water, eventually fueling free-living prokaryotes (Karner
& Herndl 1992, Smith et al. 1992, Azam & Long 2001). Prokaryotic EE can be released
into the environment by a suite of different processes, either actively by the prokaryotic
cell or via grazing activity (Chrost 1991, Bochdansky et al. 1995, Karner &
Rassoulzadegan 1995), and remain active for an extended period of time (Wetzel 1991).
The importance of dissolved EE in material cycling in soils is widely recognized
(McLaren & Skujins 1967, Paul 1989, Dick & Tabatabai 1992); however, less
consensus exists about the relevance of dissolved enzymes in marine communities.
Most EEA in the oceans is found associated with prokaryotes (Hoppe 1983, Hoppe et
al. 2002). Consequently, it has been assumed that only cell-associated EE are of
ecological significance (Someville & Billen 1983, Rego et al. 1985, Chrost & Rai
1993). Nevertheless, significant dissolved EEA in the oceanic water column has been
detected on macroscopic particles such as marine snow (Karner & Herndl 1992, Smith
et al. 1992, Müller-Niklas et al. 1994).
Chapter IV. High dissolved extracellular enzymatic activity in the deep Atlantic
133
Based on the notion that particle-attached prokaryotes are releasing EEs into
their environment and hence, exhibit a loose hydrolysis-uptake coupling, we
hypothesized that the contribution of dissolved to total EEA should be higher in the
dark open ocean if deep-water prokaryotes are more dependent on POM as substrate
than surface water prokaryotic communities. Surface water heterotrophic microbial
communities have access to bioreactive DOM while in deep-waters, essentially all of
the bulk DOM is refractory (Benner et al. 1992, Aluwihare et al. 2005).
In this study, we investigated the dynamics of both total and dissolved EEA across
the (sub)tropical Atlantic from the lower euphotic zone to the bathy- and abyssopelagic
layers (to 7000 m depth). We determined the EEA of two glycolytic enzymes (α-
glucosidase and β-glucosidase), one proteolytic enzyme (leucine aminopeptidase) and
alkaline phosphatase, and related them to prokaryotic abundance (PA) and heterotrophic
production (PHP), as well as to the distribution of POC and particulate organic nitrogen
(PON). We provide evidence that prokaryotic metabolism is related to the concentration
of the POM pool and to the dissolved and total EEA, suggesting that colloidal and
particulate organic matter might be more important for deep-water prokaryotes than
hitherto assumed.
Materials and Methods
Study site and sampling
EEA, heterotrophic prokaryotic biomass production and the concentration of
POM were determined in several waters masses of the (sub)tropical Atlantic Ocean. The
cruise track covered more than 4500 km along an eastern zonal transatlantic (“TA”)
transect (from Brazil through the Romanche Fracture Zone [RFZ], a major canyon in
the Mid-Atlantic Ridge at the equator) and a western N-S transect (roughly parallel to
the African continental slope, “African”) (Fig. 1). Samples from several depths,
targeting the core of the main water masses, were taken with RV Pelagia at 20 out of 30
stations occupied during the ARCHIMEDES-III cruise (December 2007 to January
2008). Along the TA transect, samples were obtained from the base of the mixed layer
Chapter IV. High dissolved extracellular enzymatic activity in the deep Atlantic
134
(“subsurface”, 100 m layer), the oxygen minimum layer (OML; consisting of South
Atlantic Central Water), the Antarctic Intermediate Water (AAIW), the Upper North
Atlantic Deep Water (UNADW), the Middle North Atlantic Deep Water (MNADW),
the Lower Northeast Atlantic Deep Water (LNEADW), and the Antarctic Bottom Water
(AABW). In the RFZ, the NADW and AABW mix forming transitional waters (Trans),
since the RFZ is sufficiently deep to allow significant eastward flow of AABW. The
AABW slowly transforms to Lower Deep Water (LDW) by mixing with NEADW
(Ferron et al. 1998). Along the N-S African transect, samples were taken from the
”subsurface”, the OML (consisting of North and South Atlantic Central Water), the
Sub-Arctic Intermediate Water (SAIW), the Upper Northeast Atlantic Deep Water
(UNEADW), NEADW, and the LDW. The specific water masses were identified based
on their distinct temperature-salinity characteristics and oxygen content (Table 1).
Samples from the distinct water masses were collected with 12 L Niskin bottles
mounted on a CTD (conductivity, temperature, depth) frame to determine total
prokaryotic abundance and heterotrophic production, POM, and EEA as described
below.
Fig. 1. Stations occupied during cruise ARCHIMEDES-III. Sampled stations are indicated by numbered dots. Kinetic profiles were performed at stations labeled by open diamonds. The Transatlantic transect (TA) ranged from Sta. 4 to Sta. 27; the African transect (African) from Sta. 28 to Sta. 38. M-A R: Mid-Atlantic Ridge, RFZ: Romanche Fracture Zone
Chapter IV. High dissolved extracellular enzymatic activity in the deep Atlantic
135
Table 1. Characteristics of the main water masses sampled during the ARCHIMEDES-III cruise based on CTD profiles at individual stations. Ranges are given for each water mass where samples were collected. TA: Transatlantic, OML: oxygen minimum layer, AAIW: Antarctic Intermediate Water, UNADW: Upper North Atlantic Deep Water, MNADW: Middle North Atlantic Deep Water, LNADW: Lower North Atlantic Deep Water, Trans: Transitional water, AABW: Antarctic Bottom Water, SAIW: Sub-Arctic Intermediate Water, UNEADW: Upper Northeast Atlantic Deep Water, NEADW: Northeast Atlantic Deep Water, LDW: Lower Deep Water
Transect Water mass Depth
(m)
Temperature
(ºC) Salinity
Oxygen
(µmol kg-1)
TA
subsurface
OML
AAIW
100
250-750
750-1200
14.1-23.7
4.6-13.7
4.2-5.0
35.4-37
34.4-35.4
34.4-34.6
89.2-199.1
74-152.6
125.7-176.4
UNADW
MNADW
1750
2750-3750
3.5-3.8
2.1-2.6
34.9
34.9
206.8-247.6
209.9-222
LNADW
Trans
3750-4500
2750-4350
1.7-2.1
1.2-2.6
34.8-34.9
34.8-34.9
211.3-225.2
204.5-212-9
African
AABW
subsurface
OML
SAIW
4500-7150
100
250-470
750
0.6-0.9
13.3-19.1
9.9-13.6
6.0-7.3
34.7
35.3-36.7
35.1-35.4
34.7-35.0
190.1-199.9
66.8-125.3
33.9-69.5
69.4-83
UNEADW
NEADW
1750
2750
1.8-3.8
1.8-2.7
34.9
34.9
190.7-201-1
207-209
Trans
LDW
3750
3400-5200
1.8-2.1
1.6-2.3
34.9
34.8-34.9
205.7-208
199.2-207.2
Prokaryotic abundance (PA) determined by flow cytometry
Prokaryotic plankton collected from the different depth layers of the water
column were enumerated using flow cytometry. Samples (2 mL) were fixed with 1%
paraformaldehyde (final concentration), shock-frozen in liquid nitrogen for 5 min and
stored at -80°C. Picoplankton cells were stained with SYBR-Green I and enumerated
with a FACSCalibur flow cytometer (Becton Dickinson) on board within 2 d.
Immediately before analysis, the thawed picoplankton samples were stained with
SYBR-Green I (using a final concentration of 1X as recommended by the manufacturer)
Chapter IV. High dissolved extracellular enzymatic activity in the deep Atlantic
136
at room temperature in the dark for 15 min. Fluorescent microspheres (Molecular
Probes Inc.) with a diameter of 1 µm were added to all samples as an internal standard.
Counts were performed with an argon laser set at 488 nm wavelength. Prokaryotic cells
were enumerated according to their right angle scatter and green fluorescence. The
counting window of the flow cytometer was set to exclude eukaryotic plankton.
Prokaryotic heterotrophic production (PHP) measured by [3H] leucine
incorporation
Bulk PHP was measured by incubating triplicate 10-40 mL samples and triplicate
formaldehyde-killed blanks (2% final concentration) with 5 nmol L-1 [3H]-leucine (final
concentration, specific activity 160 Ci mmol-1; Amersham) in temperature-controlled
incubators in the dark at in situ temperature for 4-10 h. Incubations were terminated by
adding formaldehyde (2% final concentration) 10 min prior to filtering the samples and
the blanks through 0.2-µm polycarbonate filters (25 mm filter diameter; Millipore)
supported by HAWP filters (Millipore, 0.45 µm pore size). Subsequently, the filters
were rinsed three times with 5% ice-cold trichloroacetic acid, dried, and placed in
scintillation vials. Scintillation cocktail (8 mL Canberra-Packard Filter Count) was
added, and after 18 h, counted in a liquid scintillation counter (LKB Wallac model
1212) on board. The mean disintegrations per minute (DPM) of the formaldehyde-fixed
blanks were subtracted from the mean DPM of the respective samples and the resulting
DPM converted into leucine incorporation rates. Prokaryotic carbon biomass production
was estimated using a conservative theoretical conversion factor of 1.55 kg C mol-1 Leu
assuming no internal isotope dilution (Kirchman & Ducklow 1993). Average cell-
specific leucine incorporation rates (fmol C cell-1 d-1) were calculated by dividing bulk
leucine incorporation by prokaryotic abundance.
Particulate organic carbon (POC) and organic nitrogen (PON)
Samples (4-6 L) for POC and PON were filtered through combusted (450ºC for
12 h) 25-mm Whatman GF/F filters. The filters were wrapped in combusted aluminum
foil and kept frozen at -20ºC until processed. In the laboratory, the filters were thawed
and dried overnight at 65ºC in a desiccator under HCl fumes to remove carbonates and
finally, dried overnight in a desiccator with silica gel. Prior to analysis, samples were
packed into ultraclean tin caps. The carbon analyses were performed on a Perkin-Elmer
2400 CHN (carbon, hydrogen, nitrogen) elemental analyzer according to the JGOFS
Chapter IV. High dissolved extracellular enzymatic activity in the deep Atlantic
137
(Joint Global Ocean Flux Study) protocol (UNESCO 1994). Concentrations of POM
originating from low-volume filtrations may be biased due to the possible sorption of
DOM on the filter material (Moran et al. 1999). Hence, sorption blanks were
determined for each station by placing two Whatman GF/F filters on top of each other
in the filter holder while filtering the water sample. The adsorbed organic C and N
collected by the lower filter was measured as described above and subtracted from the
POC- and PON-content of the corresponding particulate sample.
Measurements of prokaryotic extracellular enzymatic activity
The hydrolysis of the fluorogenic substrate analogs 4-methylcoumarinyl-7-amide
glucoside, 4-MUF-β-D-glucoside and MUF-phosphate was measured to estimate
potential activity rates of leucine-aminopeptidase (LAPase), α-, β-glucosidase (AGase,
BGase), and alkaline phosphatase (APase), respectively (Hoppe 1983). All the
chemicals were obtained from Sigma and appropriate stocks prepared in methyl-
cellosolve. The activity of the enzymes is linearly related to the fluorescence resulting
from the hydrolytic cleavage of the monomer from MUF or MCA and was detected
spectrofluorometrically using a Fluorolog-3 fluorometer with a MicroMax 384
microwell plate reader (Horiba) at an excitation and emission wavelength of 365 nm
and 445 nm. Samples (300 µL) were incubated in the dark at in situ temperature for 24
h. The linearity of the increase in fluorescence over time was checked on sets of
samples incubated between 24-48 h resulting in the same hydrolytic rates h-1.
Subsamples without substrate were used as blanks to determine the background
fluorescence of the samples. Previous experiments showed that abiotic hydrolysis of the
substrates was not significant (data not shown). The fluorescence obtained at the
beginning and at the end of the incubation was corrected for the corresponding blank.
This increase in fluorescence over time was transformed to hydrolysis activity using a
standard curve established with different concentrations of the fluorochromes MUF and
MCA added to 0.2-µm filtered sample water. To determine enzyme kinetics, model
substrate concentrations should cover a sufficiently wide range. In this study, 12
different concentrations were used for the different substrates ranging from 0.39 µmol
L-1 to 800 µmol L-1 for APase and from 0.98 µmol L-1 to 2000 µmol L-1 for LAPase.
For routine measurements, a final concentration of 10 µmol L-1 was applied to measure
α- and β-glucosidase activity, 100 µmol L-1 for APase and 500 µmol L-1 for APase.
Chapter IV. High dissolved extracellular enzymatic activity in the deep Atlantic
138
These concentrations have been previously determined as saturating concentrations.
Consequently, this approach yields potential hydrolysis rates.
Profiles of enzyme kinetics for APase and LAPase were determined at each
station. The saturation curves were transformed into a Lineweaver-Burk or Hanes-
Woolf plot to reveal maximum enzyme activity (Vmax, nmol L-1 h-1) and substrate
affinity (Michaelis-Menten half saturation constant; Km, µmol L-1).
We distinguished between total EEA of the sample and the dissolved fraction of
the EEA and their respective enzyme kinetics. For total EEA, raw seawater was used
while for dissolved EEA, samples were filtered through a low protein binding 0.2 µm
Acrodisc® Syringe filter (Pall Corporation), following the protocol of Kim et al. (2007).
As suggested by these authors, gentle pressure was applied and care was taken to avoid
exposing cells to the air at the end of the filtration (Nagata & Kirchman 1990). As
indicated by Obayashi & Suzuki (2008), depending on the filter used for size
fractionation, the adsorption of extracellular enzymes can be substantial. The latter
authors found that around half of the LAPase activity could be adsorbed onto mixed
cellulose ester membrane filters as compared to low protein binding filters (and more
than 90% for trypsin and chymotrypsin). This adsorption of enzymes on filters would
lead to an overestimation of the particulate EEA fraction. Also, extracellular enzymes
may be washed off from the cell surface even during gentle filtration and thus
contribute to the pool of dissolved enzymes. However, due to the low abundance of
prokaryotes typically found in the deep ocean, the potential release of ectoenzymes
most likely would not contribute much to the pool of dissolved EEA. In our study,
dissolved EEA was considered as the EEA obtained in the filtrate. Total and dissolved
EEA were determined on six replicate samples. For enzyme kinetics, three replicate
samples were used.
Statistical analysis
Data were log transformed to attain normality prior to applying the t-student test
and Spearman’s rank correlation coefficients were calculated. To check the normality of
the individual data sets, the Kolmogorov–Smirnoff test was used. For calculating
uncertainties on ratios, error propagation was taking into account; standard deviations
were calculated using a formula for the propagation of error (Bevington & Robinson
2003) as follows:
Chapter IV. High dissolved extracellular enzymatic activity in the deep Atlantic
139
Δz / z = √ [((Δx)2 / x) + ((Δy)2 / y)]
where z is the percent abundance or the percent assimilation, and is equal to x divided
by y, as described above. Δx and Δy are the standard deviations associated with x and y,
respectively. Δz is the standard deviation calculated for z. Standard deviations were then
converted to standard errors for each calculation.
Results
Prokaryotic abundance (PA) and prokaryotic heterotrophic production (PHP)
As expected, PA decreased with depth by one order of magnitude (Fig. 2A) over
the 100-7000 m depth range. Despite the fact that PA was higher in all the water masses
of the African transect than along the TA transect, no significant differences were found
between the average values of the two transects (t-test; p = 0.24, n = 139). PHP also
decreased with depth, although by three orders of magnitude (Fig. 2B), being only
slightly (but significantly) higher in the subsurface and OML of the TA than in the
African transect. Average cell-specific PHP decreased with depth by two order of
magnitude (Fig. 2C). Similarly to PHP and in contrast to PA, average cell-specific PHP
was only slightly higher in the subsurface and OML layers of the TA than in the African
transect. Like for PHP, no significant differences were found for average cell-specific
PHP (t-test; p > 0.05) in any of the water masses between the two transects.
Distribution of particulate organic matter
POC (Fig. 3A) was significantly higher in all the water masses of the TA than in
those of the African transect (t-test; p < 0.001, n = 106). In the TA, POC increased by a
factor of 2 from the 100 m depth horizon to the AAIW, and decreased thereafter to
concentrations similar to those of the subsurface waters (Fig. 3A). In the African
transect, however, POC concentrations decreased with depth from the subsurface waters
to the LNADW to about half of the subsurface POC concentration, and increased in the
Chapter IV. High dissolved extracellular enzymatic activity in the deep Atlantic
140
deepest water mass sampled (LDW) to POC concentrations similar to those of
subsurface waters (Fig. 3A).
PON concentrations were generally one order of magnitude lower than POC
(Fig. 3B), decreasing with depth in both transects. In contrast to POC, significantly
higher (t-test; p < 0.05, n = 105) PON concentrations were found along the African
transect than at the TA transect (compare Fig. 3A and B), albeit PON concentrations
were similar in the deepest water masses (Trans, NADW, LDW and AABW) of the two
transects (t-test; p > 0.05). Throughout the entire water column, the mean C:N ratio of
POM (Fig. 3C) was significantly higher along the TA transect than the African transect
(t-test; p < 0.0001, n = 105), due to both the higher POC and lower PON concentrations
in the TA than in the African transect.
Total and dissolved extracellular enzymatic activity (EEA)
In contrast to prokaryotic heterotrophic production, total and dissolved EEA
decreased only slightly with depth (Fig. 4). The different total EEA were significantly
correlated with each other (Spearman’s rho, p < 0.0001). A particularly strong
correlation was found between α-glucosidase (AGase; Fig. 4A) and β-glucosidase
(BGase; Fig. 4B) activity (Spearman’s rho = 0.91, p < 0.0001, n = 106) (compare Fig.
4A and B). Leucine aminopeptidase (LAPase; Fig. 4C) and alkaline-phosphatase
(APase; Fig. 4D) activities were generally higher than AGase and BGase, particularly at
Fig. 2. Distribution of basic prokaryotic parameters in the different water masses in the Transatlantic transect (TA) and the African transect (African) (see Table 1 for depth ranges of each water mass). (A) Prokaryotic abundance (cells mL-1), (B) Prokaryotic heterotrophic production (µmol C m-3 d-1), (C) Average cell-specific prokaryotic heterotrophic production (fmol C cell-1 d-1). Bars represent SE of the mean
Chapter IV. High dissolved extracellular enzymatic activity in the deep Atlantic
141
the base of the euphotic layer (subsurface layer). APase, decreased less with depth than
AGase, BGase and LAPase.
C
B
A
POC [µmol L-1]
PON [µmol L-1]
Fig. 3. Distribution of (A) POC (µmol L-1), (B) PON (µmol L-1), (C) POC:PON molar ratio throughout the water column along the entire ARCHIMEDES-III cruise track (from Sta. 4 to Sta. Sta. 38) The vertical full line indicates where the cruise track turned from the westward (Transatlantic) to the northward (African) transect
Chapter IV. High dissolved extracellular enzymatic activity in the deep Atlantic
142
A
B
C
D
[nmol L-1 h-1]
[nmol L-1 h-1]
[nmol L-1 h-1]
[nmol L-1 h-1]
Fig. 4. Distribution of (A) AGase (alpha-glucosidase), (B) BGase (beta-glucosidase), (C) LAPase (leucine aminopeptidase) and (D) APase (alkaline phosphatase) activities throughout the water column along the entire ARCHIMEDES-III cruise track (from Sta.4 to Sta. 38); values are given in nmol L-1 h-1. Total EEA are plotted as black isolines over the dissolved EEA (color gradient). Where color contours are missing, only total EEA was measured. Vertical full line indicates boundary between Transatlantic and African transect
Chapter IV. High dissolved extracellular enzymatic activity in the deep Atlantic
143
Similar to the total EEA, also the different dissolved EEA were significantly
correlated with each other (Spearman’s rho, p < 0.0001). Again, the strongest
correlation was found between the dissolved AGase and BGase (Spearman’s rho = 0.90,
p < 0.0001, n = 66). The distribution patterns of the dissolved and total EEA for all the
enzymes (AGase, BGase, LAPase and APase) were very similar along the cruise track
and throughout the water column (compare black isolines with color background in Fig.
4A-D). Hence, the different total and dissolved EEA were correlated with each other
(Spearman’s rho, p < 0.005). The log-log slope of the dissolved versus total EEA was
very close to 1 for AGase (slope = 0.98, n = 66, R2 =0.96), BGase (slope = 0.97, n = 66,
R2 =0.95) and LAPase (slope = 0.93, n=66, R2 =0.98), however, lower for APase (slope
= 0.75, n=66, R2 =0.85). No significant differences for any of the EEA were detectable
(t-test; p < 0.05) between the African and TA transects. Average cell-specific EEA
increased with depth for all the enzymes (data not shown).
The contribution of dissolved to total EEA (Fig. 5A-D) was high in the aphotic
layers for all enzymes, particularly for LAPase and APase (Fig. 5C, D), whereas the
contribution of dissolved AGase and BGase to the respective total EEA was more
patchy (Fig. 5A, B). Overall, no significant differences were found between the
percentages of dissolved to total EEA for any of the enzymes between the two transects
(t-test; p < 0.05).
Dynamics in kinetics of total and dissolved LAPase and APase
At six stations (labeled as diamonds in Fig. 1), profiles of kinetic parameters for
total and dissolved LAPase and APase were obtained. Generally, the maximum
hydrolysis rates (Vmax) of total and dissolved LAPase and APase decreased with depth
(Fig. 6A, B). Significant differences were found between the subsurface and OML and
the deeper water masses in the Vmax of total and dissolved LAPase (t-test; p < 0.001, n =
29) and APase (t-test; p < 0.001, n = 30). Significant differences between dissolved and
total Vmax were only found in the subsurface waters for LAPase (t-test; p = 0.013, n =
10) and in the OML (t-test; p = 0.048, n = 10) and AAIW (t-test; p = 0.038, n = 10) for
APase. In these upper water masses, the differences between the Vmax of dissolved and
total APase (Fig. 6B) were higher than for LAPase (Fig. 6A). The detected difference in
the Vmax between dissolved and total APase coincided with the lower contribution of
dissolved APase to the total APase pool as compared to LAPase (Fig. 4A-D).
Chapter IV. High dissolved extracellular enzymatic activity in the deep Atlantic
144
A
B
C
D
Fig. 5. Distribution of the percentage of dissolved relative to total (A) AGase (alpha-glucosidase), (B) BGase (beta-glucosidase), (C) LAPase (leucine aminopeptidase) and (D) APase (alkaline phosphatase) activity throughout the water column along the entire ARCHIMEDES-III cruise track (from Sta.18 to Sta. 38). Note that panels start at Sta. 18 because there were no measurements of dissolved EEA performed between Sta. 4 and Sta. 18 (see Fig. 4). Vertical full line indicates boundary between Transatlantic and African transect. SE were around 9, 10, 2 and 3% for AGase, BGase, LAPase and APase, respectively
Chapter IV. High dissolved extracellular enzymatic activity in the deep Atlantic
145
In contrast to Vmax, the half-saturation constant (Km) of LAPase (Fig. 6C) of the
total and the dissolved fractions increased with depth. The subsurface and OML
exhibited a significantly lower Km than the deeper water masses for the total (t-test; p =
0.00013, n = 29) and dissolved (t-test; p = 0.0005, n = 29) LAPase, and for total APase
(t-test; p = 0.0004, n = 30, Fig. 6D). Similarly to the Vmax, the difference between and
dissolved Km was higher for APase (Fig. 6D) than for LAPase (Fig. 6C), particularly in
the two upper water masses. Significant differences between dissolved and total Km
were only found for APase in the OML (t-test; p < 0.05, n = 10).
*
*
*
*
Fig. 6. Extracellular enzymatic kinetics of LAPase (A, C) and APase (B, D) at the stations identified in Fig. 1; (A, B) Vmax (nmol h-1), (C, D) Km (µmol L-1). Bars represent SE of the mean. Asterisks denote water masses where significant differences in enzyme kinetics between dissolved and total EEA were measured
Chapter IV. High dissolved extracellular enzymatic activity in the deep Atlantic
146
Discussion Only a few reports are available on EEA in deep oceanic water column. Our
range of LAPase (0.2-13.8 nmol L-1 h-1) activities is similar to that reported in Chapter
III for the water column (100 to 4500 m) of the (sub)tropical North Atlantic (0.6-9.2
nmol L-1 h-1), by Hoppe & Ullrich (1999) for the deep Indian Ocean (6-15 nmol L-1 h-1)
and by Tamburini et al. (2009) for the Tyrrhenian Sea down to 3500 m depth (0.51-8.6
nmol L-1 h-1). Our LAPase rates, however, are higher than reported in other studies such
as the Mediterranean Sea down to 2000 m depth (0.034-2.77 and 0.23-1.78 nmol L-1 h-1
by Zaccone et al. (2003) and Tamburini et al. (2002), respectively). The APase activities
reported in this study (0.14-1.3 nmol L-1 h-1) are also in the same range as the APase
rates found in Chapter III for the (sub)tropical Atlantic water column (0.04-3.7 nmol
L-1 h-1), by Tamburini et al. (2002) for the DYFAMED station (0.01-1.8 nmol L-1 h-1)
and by Tamburini et al. (2009) for the Tyrrhenian Sea (0.21-9.9 nmol L-1 h-1), but lower
than the rates obtained by Hoppe & Ullrich (1999) for the Indian Ocean deep-waters (2-
4.5 nmol L-1 h-1), and higher than the APase activities reported by Zaccone et al. (2003)
for the Ionian Sea (0.08-0.4 nmol L-1 h-1) and the rates obtained by Koike & Nagata
(1997) for the Central Pacific deep-waters (0.031-0.35 nmol L-1 h-1). However, the latter
study only measured the particulate fraction of APase (> 0.2 µm), which might explain
the low values reported by these authors.
Although it has been assumed that only cell-associated EEs are of ecological
significance (Someville & Billen 1983, Rego et al. 1985, Chrost & Rai 1993), the
contribution of dissolved EEA to total EEA (AGase, BGase, LAPase and APase)
measured in this study was high in the dark open ocean reaching almost 100% (Fig. 5A-
D). Several studies have addressed the importance of dissolved EEA to total hydrolytic
activity. Someville & Billen (1983) reported that most of the exoprotease activity in the
eutrophic Belgian coastal waters was in the dissolved fraction. In Tokyo Bay, dissolved
carboxypeptidase activity contributed between 10% and 50% of total EEA, both in
freshwater and seawater communities (Hashimoto et al. 1985). In the Adriatic Sea, over
a time-course of 22 h, dissolved alpha- and beta–glucosidase activity reached 73% and
65% of the activity in unfiltered water, respectively (Bochdansky et al. 1995). Over a
diel cycle at a coastal site in the western Mediterranean Sea, dissolved alpha- and beta-
glucosidase activity ranged between 0 and 100% of total activity (Karner &
Rassoulzadegan 1995). Free laminarinase activity contributed up to 100% of total
Chapter IV. High dissolved extracellular enzymatic activity in the deep Atlantic
147
laminarin and 48-69% of total xylan hydrolysis in a mesocosm experiment during a
phytoplankton bloom (Keith & Arnosti 2001). In the Elbe estuary, Karrasch et al.
(2003) reported that the dissolved EEA reaches 20-80% of the total water column
activity. Ziervogel & Arnosti (2008) studying the EEA of surface waters in the
northeastern Gulf of Mexico concluded that dissolved EEA plays a significant role in
the hydrolysis of high-molecular weight substrates. All the above studies highlight the
major contribution of dissolved EE to total hydrolytic activity, despite its variability in
time and space. Nevertheless, none of these studies addressed the importance of
dissolved EEA with respect to total EEA throughout the entire water column of the
open ocean, and in particular the deep sea. In the only profile available comparing
dissolved and total EEA in the ocean, Davey et al. (2001) found that total potential
LAPase rates significantly decreased with depth (0-200 m depth) while dissolved
LAPase did not. Thus, the contribution of dissolved LAPase increased towards the
deeper waters. Our results are in agreement with the EEA profile reported by Davey et
al. (2001), however, extending it to the bathy- and abyssopelagic realm.
This rather high contribution of dissolved to total EEA is surprising, as it is
commonly assumed that free-living prokaryotes exhibit a tight hydrolysis-uptake
coupling with the ectoenzymes attached to the cell wall or in the periplasmic space,
where hydrolysis of macromolecular substrate occurs in intimate vicinity to the sites of
hydrolysis product uptake (Hoppe et al. 2002). In contrast, particle-associated
prokaryotes have been suggested to exhibit a loose hydrolysis-uptake coupling with the
extracellular enzymes released into the particle. Hence, enzymatic cleavage of substrate
can thus occur at distance from the cell (Smith et al. 1992). Vetter & Deming (1999)
reported that released bacterial EE can produce sufficient hydrolysate from POC to
support growth in the absence of any other significant source of DOC and without direct
contact between the cell and particulate substrate. These empirical results obtained by
Vetter & Deming (1999) support the model-based predictions formulated in an earlier
paper (Vetter et al. 1998), suggesting that dissolved EE are advantageous when bacteria
are attached to particles and when the substrate is within a well-defined distance to the
enzyme source.
The factors determining the contribution of dissolved to total EEA are not well
understood. Investigations on pure cultures of bacteria have demonstrated that EE can
be released from cells in the presence of the corresponding substrate (Alderkamp et al.
2007), as a function of growth phase (Antranikian 1992), in response to bacterial
Chapter IV. High dissolved extracellular enzymatic activity in the deep Atlantic
Tamburini C, Garel M, Ali BA, Mérigot B, Kriwy P, Charrière B, Budillon G (2009)
Distribution and activity of Bacteria and Archaea in the different water masses
of the Tyrrhenian Sea. Deep-Sea Research Part II 56:700-712.
UNESCO (1994) Protocols for the Joint Global Ocean Flux Study (JGOFS) Core
Measurement. Intergovernmental Oceanographic Commission, Manual and
Guides 29:169
Verdugo P, Alldredge AA, Azam F, Kirchman DL, Passow U, Santschi P (2004) The
oceanic gel phase: a bridge in the DOM–POM continuum. Mar. Chem. 92:67-85
Chapter IV. High dissolved extracellular enzymatic activity in the deep Atlantic
161
Verdugo P, Orellana MV, Chin WC, Petersen TW, Eng Gvd, Benner R, Hedges JI
(2008) Marine biopolymer self-assembly: implications for carbon cycling in the
ocean. The Royal Society of Chemistry 139:393-398
Vetter YA, Deming JW (1999) Growth rates of marine bacterial isolates on particulate
organic substrates solubilized by freely released extracellular enzymes. Microb.
Ecol. 37:86-94
Vetter YA, Deming JW, Jumars PA, Krieger-Brockett BB (1998) A predicitive model
of bacterial foraging by means of freely released extracellular enzymes. Microb.
Ecol. 36:75-92
Weiss M, Abele U, Weckesser J, Welte W, Schiltz E, Schulz GE (1991) Molecular
architecture and electrostatic properties of bacterial porin. Science 254:1627-
1630
Wells ML (1998) A neglected dimension. Nature 391:530-531
Wells ML, Goldberg ED (1992) Marine submicron particles. Mar. Chem. 40:5-18
Wetzel RG (1991) Extracellular enzymatic interactions: storage, redistribution, and
interspecific communication. In: Chrost RJ (ed) Microbial enzymes in aquatic
environments. Springer Verlag, New York, p 6-28
Williams C, Jochem FJ (2006) Ectoenzyme kinetics in Florida Bay: Implications for
bacterial carbon source and nutrient status. Hydrobiologia 569:113-127
Zaccone R, Monticelli LS, Seritti A, Santinelli C, Azzaro M, Boldrin A, LaFerla R,
D'Alcala MR (2003) Bacterial processes in the intermediate and deep layers of
the Ionian Sea in winter 1999: vertical profiles and their relationship to the
different water masses. J. Geophys. Res. 108:8117
Ziervogel K, Arnosti C (2008) Polysaccharide hydrolysis in aggregates and free enzyme
activity in aggregate-free seawater from the North-Eastern Gulf of Mexico.
Environ. Microb. 10:289-299
Ziervogel K, Karlsson E, Arnosti C (2007) Surface associations of enzymes and of
organic matter: consequences for hydrolytic activity and organic matter
remineralization in marinne systems. Mar. Chem. 104:241-252
Chapter IV. High dissolved extracellular enzymatic activity in the deep Atlantic
163
Chapter V Mesoscale eddies: hotspots of prokaryotic activity and differential community structure in the ocean F. Baltar, J. Arístegui, J. M. Gasol, I. Lekunberri, G. J. Herndl
The ISME Journal (in revision)
Chapter V. Effect of eddies on prokaryotes
165
Abstract To investigate the effects of mesoscale eddies on prokaryotic assemblage
structure and activity we sampled 2 cyclonic (CE) and 2 anticyclonic (AE) eddies in the
permanent eddy field downstream the Canary Islands. The eddy stations were compared
with two far-field stations (FF) located also in the Canary Current but outside the
influence of the eddy field. The distribution of prokaryotic abundance (PA), bulk
prokaryotic heterotrophic activity (PHA), various indicators of single-cell activity (such
as nucleic acid content, proportion of live cells, and fraction of cells actively
incorporating leucine), as well as bacterial and archaeal community structure were
determined from the surface to 2000 m depth. In the upper epipelagic layer (0-200 m),
the effect of eddies on the prokaryotic community was more apparent, as indicated by
the higher PA, PHA, fraction of living cells, and percentage of active cells incorporating
leucine within eddies than at FF stations. Prokaryotic community composition differed
also between eddy and FF stations in the epipelagic layer. In the mesopelagic layer
(200-1000 m), there were also significant differences in PA and PHA between eddy and
FF stations, although in general, there were no clear differences in community
composition or single-cell activity. The effects on prokaryotic activity and community
structure were stronger in AE than CE, decreasing with depth in both type of eddies.
Overall, both type of eddies show distinct community compositions (as compared to FF
in the epipelagic), and represent oceanic “hotspots” of prokaryotic activity (in the epi-
and mesopelagic realms).
Introduction Mesoscale eddies are ubiquitous features in the ocean (Cheney & Richardson
1976, Arístegui et al. 1997, van Haren et al. 2006), with strong implications on regional
biogeochemistry and productivity. Anticyclonic eddies have been seen to accumulate
organic matter within their cores (e.g. Arístegui et al. 2003, Mathis et al. 2007) and to
& McGillicuddy 2006) and heterotrophic production (Ewart et al. 2008, Chapter I).
Cyclonic eddies are known to enhance nutrient inputs to the surface ocean increasing
Chapter V. Effect of eddies on prokaryotes
166
new production (Falkowski et al. 1991, Harris et al. 1997, Moran et al. 2001) and
chlorophyll concentrations (Arístegui et al. 1997, McGillicuddy Jr. et al. 1998, Tarran et
al. 2001). Current estimates suggest that up to 50% of the global new primary
production may be caused by eddy-induced nutrient fluxes (Falkowski et al. 1991,
McGillicuddy Jr. et al. 1998, Letelier et al. 2000). Thus, eddies exert a major control on
the generation, accumulation and downward transport of biogenic production in the
ocean, as well as on the associated remineralization processes mediated by prokaryotes.
Despite the recognized key role of prokaryotes within the marine biogeochemical
cycles (e.g. Azam et al. 1983), only a reduced number of studies, sometimes
contradictory, have been published analyzing the response of heterotrophic prokaryotes
to eddy activity. Some of these studies reported increased prokaryotic abundance (PA)
inside cold-core eddies (Lochte & Pfannkuche 1987, Harris et al. 1997, Thyssen et al.
2005) and in the frontal waters between cyclonic and anticyclonic eddies (Arístegui &
Montero 2005). Other studies, however, did not find differences in depth-integrated
prokaryotic biomass between the in- and outside of cyclonic eddies (González et al.
2001, Tarran et al. 2001). In the Canary Islands region, higher prokaryotic heterotrophic
production (PHP) rates were measured within eddies compared with the surrounding
waters (Bode et al. 2001, Chapter I). In the Sargasso Sea, Ewart et al. (2008) found an
increase in PHP at the periphery of a cyclonic eddy relative to the eddy center, as well
as in the core of an anticyclonic eddy. The latter authors found a tight coupling between
phytoplankton and prokaryotic activity, suggesting that the variability of phytoplankton
community structure plays a key role influencing PHP in these mesoscale features.
Less information is available concerning changes in prokaryotic community
structure due to eddy influence. In a DMSP-producing coccolithophorid bloom in a
North Atlantic cold-core eddy, Gonzalez et al. (2000) found that Roseobacter, SAR86,
and SAR11 were the dominant groups of Bacteria associated with the bloom. However,
no differences in the dominant groups were found between in- and outside the eddy. In
contrast, Benitez-Nelson et al. (2007) reported mixed-layer bacterioplankton
communities being similar inside and outside a cyclonic eddy, but below 50 m depth
Planctomycetes, Bacteroidetes, and certain Proteobacteria (thought to degrade high
molecular weight dissolved organic matter) were present. Zhang et al. (2009) found a
greater crenarchaeaal contribution in the upper mesopelagic waters inside two cyclonic
eddies (as compared to outside) that they related to a higher contribution of refractory
dissolved organic matter. They also found a significantly higher bulk D-:L-Aspartic
Chapter V. Effect of eddies on prokaryotes
167
acid uptake ratio in the core of two cyclonic eddies as compared to the outside areas, but
no influence of the cyclonic eddies was found in the ratio of D-:L-Aspartic acid positive
cells of Bacteria and Archaea. However, information on Archaea and on the activity of
prokaryotes at the single-cell level comparing cyclonic and anticyclonic features is not
available.
Here we report the abundance, relative nucleic acid content, viability, bulk and
single-cell activities and community structure of prokaryotic assemblages in four island-
induced eddies (2 cyclonic [CE] and 2 anticyclonic [AE]), compared with two
unaffected (far-field [FF]) reference sites northwest of the Canary archipelago. We
examined the effect of eddies in an oligotrophic region, where the impact on the
prokaryotic community should be significant. Based on previous studies on the role of
mesoscale eddies in oceanic biogeochemistry and productivity, we hypothesize that
eddies could generate oceanic “hotspots” of activity and shifts in prokaryote assemblage
composition at least in the epipelagic (0-200 m) and mesopelagic (200-1000 m) layers.
We also investigated whether bathypelagic (1000-4000 m depth) prokaryotic
assemblages underneath eddies respond to the presumably elevated vertical carbon
fluxes.
Methods
Study site and sampling
The positions of mesoscale eddies were deduced at first instance by satellite
images of sea-surface temperature during cruise RODA-I (11 August to 9 September
2006) on board the RV 'Hespérides' (Fig. 1). Once at the supposed eddy sites, their
structures were characterized by means of XBT (expendable bathythermographs). Once
located the eddy center, temperature, salinity and fluorescence were recorded down to
2000 m depth using a SeaBird 911 plus CTD system, mounted on a General Oceanics
rosette sampler, equipped with twenty-four 12 L Niskin bottles. Eddy stations were
compared to two far-field (FF) stations situated northwest of the Canary archipelago.
Chapter V. Effect of eddies on prokaryotes
168
These stations were placed inside the Canary Current, but outside the influence
of the eddy field. Samples for prokaryotic abundance and heterotrophic activity and
nucleic acid content were collected at each station from 10-13 depths ranging from 5 to
2000 m, including the deep chlorophyll maximum (DCM; 40 to 125 m), the deep
scattering layer (DSL; 450-550 m) and the oxygen minimum zone (OMZ; 720 to 850
m).
Prokaryotic abundance (PA), nucleic acid content and membrane-compromised
bacteria (NADS) determined by flow cytometry
Picoplankton collected from the different depth layers of the water column were
enumerated using flow cytometry (FCM) with a FACSCalibur (Becton-Dickinson) with
a laser emitting at 488 nm. Samples (1.5 ml) were fixed with paraformaldehyde (1%
final concentration), incubated at 4°C for 15 to 30 min and then stored frozen in liquid
nitrogen until analysis. Prior to counting the cells by FCM and after unfreezing, 200 µl
of sample were stained with a DMSO-diluted SYTO-13 (Molecular Probes) stock
(10:1) at 2.5 µM final concentration. Prokaryotes were identified by their signatures in a
plot of side scatter (SSC) versus green fluorescence (FL1). High and low nucleic acid
cells (HNA, LNA) were separated in the scatter plot of SSC-FL1 (Gasol et al. 1999).
Fig. 1. Position of the sampled stations located in the far-field (FF) and in the core of cyclonic (CE) and anticyclonic eddies (AE) in the Canary Current system, during the RODA I cruise in August 2007. Sections crossing CE1 and AE1 are represented in Figure 3
Chapter V. Effect of eddies on prokaryotes
169
HNA cells exhibited higher FL1 than LNA cells. Picocyanobacteria were discriminated
in a plot of FL1 versus red fluorescence (FL3).
Viable and damaged prokaryotic cells were estimated in non-fixed samples
following the nucleic acid double-staining (NADS) protocol (Gregori et al. 2001,
Falcioni et al. 2008). NADS+, green cells (assumed to be active, with intact
membranes) and NADS-, red cells (assumed to be inactive, with compromised cell
membranes) were identified by simultaneous double staining with a membrane-
permeant (SYBR Green; Molecular Probes) and impermeant (propidium iodide) probe.
Immediately after collecting the samples, they were incubated in the dark with the
probes for 15 min. NADS + and NADS- cells were enumerated by FCM and
differentiated in a scatter plot of FL1 (green) -FL3 (red emission after blue-light
excitation). Samples for prokaryotic abundance and NADS were run at a flow rate of
~60-70 µl min-1, which was determined volumetrically after every 10 samples run.
Prokaryotic heterotrophic activity (PHA) estimated by [3H] leucine incorporation
Prokaryotic heterotrophic activity was estimated from the incorporation of
tritiated leucine using the centrifugation method (Smith and Azam 1992). 3H-Leucine
(Leu, Amersham, specific activity = 171 Ci mmol-1) was added at saturating
concentration (40 nmol l-1) to 4 replicate 1.2 ml subsamples. Duplicate controls were
established by adding 120 µl of 50% trichloroacetic acid (TCA) 10 min prior to isotope
addition. The Eppendorf tubes were incubated at in situ temperature in temperature-
controlled chambers for 2 to 7 h. Incorporation of leucine in the quadruplicate sample
was stopped by adding 120 µl ice-cold 50% TCA. Subsequently, the subsamples and
the controls were kept at –20°C until centrifugation (at ca. 12000 g) for 20 min,
followed by aspiration of the water. Finally, 1 ml of scintillation cocktail was added to
the Eppendorf tubes before determining the incorporated radioactivity after 24 to 48 h
on a Wallac scintillation counter with quenching correction using an external standard.
Catalyzed reporter deposition-fluorescence in situ hybridization (CARD-FISH)
Immediately after collecting the samples from the Niskin bottles, 10 to 40 ml
subsamples were fixed with paraformaldehyde (2% final concentration) and stored at
4°C in the dark for 12 to 18 h. The cells were collected on 0.2 µm polycarbonate filters
Chapter V. Effect of eddies on prokaryotes
170
(Millipore, GTTP, 25 mm filter diameter) supported by cellulose nitrate filters
mm diameter), and stored at -80ºC. The filters were afterwards hybridized following the
CARD-FISH protocol cited above. The autoradiographic development was conducted
by transferring previously hybridized filter sections onto slides coated with
photographic emulsion (type NTB-2, melted at 43°C for 1 h). Subsequently, the slides
were placed in a dark box with a drying agent and exposed at 4°C for 36 to 48 h. The
slides were developed and fixed using Kodak specifications (Dektol developer [1:1
dilution with Milli-Q water] for 2 min, rinsed with Milli-Q water for 10 s, and fixed for
5 min, followed by a Milli-Q water rinse for 2 min). Cells were counter-stained with the
same DAPI mixture used for the CARD-FISH protocol. The silver grains in the
autoradiographic emulsion were detected by switching to the transmission mode of the
microscope. More than 800 DAPI-stained cells were counted per sample. To enumerate
the proportion of Crenarchaeota cells taking up leucine using the two different
Crenarchaeota probes, the procedure was repeated using each of the probes (Cren 537
and GI-554) alone or in combination.
DNA sampling, extraction and purification, and fingerprinting of the communities
For DNA fingerprinting of prokaryotic communities, 2-5 L were filtered onto 0.2 µm
polycarbonate filters (Millipore, GTTP, 47 mm filter diameter) and the filters stored in
microfuge vials in liquid nitrogen for 24 h and then at –80°C until further processing in
the laboratory. DNA extraction was performed using the UltraClean Soil DNA Isolation
Kit MoBio kit (MoBIO laboratories, Carlsbad, CA, USA) and the protocol of the
manufacturer.
Chapter V. Effect of eddies on prokaryotes
172
Terminal-restriction fragment length polymorphism (T-RFLP) for archaeal
communities. PCR conditions and chemicals were applied as described in Moeseneder
et al. (2001). One µl of the DNA extract was used as a template in a 50 µl PCR mixture.
For PCR, the Archaea-specific primers 21F-FAM and 958R-JOE were used
(Moeseneder et al. 2001). The samples were amplified by an initial denaturation step at
94ºC (for 3 min), followed by 35 cycles of denaturation at 94ºC (1 min), annealing at
55ºC (1 min), and an extension at 72ºC (1 min). Cycling was completed by a final
extension at 72ºC for 7 min. The PCR products were run on 1 % agarose gel. The gel
was stained with a working solution of SYBR Gold and the obtained bands were
excised, purified with the Quick gel extraction kit (Genscript, Piscataway, NJ, USA),
and quantified using a Nanodrop spectrophotometer. Fluorescently labeled PCR
products were digested at 37ºC overnight. Each reaction contained 30 ng of cleaned
PCR product, 5 U of tetrameric restriction enzyme (HhaI) and the respective buffer
filled up to a final volume of 50 µl with ultra-pure water (Sigma, St Louis, MO, USA).
The restriction enzyme was heat inactivated and precipitated by adding 4.5 µl LPA
solution and 100 µl of 100% isopropanol. The samples were kept at room temperature
for 15 min followed by centrifugation at 15000 g for 15 min. Thereafter, the supernatant
was discarded and the pellet rinsed with 100 µl 70% isopropanol and precipitated again
by centrifugation (15000 g for 5 min). Subsequently, the supernatant was removed and
the sample dried in the cycler at 94ºC for 1 min and stored at -20ºC until further
analysis.
The pellet was resuspended in 2 µl of ultra-pure water and the product denatured
in 7.8 µl of Hi-Di formamide at 94ºC for 3 min. Each sample contained 0.2 µl
GeneTrace 1000 (ROX) marker (Applied Biosystems, Foster City, CA, USA).
Fluorescently labeled fragments were separated and detected with an ABI Prism 310
capillary sequencer (Applied Biosystem) run under GeneScan mode (van der Maarel et
al. 1998, Moeseneder et al. 1999). The size of the fluorescently labeled fragment was
determined by comparison with the internal GeneTrace 1000 (ROX) size standard.
Injection was performed electrokinetically at 15 kV and 60ºC for 15 s (adjustable). The
output from the ABI Genescan software was transferred to the Fingerprinting II (Bio-
Rad) software to determine peak area and for standardization using size markers. The
obtained matrix was further analyzed with the Primer software (Primer-E) to determine
similarities of the T-RFLP fingerprints between samples.
Chapter V. Effect of eddies on prokaryotes
173
Automated ribosomal intergenic spacer analysis (ARISA) of the bacterial community.
ARISA was used to analyze bacterial community composition with the primer 1392F
and a 5’TET labeled version of the primer 23S rDNA as described by Fisher and
Triplett (1999) and Hewson and Fuhrman (2004). One µl of the DNA extract was used
as a template in a 50 µl PCR mixture. Thermocycling was preceded by a 3 min heating
step at 94ºC, followed by 30 cycles of denaturing at 94ºC (15 s), annealing at 55ºC (30
s), and an extension at 72ºC (3 min). Cycling was completed by a final extension at
72ºC for 9 min. The PCR products were purified with the Quick purification kit
(Genscript, Piscataway, NJ, USA), and quantified using a Nanodrop spectrophotometer.
Purified products were then diluted to 8 ng µl-1 to load a standardized amount for
fragment analysis and thereby preventing differences originated from different amounts
of loaded DNA. Each sample of the final product was mixed with 10 µl of Hi-Di
formamide at 94ºC for 3 min, 0.15 µl CST 300-1800 and 0.15 µl GeneTrace 1000
(ROX) marker (Applied Biosystems, Foster City, CA, USA). Fragments were
discriminated using an ABI Prism 310 capillary sequencer (Applied Biosystem) and the
resulting electropherograms were analyzed using the ABI Genescan software. The
output from the ABI Genescan software was transferred to the Fingerprinting II (Bio-
Rad) software to determine peak area and for standardization using size markers. Peaks
contributing <0.09% of the total amplified DNA (as determined by relative fluorescence
intensity) were eliminated as considered to be indistinguishable from baseline noise
(Hewson and Fuhrman, 2004). The obtained matrix was further analyzed with Primer
software (Primer-E) to determine similarities of the ARISA fingerprints between
samples.
Results and Discussion
Oceanographic setting
Cyclonic eddies (CE), anticyclonic eddies (AE) and far-field (FF) stations
showed contrasting temperature distributions, with generally lower temperatures in
eddies than in FF for both surface and upper mesopelagic waters (except AE1; Fig. 2A).
Chapter V. Effect of eddies on prokaryotes
174
The temperature-salinity (T-S) diagram (Fig. 2B) indicates that all the stations shared
the same meso- and bathypelagic water mass structure (with the exception of FF2 with a
slight influence of Mediterranean Sea Outflow Water). Differences in T-S properties
were only found in the epipelagic layer due to the coastal-ocean salinity gradient and
the mesoscale variability generated by the perturbation of the surface flow by the
islands (Fig. 2A, B). The cyclonic eddies CE1 (Fig. 3A) and CE2 showed very similar
temperatures throughout the water column, while the anticyclonic eddies (AE1 and
AE2) exhibited temperature differences due to their different stages of development
(Fig. 2A). AE1 was a typical mature anticyclonic eddy, with warm waters mixed down
to 200 m (Fig. 3B). AE2, close to Gran Canaria Island, was an anticyclonic eddy at an
early stage of formation, with a warm mixed layer in the upper 60 m, but a strong
thermocline underneath.
A
B
Fig. 2. Vertical profiles of temperature (ºC) (A), and temperature – salinity diagram (B) at the six stations (abbreviations as indicated in Fig. 1)
Chapter V. Effect of eddies on prokaryotes
175
Differences in prokaryotic structure and function in the epipelagic zone
We observed a marked effect of eddies on the prokaryotic community,
generating hotspots of abundance, bulk activity, community composition and
heterotrophic activity at the single-cell level (Figs. 4, 6, 7, 8). Generally, the differences
between eddy and FF stations were more apparent in the epipelagic layer than in deeper
waters.
The average prokaryotic abundance (PA) of AE (although not that of CE) was
significantly higher than at the FF stations (ANOVA test, p < 0.05; Fig. 4A). Both AE
and CE stations exhibited significantly higher (ANOVA test, p < 0.05) bulk prokaryotic
heterotrophic activity (PHA) than the FF stations (Fig. 4C), despite PHA being
exceptionally high in the surface layers of FF1 (Fig. 4D). In another study carried out in
the same region (from the NW African upwelling to the offshore oligotrophic
subtropical NE Atlantic), Alonso-Saéz et al. (2007) also found the highest leucine
incorporation rates at the offshore stations. They suggested that these high leucine
incorporation rates might not reflect proportionally higher PHA but rather shifts in the
leucine-to-carbon conversion factor which is used to calculate PHA from leucine
incorporation rates.
Temperature [ºC] Temperature [ºC]
A B
Fig. 3. Cross section of temperature (ºC) of CE1 (A) and AE1 (B) are shown as examples. Black arrows indicate the position of the CTD cast at the core of the eddies
Chapter V. Effect of eddies on prokaryotes
176
No significant differences (ANOVA test, p > 0.05) were detectable, however, in
the relative abundance of Bacteria, Crenarchaeota and Euryarchaeota between eddy
and FF stations (Fig. 5). The highest relative abundance of Euryarchaeota (14.8 % of
DAPI stainable cells) was observed in the DCM of the well-developed anticyclonic
eddy (AE1) (Table 1), where also the highest PA was found (Fig. 4A). Nevertheless, the
relative contribution of Bacteria decreased with depth (Fig. 5). In contrast, the relative
A C
*
* *
* *
* *
Fig. 4. Distribution of prokaryotic abundance (PA, cells ml-1) and bulk prokaryotic heterotrophic activity (PHA, pmol Leu l-1 h-1) in the epipelagic (“Epi”, 0-200 m), mesopelagic (“Meso”, 200-1000 m) and bathypelagic (“Bathy”, 2000 m) layers grouped in far-fields (FF), anticyclonic eddies (AE) and cyclonic eddy (CE) stations (A,B), and profiles from surface to 2000 m depth at every sampled station (C, D). Outliers are indicated as open circles. Asterisks indicate variables significantly different (ANOVA test p < 0.05) from far-field stations
Chapter V. Effect of eddies on prokaryotes
177
abundance of Crenarchaeota significantly increased from the epipelagic to mesopelagic
layer in all stations.
A
C
B
Fig. 5. Distribution of the proportion of (A) Bacteria (Eub (I-III)), (B) Crenarchaeota (hybridized simultaneously with Cren537 and GI-554), (C) Euryarchaeota (Eury806) as percentage of DAPI-stained cells in the epipelagic (“Epi”, 0-200 m), mesopelagic (“Meso”, 200-1000 m) and bathypelagic (“Bathy”, 2000 m) layers grouped in far-fields (FF), anticyclonic (AE) and cyclonic eddies (CE) stations. Outliers are indicated by open circles
As indicated by the fingerprinting approaches, the bacterial (Fig. 6A) and
archaeal (Fig. 6B) assemblages found within eddies were clearly distinct from the
assemblages found in the FF stations only in the epipelagic layer. FF showed very
similar bacterial and archaeal structure in the deep chlorophyll maximum (DCM). In
contrast, although CE1 and CE2 showed a very similar temperature profiles, the
bacterial assemblage structures were very different. The contrary occurred at AE1 and
AE2 stations that showed contrasting temperature patterns but a high similarity in
Table 1. Relative abundances of prokaryotic groups detected by 16S rRNA oligonucleotide probes and CARD-FISH as percentage of DAPI-stained cells at the deep chlorophyll maximum (DCM), the deep scattering layer (DSL), the oxygen minimum zone (OMZ), 1000 m and at 2000 m depth. Probes: Eub (I-III): Bacteria, Cren537: Crenarchaeota Cren537 probe positive; Cren554: Crenarchaeota Cren554 probe positive; Cren Total: Crenarchaeota positive hybridizing with Cren537and Cren554 probes together; Eury: marine Euryarchaeota Group II
Chapter V. Effect of eddies on prokaryotes
179
bacterial assemblage structure. Therefore, temperature was not the main parameter
controlling prokaryotic assemblage structure but probably other processes (such as
grazing, organic and inorganic matter supply, phytoplankton community structure)
potentially modified by the presence of the eddies. The total number of operational
taxonomic units (OTUs) detected was 104 for bacterial (ARISA) and 15 for archaeal
(TRFLP) communities, respectively. The number of archaeal OTUs per sample
decreased with depth (from 7 ± 2 to 3 ± 1 in the epipelagic and bathypelagic,
respectively), with no significant differences between FF and eddies at any depth layer.
A
B
CE1
FF2
Fig. 6. Non-metric multidimensional scaling (NMDS) plot of the band pattern in (A) bacterial community composition as revealed by ARISA and (B) archaeal community composition as revealed by T-RFLP. Both, band presence alone, and band intensity were used for the statistics, yielding similar results
Chapter V. Effect of eddies on prokaryotes
180
In contrast, the number of bacterial OTUs per sample was significantly higher in FF
(16) than in eddies (6 ± 1 and 7 ± 3 in the AE and CE stations, respectively) in the
epipelagic layer but not in deeper waters. In deeper waters (meso- and bathypelagic),
the number of bacterial OTUs increased, ranging from 16-20, 14-22 and 16-21 for FF,
CE and AE, respectively. About 50% and >30% of the OTUs were shared between both
types of eddies and FF for Archaea and Bacteria, respectively. Around 20% of the
archaeal and 8% of the bacterial OTUs were present at all the depths sampled,
suggesting that the bacterial community was more stratified than the archaeal
community.
A C
*
Fig. 7. Distribution of the percentage of high nucleic acid containing cells (HNA) and % NADS-determined “live” cells in the epipelagic (“Epi”, 0-200 m), mesopelagic (“Meso”, 200-1000 m) and bathypelagic (“Bathy”, 2000 m) layers grouped in far-fields (FF), anticyclonic eddies (AE) and cyclonic eddies (CE) stations (A,B), and profiles from surface to 2000 m depth at each station (C, D). Outliers are indicated by open circles. Asterisks indicate variables significantly different (ANOVA test p < 0.05) from far-field stations
Chapter V. Effect of eddies on prokaryotes
181
The percentages of high nucleic acid (HNA) (Fig. 7A, B) and of NADS+ cells
(Fig. 7C, D) were not significantly different (ANOVA test, p > 0.05) between eddies
and FF in the three depth layers. The percentage of HNA cells remained fairly constant
with depth (Fig. 7A) while the percentage of NADS+ cells decreased with depth (Fig.
7B).
A
C
B
* *
* *
Fig. 8. Distribution of the proportion of (A) the bulk prokaryotic community (DAPI-stained cells), (B) Bacteria (Eub (I-III)) and (C) Crenarchaeota (GI-554) taking up leucine in the epipelagic (“Epi”, 0-200 m), mesopelagic (“Meso”, 200-1000 m) and bathypelagic (“Bathy”, 2000 m) layers grouped in far-field (FF), anticyclonic (AE) and cyclonic eddy (CE) stations. Outliers are shown by open circles. Asterisks indicate variables significantly different (ANOVA test p < 0.05) from far-field stations
Chapter V. Effect of eddies on prokaryotes
182
The proportion of the prokaryotic community taking up leucine (fraction of
leucine positive cells) (Fig. 8A), and the fraction of leucine+ Bacteria (Fig. 8B), were
higher (ANOVA test, p < 0.05) in the epipelagic zone of eddies than at the FF stations
(Table 2). Conversely, the percentage of leucine+ Crenarchaota and Euryarchaeota
was not significantly different (Fig. 8C, D). Although Euryarchaeota were not very
abundant, they showed the highest proportion of leucine+ cells (ranging between 48-64
The variability found in community structure and activity between eddies and
FF probably reflects the accumulation of organic matter at eddy centers and boundary
Table 2. Percentage of Bacteria (Eub I-III), Crenarchaeota Cren537 probe positive (Cren537), Crenarchaeota Cren554 probe positive (Cren554) and Euryarchaeota marine Group II (Eury) taking up leucine as detected by MICRO-CARD-FISH, at the deep chlorophyll maximum (DCM), the deep scattering layer (DSL), the oxygen minimum zone (OMZ), 1000 m and at 2000 m depth. n. d.: non-determined
Chapter V. Effect of eddies on prokaryotes
183
zones in the eddy field region, as described in previous studies (Arístegui et al. 2003,
Arístegui & Montero 2005). Frontal structures have been shown to promote the
accumulation of organic matter and concomitantly of prokaryotes (Floodgate et al.
1981, Pomeroy et al. 1983, Ducklow 1988). In particular, Arístegui & Montero (2005)
observed that frontal structures between eddy pairs in the Canary region favored the
accumulation of bacteria. Also, Baltar et al. (2009) found dense accumulations of
autotrophic and heterotrophic pico- and nanoplankton organisms at eddy-eddy and
eddy-filament boundary regions. Additionally, the changes found in the prokaryotic
activity and community structure may be induced by the higher availability of inorganic
nutrients generated by the eddies. The growth of prokaryotic and eukaryotic autotrophs
in many aquatic systems is limited by the availability of nitrogen, phosphorus, iron and
silica (e.g. Elser et al. 1990, 1995). This increased supply of nutrients for surface-water
prokaryotes can be produced directly by the upwards pumping of deep water (in the CE)
and/or the accumulation of planktonic organism (in the center and borders of AE). Due
to the accumulation of microorganisms in AE, the protistan grazing on prokaryotes (an
important mechanism of nutrient regeneration in the ocean) may be high. This increased
supply of inorganic nutrients may have a stronger effect on prokaryotes than on
eukaryotic phytoplankton, because aquatic bacteria are better competitors for
phosphorus than eukaryotic algae at low ambient nutrient concentrations (Thingstad et
al. 1998). In addition, theory (Klausmeier et al. 2004) and experiments (Sommer 1994)
confirm that different nutrient profiles in the water column select for phytoplankton
species with different stoichiometries. This increase in the availability of nutrients may
modulate phytoplankton community structure and concomitantly, modify prokaryotic
assemblage structure and activity (Kelly & Chistoserdov 2001, Klausmeier et al. 2004).
In that sense, Ewart et al.. (2008) found a tight relationship between enhanced PHA,
phytoplankton biomass and the specific phytoplankton species, suggesting that
phytoplankton community structure was an important factor influencing bacterial
activity.
Propagation of effects into deeper layers
The differences in bulk PHA and PA observed in the epipelagic zone between
eddy and FF stations propagated, albeit attenuating, into the mesopelagic waters where
Chapter V. Effect of eddies on prokaryotes
184
also higher bulk PHA and PA were detected at the eddy stations (Fig. 4). Moreover,
some single-cell activity proxies also indicated differences between AE and FF. A
significantly higher percentage of NADS+ cells was found in the mesopelagic layer of
AE (Fig. 7C). However, the proportion of heterotrophically active meso- and
bathypelagic prokaryotes was similar in eddies and FF (Fig. 8).
In the mesopelagic zone, both CE and AE exhibited significantly higher PA than
FF stations (ANOVA test, p < 0.05). In the bathypelagic zone, no significant differences
in PA were detectable among the different sites. Also, like in the epipelagic zone, eddy
stations (AE and CE) exhibited significantly (ANOVA test, p < 0.05) higher leucine
uptake rates than FF stations in the mesopelagic realm (but not in the bathypelagic)
(Fig. 4C).
No significant differences (ANOVA test, p > 0.05) were detectable in the
relative abundance of Bacteria, Crenarchaeota and Euryarchaeota (Fig. 5), the
bacterial or archaeal community structures (Fig. 6), the percentage of HNA cells (Fig.
7A, B), and the proportion of Bacteria, Crenarchaota or Euryarchaeota taking up
leucine (Table 2) between the eddy stations and the FF reference stations in the dark
ocean. However, a significantly (ANOVA test, p < 0.05) higher percentage of NADS+
cells (Fig. 7C, D) was found for the mesopelagic realm of AE as compared to FF (Fig.
7C, D), but not in the epi- or bathypelagic layers.
Taken together, these results suggest that only the prokaryotic communities from
the epipelagic zone of the eddy stations (and not from deeper waters) are metabolically
more active at the single-cell level than those of the FF stations (Fig. 6, 7, 8). The
differences found in bulk PA, PHA and NADS+ cells between eddies and FF in the
mesopelagic layer could be related to the increase of the organic matter flux generated
by eddies. In a complementary study investigating the flux of particles collected with
drifting sediment traps (I. Alonso-González, pers.com.), the same eddies investigated
here were found to enhance particulate organic carbon (POC) export with respect to FF
stations by a factor of 2-4. These results are in contrast to a study of Maiti et al. (2008)
on a mature cyclonic eddy in the lee of Hawaii. They found that, although the eddy was
highly productive at the surface, it was not efficient at exporting particulate carbon and
nitrogen to deeper waters. In fact, they observed that particle production occurred in the
upper 100 m and was rapidly remineralized in the upper 150 m.
Chapter V. Effect of eddies on prokaryotes
185
Peaks of prokaryotic activity and abundance in the mesopelagic zone
Although prokaryotic abundance and metabolism generally decreased with
depth, pronounced peaks were sometimes detected in the mesopelagic layer. In
particular, PA peaks were observed at 400 m depth at station CE1, coinciding with the
Deep Scattering Layer (DSL), and in the oxygen minimum zone (OMZ; ca. 800 m
depth) of CE1 and FF2 (Fig. 4B). Also, marked peaks in PHA, HNA and NADS+ cells
were found at several depths of the mesopelagic zone, at different stations (Fig. 4B, D
and Fig. 7B, D). The two peaks of PA at station CE1 corresponded to large prokaryotes
with a high % of HNA (compare Fig. 4B and 7B), whereas the peak of prokaryotes at
the OMZ of station FF2 corresponded to cells with the same % of HNA as in surface
communities (Fig. 7B). In the latter peak, a higher proportion of prokaryotes was
identified as incorporating leucine (40 % leucine+ of DAPI stainable cells) compared
with other depths sampled at station FF2 (14 - 27 % leucine+ of DAPI stainable cells).
Also, it coincided with a pronounced peak in NADS+ cells (Fig. 7D), and a shift in
bacterial (Fig. 6A) and archaeal (Fig. 6B) community composition. In fact, it is
noteworthy that the only deep-water sample clustering with the epipelagic communities
of both Bacteria and Archaea was that belonging to the OMZ in station FF2 (Fig. 6).
This might indicate that the prokaryotic community present at this particular depth was
more related to that of the DCM than to the assemblages of the corresponding depths of
other stations.
Mesopelagic hotspots of microbial respiration (Arístegui et al. 2003),
prokaryotic nucleic acid content (Chapter I), leucine incorporation and
leucince/thymidine incorporation ratio (Gasol et al. 2009), dissolved organic carbon
(Arístegui et al.. 2003), and zooplankton biomass, gut fluorescence and respiration
(Hernández-León et al. 2001, Yebra et al. 2005) have been reported in previous studies
for the eddy field region south of the Canary Islands. Hence, the observed patchiness in
mesopelagic activity in these waters seems to be related to the complex hydrographic
regime of the region around the Canary Islands.
Relationship between prokaryote viability and single-cell heterotrophic activity
throughout the water column
The proportion of viable cells (NADS+ cells) correlated well with the fraction of
leucine+ prokaryotic cells (Spearman R = 0.71, p < 0.0001, n = 26, Fig. 9).
Furthermore, the percentage of heterotrophically active Bacteria was correlated to the
Chapter V. Effect of eddies on prokaryotes
186
percentage of NADS+ cells (Spearman R = 0.67, p < 0.0002, n = 26), but no correlation
was found for any archaeal group. These results, together with the observed lower
relative abundance of both archaeal groups compared with Bacteria, suggest that the
fraction of heterotrophically active (leucine+) and viable (NADS+) cells was dominated
by Bacteria and not by Archaea throughout the water column. Our results agree with the
higher proportion of bacterial cells active in the uptake of leucine, as compared to
archaeal cells in the North Atlantic water column (Herndl et al. 2005). As shown in Fig.
9, the fraction of viable and heterotrophically active prokaryotes is more similar (i.e.
closer to the 1:1 line) at low than at high values. This indicates that the NADS method
likely detects cells that are intact but not necessarily very active, while MICRO-CARD-
FISH identifies cells that are active (depending on the concentration of leucine used and
on the exposure time), following the prokaryotic “physiological structure” model of del
Giorgio & Gasol (2008).
Fig. 9. Relationship between the NADS-determined “live” cells and the proportion of active prokaryotic cells taking up leucine (determined by MICRO-CARD-FISH)
Chapter V. Effect of eddies on prokaryotes
187
Conclusions Our results show that mesoscale eddies play a differential role in the distribution
and function of prokaryotes in the ocean. The largest effects and differences were
observed in the upper 1000 m, suggesting that prokaryotic communities are probably
linked to the mesoscale heterogeneity, and the increase in productivity and downward
flux of organic matter enhanced by eddy action. In general, the effect of anticyclonic
eddies was stronger than that of cyclonic ones. Due to the recognized major role of
eddies in ocean circulation, more effort should be put in the future to study the
microbial processes within these mesoscale features. This would allow constraining the
fate of carbon in the ocean and concomitantly building more accurate models of global
biogeochemical cycles.
Chapter V. Effect of eddies on prokaryotes
188
Acknowledgments This research was supported by two grants of the Spanish Ministry of Education
and Science to J.A. (Oceanic Eddies and Atmospheric Deposition – RODA, CTM 2004-
06842-C03/MAR, and Shelf–Ocean Exchanges in the Canaries–Iberian Large Marine
Ecosystem -CAIBEX, CTM 2007-66498-C02), a grant of the Earth and Life Science
Division of the Dutch Science Foundation (ALW-NWO; ARCHIMEDES project,
835.20.023) to G.J.H. and a predoctoral Fellowship of the Spanish Ministry of
Education and Science (AP2005-3932) to F.B. I.L and J.M.G were also supported by
project MODIVUS (CTM2005-04795/MAR). The work was carried out within the
frame of the EU ‘Networks of Excellence’ MarBef and EurOceans. We acknowledge
the insightful comments of two anonymous reviewers, which helped improve the
manuscript. We thank the captain and crew of RV Hespérides for their help during work
at sea. We also thank A. Marrero-Díaz for providing the temperature cross-sections, and
A.M. Caballero-Alfonso for her help during sampling and DNA extraction.
References Alonso-Saéz L, Gasol JM, Arístegui J, Vilas JC, Vaqué D, Duarte CM, Agusti S (2007)
Large-scale variability in surface bacterial carbon demand and growth efficiency in
the subtropical northeast Atlantic Ocean. Limnol. Oceanogr. 52:533-546
community structure and standing stocks in the NE Atlantic in June and July of
1996. Deep Sea Res. II 48: 963-985.
Teira E, Reinthaler T, Pernthaler A, Pernthaler J, Herndl GJ (2004) Combining
catalyzed reporter deposition-fluorescence in situ hybridization and
microautoradiography to detect substrate utilization by Bacteria and Archaea in the
deep ocean. Appl. Environ. Microbiol. 70: 44411-44414.
Thingstad TF, Zweifel UL, Rassoulzadegan F (1998) P limitation of heterotrophic
bacteria and phytoplankton in the northwest Mediterranean. Limnol. Oceanogr. 43:
88-94.
Thyssen M, Lefevre D, Caniaux G, Ras J, Fernandez CI, Denis M (2005) Spatial
distribution of heterotrophic bacteria in the northeast Atlantic (POMME study area)
during spring 2001. J. Geophys. Res. 110: doi:10.1029/2004JC002670.
van der Maarel MJEC, Artz RRE, Haanstra R, Forney LJ (1998) Association of marine
Archaea with the digestive tracts of two marine fish species. Appl. Environ.
Microbiol. 64: 2894-2898.
van Haren H, Millot C, Taupier-Letage I (2006) Fast deep sinking in Mediterranean
eddies. Geophys. Res. Lett.
Yebra L, Almeida C, Hernández-León S (2005) Vertical distribution of zooplankton and
active flux across an anticyclonic eddy in the Canary Island waters. Deep-Sea Res.
I 52: 69-83.
Zhang Y, Sintes E, Chen J, Zhang Y, Dai M, Jiao N, Herndl GJ (2009) Role of
mesoscale cyclonic eddies in the distribution and activity of Archaea and Bacteria
in the South China Sea. Aquat. Microb. Ecol. 56:65-79
Chapter V. Effect of eddies on prokaryotes
195
Chapter VI Determining prokaryotic carbon utilization in the dark ocean: growth efficiency, leucine-to-carbon conversion factors and their relation F. Baltar, J. Arístegui, J. M. Gasol, G. J. Herndl Aquatic Microbial Ecology (in revision)
Chapter VI. Deep ocean’s prokaryotic growth yield
197
Abstract
Experiments were conducted in the mesopelagic subtropical Northeast Atlantic
Ocean to determine variation in the prokaryotic leucine-to-carbon conversion factor
(CF), and prokaryotic growth efficiency (PGE). The way prokaryotic heterotrophic
production (PHP) is calculated directly influences PGE (variations of PGE between 1-
31% were found for a single sample). The empirically obtained deep-water CFs showed
a 7-fold variability (0.13-0.85 kg C mol-1 Leu) and hence, were lower than the
theoretical CF of 1.55 kg C mol-1 Leu assuming no isotope dilution. Empirically
determined CFs were highly correlated to PGE, suggesting that both parameters are
representations of the same basic metabolic processes. Overall, the PGEs obtained in
this study suggest that mesopelagic prokaryotic assemblages can be as important in
carbon processing as their epipelagic counterparts, at least in some regions.
Introduction A key concept in the study of ecosystem ecology is the balance between
catabolic and anabolic processes, usually defined as the growth efficiency. This
parameter quantifies the proportion of the organic carbon incorporated into biomass
(production) compared to the total organic carbon uptake (production plus respiration).
In the oceanic ecosystem, prokaryotes play a mayor role in the organic carbon fluxes,
being responsible for up to >90% of the community respiration (Robinson & Williams
2005). Prokaryotes are also a key component of the microbial loop, acting as a trophic
link (transforming dissolved into particulate organic carbon) for higher trophic levels
(Azam et al. 1983). Therefore, the organic carbon concentration that will be respired
(CO2 release) in the ocean and/or the amount of organic carbon that will flow through
prokaryotes to higher trophic levels greatly depends on the prokaryotic growth
efficiency (PGE) (Carlson et al. 2007).
Although estimating PGE in the ocean is essential, obtaining the metabolic rates
involved in that assessment is not simple. Prokaryotic respiration (PR) is, in theory,
more complicated to measure than production. Authors often use an assumed PGE to
estimate PR from prokaryotic heterotrophic production (PHP). Two empirical equations
Chapter VI. Deep ocean’s prokaryotic growth yield
198
have largely been used, one estimating PGE from PHP (del Giorgio & Cole 1998) and
the other from temperature (Rivkin & Legendre 2001). While these global assessments
across systems provide valuable insights into overall control mechanisms of prokaryotic
metabolism, PGE might vary substantially among and even within systems.
PHP is frequently determined by measuring leucine or thymidine incorporation
and applying an empirically obtained conversion factor to convert the leucine or
thymidine incorporation rates into carbon production (del Giorgio & Cole 1998).
However, the relation between substrate incorporation and carbon produced is not
constant (Ducklow 2000). This leucine (or thymidine) to carbon conversion factor
(LeuCF) may vary by a factor of 10 within individual systems (e.g. Sherry et al. 2002,
Alonso-Saéz et al. 2007). Thus, assuming a fixed theoretical LeuCF can yield to
erroneous PHP estimates. Consequently, it is generally recommended to empirically
Fig. 1. Position of sampling stations during the RODA II cruises in February 2007. Full circles indicate stations where experiments to determine prokaryotic growth efficiencies were performed. Open squares indicate stations where assays to determine leucine-to-total carbon conversion factors were performed
Table 1. Temperature (T, ºC), salinity, type of experiment performed, total incubation time (h), initial prokaryotic abundance (PA, 105 cell ml-1), prokaryotic heterotrophic production (PHP, pmol leu l-1 h-
1), turnover time (Tt, d), and high nucleic acid content cells (HNA, %) in the ambient water collected at each station
Chapter VI. Deep ocean’s prokaryotic growth yield
201
Prokaryotic Respiration (PR) and Prokaryotic Growth Efficiency (PGE)
PR was measured by following the changes in dissolved oxygen concentrations
during dark incubations. Water samples drawn into carboys were carefully siphoned
into twelve biological oxygen demand (BOD) bottles, and three replicate bottles were
immediately fixed with Winkler reagents to determine the initial oxygen concentration.
Three replicate bottles were incubated in the dark at in situ temperature and fixed with
Winkler reagents after 24 and 48 h. At each time step, one additional replicate bottle
was used to determine prokaryotic abundance (PA) and prokaryotic heterotrophic
production (PHP) as described below. Dissolved oxygen measurements were made by
automated Winkler titrations on the basis of colorimetric end-point detection as
described in Arístegui et al. (2005). PR was estimated from the difference in oxygen
concentration at the start and the end of the incubation. To convert oxygen consumption
to carbon respiration, a respiratory quotient of 1 was assumed (del Giorgio et al. 2006).
Prokaryotic growth efficiency (PGE) was calculated as (PHP / PHP+PR) x 100.
PR was estimated as described above in 48 h incubations (see Fig. 2 for an example).
PHP was estimated in four different ways: (1) based on Leu incorporation at the start of
the incubation using the theoretical conversion factor (1.5 kg C mol-1 Leu assuming no
isotope dilution), (2) the integrated PHP over the 48-h incubation (see below) using the
theoretical conversion factor (1.5 kg C mol-1 Leu), (3) the change in prokaryotic
biomass, estimated from the increase in cell numbers during the incubation and using a
conservative factor of 12 fg C cell-1 (Fukuda et al. 1998), and (4) the integrated PHP
over the 48 h incubation using the empirically determined conversion factor of each
sample in which it was determined.
Prokaryotic abundance (PA) and prokaryotic heterotrophic production (PHP)
Picoplankton cells were enumerated using flow cytometry on a FACSCalibur
(Becton Dickinson) with a laser emitting at 488 nm wavelength. Samples (1.5 ml) were
fixed with paraformaldehyde (1% final concentration), incubated at 4°C for 15 to 30
min and then stored frozen in liquid nitrogen until analysis. Prior to counting the cells,
200 µl of sample were stained with a DMS-diluted SYTO-13 (Molecular Probes) stock
(10:1) at 2.5 µM final concentration. Prokaryotes were identified by their signature in a
plot of side scatter (SSC) versus green fluorescence (FL1). High and low nucleic acid
cells (HNA, LNA) were separated in the scatter plot of SSC-FL1 (Gasol et al. 1999).
HNA cells exhibited higher FL1 than LNA cells.
Chapter VI. Deep ocean’s prokaryotic growth yield
202
PHP was estimated by the incorporation of tritiated leucine (specific activity 171
Ci mmol-1, Amersham) using the centrifugation method (Smith & Azam 1992). Four
replicates and two TCA-killed blanks were incubated with 40 nmol l-1 of 3H-Leu for 3
to 7 h. Precipitation was done with ice-cold TCA. Although the use of 40 nmol l-1 as a
saturating concentration was justified by concentration kinetics done on board, the
dilution of the ambient leucine could have diluted the tracer by 10-20%, introducing
some variability on the data. Furthermore, not rinsing with ethanol may lead to the
detection of unspecific 3H labeling. That is why ethanol rinsing is often used to remove
this labeling (Wicks & Robarts 1988, Ducklow et al. 2002, Kirchman et al. 2005).
However, ethanol rinsed did not show any significant change in the results of other
studies (Van Wambeke et al. 2002, Granéli et al. 2004, Van Wambeke et al. 2008)
Determination of the Leucine to carbon conversion factor (CF)
Eight experiments were performed to determine the Leu-to-carbon CFs for deep-
water heterotrophic prokaryotic communities (see Fig.2 for an example). Each water
sample was gently filtered through a 0.6 µm polycarbonate filter (Millipore, GTTP),
and incubated in 2-l acid-clean polycarbonate bottles in the dark at in situ temperature.
Subsamples were taken for PHP and PA measurements every 12–24 h until prokaryotes
reached the stationary growth phase. CFs were calculated with the cumulative method
(Bjørnsen & Kuparinen 1991), which maximizes the use of available data.
Statistical analyses
Data were log transformed and normality was checked with a Shapiro-test
before Pearson correlations were calculated using the freely available R software (Ihaka
& Gentleman 1996).
Results and Discussion Deep-ocean variability in the leucine to carbon conversion factor (CF)
We empirically estimated the CF at the different stations and obtained a 7-fold
variation (0.13-0.85 kg C mol-1 Leu) (Table 2, Fig. 2). The empirically obtained CFs
were consistently lower than the theoretical CF for open ocean surface waters (1.55 kg
C mol-1 Leu assuming no isotope dilution) (e.g. Ducklow et al. 1992, Carlson &
Ducklow 1996, Zubkov et al. 2000). Our results are in agreement with the range of CFs
Chapter VI. Deep ocean’s prokaryotic growth yield
203
(0.02-1.29 kg C mol-1 Leu, mean = 0.32 kg C mol-1 Leu) reported by Alonso-Sáez et al.
(2007) for the oligotrophic surface waters of the NE Atlantic Ocean. Furthermore, in the
only other study where deep ocean (>200 m depth) CFs are reported (Gasol et al. 2009),
CF ranged between 0.39-2.38 kg C mol-1 Leu, the latter value was the only one higher
than the theoretical CF out of 5 measurements with no significant difference between
epi- and mesopelagic CFs. Our average CF (0.5 ± 0.2 kg C mol-1 Leu) is similar to the
mean CF of 0.4 ± 0.2 kg C mol-1 Leu reported by Gasol et al. (2009) and the mean CF
of 0.3 ± 0.3 kg C mol-1 Leu obtained by Alonso-Sáez et al. (2007). Although it is known
that CFs can substantially deviate from the theoretical CF (Kirchman 1992), the
underlying reason for this is still unclear.
Alonso-Sáez et al. (2007) analyzed the cause for these lower-than-theoretical
CFs in oligotrophic surface waters of the NE Atlantic by measuring the respiration and
assimilation of 14C-labeled leucine along a productivity gradient. These authors found
an increasing fraction of leucine respired and decreasing CFs towards offshore,
suggesting that leucine catabolism might be related to low CFs. Thus, a proportion of
the leucine taken up is not used for protein synthesis, hence biomass production, but
respired. We suggest that similar processes as reported for oligotrophic surface waters
take place also in the dark ocean, where carbon limitation and a slower prokaryotic
growth than in surface waters are generally reported. The slow growth of deep ocean
prokaryotes could also involve a relatively higher protein turnover than in surface
waters, further reducing the deep water CFs as compared to the theoretical one. Alonso-
Sáez et al. (2007) specifically tested the possibility of protein turnover and did not find
a significant influence of this process on the low CFs measured in oligotrophic surface
waters, but similar measurements in the dark ocean are lacking. Overall, our results
suggest a possible overestimation of carbon production (and concomitantly of PGE) in
deep waters if calculated from leucine incorporation measurements using the commonly
applied theoretical CF.
Fig. 2. (A) Mean (± SD) of prokaryotic biomass (PBM, µg C l-1), high nucleic acid content cells (HNA, %) and leucine incorporation (LIR, pmol leu l-1 h-1) during the carbon-to-leucine conversion factor experiment at station T1 (540 m). (B) Variation in prokaryotic heterotrophic production (PHP, µmol C l-1 d-1) biomass (PBM, µg C l-1), high nucleic acid content cells (HNA, %) and oxygen concentration (µmol l-1) during the prokaryotic growth efficiency (PGE) experiment at station T1 (540 m). In most of the parameters plotted standard deviations are not visible since they are smaller than the symbols
Chapter VI. Deep ocean’s prokaryotic growth yield
205
Variability of prokaryotic growth efficiencies in the dark ocean
The use of different approaches for estimating PHP in the incubation
experiments resulted in a considerable range of deep water PGEs (Table 3). A similar
conclusion was reached by Alonso-Sáez et al. (2007) for the oligotrophic surface waters
of the same study area (NE subtropical Atlantic) and by del Giorgio et al. (pers. com.)
for North Pacific waters. Using the PHP measured at the start of the incubation (PHP t0
CFt) resulted in one order of magnitude lower PGEs (PGE ranging between < 1 – 2 %),
as compared to the integrated PHP (PHP Int CFt), determined over the course of the
incubation (PGE ranging between < 1 – 34 %), or by based on the increase in
prokaryotic biomass (PBM; PGE ranging between < 1 – 33 %) (Table 3). Averaging all
the different approaches, PGEs ranged from <1 to 24% (Table 3). The highest PGE
estimates for deep waters are similar to the average PGE of surface water prokaryotes
(del Giorgio & Cole, 2000), and are within the range reported by Alonso-Sáez et al.
(2007) for the surface waters of the same study region (1-56%). Although there are only
a few reports of PGE available for the dark ocean, the range obtained in the present
study also falls within the PGE obtained in other studies. Arístegui et al. (2005)
estimated an average PGE of 18 ± 3% and 13 ± 2% at 600 m and 1000 m depth,
respectively, for the same study region. In an experimental simulation at the Bermuda
Atlantic Time-Series Study (BATS) site, Carlson et al. (2004) estimated PGE to be 8 ±
4% for the upper mesopelagic prokaryotic assemblage after convective overturn.
Reinthaler et al. (2006) found an average PGE of 2 ± 1% in the meso- and
bathypelagical realm of the North Atlantic Ocean. Tanaka & Rassoulzadegan (2004),
report an annual PGE of 19-39% for the mesopelagic layers of the Northwest
Mediterranean Sea. Zaccone et al. (2003) determined a PGE range of 6-21% for the
water column of the Ionian Sea derived from ETS (electron transport system)
measurements, the highest PGE corresponding to the deepest water mass (2000-3500 m
depth). Therefore, all the above results (except Reinthaler et al. 2006) suggest that PGEs
in the mesopelagic realm are not always as low as predicted from the empirical function
proposed by del Giorgio & Cole (1998), although there is a high variability of PGE
estimates depending on the approach to compute PHP (Table 3). Arístegui et al. (2005)
claimed, based on the PGE obtained as well as on other metabolic proxies for
prokaryotes, that the mesopelagic prokaryotic assemblage in the subtropical Northeast
Atlantic is as active as the surface waters community, even though prokaryotic
Chapter VI. Deep ocean’s prokaryotic growth yield
206
abundance is lower in the mesopelagic realm than in surface waters. Overall, although
some uncertainties remain on the actual PGEs, deep ocean PGEs appear to be
comparable to the PGEs of oligotrophic surface waters suggesting that also dark ocean
prokaryotes play a substantial role in marine carbon flux.
Relationship between CFs and PGE in the dark ocean
As shown above, CFs variability is high in the dark ocean influencing the PHP
and PGE estimates of deep ocean prokaryotes (Table 3). In experiments with surface
waters, decreases in empirically determined CFs along decreasing trophic gradients
have been reported for the Mediterranean Sea (Pedrós-Alió et al. 1999), the NE Pacific
Ocean (Sherr et al. 2001) and for the NE Atlantic Ocean (Alonso-Sáez et al. 2007).
These trends suggest that CFs are ecologically constrained and not just confinement
artifacts caused by bottle enclosures (Massana et al. 2001). However, for deep waters
this is not so clear due to the low number of CF experiments carried out thus far.
We found a significant correlation (Pearson r = 0.93, p = 0.019, n = 5, log-log
transformed) (Fig. 3) between the empirically derived CFs and the PGEs estimated
using the integrated PHP and the theoretical CF, but no significant relation with the
Table 3. High nucleic acid content cells (HNA) % range, prokaryotic respiration (PR), biomass production (PBM) estimated from the change in abundance assuming a carbon content per cell of 12 fg C cell-1 (Fukuda et al. 1998), leucine-based (using theoretical CF of 1.55 kg C mol-1 Leu) prokaryotic heterotrophic production at the initial incubation time (PHP t0 CFt) and integrated over 48 h of incubation (PHP Int CFt), prokaryotic growth efficiency (PGE, %) range and average (see text for details) and PGE calculated from the empirically obtained carbon-to-leucine conversion factor (PGE CFe). Metabolic rates are in µmol C m-3 d-1
Chapter VI. Deep ocean’s prokaryotic growth yield
207
PGE obtained with the PHP measured at the start of the incubation and with the PHP
calculated from the increase in prokaryotic abundance over time. It is noteworthy that
autocorrelation is not responsible for this relation because PGE was estimated with the
theoretical CF (Fig. 3). Alonso-Sáez et al. (2007) also reported a correlation (Pearson r
= 0.86, p < 0.0004, n = 12, log-log transformed) between empirically determined CFs
and PGEs (averaging biomass increase and leucine incorporation at the start of the
incubation) for the oligotrophic surface NE Atlantic Ocean. Our findings support the
idea that both parameters (CF and PGE) reflect basically the same physiological
processes as reported for surface water prokaryotes (Alonso-Sáez et al. 2007, del
Giorgio et al. pers. com.) also in the dark ocean.
Estimating prokaryotic carbon utilization in the ocean
Although PGE is known to be a key ecological variable in the analyses of
oceanic carbon flux, and that empirically obtained CFs are required to obtain an
accurate PGE, estimating these two parameters is far from trivial (see Gasol et al. 2008).
There is a temporal scale problem in PGE determinations, because PHP can be
measured in incubations over a time frame of minutes to hours while measurements of
prokaryotic respiration require at least incubation times of ≈24 h in oceanic waters (cf.
Fig. 3. Relationship between empirically derived leucine-to-carbon conversion factors (CFs) and prokaryotic growth efficiency (PGE) estimated via integrated PHP using the theoretical CF
Chapter VI. Deep ocean’s prokaryotic growth yield
208
Arístegui et al. 2005). Although there is an instantaneous estimate (without incubation)
for respiration available such as the ETS measurement, this is a rather indirect way
depending on poorly constrained and potentially variable conversion factor (e.g. ETS
and the R:ETS ratio). The most essential issues that affect both PGE and CFs during
long incubations is related to this time scale and related to bottle confinement. After a
certain incubation period, leucine incorporation rates increase followed by increases in
biomass (e.g. Ducklow & Hill 1985). This casts doubts whether the community that is
actively growing is representative from the in situ assemblage. When this shift in
community composition takes place, cells with high DNA (HNA) content start to be
more abundant relative to the low DNA fraction of the prokaryotic community (e.g.
Vaqué et al. 2001). This issue, however, is more significant in incubation experiments
to determine CFs, as the incubation times are generally days. Nevertheless, the relation
found between two different processes (Fig. 3) incubated at different time-scales (CF up
to ~220 h and PGE 24-48 h) might indicate that processes remain representative for the
in situ conditions. It is also possible that, as suggested by del Giorgio et al. (pers. com.),
these empirical CFs and PGEs are simply different expressions of the same basic
limitation. In this case, the CF would be effective in accounting for the decoupling of
leucine incorporation and biomass production over short-term incubations, which is,
however, greatly overcompensated if applied to long-term incubations. Following this
argument, correcting the PGE with empirically obtained CFs would result in an
underestimation of the actual PGE. However, this assumption remains to be tested for
the dark ocean.
Another related problem affecting PGE and CF estimates is the possible
variation in the carbon content per cell, which also shows a rather wide range, and can
also change during the course of the incubations (Ducklow 2000). An additional
difficulty, also related to deep water analyses, is the potential effect of incubating under
depressurized conditions. However, thus far no consistent pattern has emerged from
studies on the effect of hydrostatic pressure on deep ocean prokaryotic activity. There is
evidence that deep water prokaryotic activity is overestimated if measured under
decompressed conditions (Jannasch & Wirsen 1982), while other studies report an
increasing energy demand associated with decompression suggesting an
underestimation of PGE values determined under decompressed conditions (Tamburini
et al. 2003). To be able to determine the magnitude of carbon flux mediated by
prokaryotes in the dark ocean further testing and methodological improvements are
Chapter VI. Deep ocean’s prokaryotic growth yield
209
needed, and especial efforts should be directed to evaluate the conversion factors
involved in the prokaryotic rate measurements under in situ conditions.
Chapter VI. Deep ocean’s prokaryotic growth yield
210
Acknowledgments This research was supported by the Spanish “Plan Nacional de I+D” (MEC)
under the RODA (CTM2004-06842-C03-03 / MAR) and CAIBEX (CTM2007-66408-
C02-02) grants to J.A., a grant of the Earth and Life Science Division of the Dutch
Science Foundation (ALW-NWO; ARCHIMEDES project, 835.20.023) to G.J.H. and a
predoctoral Fellowship of the Spanish Ministry of Education and Science (AP2005-
3932) to F.B. Project MODIVUS (CTM2005-04795/MAR) supported J.M.G. The work
was carried out within the frame of the EU ‘Networks of Excellence’ MarBef and
EurOceans. We thank the captain and crew of R/V Hespérides for their support at sea,
and M. Espino and I. Alonso-González for their help with the respiration estimates. We
also thank three anonymous reviewers for their comments and suggestions to improve
the manuscript.
References Alonso-Saéz L, Gasol JM, Arístegui J, Vilas JC, Vaqué D, Duarte CM, Agusti S (2007)
Large-scale variability in surface bacterial carbon demand and growth efficiency
in the subtropical northeast Atlantic Ocean. Limnol. Oceanogr. 52:533-546
Arístegui J, Duarte CM, Gasol JM, Alonso-Sáez L (2005) Active mesopelagic
prokaryotes support high respiration in the subtropical northeast Atlantic Ocean.
Geophys. Res. Lett. 32:L03608, doi:03610.01029/02004GL021863
Arístegui J, Gasol JM, Duarte CM, Herndl GJ (2009) Microbial Oceanography of the
dark ocean's pelagic realm. Limnol. Oceanogr. 54:1501-1529
Azam F, Fenchel T, Field JG, Gray JS, Meyer-Reil LA, Thingstad F (1983) The
ecological role of water-column microbes in the sea. Mar. Ecol. Prog. Ser.
10:257-263
Bell RT (1990) An explanation for the variability in the conversion factor deriving
bacterial cell production from incorporation of [3H]thymidine. Limnol.
Oceanogr. 35:910-915
Chapter VI. Deep ocean’s prokaryotic growth yield
211
Bjørnsen PK, Kuparinen J (1991) Determination of bacterioplankton biomass, net
production and growth efficiency in the Southern Ocean. Mar. Ecol. Prog. Ser.
71:185-194
Buesing N, Marxsen J (2005) Theoretical and empirical conversion factors for
determining bacterial production in freshwater sediments via leucine
incorporation. Limnol. Oceanogr. 3:101-107
Calvo-Díaz A, Morán XAG (2009) Empirical Leucine-to-Carbon Conversion Factors
for Estimating Heterotrophic Bacterial Production: Seasonality and
Predictability in a Temperature Coastal Ecosystem. Appl. Environ. Microbiol.
75:3216-3221
Carlson CA, Ducklow HW (1996) Growth of bacterioplankton and consumption of
dissolved organic carbon in the Sargasso Sea. Aquat. Microb. Ecol. 10:69-85
Carlson CA, Giovannoni SJ, Hansell DA, Goldberg SJ, Parsons R, Vergin K (2004)
Interactions among dissolved organic carbon, microbial processes, and
community structure in the mesopelagic zone of the northwestern Sargasso Sea.
Limnol. Oceanogr. 49:1073-1083
Carlson CA, Giorgio PAd, Herndl GJ (2007) Microbes and the Disipation of Energy
and Respiration: From Cells to Ecosystems. Oceanography 20:89-100
Carlucci AF, Craven DB, Robertson KJ (1986) Microheterotrophic utilization of
dissolved free amino acids in depth profiles of Southern California Borderland
basin waters. Oceanolog. Acta 9:89-96
del Giorgio PA, Cole JJ (1998) Bacterial growth yield efficiency in natural aquatic
systems. Annu. Rev. Ecol. Syst. 29:503-541
del Giorgio PA, Cole JJ (2000) Bacterial energetics and growth efficiency. In:
Kirchman DL (ed) Microbial ecology of the oceans. Wiley-Liss, New York, p
289-325
del Giorgio PA, Williams PJleB (2005) The global significance of respiration in aquatic
ecosystems: from single cells to the biosphere. In: Williams PJleB & del Giorgio
PA (eds) Respiration in Aquatic Ecosystems. Oxford University Press, New
York
del Giorgio PA, Pace ML, Fischer D (2006) Relationship of bacterial growth efficiency
to spatial variation in bacterial activity in the Hudson River. Aquat. Microb.
Ecol. 45:55-67
Chapter VI. Deep ocean’s prokaryotic growth yield
212
Ducklow H (2000) Bacterial production and biomass in the oceans. In: Kirchman DL
(ed) Microbial ecology of the oceans. Wiley-Liss, New York, p 85-120
Ducklow HW, Carlson CA, W. O. Smith J (1992) Bacterial growth in experimental
plankton assemblages and seawater cultures from Phaeocystis antartica bloom
in the Ross Sea. Aquat. Microb. Ecol. 19:215-227
Ducklow HW, Kirchman DL, Anderson TR (2002) The magnitude of spring bloom
bacterial production in the North Atlantic Ocean. Limnol. Oceanogr. 47:1684-
1693
Fukuda R, Ogawa H, Nagata T, Koike I (1998) Direct determination of carbon and
nitrogen contents of natural bacterial assemblages in marine environments.
Appl. Environ. Microbiol. 64:3352-3358
Gasol JM, Zweifel UL, Peters F, Fuhrman JA, Hagström Å (1999) Significance of size
and nucleic acid content heterogeneity as measured by flow cytometry in natural
the resident nsPOC) and prokaryotic carbon demand (PCD) to re-evaluate the apparent
discrepancy between prokaryotic organic matter demand and supply in the ocean’s
interior.
In contrast to the exponential decline in sinking POC with depth (Martin et al.
1987), the concentrations of nsPOC and nsPON remained fairly constant with depth
down to bathypelagic waters (4000m depth) of the (sub)tropical North Atlantic (Fig.
1A, B). Generally, the prokaryotic contribution to the nsPOC and nsPON decreases
with depth (Fig. 1C, D). Subtracting the prokaryotic contribution from the bulk nsPOC
and nsPON pool, we obtain the amount potentially available for heterotrophic
utilization of nsPOC (nsPOC_Av) and nsPON (nsPON_Av) (Fig. 1E, F). The amount of
nsPOC and nsPON potentially available did not exhibit a general depth-related trend
(Fig. 1E,F). The ratio nsPOC_Av : nsPON_Av was also fairly constant throughout the
water column suggesting that there are no major shifts in the C:N ratio of nsPOM in
deep-waters (Fig. 2), in contrast to the reported increasing C:N ratios with depth of
sedimenting POM and DOM (Schneider et al. 2003, Hopkinson & Vallino 2005). This
stability in the elemental composition of suspended POM, in combination with its fairly
constant concentration throughout the (sub)tropical North Atlantic water column
Discussion
224
Fig. 1. Average (± SE, n = 22 – 48) vertical distribution of (A) bulk non-sinking particulate organic carbon (nsPOC) and (B) nitrogen (nsPON), contribution of the prokaryotic biomass to the bulk nsPOC (C) and nsPON (D), and potentially available nsPOC (E) and nsPON (F) after subtracting the prokaryotic C- and N-biomass, respectively. All organic matter concentrations are in µmol l-1
suggests that it is either not utilized biotically or that its utilization by the deep-sea biota
is matched by in situ production of nsPOM.
Discussion
225
Prokaryotic respiration (R) is the main parameter affecting the prokaryotic
carbon demand (PCD) in the deep Atlantic, as it is typically 1-2 orders of magnitude
higher than prokaryotic heterotrophic production (Reinthaler et al. 2006, Chapter II).
Therefore, our PCD estimates greatly rely on the conversion of measurements of the
electron transport system (ETS) to R, i.e., the R:ETS ratio used. Our PCD estimates
were bracketed based on an R:ETS ratio of 0.086 and 0.6, derived from bacterial
cultures in senescent phase (Christensen et al. 1980) and active mesopelagic
prokaryotes of boundary regions (Arístegui et al. 2005b), respectively. The PCD
decreased by one order of magnitude from the base of the euphotic zone towards the
bathypelagic zone independent of the R:ETS ratio used (Table 1). The oxygen
utilization rates (OUR) reported for the North and South Atlantic (Jenkins 1982, Jenkins
& Wallace 1992, Brea 2008) are within the range of our PCD estimates (Table 1),
suggesting that our PCD estimates are realistic. Based on the PCD and the concentration
of nsPOC_Av, the turnover time (nsPOC_Av/PCD) of nsPOC_Av can be calculated.
The turnover time of the nsPOC_Av increases from near-surface (9 d and 34 d using an
R:ETS of 0.6 and 0.086, respectively) to bathypelagic waters (200 d and 1372 d) (Fig.
3A). In other terms, PCD potentially utilizes between 6-0.2% d–1 of the nsPOC_Av pool
in the 100 m and 4000 m layer, respectively (using an R:ETS of 0.086) and 34-6% d–1
(using an R:ETS of 0.6) (Fig. 3B). Even assuming the high R:ETS ratio (R:ETS = 0.6),
on average only 8 ± 3% of the present nsPOC_Av is used per day in the mesopelagic
realm (Fig. 3B). Hence, in order to maintain steady state concentrations of buoyant
nsPOC in the mesopelagic Atlantic waters, the loss of less than 8% in nsPOC daily
Fig. 2. Average (± SE, n = 20 – 46) vertical distribution of the ratio of potentially available nsPOC to nsPON in the core of the main water masses of the (sub)tropical NE Atlantic Ocean
Discussion
226
needs to be compensated. From where could this nsPOC pool be replenished in the
Dissolved inorganic carbon (DIC) fixation by chemoautotrophic microbes
occurs throughout the deep waters of the Atlantic (Herndl et al. 2005) amounting, on
average 12 ± 5 µmol C m-3 d-1 in the mesopelagic realm of the (sub)tropical North
Table 1. Comparison of the variation in the different depth layers of the prokaryotic carbon demand (PCD) assuming an R:ETS ratio of 0.086 and 0.6, oxygen utilization rates (OUR) reported for the North Atlantic Subtropical Gyre (OUR NAtl) (Jenkins 1982), and for the South Atlantic Subtropical Gyre (OUR SAtl) (Brea 2008), and dark DIC fixation rates (autotrophic production - AP). Metabolic rates in µmol C m-3 d-1
Fig. 3. Variation of (A) the mean (± SE, n= 18 – 39) turnover time of the potentially available suspended nsPOC (POC_Av) (in d) with depth (assuming a R:ETS ratio of 0.086 and 0.6), (B) the percentage of this nsPOC_Av required to meet the daily prokaryotic carbon demand (PCD) (using a conservative R:ETS of 0.6) and percentage of daily dark DIC fixation contributed to the POC_Av, and (C) the percentage of total PCD covered by dark CO2 fixation (autotrophic production-AP) and by sinking POC (assuming a conservative R:ETS of 0.6 and surface primary production of 50 mmol C m-2 d-1)
Discussion
227
Atlantic (Table 1). This freshly produced organic carbon represents a nsPOC source in
the meso- and bathypelagic waters, as microbial cells are too small to sediment. This
autochthonously produced nsPOC potentially accounts for 72% to 12% (assuming an
R:ETS of 0.086 and 0.6, respectively) of the required nsPOC to meet the daily
heterotrophic prokaryotic carbon demand in the (sub)tropical North Atlantic’s
Table 2. Potential contribution (in %) of dark CO2 fixation (AP) and of the available sinking POC to the PCD (assuming an R:ETS of 0.086 and 0.6). The contribution from the sinking POC was inferred from a POC flux model (Antia et al. 2001) assuming a surface primary production (PP) of 28 mmol C m-2 d-1 (NE Atlantic gyre (Longhurst et al. 1995)), 35 mmol C m-2 d-1 (western gyre (Steinberg et al. 2001)) and of 50 mmol C m-2 d-1 (N Atlantic (Longhurst et al. 1995))
Discussion
228
For comparison, the sinking POC flux based upon a model from a compilation
of sediment trap data of the North Atlantic (Antia et al. 2001) was used to estimate the
potential contribution of the sinking POC to nsPOC_Av. We calculated the sinking
POC using the surface primary production (PP) estimates from the NE Atlantic gyre
(Longhurst et al. 1995) (28 mmol C m-2 d-1), from the western gyre (Steinberg et al.
2001) (35 mmol C m-2 d-1) and as an upper limit 50 mmol C m-2 d-1 (for the entire North
Atlantic (Longhurst et al. 1995) including temperate regions where PP is higher). The
potential contribution of the sinking POC amounts to 4-6% to the PCD per day when
using a surface PP of 28 and 35 mmol C m-2 d-1, respectively (Table 2). Only when
using the unrealistically high surface PP of 50 mmol C m-2 d-1 for this (sub)tropical
mid-oceanic region, the contribution of the sinking POC to the mesopelagic PCD equals
the contribution (12%) from the dark CO2 fixation (Fig.3C, Table 2). Despite the rather
low DIC fixation rates in the bathypelagic realm, even in this layer the contribution of
the sinking POC to the PCD does not exceed the contribution derived from DIC fixation
(Fig. 3C, Table 2). Thus, a significant fraction (at least similar to the sinking POC
contribution) of the organic carbon required by the meso- and bathypelagic microbial
community could be supplied by chemoautotrophic CO2 fixation in the (sub)tropical
North Atlantic’s interior.
As shown previously, the major energy source for prokaryotic DIC fixation is
likely derived from ammonia oxidation by Crenarchaeota, as archaeal amoA genes are
by far more abundant than bacterial amoA genes in the mesopelagic realm of the North
Atlantic (Agogué et al. 2008). Based on the radiocarbon signature of archaeal lipids, it
has been shown recently that 83% of the archaeal carbon is derived by autotrophy in the
subtropical mesopelagic North Pacific (at 670 m depth) (Ingalls et al. 2006). The
radiocarbon signature of archaeal DNA collected from mesopelagic Pacific waters (670
– 915 m) allowed to differentiate between the three major carbon pools that are
potentially available to prokaryotes: fresh DOC released from POC (∆14C > +50‰),
ambient DIC (∆14C ~ -200 to -100 ‰), and aged bulk DOC (∆14C = -525‰) (Hansman
et al. 2009). These authors concluded that both DIC and fresh DOC (presumably
released from sinking POC) are utilized substantially, while ambient DOC is not a
major substrate for mesopelagic prokaryotes (Hansman et al. 2009). There is also
evidence of considerable chemolithotrophic production on sinking POC collected by
sediment traps deployed in the mesopelagic (100-750 m depth) North Pacific (Karl et al.
Discussion
229
1984). There, chemolithotrophic contribution ranged between 7-90% of the total
microbial production, again indicating the potential importance of chemolithotrophic
carbon production as a source of newly available carbon and energy in the mesopelagic
realm.
Taken together, the current perception on the dependence of the dark ocean’s
heterotrophic microbial activity on sedimenting POC and the resulting mismatch
between organic carbon supply and demand (Reinthaler et al. 2006, Steinberg et al.
2008, Burd et al. in press, Chapter II) needs revision. The large and fairly constant
stock of buoyant, nsPOC needs to be considered as a potentially available pool of POC
for heterotrophic deep-water microbes. We have shown that only a small proportion of
the available suspended nsPOC is required per day to sustain the carbon demands of
deep-ocean heterotrophic microbes. About 12-72% of the amount of nsPOC required by
microheterotrophs in the mesopelagic ocean is potentially supplied by deep-water
chemolithotrophs via DIC fixation. Therefore, the apparent gap between heterotrophic
organic matter demand and supply in the mesopelagic realm might be substantially
smaller than previously thought. Future research should focus on refining the nutritive
quality of buoyant nsPOC versus sedimenting POC and, on a more refined view of
chemolithoautotrophic production of non-sinking new organic carbon in the ocean’s
interior. The refined pathways of organic matter supply and demand in the dark ocean
might allow us to arrive at a mechanistic understanding of deep ocean food web
structure and activity and ultimately, should lead to improved models on the dark
ocean’s role in global carbon cycling.
Discussion
231
CONCLUSIONS
The main conclusions that arise from this thesis are:
1. A high variability in prokaryotic assemblage structure and activity exists in the
surface and deep waters along the NW Africa – Canary Islands Coastal
Transition Zone, suggesting a heterogeneous nature of the dark ocean.
a. There was a clear substitution of Bacteria (mainly SAR11) for Archaea
(mainly Crenarchaeota) along trophic gradients (offshore and in depth).
b. Different deep-water masses exert a key role in structuring the
prokaryotic metabolism. An example was found in the intermediate
water masses, with lower leucine incorporation rates in layers where
patches of Antarctic Intermediate Waters were detected.
2. A strong relation was found between the suspended particulate organic carbon
and the prokaryotic respiration in the dark realm of the (sub)tropical North
Atlantic. This finding, together with the strong imbalance between the
prokaryotic carbon demand and the sinking particulate organic carbon (POC)
flux, suggests: i) a “bottom up” control of the deep-ocean prokaryotic
metabolism by the suspended particulate organic matter pool, and ii) a
preferentially particle- attached life mode of dark-ocean prokaryotes.
3. An increase in the cell-specific extracellular enzymatic activity (EEA) was found
from the lower euphotic layer to the bathypelagic waters of the (sub)tropical
North Atlantic.
a. The increase in cell-specific EEA with depth was paralleled by an
increase in cell-specific respiration and a decrease in cell-specific leucine
incorporation. This finding, together with the increase in the half
saturation constant (Km) of the ectoenzymes and in the cell-specific Vmax
/ Km ratio, suggests an adaptation of the EEA to the refractory nature of
the dark-ocean organic matter.
Discussion
232
b. An increase with depth was found in the cell-specific alkaline-
phosphatase (APase) activity hence, not related to phosphate
availability in the dark ocean. In fact, APase seems to be utilized by
deep-water prokaryotes to access organic C moieties from organic
matter, rather than phosphate directly.
4. EEA exists mainly in dissolved form in the deep waters of the Central Atlantic
Ocean, where a relation was found between the EEA (dissolved and total
fractions) and prokaryotic heterotrophic production and the particulate organic
matter pool. These findings suggest again a preferential particle-attached life
style of dark-ocean prokaryotes.
5. Mesoscale island-induced eddies have a profound impact on the distribution and
function of prokaryotes in the ocean. However, even in these mesoscale features
characterized by higher productivity in the surface-water than outside the
eddies, the effect on the prokaryotes’ distribution and function was restricted to
the epi- and mesopelagic. This is probably due to the consumption of the major
part of sinking POC in the top 1000 m water column, suggesting a rapid
attenuation of the influence of the sinking POC on the bathypelagic microbes.
6. Like other metabolic parameters determined in this thesis, the prokaryotic growth
efficiency (PGE) and the empirically obtained leucine-to-carbon conversion
factor (LeuCF) showed a strong variability in the mesopelagic waters of the
Northeast Atlantic Ocean, exhibiting similar ranges to those reported for surface
waters of oligotrophic regions.
7. The suspended particulate organic carbon and the dark fixation of dissolved
inorganic carbon by deep-water prokaryotes can help to reduce the imbalance
between the organic carbon required by microbes and the supply of organic
matter to the dark ocean. Assuming a conservative high prokaryotic carbon
demand (using a R : ETS of 0.6), the consumption of less than 8% of the non-
sinking POC pool per day is required to meet the heterotrophic microbial carbon
demand in the mesopelagic waters. Our numbers also indicates that the
Discussion
233
mesopelagic dark fixation of dissolved inorganic carbon (DIC) can supply 12%
to 72% of this daily required organic carbon, whereas the sinking POC could
only account for 4-12%. Thus, the actual imbalance between organic carbon
supply and demand is not as strong as assumed hitherto due to the thus far
uncounted dark ocean’s autochthonous production of particulate organic matter.
Discussion
235
FUTURE RESEARCH
From the work reported in this thesis, there are several issues that need to be resolved in
the future regarding the dark-ocean microbial oceanography.
1. The main target should be the relation between particles and deep-water
prokaryotes. Several lines of evidence point towards a particle-attached life style
of prokaryotes (DeLong et al. 2006, Chapter II, Chapter IV). The recently
recognized abundance of gels in the oceans might allow spatially close
interaction between prokaryotes and the organic matter continuum. However,
with the currently available sampling techniques it is not possible to determine
the extent of this interaction due to the fragile nature of these dark-ocean
particles. New sampling techniques are needed to distinguish between really
free-living and the particle-associated microbes of the dark ocean.
2. Conversion factors are needed in order to better constrain the carbon fluxes
mediated by prokaryotes in the dark ocean. We have reported the first
prokaryotic growth efficiencies (PGE) calculated with empirically obtained
leucine-to-carbon conversion factor (LeuCF) for the dark ocean (Chapter VI).
Due to the high variability found in both parameters (PGE and LeuCF), and the
important role that the dark ocean plays in the global carbon fluxes, it is
imperative to greatly increase the number of determinations of the conversion
factor. Only then, we will be able to more accurately determine the prokaryotic
metabolism and thereby, better constrain the global carbon biogeochemical
cycle.
3. More efforts should also be directed to study the effect of hydrostatic pressure
on the metabolic rates of prokaryotes inhabiting the dark ocean, because
contradictory results have been reported thus far (Jannasch & Wirsen 1982,
Tamburini et al. 2002). This pressure effect should be accounted for not only in
the routine metabolic rate measurements but also in the determinations of the
conversion factors involved.
4. Although it was not the main topic of this thesis, more effort should also be
diverted to studying the microbial food webs of the dark ocean. There are very
Discussion
236
few reports concerning the consumption and lysis rates of prokaryotes by
heterotrophic nanoflagellates or viruses, respectively. It is very likely that the
interactions between the individual components of microbial food web and the
dark-ocean particulate and colloidal material are very different from those of
surface-water assemblages. These interactions are crucial to model the nutrient
and carbon cycling in the dark ocean.
5. A better budgeting of the sources and sinks of carbon in the dark ocean is
required to better understand the global carbon fluxes. Maybe some of the issues
raised in this section may help to close this gap (e.g. pressure effect on
metabolic rates, microbial life concentrated on particles, different conversion
factors, novel metabolic pathways,…). A more refined view of
chemolithoautotrophic production of non-sinking new organic carbon in the
ocean’s interior would be recommended. Anyway, it would certainly be a topic
of paramount importance to try to close the apparent imbalance between the
microbial carbon demand and the organic matter supply in the meso- and
bathypelagic realms.
6. A general increase in the database of the function and diversity parameters
should be achieved to allow for a refined view on the large-scale spatial trends
in the regulation of deep-water microbial processes. One option might be to
follow Longhurst’s model of biogeographical provinces, defining the different
compartments that form the dark ocean.
7. It should also be recommended to better link the recent advances in the
molecular approaches to actual fluxes measurements. Connecting diversity to
function, relating the genetic information with the deep-ocean biogeochemical
cycles. Finally, the developments in molecular techniques should also be used to
study the adaptations of several members of the community to the biotic (e.g.
mortality…) and abiotic (e.g. pressure, temperature, nutrients…) conditions of
the dark ocean.
Spanish summary / Resumen en español
237
SPANISH SUMMARY RESUMEN EN ESPAÑOL
Spanish summary / Resumen en español
239
INTRODUCCIÓN GENERAL
“Las bacterias representan la historia vital de mayor éxito del mundo. Ellas son hoy, y
han sido siempre los organismos más importantes en la Tierra; no pueden ser llevadas
al olvido y nos sobrevivirán a todos nosotros. Este es su momento, no la “era de los
mamíferos” como nuestros libros de textos proclaman de un modo chovinista. Pero el
precio que pagan por dicho éxito es una relegación permanente a un micromundo, y no
pueden conocer el gusto y el dolor de la conciencia. Vivimos en un universo de
compensaciones; la complejidad y la persistencia no trabajan bien como compañeras.”
Stephen Jay Gould, ”An Earful of Jaw”, Eight Little Piggies:
Reflections in Natural History (1993).
Papel de los procariotas en el ecosistema oceánico
Los procariotas juegan un papel clave en la ecología de los océanos, mediando la
mayoría de los ciclos biogeoquímicos, y actuando como un eslabón trófico básico a
través del bucle microbiano (Pomeroy 1974, Williams 1981, Azam et al. 1983). Ellos
son el principal grupo responsable de convertir la materia orgánica disuelta (MOD) a
materia orgánica particulada (MOP) viva; supliendo de este modo, con materia orgánica,
que sería inaccesible de otra forma, a los niveles tróficos superiores de la cadena
alimenticia. Este concepto de “bucle microbiano” ha sido redefinido durante las últimas
décadas (Azam 1998, Fuhrman 1999), incorporando entre otras, las ideas de que los
procariotas pueden competir con el fitoplancton eucariota por los nutrientes inorgánicos
(Obernosterer & Herndl 1995, Thingstad 2000), consumir la mitad o más de la
producción primaria (Ducklow 2000, Robinson 2008), sufrir lisis por mediación de virus
(Fuhrman 2000, Breitbart et al. 2008) y ser consumidos por protistas (Jurgens &
Massana 2008). Por ello, hoy en día se acepta que el bucle microbiano ejerce una
influencia primordial en la distribución de los flujos de carbono y nutrientes en el océano
(Nagata 2008). Dicha noción se ha basado en una serie de avances tecnológicos.
Spanish summary / Resumen en español
240
Inicialmente, el número de procariotas en los sistemas marinos estaba subestimado
severamente. Las primeras estimas de abundancia de procariotas se basaban en el
número de células capaces de crecer en placas de agar (e. g. Zobell 1946); una técnica
que, como fue luego demostrado, subestimaba la abundancia in situ de procariotas en
varios órdenes de magnitud (Jannasch & Jones 1959). En los años 70, después del
desarrollo de las técnicas de microscopía de fluorescencia, se encontró que la abundancia
de procariotas en las aguas superficiales rondaba los 105 - 106 ml-1 (Francisco et al. 1973,
Hobbie et al. 1977, Porter & Feig 1980). Esta discrepancia entre los resultados
obtenidos mediante el uso de placas y la microscopía fue posteriormente denominada
como la “Gran anomalía de contaje en placa” (Staley & Konopka 1985). Además, la
mayoría de los descubrimientos realizados concernientes al bucle microbiano fueron
efectuados usando una aproximación de “caja-negra”; esto es, sin tener en cuenta los
distintos grupos filogenéticos y funcionales que se encontraban en los componentes
individuales de la comunidad microbiana. Una vez más, el desarrollo de técnicas (en esta
ocasión de metodologías moleculares) a principio de los años 90 nos permitió empezar a
responder a preguntas como quién y dónde está haciendo el qué en el océano.
Debido a este papel fundamental que juegan los procariotas en el océano, siendo
responsables de hasta >90% de la respiración comunitaria (Robinson & Williams 2005),
la estimación de sus actividades metabólicas se tornan como un imperativo básico si
queremos estudiar los flujos de carbono. De hecho, la cantidad de carbono orgánico final
que fluye a través de los procariotas hacia niveles tróficos superiores y/o la
concentración de carbono respirada en el océano dependerá en gran medida de la
eficiencia de crecimiento procariota (ECP) — la proporción de carbono orgánico
incorporado como biomasa (producción) comparada con la incorporación total de
carbono (producción más respiración) (Carlson et al. 2007). Sin embargo, obtener las
tasas metabólicas involucradas en la estimación de la ECP no es tarea simple. Debido a
las dificultades relacionadas con la medida de la respiración procariota (RP), la ECP es
calculada frecuentemente midiendo la producción heterotrófica procariota (PHP) a
través de la incorporación de leucina o timidina aplicando un factor de conversión
obtenido empíricamente para convertir la incorporación de leucina o timidina a
producción de carbono (del Giorgio & Cole 1998). Sin embargo, este factor de
Spanish summary / Resumen en español
241
conversión (LeuFC) de leucina a carbono no es constante, pudiendo variar hasta en un
orden de magnitud dentro de un mismo sistema (e. g. Sherry et al. 2002, Alonso-Sáez et
al. 2007). Consecuentemente, se suele recomendar estimar empíricamente los LeuFCs
para una mejor cuantificación de los flujos de carbono (Bell 1990, Pulido-Villena &
Para poder comprender plenamente los ciclos biogeoquímicos del carbono en el
océano, es crucial tener en cuenta todo el rango de profundidades donde se lleven a
cabo procesos metabólicos. Sin embargo, aunque recientemente el papel potencial de
los procariotas del océano profundo para metabolizar substratos orgánicos se ha venido
aceptando, así como la importancia de estimar las ECP para los estudios de flujos de
carbono, sólo existen unos pocos estudios que hayan medido las ECP y los LeuFC del
océano oscuro. Se ha encontrado que la respiración de aminoácidos marcados
incrementa en profundidad, donde las ECP se piensan que son menores que en las aguas
superficiales. Como la respiración de leucina ha sido relacionado con bajos LeuFC
(Alonso-Sáez et al. 2007), puede ser postulado que la producción heterotrófica
Spanish summary / Resumen en español
268
procariota debe de presentar bajos LeuFC. Aunque la importancia de determinar
empíricamente los LeuFC para una estimación precisa de la ECP se encuentra
comúnmente aceptada, sólo hay disponible un estudio (Gasol et al. 2009) para el océano
profundo donde se hayan estimados los LeuFC (5 estimas para aguas mesopelágicas,
pero no se calcularon las ECP). Debido a ello, la influencia de los LeuFC sobre la ECP
sigue siendo desconocida para el océano oscuro, donde tiene lugar una parte substancial
del procesado de carbono orgánico.
Se realizaron experimentos en la zona mesopelágica del Océano Atlántico
Nordeste subtropical con el objetivo de determinar la variabilidad de los factores de
conversión de leucina a carbono y de la eficiencia de crecimiento procariota. El modo
en que la producción heterotrófica procariota (PHP) fue calculada tenía una influencia
directa sobre la ECP (se encontraron variaciones de ECP de entre 1-31% para una
misma muestra). Los LeuFC empíricamente obtenidos para aguas profundas mostraron
una variabilidad de hasta 7 veces en magnitud (entre 0.13-0.85 kg C mol-1 Leu), siendo
siempre menor que el LeuFC teórico de 1.55 kg C mol-1 Leu asumiendo que no existía
dilución isotópica. Las LeuFC determinados empíricamente estaban altamente
correlacionados con la ECP, sugiriendo que ambos parámetros son representaciones de
los mismos procesos metabólicos básicos. En resumen, las ECP obtenidas en este
estudio indican que la comunidad procariota mesopelágica puede ser igual de
importante en el procesamiento de carbono que los procariotas epipelágicos, al menos
en alguna regiones.
Spanish summary / Resumen en español
269
SÍNTESIS DE RESULTADOS Y DISCUSIÓN GENERAL
Estructura de la comunidad y actividad de los procariotas del océano oscuro:
¿distribución homogénea o heterogénea?
Debido a la poca disponibilidad de materia orgánica lábil, y a las condiciones
abióticas (temperatura, salinidad, pH, concentración de oxígeno,…) típicamente más
estables en el océano oscuro que en las aguas superficiales, es razonable inferir que la
estructura de la comunidad procariota y la actividad asociada a ella debería de seguir
una distribución más o menos homogénea a lo largo de las aguas profundas. Además, la
baja temperatura y concentración de materia orgánica características del océano
profundo pueden también llevar a la percepción del océano profundo como un lugar
donde la actividad biológica es prácticamente despreciable. Sin embargo, se
encontraron diferencias horizontales (laterales) y verticales (en profundidad) en la
actividad de los procariotas (Capítulos I, II, III, IV, V, VI) y en la estructura de la
comunidad (Capítulos I y V) en el océano oscuro. Una interesante sustitución lateral de
Bacterias por Archaeas fue encontrada en las aguas epi- y mesopelágicas de la zona
costera de transición del NO África-Canarias (Capítulo I). También se encontraron
fuertes diferencias en la abundancia de procariotas (AP), en la producción heterotrófica
de procariotas (PHP) y en el porcentaje de células con alto contenido en ácido nucleicos
a lo largo de ese gradiente trófico (Capítulo I). Estas variaciones estaban relacionadas
con la presencia de distintas masas de agua, reflejando una probable influencia de la
variación de los reservorios de materia orgánica sobre la estructura de la comunidad de
los procariotas y su correspondiente actividad. Dicha hipótesis se confirmó
posteriormente al encontrarse una correlación significativa entre el carbono orgánico
particulado suspendido y la respiración procariota a lo largo de un gradiente latitudinal
en las zonas meso- y batipelágicas del Atlántico Norte (sub)tropical (Capítulo II). La
relación existente entre la actividad de los procariotas y la distribución de materia
orgánica quedó aún más patente por las correlaciones significativas encontradas entre la
actividad enzimática extracelular (tanto la fracción disuelta como la particulada), la
PHP, y la concentración de COP suspendido en las aguas profundas del Océano
Atlántico Central (Capítulo IV). Además, la distribución de la actividad enzimática
Spanish summary / Resumen en español
270
extracelular (AEE) estaba asimismo afectada por cambios en la composición de la
materia orgánica (MO) en profundidad (Capítulo III), también de acuerdo con un
hipotético control “bottom-up” de la actividad procariota por la distribución de la MO.
De hecho, el incremento en profundidad de la AAE por célula, de la constante de
semisaturación (Km) y del ratio Vmax/Km apunta hacia una adaptación a la menor
disponibilidad de materia orgánica lábil que existe al aumentar la profundidad. Esta
conclusión concuerda con las mayores tasas de respiración de aminoácidos encontradas
en las aguas profundas (Carlucci et al. 1986), y con el incremento en el ratio de
incorporación de D-/-L aminoácidos por parte de la comunidad procariota (Pérez et al.
2003). Usando genómica ambiental comparativa, DeLong et al. (2006) también halló
una alta abundancia de genes responsable del metabolismo del glioxilato y
dicarboxilato, que corresponde con la MOD relativamente más oxidada y degrada
presente en el océano profundo al compararla con las aguas superficiales (Benner 2002).
Igualmente está de acuerdo con la primera secuencia genómica obtenida de un
psicropiezófilo (microbio adaptado a vivir a bajas temperaturas y alta presión) del
océano profundo (Photobacterium profundum SS9) (Vezzi et al. 2005, Bartlett et al.
2007, 2008), donde una vía para la fermentación de aminoácidos, que previamente sólo
se conocía en anaerobios estrictos (la reacción de Strickland), junto con un sistema
enzimático similar a los que se utilizan para utilizar varios polímeros complejos
(incluyendo xenobióticos, quitina y celulosa), fueron encontrados. Todos estos
descubrimientos implican una adaptación de los microbios del mar profundo para
utilizar un carbono orgánico más recalcitrante (Carlson et al. 2004). Sin embargo, esta
adaptación a las diferencias en la “calidad” de la materia orgánica a través de la
producción de enzimas extracelulares lleva consigo una disminución en la eficiencia de
crecimiento de los procariotas comparada con la de aguas superficiales. Esta relación
inversa entre la AEE y la eficiencia de crecimiento es similar a la situación que tiene
lugar en los países subdesarrollados al compararlos con los desarrollados. En las
naciones desarrolladas (i. e. aguas superficiales) la energía metabólica (caminar, correr,
trabajar,…) requerida para obtener alimento no es mucha porque es sencillo encontrar
comida en numerosos lugares (tiendas, restaurantes,…). Debido a ello, en estos países
es más sencillo incrementar la biomasa (algo que queda reflejado por el alto índice de
masa corporal que presentan dichas poblaciones). Sin embargo, en los países
subdesarrollados (i. e. océano oscuro), la energía metabólica necesaria para obtener la
misma cantidad de alimento que en los países desarrollados es mucho mayor (se
Spanish summary / Resumen en español
271
requieren más horas de trabajos por unidad de comida obtenida). Esto provoca una
mayor tasa de respiración por unidad de alimento ingerida, y consecuentemente, una
mayor dificultad para que se produzca un incremento en biomasa. Equivalentemente, la
energía metabólica requerida por los procariotas heterotróficos para metabolizar la
materia orgánica menos refractaria típica del océano profundo se relaciona con una
menor eficiencia de crecimiento de los procariotas.
Otras evidencias recientes apuntan también hacia una comunidad de procariotas
activa y heterogéneamente distribuida en el océano oscuro. Algunos estudios han
mostrado también una estacionalidad en la abundancia de procariotas en el océano
oscuro. Nagata et al. (2002) encontraron como la abundancia procariota se doblaba en
una estación que fue muestreada dos veces a lo largo de varios años en las aguas
profundas del Pacífico. En la capa mesopelágica del Mar Mediterráneo, Tanaka &
Rassoulzadegan (2002, 2004) hallaron unos cambios estacionales relativamente
importantes. Sherry et al. (1999) encontraron un incremento de cinco veces en la
variación de PHP en Pacífico NE. Church et al. (2003) detectaron una mayor proporción
de células en profundidad que cerca de la superficie mediante hibridación in situ
fluorescente, asumiendo que correspondía con un alto contenido de rRNA. Arístegui et
al. (2005b) obtuvo una proporción muy similar de células con actividad respiratoria, y
una mayor respiración por células en la capa mesopelágica que en la epipelágica del
Atlántico NO. En la misma región (zona costera de transición del NO de África–Islas
Canarias), Gasol et al. (2009) encontró que la relación entre los procariotas y sus
principales depredadores (nanoflagelados heterotróficos) permanecía constante en
profundidad, lo que contradice la idea de que los procariotas del océano profundo se
encuentran generalmente inactivos. Además, Teira et al. (2006) indicó que el 16-20% de
la comunidad heterotrófica procariota de las aguas profundas del Atlántic Norte se
encuentran activos desde un punto de vista metabólico incorporando leucina. Dicho
porcentaje es similar al que del Giorgio & Gasol (2008) sugirieron para las aguas
epipelágicas. Hewson et al. (2006) halló una variabilidad considerable en la
composición bacteriana entre estaciones adyacentes de aguas profundas. Estos últimos
autores justificaron sus descubrimientos como resultado de hundimientos episódicos de
materia orgánica proveniente de aguas superficiales.
Spanish summary / Resumen en español
272
Nosotros también hemos mostrado como la presencia de remolinos generados
por islas (probablemente bombeando materia orgánica hacia el océano oscuro) producen
un incremento en la abundancia de procariotas y en su actividad en la zona
mesopelágica, pero no en la batipelágica (Capítulo V). Asimismo, otro descubrimiento
interesante relacionado con la distribución heterogénea de la actividad de los procariotas
en profundidad fue la presencia de picos mesopelágicos de AP y de actividades totales y
normalizadas por células (Capítulo V). La presencia de picos en la capa mesopelágica
ha sido referenciada con anterioridad asociada a discontinuidades entre masas de agua
(Sorokin 1971, Karl 1980, Carlucci et al. 1987) o causadas por aportes laterales de
carbono orgánico (Nagata 2000). Como se ha observado para la AP, también se han
encontrado picos de producción heterotrófica en frentes de densidad (Sorokin 1973).
Karl (1980) describió un mayor actividad sobre los 500-600 m de profundidad que en
las aguas circundantes.
En resumen, podemos concluir que el océano oscuro no es ni mucho menos un
ecosistema homogéneo e inactivo. La heterogeneidad dominante parece ser controlada
por un efecto “bottom-up”, donde la distribución de la materia orgánica (concretamente
del carbono orgánico particulado suspendido) modula la actividad de los procariotas.
Globalmente, el océano oscuro juega un papel clave en los procesos de mineralización
de carbono, con tasas por célula igual de altas o mayores que las que se dan en las aguas
epipelágicas. Mayores AEE específicas han sido encontradas en el océano oscuro que
en las aguas superficiales (Capítulos III y IV), y un rango de factores de conversión
empíricos de leucina a carbono y de eficiencias de crecimiento mesopelágicos
comparables con los que se dan en aguas superficiales han sido descubiertos (Capítulo
VI).
Preferencia de los procariotas del océano oscuro a vivir adheridos a partículas
Generalmente se asume que sólo menos del 5% de los procariotas viven
asociados con partículas que se hunden o suspendidas en el océano oscuro (Cho &
Azam 1988, Turley & Mackie 1994). Sin embargo, una relación significativa fue
encontrada entre el COP suspendido y la respiración a lo largo de un transecto de larga
Spanish summary / Resumen en español
273
distancia en el Atlántico Norte batipelágico (Capítulo II), lo que sugiere un fuerte
vínculo entre el metabolismo de los procariotas y las partículas. Asimismo, una
proporción muy alta de AEE disuelta se encontraba presente en el Atlántico Central
(Capítulo IV). Igualmente, se encontraron relaciones significativas entre la AEE
disuelta y la fracción total de AEE con la materia orgánica particulada suspendida y la
producción heterotrófica de procariotas, sugiriendo también un fuerte link entre
metabolismo de los procariotas y la materia orgánica suspendida en el océano oscuro.
Como se explicó en el Capítulo IV, la alta proporción de AAE libre con respecto a la
total puede ser interpretada como un indicador de un modo de vida de los procariotas
relacionados con partículas, teniendo en cuenta las nociones previas que demuestran
como la fracción de AEE disueltas es mayor en microbios que viven pegados a
partículas que en los que viven de forma libre. Por ello, teniendo en mente la fuerte
relación encontrada entre el COP suspendido y el metabolismo de los procariotas,
sugerimos que el verdadero porcentaje de procariotas adheridos puede haber sido
considerablemente subestimado en anteriores investigaciones del océano profundo.
Dicha subestimación puede ser debida a una naturaleza muy frágil de un proporción
significativa de las partículas batipelágicas, pudiendo verse alteradas durante el
muestreo. Por ejemplo, los geles son componentes abundantes e importantes dentro de
los agregados que se encuentran a lo largo de la columna de agua (Verdugo et al. 2004,
2008), distribuyéndose sobre una largo espectro de tamaños, desde coloides hasta nieve
marina, y convirtiendo MOD a MOP a través del auto-ensamblaje de polímeros. Debido
a ello, el auto-ensamblaje de microgeles puede ser un mecanismo clave en la generación
de agregados en la zona batipelágica. Sin embargo, la desagregación de estos geles
puede ocurrir fácilmente durante el muestreo. En cualquier caso, la fuerte relación
encontrada entre la materia orgánica particulada suspendida y el metabolismo de los
procariotas en el océano oscuro indica una mayor asociación entre las partículas
suspendidas y los procariotas de lo que se asumía hasta ahora.
Conjuntamente con las asociaciones que hemos encontrado in situ, existen otras
evidencias genómicas recientes que también apuntan hacia un modo de vida
preferentemente pegado a partículas para los procariotas del océano profundo (DeLong
et al. 2006, Martín-Cuadrado et al. 2007, Ivars-Martínez et al. 2008). En el giro
subtropical del Pacífico Norte, DeLong et al. (2006) encontraron que los procariotas de
aguas profundas estaban enriquecidos en genes relacionados con la síntesis de
Spanish summary / Resumen en español
274
polisacáridos y antibióticos, indicando un papel potencialmente mayor de lo que
presumía hasta la fecha del estilo de vida adherido a partículas para los procariotas del
océano profundo. También en el Mar Mediterráneo, Martín-Cuadrado et al. (2007)
hallaron una alta abundancia de genes que codificaban transportadores de dipéptidos y
oligopéptidos y aminoácidos en cadena, indicando que las proteínas (potencialmente
asociadas con la nieve marina y con las partículas coloidales) son importantes fuentes
de carbono para los procariotas batipelágicos. Ivars-Martínez et al. (2008) encontraron
diferencias en la estructura genómica de dos distintos ecotipos (uno típico de las aguas
superficiales y el otro habitual de aguas profundas) de la común gammaproteobacteria
Alteromonas macleodii. Estos últimos autores descubrieron que el ecotipo de aguas
superficiales tenía un mayor potencial para la utilización de azúcares y aminoácidos,
mientras que el ecotipo de aguas profundas albergaba genes que reflejaban una vida
bajo condiciones microaerofílicas, y para la adsorción a partículas. En resumen, todos
estos estudios (meta)genómicos indican también que la vida microbiana en las capas
meso- y batipelágicas se encuentra más agrupada alrededor de partículas de lo que se
pensaba hasta hace poco tiempo.
Teniendo en cuenta la baja reactividad de la MOD de las aguas profundas, los
procariotas pueden preferir vivir adheridos a partículas, donde las fuentes de carbono y
energía se encuentran más disponibles que en las aguas circundantes. De esta manera, el
hecho de vivir en estos “oasis” en medio del gran desierto oceánico de MO disuelta
refractaria puede facilitar interacciones sinérgicas en el ciclo de materia del océano
oscuro. Por ello, es posible concluir apuntando que la naturaleza heterogénea de los
microbios de las aguas profundas y sus consecuentes actividades parecen estar
controladas por la presencia y heterogeneidad de la distribución de materia coloidal y
particulada. Aunque las implicaciones potenciales de dichas micro-zonas han sido
mencionadas con anterioridad, la mayoría de las medidas no tienen en cuentan la
distribución potencialmente no aleatoria de los procariotas en la columna de agua
oceánica (Azam & Malfatti 2007). Debido a ello, es necesario el desarrollo de nuevas
técnicas de muestreo con el objetivo de lidiar con la naturaleza frágil de la materia
detrítica batipelágica y con la aparente distribución no azarosa de los procariotas del
océano oscuro.
Spanish summary / Resumen en español
275
Importancia del carbono orgánico particulado suspendido y de la fijación de CO2
para la demanda de carbono heterotrófica en el Atlántico mesopelágico
Generalmente se acepta que la cadena trófica heterotrófica de las aguas
profundas depende de la materia orgánica (MO) generada por la producción primaria en
las aguas superficiales (donde hay luz suficiente para poder realizar la fotosíntesis). En
conjunto, alrededor del 30% de la producción primaria de las aguas superficiales se
exporta al océano oscuro en forma de partículas que se hunden (Arístegui et al. 2005a,
Buesseler & Boyd 2009). Aunque la concentración de carbono orgánico disuelto (COD)
es generalmente 10 veces mayor que la del carbono orgánico particulado (COP), el
reservorio de COD sólo puede explicar alrededor del 10% de la utilización aparente de
oxígeno en las aguas mesopelágicas (Arístegui et al. 2002). Debido a ello, se considera
al hundimiento pasivo de partículas originadas en la zona eufótica como la fuente
principal de carbono orgánico disponible para red trófica heterotrófica del océano
interior (Buesseler et al. 2007). La mayoría del COP exportado desde la zona eufótica se
remineraliza en la capa mesopelágica (entre los 100-1000 m de profundidad),
conllevando una típica atenuación exponencial en profundidad en la concentración de
COP que se hunde (Martin et al. 1987). Se ha observado una correlación entre la
actividad microbiana de las aguas profundas y en flujo de COP que se hunde en el
Pacífico subártico (Nagata et al. 2000). Asimismo, en el sector Atlántico del Océano
Sur, la producción procariota en las aguas mesopelágicas se correlaciona con la
producción primaria y con la concentración de clorofila superficial (Simon et al. 2004).
En el Mar Arábico, la abundancia de procariotas, y no la actividad, se relacionó con el
flujo de COP que se hunde, indicando que la abundancia procariota del océano
profundo no refleja el flujo más reciente de COP pero que, en cambio, es un indicador
del promedio a larga escala temporal del flujo de COP (Hansell & Ducklow 2003).
Asumiendo una conservación de masas, la tasa de aporte de carbono orgánico
(generalmente calculada como el COP que se hunde y se colecta con trampas de
sedimento) que alcanza el océano interior debería de coincidir con la demanda de
carbono de la biota heterotrófica que habita las capas meso- y batipelágicas. La biota de
aguas profundas está fundamentalmente dominada por procariotas, tanto en términos de
abundancia como de biomasa. Sin embargo, se ha demostrado continuamente como la
demanda de carbono orgánico de los procariotas (calculada como la producción más la
Spanish summary / Resumen en español
276
respiración) excede el flujo de COP que llega al océano oscuro (Burd et al. en prensa).
Estimas recientes muestran un desacople de entre 2-3 órdenes de magnitud entre la
demanda de carbono de los procariotas (DCP) y el flujo de COP que se hunde
(Reinthaler et al. 2006, Steinberg et al. 2008, Capítulo II). Además, en un ejercicio de
balances globales, del Giorgio & Duarte (2002) indicaron que incluso la mayor estima
posible del flujo de COP que se hunde desde las aguas superficiales explicaría
solamente alrededor de un 50% del consumo de oxígeno medido en el océano oscuro.
Se ha visto como este paradójico desequilibrio varía también espacialmente. La DCP
fue entre 3-4 veces y alrededor de 10 veces mayor que el flujo de COP que se hunde en
el Pacífico subtropical y en el subártico respectivamente (Steinberg et al. 2008). Este
substancial desajuste entre el aporte de COP y la demanda representa uno de los
mayores retos de la oceanografía biológica y de la biogeoquímica marina
contemporáneas, e indica un vacío central en nuestro entendimiento del flujo de carbono
del océano profundo. Parece ser lógico que algún componente primordial o aspecto de
los reservorios y flujos de carbono orgánico no ha sido atendido de manera adecuada.
Uno de los principales reservorios de COP en el océano interior que no se ha
tenido en cuenta apropiadamente en los balances de carbono orgánicos oceánicos ha
sido el COP suspendido, el que no se hunde (COPs). Dicho COPs se colecta con
botellas oceanográficas pero, debido a su tendencia a flotar, no se acumula en las
trampas de sedimento utilizadas para determinar el flujo de COP que se hunde
(Arístegui et al. 2009). En esta sección utilizamos datos recogidos de las zonas meso- y
batipelágicas del Atlántico Norte correspondientes a flujos de materia orgánica
particulada (MOP) sedimentaria, pools de MOP (incluyendo el COPs residente) y a
demandas de carbono de procariotas (DCP) para reevaluar la aparente discrepancia
existente entre la demanda de materia orgánica procariota y el aporte al océano interior.
En contraste con la disminución exponencial típica del COP en profundidad
(Martin et al. 1987), la concentración de COPs y de NOPs permaneció prácticamente
constante en profundidad hasta las aguas batipelágicas (4000 m de profundidad) del
Atlántico Norte (sub)tropical (Fig. 1A, B). Habitualmente, la contribución de los
procariotas al COPs y al NOPs disminuye en profundidad (Fig. 1C, D). Restando la
contribución de los procariotas a los reservorios de COPs y NOPs obtenemos la
cantidad de COPs (COPs_Dp) y NOPs (NOPs_Dp) que se encuentra potencialmente
disponible para una utilización heterotrófica (Fig. 1E, F).
Spanish summary / Resumen en español
277
Fig. 1. Promedios (± ES, n = 22 – 48) de la distribución vertical de (A) el carbono orgánico particulado suspendido (COPs) (B) el nitrogeno orgánico particulado suspendido (NOPs), la contribución de la biomasa de procariotas al total de COPs (C) y NOPs (D), y el potencialmente disponible COPs (E) y NOPs (F) después de restarles la biomasa de C y N de los procariotas respectivamente. Todas las concentraciones de materia orgánica se encuentran en µmol l-1
COPs (µmol C l-1)
% C de biomasa procariota al total de COP % N de biomasa procariota al total de NOP
COPs potencialmente disponible (COPs total – C de biomasa procariota)
(µmol C l-1)
NOPs potencialmente disponible (NOPs total – N de biomasa procariota)
(µmol N l-1)
NOPs (µmol N l-1)
Prof
undi
dad
(m)
Prof
undi
dad
(m)
Prof
undi
dad
(m)
Spanish summary / Resumen en español
278
Las cantidades de COPs_Dp y de NOPs_Dp no mostraron una tendencia de
disminución con la profundidad (Fig. 1E, F). El ratio COPs_Dp : NOPs_Dp se mantuvo
prácticamente constante a través de la columna de agua, evidenciando que no existían
cambios drásticos en los ratio C : N de la MOPs en las aguas profundas (Fig. 2), en
contraste con el incremento del ratio C : N en profundidad que se ha encontrado en la
MOP y MOD que se hunde (Schneider et al. 2003, Hopkinson & Vallino 2005). Esta
estabilidad en la composición elemental de la MOP suspendida (MOPs), junto con su
distribución prácticamente constante a través de la columna de agua del Atlántico Norte
(sub)tropical indican que o no se utiliza de forma biótica o que su utilización por parte
de la biota del mar profundo se acopla con una producción in situ de MOPs.
Fig. 2. Promedio (± ES, n = 20 – 46) de la distribución vertical del ratio entre el COPs y el NOPs potencialmente disponibles en los núcleos de las principales masas de agua del Océano Atlántico Norte (sub)tropical
COPs_Dp : NOPs_Dp
Prof
undi
dad
(m)
Spanish summary / Resumen en español
279
La respiración de los procariotas (R) es el parámetro fundamental que afecta a la
demanda de carbono procariota (DCP) en el Atlántico profundo. Esto se debe a que la R
es típicamente entre 1-2 órdenes de magnitud mayor que la producción heterotrófica de
los procariotas (Reinthaler et al, 2006, Capítulo II). Debido a ello, nuestras
estimaciones de la DCP dependen en gran medida del factor de conversión empleado
para la conversión de la actividad del sistema de transporte de electrones (ETS) a R; i. e.
el ratio R : ETS utilizados. Nuestras estimas de DCP han sido calculadas incluyendo un
rango de ratios R : ETS que van desde 0.086 a 0.6; obtenidos a partir de cultivos de
bacterias en fase senescente (Christensen et al. 1980) y de procariotas activos de la capa
mesopelágica de regiones de borde (Arístegui et al. 2005b) respectivamente. La DCP
disminuyó en un orden de magnitud desde la base de la zona eufótica hasta la zona
batipelágica independientemente del ratio R : ETS utilizado (Tabla 1). La utilización
aparente de oxígeno (UAO) calculada para el Atlántico Norte y el Sur (Jenkins 1982,
Jenkins & Wallace 1992, Brea 2008) se encuentran dentro del rango de nuestras estimas
de DCP (Tabla 1), sugiriendo que nuestras estimaciones de DCP son realistas. El
tiempo de renovación (COPs_Dp / DCP) del COPs_Dp puede ser calculado a partir de
la DCP y de la concentración de COPs_Dp. El tiempo de renovación del COPs_Dp
aumenta desde las aguas superficiales (9 d a 34 d usando un R : ETS de 0.6 y 0.086
respectivamente) a las aguas batipelágicas (200 d a 1372 d ) (Fig. 3A). O lo que es lo
mismo, la DCP potencialmente utiliza entre un 6-0.2% d-1 del reservorio de COPs_Dp a
100 m y a 4000 m de profundidad respectivamente (usando un R : ETS de 0.086) y un
34-6% d-1 (usando un R : ETS de 0.6) (Fig. 3B). Incluso si asumimos un R : ETS alto
(R : ETS = 0.6), solamente se requeriría por día un promedio del 8 ± 3% del COPs_Dp
presente en la capa mesopelágica. Por lo que para mantener en equilibrio la
concentración de COPs en las aguas mesopelágicas del Atlántico, una pérdida de menos
del 8% del COPs diario debe ser compensada. Pero, ¿de dónde puede provenir está
renovación de COPs en las aguas mesopelágicas?.
Los microbios quimioautotróficos realizan una fijación de carbono inorgánico
disuelto (CID) a lo largo de todas las aguas profundas del Atlántico (Herndl et al. 2005),
contribuyendo con un promedio de 12 ± 5 µmol C m-3 d-1 en la capa mesopelágica del
Atlántico (sub)tropical (Tabla 1). Esta materia orgánica recientemente producida
representa una fuente de COPs en las aguas meso- y batipelágicas, debido a que las
células microbianas son demasiado pequeñas para sedimentar. Dicho COPs producido
Spanish summary / Resumen en español
280
autóctonamente proporciona potencialmente entre un 72% a un 12% (asumiendo un R :
ETS de 0.086 y de 0.6 respectivamente) del COPs requerido diariamente para suplir la
demanda de carbono heterotrófica de los procariotas de la zona mesopelágica del
Por otro lado, se ha calculado el flujo de COP que se hunde basándonos en un
modelo que recopilaba un gran número de datos de trampas de sedimentos del Atlántico
Norte (Antia et al. 2001) para estimar la contribución potencial del COP que se hunde y
compararlos con la del COPs_Dp. Calculamos el COP que se hunde utilizando las
estimas de producción primaria (PP) del giro del Atlántico NE (Longhurst et al. 1995)
(28 mmol C m-2 d-1), del giro occidental (Steinberg et al. 2001) (35 mmol C m-2 d-1) y
usando un límite superior de 50 mmol C m-2 d-1 (obtenido para todo el Atlántico Norte
(Longhurst et al. 1995) incluyendo las regiones templadas donde la PP es mayor). La
contribución potencial del COP que se hunde contribuye alrededor de un 4-6% de la
DCP diaria cuando se asume una PP de 28 y de 35 mmol C m-2 d-1 respectivamente
(Tabla 2). Sólo cuando se utiliza una PP superficial claramente irreal para esta región
centro-oceánica (sub)tropical de 50 mmol C m-2 d-1, la contribución del COP que se
hunde a la DCP se iguala (12%) a la de la fijación oscura de CO2 (Fig. 3C, Tabla 2).
Aunque en la capa batipelágica las tasa de fijación de CID son bajas, incluso en esta
zona la contribución del COP que se hunde a la DCP no excede la contribución
Tabla 1. Comparación de la variación en las distintas profundidades de la demanda de carbono procariota (DCP) asumiendo un R : ETS de 0.086 y de 0.6 respectivamente, de la utilización aparente de oxígeno (UAO) reportadas para el giro subtropical del Atlántico Norte (UAO AtlN) (Jenkins 1982), y para el giro subtropical del Atlántico Sur (UAO AtlS) (Brea 2008), y de las tasas de fijación de CID (producción autotrófica de procariotas – PAP). Todas las tasas metabólicas de encuentran en in µmol C m-3 d-1
Spanish summary / Resumen en español
281
proveniente de la fijación de CID (Fig. 3C, Tabla 2). Por lo que, una fracción
significativa (al menos similar a la procedente del COP que se hunde) del carbono
orgánico requerido por la comunidad microbiana de las zonas meso- y batipelágicas
puede ser suministrada por la fijación quimioutotrófica de CO2 en el interior del
Atlántico Norte (sub)tropical.
Fig. 3. Variación del (A) tiempo de renovación medio (± ES, n= 18 – 39) del COPs potencialmente disponible (COPs_Dp) en profundidad (asumiendo un R : ETS de 0.086 y de 0.6), (B) porcentaje de este COPs_Dp requerido para suplir la demanda de carbono procariota (DCP) diaria (asumiendo un R : ETS de 0.6), y (C) porcentaje de la DCP total cubierta por la fijación oscura de CO2 (producción autotrófica de procariotas – PAP) y del COP que se hunde (asumiendo un R : ETS conservador de 0.6 y una producción primaria superficial de 50 mmol C m-2 d-1)
Tiempo de renovación del COPs_Dp (R:ETS 0.086) (d)
Tiempo de renovación del COPs_Dp (R:ETS 0.6) (d)
% COPs_Dp suministrado por la fijación de CO2
% COPs_Dp requerida por la DCP (R:ETS 0.6)
% DCP (R:ETS 0.6) procedente de la PAP
% DCP (R:ETS 0.6) procedente del COP que se hunde (PP = 50)
Prof
undi
dad
(m)
Prof
undi
dad
(m)
Prof
undi
dad
(m)
Spanish summary / Resumen en español
282
% contribución a la DCP asumiendo un R : ETS = 0.086
Promedio mesopelágico 72 25 37 70 Promedio batipelágico 6 3 4 7 Ratio mesopelágico entre PAP : COP que se hunde 2.8 1.9 1.0 Ratio batipelágico entre PAP : COP que se hunde 2.4 1.6 0.9 % contribución a la DCP asumiendo un R : ETS = 0.6
Promedio mesopelágico 12 4 6 12 Promedio batipelágico 1 0 1 1 Ratio mesopelágico entre PAP : COP que se hunde 2.8 1.9 1.0 Ratio batipelágico entre PAP : COP que se hunde 2.4 1.6 0.9
Tabla 2. Contribución potencial (en %) de la fijación oscura de CO2 (APA) y del COP que se hunde disponible a la DCP (asumiendo un R : ETS de 0.086 y de 0.6). La contribución procedente del POC que se hunde fue estimada a partir de un modelo del flujo de COP (Antia et al. 2001) asumiendo unas producciones primarias superficiales (PP) de 28 mmol C m-2 d-1 (giro subtropical del Atlántico NE (Longhurst et al. 1995)), de 35 mmol C m-2 d-1 (giro occidental del Atlántico N (Steinberg et al. 2001)) y de 50 mmol C m-2 d-1 (Atlántico N (Longhurst et al. 1995))
Spanish summary / Resumen en español
283
Tal y como se ha demostrado previamente, es muy probable que la fuente
principal de energía para la fijación de CID por parte de los procariotas provenga de la
oxidación de amonio realizada por las Crenarchaeotas; ya que el gen amoA de las
Archaeas es mucho más abundante que el gen amoA de las Bacterias en la capa
mesopelágica del Atlántico Norte (Agogué et al. 2008). Se he mostrado recientemente,
basándose en las características del radiocarbono de los lípidos de archaeas, que un 83%
del carbono de las archaeas tiene un origen autotrófico en la zona mesopelágica
subtropical del Pacífico Norte (a una profundidad de 670 m) (Ingalls et al. 2006). Las
propiedades del radiocarbono del ADN de las Archaeas de la aguas mesopelágicas del
Pacífico (entre 670 y 915 metros de profundidad) han permitido diferenciar entre los
tres reservorios fundamentales de carbono que se encuentran potencialmente
disponibles para los procariotas: COD fresco recientemente liberado a partir de COP
(∆14C > +50‰), CID ambiental (∆14C ~ -200 to -100 ‰), y COD ambiental envejecido
(∆14C = -525‰) (Hansman et al. 2009). Estos autores concluyeron que ambos, el CID y
el COD fresco (presumiblemente generado a partir del COP), son utilizados en gran
medida, mientras que el COD ambiental no un substrato importante para los procariotas
mesopelágicos (Hansman et al. 2009). Existen también evidencias de una producción
quimiolitotrófica considerable en el COP que se hunde recogido con trampas de
sedimentos en el Pacífico Norte mesopelágico (entre 100-750 metros de profundidad)
(Karl et al. 1984). En dicho estudio, la contribución quimiolitotrófica fue responsable de
entre un 7-90% de la producción microbiana total, indicando otra vez la importancia
potencial de la producción de carbono quimiolitotrófica como fuente de carbono y
energía de reciente generación en la zona mesopelágica.
En resumen, la percepción actual de la dependencia de la actividad heterotrófica
microbiana del océano oscuro en el COP que se sedimenta y el resultante desajuste
entre el aporte de carbono orgánico y la demanda (Reinthaler et al. 2006, Steinberg et
al. 2008, Burd et al. en prensa, Capítulo II) necesitan ser revisados. El gran y
prácticamente constante stock de COPs necesita ser considerado como un reservorio
potencialmente disponible de COP para los microbios heterotróficos de las aguas
profundas. Hemos mostrado que sólo una pequeña proporción del COPs potencialmente
utilizable es requerida diariamente para mantener la demanda de carbono de los
microbios heterotróficos del océano profundo. Entre un 12-72% de la cantidad de COPs
requerida por los microheterótrofos en el océano mesopelágico es potencialmente
Spanish summary / Resumen en español
284
suministrado por quimiolitótrofos de aguas profundas mediante la fijación de CID.
Consecuentemente, el desajuste aparentemente existente entre el aporte y la demanda
heterotrófica de materia orgánica en la capa mesopelágica puede ser considerablemente
menor de lo que se pensaba. Futuras investigaciones deberían centrarse en redefinir la
calidad nutritiva del COPs en comparación con el COP que se hunde, y en obtener una
visión más refinada de la producción quimiolitoautotrófica de materia orgánica
suspendida de reciente generación en el interior del océano. Estas rutas redefinidas de
las fuentes y sumideros de materia orgánica en el océano oscuro nos podrían hacer
llegar a un entendimiento mecanicista de la estructura y actividad de la red trófica del
océano profundo y, en último lugar, nos permitiría mejorar los modelos sobre el papel
del océano oscuro en el ciclo global del carbono.
Spanish summary / Resumen en español
285
CONCLUSIONES
Las principales conclusiones que se obtienen de esta tesis son:
1. Existe una alta variabilidad en la estructura de la comunidad procariota y en su
actividad en las aguas superficiales y profundas de la Zona Costera de
Transición del NO de África – Islas Canarias, lo que sugiere una naturaleza
heterogénea del océano oscuro.
a. Se encontró una sustitución clara de Bacterias por Archaeas
(fundamentalmente Crenarchaeota) a lo largo de gradientes tróficos
(hacia océano abierto y en profundidad).
b. Las distintas masas de agua juegan un papel clave a la hora de estructurar
el metabolismo de los procariotas. Un ejemplo fue encontrado en el caso
de las masas de agua intermedias, hallando menores tasas de
incorporación de leucina en las capas donde existían intrusiones de Agua
Antártica Intermedia.
2. Se encontró una fuerte relación entre el carbono orgánico particulado
suspendido y la respiración de los procariotas en las aguas oscuras del
Atlántico Norte (sub)tropical. Este descubrimiento, junto con el intenso
desajuste existente entre la demanda de carbono procatiota y el flujo de
carbono orgánico particulado (COP) que se hunde, sugieren: i) un control
“bottom-up” del metabolismo de los procariotas del océano profundo por el
reservorio de materia orgánica particulada suspendida, y ii) un modo de vida de
los procariotas del océano oscuro preferentemente adherido a partículas.
3. Se halló un incremento en la actividad enzimática extracelular (AEE) específica
por célula desde la base de la capa eufótica hasta las aguas batipelágicas del
Atlántico Norte (sub)tropical.
a. Este aumento en la AEE específica en profundidad fue acompañado por
un incremento en la respiración por célula y una disminución en la
incorporación de leucina por célula. Este descubrimiento, junto con el
Spanish summary / Resumen en español
286
aumento de la constante de semisaturación (Km) de las enzimas
extracelulares y del ratio Vmax / Km, indican una adaptación de la AEE
para con la naturaleza refractaria de la materia orgánica del océano
oscuro.
b. Se encontró un incremento en la actividad por célula de la fosfatasa
alcalina en profundidad, indicando que dicha actividad no se relaciona
con la disponibilidad de fosfato en el océano oscuro. De hecho, la
fosfatasa alcalina parece ser utilizada por los procariotas de aguas
profundas como un medio para conseguir C a partir de la materia
orgánica, en vez de utilizarla para obtener fosfato directamente.
4. La AEE se encuentra fundamentalmente en forma disuelta en las aguas
profundas del Océano Atlántico Central, donde se encontró una relación entre
la AEE (las fracciones disueltas y particuladas) y la producción heterotrófica
procariota y el reservorio de materia orgánica particulada. Dichos
descubrimiento de nuevo sugieren un estilo de vida predominantemente pegado
a partículas para los procariotas del océano profundo.
5. Los remolinos mesoescalares generados por islas oceánicas pueden tener un
profundo impacto sobre la distribución y la función de los procariotas en el
océano. Sin embargo, incluso en estas estructuras mesoscalares, caracterizadas
por una mayor productividad en sus aguas superficiales que fuera de los
remolinos, el efecto sobre la distribución y la función de los procariotas se
restringe a las zonas epi- y mesopelágicas. Ello se debe probablemente a que la
mayor parte del COP que se hunde se consume en los primeros 1000 m de la
columna de agua, indicando una rápida atenuación de la influencia del COP
que se hunde en los microbios batipelágicos.
6. Como fue el caso para otros parámetros determinados en esta tesis, la eficiencia
de crecimiento procariota (ECP) y el factor de conversión de leucina a carbono
determinado empíricamente (LeuFC) presentaron una alta variabilidad en las
aguas mesopelágicas del Océano Atlántico Nordeste, exhibiendo rangos
similares a los reportados para las aguas superficiales de regiones oligotróficas.
Spanish summary / Resumen en español
287
7. El carbono orgánico particulado suspendido y la fijación oscura de carbono
inorgánico de los procariotas de aguas profundas pueden ayudar a reducir el
desequilibrio existente entre el carbono orgánico requerido por los microbios y
el aporte de materia orgánica al océano oscuro. Asumiendo una alta demanda
de carbono procariota (empleando un R : ETS de 0.6), se requiere el consumo
de menos del 8% del reservorio de COP suspendido diariamente para
compensar la demanda de carbono heterotrófica microbiana de las aguas
mesopelágicas. Nuestros números indican asimismo que la fijación oscura de
carbono inorgánico disuelto (CID) puede aportar diariamente entre un 12% y
un 72% de este carbono orgánico requerido, mientras que el COP que se hunde
sólo puede aportar entre un 4-12%. Consecuentemente, el desequilibrio
realmente existente entre el aporte de carbono orgánico y la demanda no es tan
fuerte como se ha asumido previamente si incorporamos esta, previamente
ignorada, producción oscura de materia orgánica particulada autóctona del
océano oscuro.
Spanish summary / Resumen en español
289
FUTURAS LÍNEAS DE INVESTIGACIÓN
Partiendo de los resultados obtenidos en esta tesis hay varios aspectos concernientes a la
oceanografía microbiana del océano oscuro que necesitarían ser resueltos en un futuro
próximo.
1. El objetivo primordial debería ser el estudio de la relación entre las partículas y
los procariotas de aguas profundas. Varias evidencias apuntan hacia un estilo de
vida preponderantemente adherido a partículas para los procariotas (DeLong et
al. 2006, Capítulo II, Capítulo IV). La recientemente descubierta alta
abundancia de geles en los océanos puede permitir interacciones espaciales
próximas entre procariotas y el continuo de la materia orgánica. Sin embargo, no
es posible determinar la extensión de estas interacciones con las técnicas de
muestreo de las que se dispone actualmente debido a la frágil naturaleza de estas
partículas del océano profundo. Nuevas técnicas de muestreo son necesarias para
distinguir entre microbios libres y asociados a partículas en el océano oscuro.
2. Los factores de conversión son necesarios si queremos comprender y cuantificar
mejor los flujos de carbono mediados por los procariotas en el océano oscuro.
Nosotros hemos reportado las primeras eficiencias de crecimiento procariotas
(ECP) calculadas a partir de factores de conversión de leucina a carbono
obtenidos empíricamente (LeuFC) para el océano profundo (Capítulo VI).
Debido a la alta variabilidad presentada por estos dos parámetros (ECP y
LeuFC), y al papel crucial que tiene el océano oscuro en los flujos de carbono
globales, es imperativo incrementar en gran medida el número de
determinaciones de factores de conversión. Solamente entonces seremos capaces
de determinar de una forma precisa el metabolismo procariota, y con ello, el
ciclo biogeoquímico global del carbono.
3. Un mayor esfuerzo debería dirigirse a estudiar el efecto de la presión
hidrostática sobre las tasas metabólicas de los procariotas que habitan en el
océano oscuro, debido a que, hasta la fecha, solamente se han referenciado
resultados contradictorios (Jannasch & Wirsen 1982, Tamburini et al. 2002).
Spanish summary / Resumen en español
290
Dicho efecto de la presión debería de ser tenido en cuenta no sólo en la
estimación rutinaria de tasas metabólicas, sino también en la determinación de
los propios factores de conversión involucrados.
4. Aunque no fuera el tema fundamental de esta tesis, más esfuerzo debería de ser
dirigido también hacia el estudio de la red trófica microbiana del océano oscuro.
Existen muy pocos trabajos concernientes a las tasas de consumo y lisis de
procariotas por parte de nanoflagelados heterotróficos y virus respectivamente.
Es muy posible que las interacciones existentes entre los componentes
individuales de la red trófica microbiana y la materia particulada y coloidal del
océano oscuro sean muy diferentes de las que presentan los agregados de aguas
superficiales. Dichas interacciones son cruciales para modelar los ciclos de
nutrientes y de carbono en el océano oscuro.
5. Una mejor cuantificación de las fuentes y sumidero de carbono del océano
oscuro sería necesaria para entender mejor los flujos globales de carbono.
Quizás algunos de los asuntos mencionados en esta sección pueden ayudar a
reducir el presente desequilibrio (e. g. efecto de la presión hidrostática sobre las
tasas metabólicas, vida microbiana concentrada en partículas, distintos factores
de conversión, rutas metabólicas novedosas,…). Una visión más clarificada de la
producción quimiolitoautotrófica de carbono orgánico suspendido en el interior
del océano sería recomendable. En cualquier caso, sería rotundamente un tema
de importancia capital el intentar ajustar el desequilibrio aparentemente existente
entre la demanda microbiana de carbono y el aporte de materia orgánica en las
capas meso- y batipelágicas.
6. Debería de realizarse un incremento generalizado de las bases de datos de los
parámetros de diversidad y función de los procariotas para poder permitirnos
alcanzar una visión refinada de las distribuciones espaciales a gran escala en la
regulación de los procesos microbianos de aguas profundas. Una opción podría
ser seguir el modelo de Longhurst de las provincias biogeográficas, definiendo
los diversos compartimentos que forman el océano oscuro.
7. Sería recomendable también conectar de una manera más apropiada los avances
acometidos recientemente en las aproximaciones moleculares con las medidas
Spanish summary / Resumen en español
291
actuales de flujos. Conectando la diversidad con la función, relacionando la
información genética con los ciclos biogeoquímicos del océano profundo.
Finalmente, el desarrollo de técnicas moleculares debería de ser utilizado
también para estudiar las adaptaciones de los distintos miembros de la
comunidad a las condiciones bióticas (e. g. mortalidad,…) y abióticos (e. g.
presión hidrostática, temperatura, nutrientes,…) del océano oscuro.
Spanish Summary
293
REFERENCES (from introduction, discussion and Spanish Summary)
ANNEXES
References
295
REFERENCES / BIBLIOGRAFÍA
Agogué H, Brink M, Dinasquet J, Herndl GJ (2008) Major gradients in putatively
nitrifying and non-nitrifying Archaea in the deep North Atlantic. Nature
456:788-791
Alldredge AL, Gotschalk C (1988) In situ settling behavior of marine snow. Limnol.
Oceanogr. 33:339-351
Alldredge AL, Silver MW (1988) Characteristics, dynamics and significance of marine
snow. Prog. Oceanogr. 20:41-82
Alldredge AL, Cole JJ, Caron DA (1986) Production of heterotrophic bacteria
inhabiting macroscopic organic aggregates (marine snow) from surface waters.
Limnol. Oceanogr. 31:68-78
Alldredge AL, Passow U, Logan BE (1993) The existence, abundance, and significance
of large transparent exopolymer particles in the ocean. Deep Sea Res. I 40:1131-
1140
Alonso-Saéz L, Gasol JM, Arístegui J, Vilas JC, Vaqué D, Duarte CM, Agusti S (2007)
Large-scale variability in surface bacterial carbon demand and growth efficiency
in the subtropical northeast Atlantic Ocean. Limnol. Oceanogr. 52:533-546
Amon RMW, Benner R (1994) Rapid cycling of high-molecular-weight dissolved