50
SHEF: FY 2014 STATE HIGHER EDUCATION FINANCE
SHEF: FY 2014 STATE HIGHER EDUCATION FINANCE

SHEEO: STATE HIGHER EDUCATION FINANCE: FY 2014 2
ACKNOWLEDGEMENTS
We are pleased to present the twelfth annual SHEEO State Higher Education Finance (SHEF) study of state support for higher education. Regular readers of the report will quickly notice the refreshed look of the FY 2014 SHEF report. Additional changes and improvements have been made to the SHEF webpage (www.sheeo.org/shef) and it is our hope that you will find these changes exciting and useful. Of course, SHEF’s underlying data provide the real strength of this project. No changes were made to the data or its basic presentation in the report. SHEEO developed the SHEF study building directly on a twenty-five year effort by Kent Halstead, an analyst and scholar of state policy for higher education, and the SHEF dataset now extends from 1980 to 2014.
SHEEO is deeply indebted to the staff of state higher education agencies who annually provide the state-level data essential for the preparation of this report. Without their diligence and commitment this project would not be possible. We also acknowledge and greatly appreciate the input and suggestions from many state higher education finance officers (SHEFOs); Dr. James Palmer at Illinois State University, who heads up the Grapevine survey; and the broader higher education community; all of whom provided feedback and insight as we embarked on these changes and improvements to the SHEF project. Further, a grant from Lumina Foundation allowed us to devote additional staff time and resources to the project. Without its generous support, these improvements would not have been possible.
Once again, Andrew Carlson was the principal analyst for the State Higher Education Finance study. In addition to managing the data collection, analyzing and writing the report, Andrew oversaw review of the SHEF project over the summer of 2014 and developed the changes you see here. This year’s report is more of a collaborative effort than in past years and Andrew and I are appreciative and acknowledge the dedication and professionalism of the SHEEO staff who contributed to the project this year:
• Chris Ott, who improved the technical components of SHEF’s data collection and analysis systems;
• John Armstrong, who led the development of the interactive components on the SHEF webpage using Tableau software (www.sheeo.org/shef);
• Katie Zaback, who lent her knowledge of higher education data, specifically IPEDS data, to add a new dimension of degree and certificate completion to this year’s report; and,
• Gloria Auer, who provided editorial support and assisted in managing the data collection process.
Andy Sherman, with Can of Creative (www.canofcreative.com), provided the graphics and design for the FY 2014 SHEF report and we appreciate his efforts and the final product.
Finally, we gratefully acknowledge the assistance of The College Board in financing the costs of publishing and distributing the FY 2014 report.
George Pernsteiner President State Higher Education Executive Officers
Robert L. King President, Kentucky Council on Postsecondary Education Chair, SHEEO Executive Committee

SHEEO: STATE HIGHER EDUCATION FINANCE: FY 2014 3
TABLE OF CONTENTSACKNOWLEDGEMENTS .......................................................................................................................... 2
INDEX OF FIGURES .................................................................................................................................. 4
INDEX OF TABLES .................................................................................................................................... 5
INTRODUCTION ...................................................................................................................................... 6
OVERVIEW AND HIGHLIGHTS ............................................................................................................... 8
National Trends in State Funding for Higher Education ............................................................................. 8
Long-term Revenue and Enrollment Patterns............................................................................................... 9
Changes Over the Past Five Years in the States .......................................................................................... 10
Wealth, Taxes, and Allocations for Higher Education ................................................................................ 10
MEASURES, METHODS, AND ANALYTICAL TOOLS ...........................................................................11
Primary SHEF Measures......................................................................................................................................11
Adjustments for Comparability ........................................................................................................................12
Financial Data in Perspective: Uses and Cautions .......................................................................................12
REVENUE SOURCES AND USES ............................................................................................................ 15
NATIONAL TRENDS IN ENROLLMENT AND REVENUE ...................................................................... 18
Full-Time Equivalent Enrollment (FTE) .......................................................................................................... 22
Educational Appropriations .............................................................................................................................. 22
Net Tuition Revenue ........................................................................................................................................... 24
Certificate and Degree Completion ............................................................................................................... 25
INTERSTATE COMPARISONS—MAKING SENSE OF MANY VARIABLES ........................................... 28
SHEF Adjustments to Facilitate Interstate Comparisons ...........................................................................28
Comparing States across Single Dimensions or Variables .......................................................................29
STATE WEALTH, TAXES, AND ALLOCATIONS FOR HIGHER EDUCATION ....................................... 41
CONCLUSION......................................................................................................................................... 47
SHEEO: STATE HIGHER EDUCATION FINANCE: FY 2014 4
1. Distribution of Funding Sources, Fiscal 2005-2014 ............................................................................................... 9
2. Public FTE Enrollment and Educational Appropriations Per FTE, U.S., Fiscal 1989-2014 .......................... 21
3. Percent Change in Fiscal 2014 Educational Appropriations Per FTE Since Fiscal 2008 .............................23
4. Net Tuition as a Percent of Public Higher Education Total Educational Revenue, U.S., Fiscal 1989-2014 ...........................................................................................................................................................24
5. Degree and Certificate Completions by Level and SHEF FTE Enrollment .....................................................26
6. Degree and Certificate Completions Per 100 SHEF FTE .................................................................................... 27
7. Full-time Equivalent (FTE) Enrollment in Public Higher Education Percent Change by State, Fiscal 2009-2014 ..........................................................................................................................................................29
8. Educational Appropriations per FTE Percent Change by State, Fiscal 2009-2014 .......................................31
9. Net Tuition as a Percent of Public Higher Education Total Educational Revenue by State, Fiscal 2014 ......................................................................................................................................................................33
10. Total Educational Revenue per FTE Percent Change by State, Fiscal 2009-2014 ....................................... 35
11. Illinois State Funding Compared to Retirement System Funding, Fiscal 2007-2014 ................................... 37
12. Educational Appropriations Per FTE–State Differences From U.S. Average, Fiscal 2014 ...........................39
13. Total Educational Revenue Per FTE–State Differences From U.S. Average, Fiscal 2014 ............................40
14. Higher Education Support Per Capita by State, Indexed to U.S. Average, Fiscal 2013 ...............................46
15. Higher Education Support Per $1,000 Personal Income by State, Indexed to U.S. Average, Fiscal 2013 ......................................................................................................................................................................46
INDEX OF FIGURES

SHEEO: STATE HIGHER EDUCATION FINANCE: FY 2014 5
INDEX OF TABLES
1. Major Sources and Uses of State and Local Government Support Fiscal 2009-2014 (Current Dollars in Millions) .........................................................................................................................................17
2. Higher Education Finance Indicators (Current Dollars in Millions) .................................................................. 19
3. Higher Education Finance Indicators (Constant 2014 Dollars in Millions) .....................................................20
4. Public Higher Education Full-Time Equivalent (FTE) Enrollment .....................................................................30
5. Educational Appropriations per FTE (Constant Adjusted 2014 Dollars) .......................................................32
6. Public Higher Education Net Tuition Revenue per FTE (Constant Adjusted 2014 Dollars) ........................34
7. Total Educational Revenue per FTE (Constant Adjusted 2014 Dollars) ...........................................................36
8. State Wealth, Tax Revenue, Effective Tax Rates, and Higher Education Allocation; U.S., 2002-2012 (Current Unadjusted Dollars) .....................................................................................................................................42
9. Tax Revenues, Taxable Resources, and Effective Tax Rates by State, Fiscal 2012 ........................................44
10. Perspectives on State and Local Government Higher Education Funding Effort, by State .......................45

SHEEO: STATE HIGHER EDUCATION FINANCE: FY 2014 6
INTRODUCTION
Financing higher education requires political leaders, policymakers, and educators to address broad public policy questions, including:
• What levels of state funding for colleges and universities are necessary to maintain the economic and social well-being of its citizenry and to ensure the United States remains globally competitive?
• How do state funding levels and the correlation between state funding and reliance on tuition revenue at public institutions of higher education influence the implementation of state and national completion/attainment goals?
• How should state funding be distributed? What is the impact of implementing and allocating outcomes-based funding models on institutional behavior and performance?
• How can states balance the need for higher education support with the needs of other major state programs given limited resources and budgetary pressures, especially as the demands and obligations of other major budget drivers increase faster than overall state revenues?
• What tuition levels are appropriate given the costs of higher education, its benefits to individuals and to the general public, and the desirability of encouraging participation and improving degree and certificate attainment? How do changes to tuition policy, rates, and the impact of student financial aid on tuition pricing impact participation, access, and ultimately attainment?
• What level of student financial assistance is necessary to provide meaningful educational opportunities for traditionally underserved students and students from low- and moderate-income families?
• How might colleges and universities use available resources to increase productivity without impairing the quality of student services? What levels of productivity and efficiency should we expect from an industry with costs primarily driven by personnel needs?
SHEEO: STATE HIGHER EDUCATION FINANCE: FY 2014 7
The State Higher Education Finance (SHEF) report is produced annually by the State Higher Education Executive Officers association (SHEEO) to broaden understanding of the context and consequences of multiple decisions made every year in every state in each of these areas. No single report can provide definitive answers to these broad and fundamental questions of public policy, but the SHEF report provides important context and information to help inform such decisions. The report includes:
• An Overview and Highlights of national trends and the current status of state funding for higher education;
• An explanation of the Measures, Methods, and Analytical Tools used in this report;
• A description of the Revenue Sources and Uses for higher education, including state tax and nontax revenues, local tax support, tuition revenue, and the proportion of this funding available for general educational support;
• An analysis of National Trends in Enrollment and Revenue, in particular, changes over time in the public resources available for general operating support;
• Interstate Comparisons—Making Sense of Many Variables, using tables, charts, and graphs to compare data across states and over time; and
• Indicators of relative State Wealth, Tax Effort, and Allocations for Higher Education, along with ways to take these factors into account when making interstate comparisons.
The SHEF report provides the earliest possible review of state and local support, tuition revenue, and enrollment trends for the most recent completed fiscal year.
FOOTNOTE
Please note: Generally, years referenced in the body of this publication refer to state fiscal years, which commonly start July 1 and run through June 30 of the following calendar year. For example, FY 2014 includes July 2013 through June 2014. All enrollments are full-time equivalent for an academic year (including summer term). National averages are calculated using the sum of all of the states. For example, the national average per FTE expenditure is calculated as the total of all states’ expenditures divided by the total of all states’ FTEs.

SHEEO: STATE HIGHER EDUCATION FINANCE: FY 2014 8
OVERVIEW AND HIGHLIGHTS
NATIONAL TRENDS IN STATE FUNDING FOR HIGHER EDUCATION
A recession beginning in 2008 dramatically reduced state revenue and ended the growth in state and local support achieved between 2004 and 2008. In 2014, for the second straight year, overall state and local funding for higher education increased, reaching $86.3 billion, up 5.7 percent from 2013, but still below 2008-2011 levels. Initial estimates from the Grapevine survey of FY 2015 appropriations for higher education show continued growth overall of 5.2 percent in nominal terms. These data all point to continuing economic recovery and restoration of state funding for higher education on average nationally.
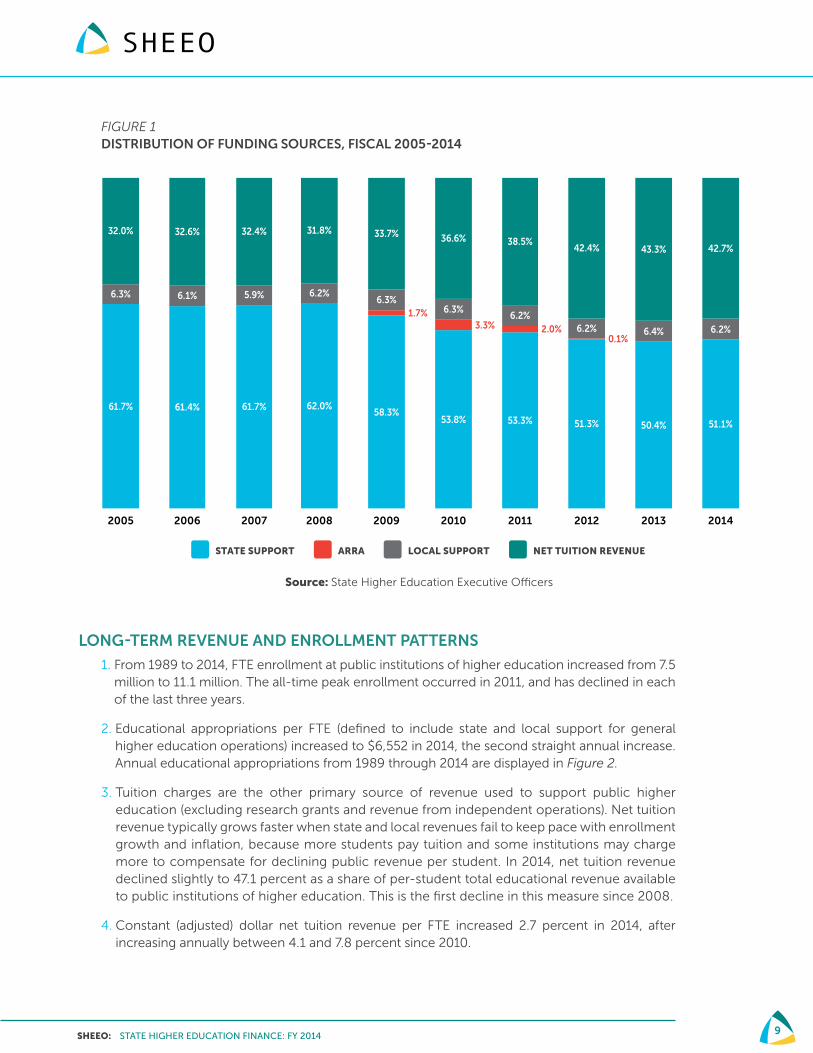
In addition to state and local revenues, public institutions collected net tuition revenue of $64.3 billion in 2014, for a total of about $150.7 billion available to support higher education. For the first time since the recession, the share of overall funding for public and private higher education from tuition decreased slightly to 42.7 percent (see Figure 1). Net tuition revenue as a share of public higher education revenue was 47.1 percent.
Of the $86.3 billion in state and local support during 2014, 76.8 percent was allocated to the general operating expenses of public higher education. Special purpose or restricted state appropriations for research, agricultural extension, and medical education accounted for another 12.2 percent of the total. The percent of total support allocated for financial aid to students attending public institutions declined 0.3 percent to 7.7 percent in 2014, although funding was increased slightly. The remaining 3.2 percent supported students attending independent institutions, operating expenses at independent institutions, and non-credit and continuing education expenditures.
Further analysis of the data indicates that constant (adjusted for the impact of inflation over time) dollar per-student state and local funding for public colleges and universities also increased for the second year in a row to $6,552, 5.4 percent above 2013. In 2010, 2011, and 2012, the per-student state and local support were the lowest in the last 25 years. Although 2014 per-student state and local support increased, it still remains significantly lower than pre-recession levels.
Highlights of the SHEF report provided below illustrate the long-term patterns, shorter-term changes, and state-level variables affecting the resources available to support higher education between 1989 and 2014. These and other factors that shape higher education funding are examined in more detail in the sections of the full report that follow.
SHEEO: STATE HIGHER EDUCATION FINANCE: FY 2014 9
FIGURE 1DISTRIBUTION OF FUNDING SOURCES, FISCAL 2005-2014
LONG-TERM REVENUE AND ENROLLMENT PATTERNS
1. From 1989 to 2014, FTE enrollment at public institutions of higher education increased from 7.5 million to 11.1 million. The all-time peak enrollment occurred in 2011, and has declined in each of the last three years.
2. Educational appropriations per FTE (defined to include state and local support for general higher education operations) increased to $6,552 in 2014, the second straight annual increase. Annual educational appropriations from 1989 through 2014 are displayed in Figure 2.
3. Tuition charges are the other primary source of revenue used to support public higher education (excluding research grants and revenue from independent operations). Net tuition revenue typically grows faster when state and local revenues fail to keep pace with enrollment growth and inflation, because more students pay tuition and some institutions may charge more to compensate for declining public revenue per student. In 2014, net tuition revenue declined slightly to 47.1 percent as a share of per-student total educational revenue available to public institutions of higher education. This is the first decline in this measure since 2008.
4. Constant (adjusted) dollar net tuition revenue per FTE increased 2.7 percent in 2014, after increasing annually between 4.1 and 7.8 percent since 2010.
DISTRIBUTION OF FUNDING SOURCES, FY 2005 - 2014FIGURE 1
Source: State Higher Education Executive O�cers
STATE SUPPORT ARRA LOCAL SUPPORT NET TUITION REVENUE
61.7%
6.3%
32.0%
2005
61.4%
6.1%
32.6%
2006
61.7%
5.9%
32.4%
2007
62.0%
6.2%
31.8%
2008
58.3%
1.7%6.3%
33.7%
2009
53.8%
3.3%
6.3%
36.6%
2010
53.3%
2.0%6.2%
38.5%
2011
51.3%
0.1%6.2%
42.4%
2012
50.4%
6.4%
43.3%
2013
51.1%
6.2%
42.7%
2014
SHEEO: STATE HIGHER EDUCATION FINANCE: FY 2014 10
5. In 2014, total educational revenue grew to $12,329 due to increases in state and local support and tuition coupled with enrollment declines. Total educational revenue per student remains slightly below pre-recession levels. This is an average across all the states. In 2014, many states continued to see educational revenue per FTE that was considerably lower than prevailed in 2008. Constant dollar total educational revenue per FTE (as displayed in Figure 2) declined from the late 1980s to the early 1990s, from $11,407 in 1989 to $10,949 in 1993. Thereafter, total educational revenue per FTE grew steadily from 1994 to 2001, reaching $12,700. Total revenue per FTE then fell sharply (about 10 percent) from 2001 to 2004 (to $11,491), rebounding to $12,563 by 2008. Despite increases in tuition charges, total revenue per student dropped from this peak in 2008 to $11,470 in 2012.
CHANGES OVER THE PAST FIVE YEARS IN THE STATES
Total public higher education enrollment has increased substantially in recent years. Following dramatic increases nationally from 2002 through 2005, FTE enrollment at public institutions of higher education slowed somewhat, only to increase sharply again between 2007 and 2011, but has declined each of the last three years. These enrollment trends significantly affected the per-student revenue available to support higher education. Across states, both enrollment and appropriations changes varied widely from the national average.
6. Nationally, FTE enrollment grew 3.9 percent over the past five years. Forty-three states have experienced increases in FTE enrollment since 2009.
7. Per-FTE constant dollar educational appropriations increased in only three states between 2009 and 2014. Nationally, educational appropriations per student were down 13.3 percent, during that period.
8. Adding revenue from tuition increases, constant dollar total educational revenue per FTE (excluding net tuition revenue used for capital or debt service) increased 1.7 percent on average between 2009 and 2014, with 26 of the states experiencing increases in this measure.
WEALTH, TAXES, AND ALLOCATIONS FOR HIGHER EDUCATION
Each state’s unique combination of policy choices and fiscal and environmental conditions provides the context within which higher education funding occurs. The national trends outlined below give a sense of general conditions, but individual state contexts vary widely. The available data are from 2002 to 2012, lagging two years behind appropriations data reported elsewhere in this report. The effects of the recession beginning in 2008 and the beginnings of economic recovery on state and local revenues are evident in these data.
9. Total taxable resources per capita, a statistic that captures state income and wealth, grew by 9.7 percent to $58,163 in 2012, well above the pre-recession high of $53,612 in 2007.
10. Over the ten-year period from 2002 to 2012, total taxable resources per capita increased 40.5 percent, while the effective tax rate decreased by 2.8 percent, reflecting structural changes in taxes and tax policies in several states.
11. The proportion of state and local tax revenues allocated to higher education declined over the decade, from 7.6 percent in 2002 to 5.8 percent in 2012.

SHEEO: STATE HIGHER EDUCATION FINANCE: FY 2014 11
MEASURES, METHODS, AND ANALYTICAL TOOLS
PRIMARY SHEF MEASURES
To assemble the annual SHEF report, SHEEO collects data on all state and local revenues used to support higher education, including revenues from taxes, lottery receipts, state royalty revenue, and state-funded endowments. It also identifies the major purposes for which these public revenues are provided, including general institutional operating expenses, student financial assistance, and support for centrally-funded research, medical education, and extension programs. Analysis of these data yields the following key indicators:
• State and Local Support—consists of state tax appropriations and local tax support plus additional nontax funds (e.g., lottery revenue) that support or benefit higher education, and funds appropriated to other state entities for specific higher education expenditures or benefits (e.g., employee fringe benefits disbursed by the state treasurer). State and local support for 2009–2012 (federal fiscal years 2009–2011) also includes federal ARRA revenue provided to stabilize these sources of revenue for higher education.
• Educational Appropriations—that part of state and local support available for public higher education operating expenses, defined to exclude spending for research, agricultural extension, and medical education, as well as support for independent institutions or students attending them. Since funding for medical education and other major non-instructional purposes varies substantially across states, excluding these funding components helps to improve the comparability of state-level data on a per-student basis.
• Net Tuition Revenue—the gross amount of tuition and fees, less state and institutional financial aid, tuition waivers or discounts, and medical student tuition and fees. This is a measure of the resources available from tuition and fees to support instruction and related operations at public higher education institutions. Net tuition revenue generally reflects the share of instructional support received from students and their families, although it is not the same as, and does not take into account many factors that need to be considered in analyzing, the “net price” students pay for higher education.1
1. SHEF does not provide a measure of “net price,” a term that generally refers to the cost of attending college after deducting assistance provided by federal, state, and institutional grants. SHEF does not deduct federal grant assistance (primarily from Pell Grants) from gross tuition revenue, since these are non-state funds that substitute, at least in part, for costs borne by students. Non-tuition costs (room and board, transportation, books, and incidentals) typically total $10,000 or more annually in addition to tuition costs. This requires students with a low expected family contribution (most Pell recipients) to augment federal grants with a substantial contribution from part-time work or loans, even at a comparatively low-tuition public institution. In addition, the availability of federal tuition tax credits since 1999 has helped reduce “net price” for middle- and lower-middle-income students. While these tax credits have no impact on the net tuition revenue received by institutions, they do reduce the “net price” paid by students. SHEF’s net tuition revenue statistic is not a measure of “net price,” but a measure of the revenue that institutions receive from tuition. It is a straightforward measure of the proportion of public institution instructional costs borne by students and families. Measures of net price for the student need to include non-tuition costs and all forms of aid.
SHEEO: STATE HIGHER EDUCATION FINANCE: FY 2014 12
• Total Educational Revenue—the sum of educational appropriations and net tuition revenue excluding any tuition revenue used for capital and debt service. It measures the amount of revenue available to public institutions to support instruction (excluding medical students). Few public institutions have significant non-restricted revenue from gifts and endowments to support instruction. In some states, a portion of the net tuition revenue is used to fund capital debt service and other non-operational activities. These sums are excluded from calculations used to determine total educational revenue.
• Full-Time Equivalent Enrollment (FTE)—a measure of enrollment equal to one student enrolled full time for one academic year, calculated from the aggregate number of enrolled credit hours (including summer session enrollments). SHEF excludes most non-credit or non-degree program enrollments; medical school enrollments also are excluded for the reasons mentioned above. The use of FTE enrollment reduces multiple types of enrollment to a single measure in order to compare changes in total enrollment across states and sectors, and to provide a straightforward method for analyzing revenue on a per-student basis.
ADJUSTMENTS FOR COMPARABILITY
SHEF’s analytic methods are designed to make basic data about higher education finance as comparable as possible across states and over time. Toward that end, financial indicators are provided on a per-student basis (using FTE enrollment as the denominator), and the State Higher Education Finance (SHEF) report employs three adjustments to the “raw data” provided by states:
• Cost of Living Adjustment (COLA) to account for cost of living differences among the states;
• Enrollment Mix Index (EMI) to adjust for differences in the mix of enrollment and costs among types of institutions with different costs across the states; and
• Higher Education Cost Adjustment (HECA) to adjust for inflation over time.
Technical Papers A and B on the SHEF webpage (www.sheeo.org/shef) describe these adjustments in some detail. Tables provided in these technical papers show the actual effects of the COLA and EMI adjustments on the data provided by individual states, as well as the HECA adjustment from current to constant dollars (inflation-adjusted dollar values that are made annually to reflect inflation).
FINANCIAL DATA IN PERSPECTIVE: USES AND CAUTIONS
Higher education financial analysis is essential, but using financial data can be tricky and even deceptive. This section is intended to help readers and users focus on some of the core purposes of interstate financial analysis, while being cognizant of limitations inherent in the data and methods.
Comparing institutions and states is a difficult task. Consider how different the states are, even after adjusting for population size. They vary in climate, energy costs, housing costs, population densities, growth rates, resource bases, and the mix of industries and enterprises driving their local economies. Some have a relatively homogeneous, well-educated population, while others have

SHEEO: STATE HIGHER EDUCATION FINANCE: FY 2014 13
large numbers of traditionally underserved populations and recent immigrants. Most states have pockets of poverty, but these vary in their extent and concentration. Finally, the extent and rate at which these socioeconomic and demographic factors are changing also varies across states.
State higher education systems also differ. Some have many small institutions, others fewer but larger institutions. Some have many independent (privately controlled) institutions; others rely almost entirely on public institutions, with varying combinations of research universities, community colleges, and four-year universities. Across states, tuition policies and rates vary, as do the amounts and types of financial aid, which in turn affect enrollment patterns. Some states have multiple institutions that offer high-cost programs (e.g., in the sciences or engineering), while others provide substantially more funding for research or emphasize undergraduate education.
The SHEF report seeks to provide—to the extent possible—comparable data and reliable methods for examining many of the most fundamental financial issues facing higher education, particularly at the state level. Its purpose is to help educators and policymakers:
• Examine whether or not state funding for colleges and universities has kept pace with enrollment growth and inflationary cost increases;
• Focus on the major purposes of state spending on higher education and how these investments are allocated;
• Assess trends in the proportion or “share” that students and families are paying for higher education;
• See how funding of their state’s higher education system compares to that in other states; and
• Assess the capacity of a state’s economy and tax policies to generate revenue to support public priorities such as higher education.
While making finance data cleaner, consistent, and more comparable, SHEF’s analytic methods also add complexity. All comparisons can claim only to be “valid, more or less,” and SHEF is no exception. Analysts with knowledge of particular states probably know of other factors that should be taken into account or that could mislead comparative analysis. SHEEO continues to welcome all efforts to improve the quality of its data and analytical tools. We urge readers and users to help us improve both methods and understanding.
Many educators and policymakers (and segments of the public) may look to interstate financial analysis to determine “appropriate” or “sufficient” funding for higher education; but sufficiency is meaningful only in the context of a particular state’s objectives and circumstances. State leaders, educators, and others must work together to set goals and develop strategies to achieve those goals, and then determine the amount and allocation of funds required for success.
Whether the objective is to sustain competitive advantage or to improve the postsecondary education system, money is always an issue. With additional resources, educators can serve more students at higher levels of quality; but additional spending does not necessarily yield proportional increases in quantity or quality.2 Efficiency is a thorny issue in education finance; educators can
2. Kelly, P. and Jones, D. (2005). A New Look at the Institutional Component of Higher Education Finance: A Guide for Evaluating Performance Relative to Financial Resources. Boulder, CO: NCHEMS.

SHEEO: STATE HIGHER EDUCATION FINANCE: FY 2014 14
always find good uses for additional resources, and resources are always limited. If educators and policymakers can agree that it is highly desirable to achieve widespread educational attainment more cost-effectively, they can work together to increase educational productivity. Making authentic productivity gains requires sustained effort and a combination of investing in priorities and finding efficiencies through incentives, reallocation, and innovation. And such an effort cannot focus solely on the numbers of degrees but must also consider measures (direct and indirect) of student learning and achievement.
The question, “How much funding is enough?” has no easy answer at the state or national level. Educators and policymakers must work together to address such key questions as:
• What kind of higher education system do we want?
• What will it take, given our circumstances, to establish and sustain such a system?
• Are we making effective use of our current investments?
• Where would an incremental or reallocated dollar lead to improved outcomes and help to meet state and national goals?
Good financial data and analysis are essential for addressing such questions.

SHEEO: STATE HIGHER EDUCATION FINANCE: FY 2014 15
REVENUE SOURCES AND USES
Support for higher education involves a substantial financial commitment by state and local governments. Twenty-six years ago, in 1989, state and local governments invested $37.5 billion ($77.4 billion in constant 2014 dollars) in direct support for the operations of public and independent higher education institutions. By 2014, state and local support for higher education was $86.3 billion. As shown in Table 1, 2014 unadjusted state and local support grew 5.7 percent over 2013 but remained slightly lower than the 2008 pre-recession high of $88.7 billion and the totals from 2009, 2010, and 2011 (three years bolstered by federal stimulus funds). The increase in 2014 state and local support represents the second year of current dollar increases, indicating continued recovery from the Great Recession.
This section provides data and analysis of the sources of state and local government support for higher education, focusing on the most recent five-year trend (2009-2014). It also provides an overview of the major uses of that support, including state support for (1) research, agricultural extension, and medical education, (2) student financial aid, and (3) independent (private, not-for-profit) institutions.3 The data presented here and shown in Table 1 are current, unadjusted dollars.
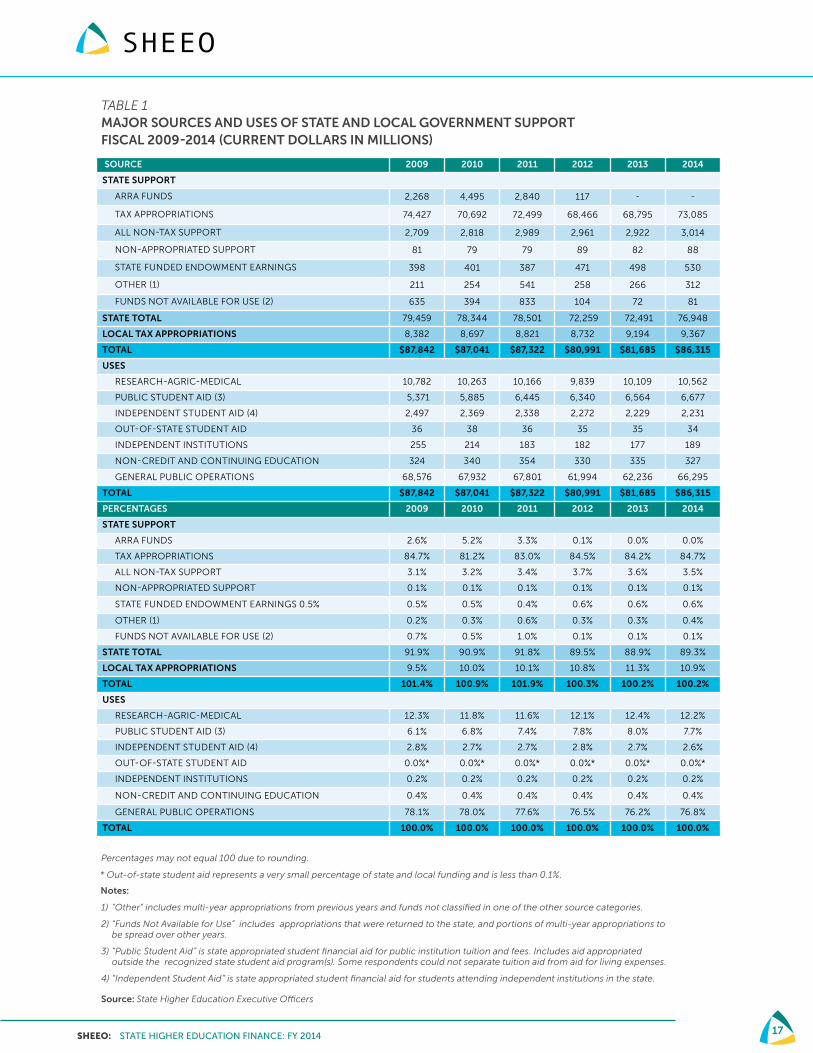
As shown in Table 1, sources for the $86.3 billion state and local government support for higher education in 2014 included the following:
• State sources accounted for $76.9 billion (89.3 percent), with $73.1 billion coming from appropriations from state tax revenue.
• Nontax appropriations, mostly from state lotteries, continued to grow, reaching $3 billion in 2014.
• Local appropriations accounted for 10.9 percent of total support in 2014, down from a high of 11.3 percent in 2013. Local tax support for higher education occurred in 31 states and funded community colleges. Local appropriations grew steadily from $8.4 billion to $9.4 billion over the five-year period.
• State-funded endowment earnings accounted for another 0.6 percent.
• Oil and mineral extraction fees or other lease income (royalties, which are generally not appropriated) accounted for 0.1 percent.
Major uses of the $86.3 billion in 2014 state and local government funding for higher education included:
• $66.3 billion (76.8 percent) for general operating expenses of public higher education institutions
• $10.6 billion (12.2 percent) for special-purpose appropriations—research, agricultural extension, and medical education
3. Supplemental interactive SHEF tables and charts, which are available at www.sheeo.org/shef, provide more-detailed data and tables on state-by-state sources and uses of higher education funding for 2014. As noted in the examples throughout this report, revenue sources vary considerably across states and from the national averages.
SHEEO: STATE HIGHER EDUCATION FINANCE: FY 2014 16
• $8.9 billion was spent on state-funded student financial aid programs, including state-funded programs for students attending independent as well as public institutions, accounting for about 10.4 percent of the funds used. States spent 7.7 percent of state and local government funding on student financial aid programs at public institutions, up from 6.1 percent in 2009. Since 2008, when states allocated $5.0 billion for state financial aid for students attending public institutions, funding for this purpose has annually increased, reaching $6.7 billion in 2014; however, aid is down as a share of the total state and local funding from 2013. Despite the challenges of the economic downturn, states have maintained support for these aid programs, although the enrollment growth that occurred throughout the downturn likely led to decreased purchasing power of these funds (because more students were eligible for and may have received aid).
SHEEO: STATE HIGHER EDUCATION FINANCE: FY 2014 17
TABLE 1MAJOR SOURCES AND USES OF STATE AND LOCAL GOVERNMENT SUPPORT FISCAL 2009-2014 (CURRENT DOLLARS IN MILLIONS)
SOURCE 2009 2010 2011 2012 2013 2014
STATE SUPPORT
ARRA FUNDS 2,268 4,495 2,840 117 - -
TAX APPROPRIATIONS 74,427 70,692 72,499 68,466 68,795 73,085
ALL NON-TAX SUPPORT 2,709 2,818 2,989 2,961 2,922 3,014
NON-APPROPRIATED SUPPORT 81 79 79 89 82 88
STATE FUNDED ENDOWMENT EARNINGS 398 401 387 471 498 530
OTHER (1) 211 254 541 258 266 312
FUNDS NOT AVAILABLE FOR USE (2) 635 394 833 104 72 81
STATE TOTAL 79,459 78,344 78,501 72,259 72,491 76,948
LOCAL TAX APPROPRIATIONS 8,382 8,697 8,821 8,732 9,194 9,367
TOTAL $87,842 $87,041 $87,322 $80,991 $81,685 $86,315
USES
RESEARCH-AGRIC-MEDICAL 10,782 10,263 10,166 9,839 10,109 10,562
PUBLIC STUDENT AID (3) 5,371 5,885 6,445 6,340 6,564 6,677
INDEPENDENT STUDENT AID (4) 2,497 2,369 2,338 2,272 2,229 2,231
OUT-OF-STATE STUDENT AID 36 38 36 35 35 34
INDEPENDENT INSTITUTIONS 255 214 183 182 177 189
NON-CREDIT AND CONTINUING EDUCATION 324 340 354 330 335 327
GENERAL PUBLIC OPERATIONS 68,576 67,932 67,801 61,994 62,236 66,295
TOTAL $87,842 $87,041 $87,322 $80,991 $81,685 $86,315
PERCENTAGES 2009 2010 2011 2012 2013 2014
STATE SUPPORT
ARRA FUNDS 2.6% 5.2% 3.3% 0.1% 0.0% 0.0%
TAX APPROPRIATIONS 84.7% 81.2% 83.0% 84.5% 84.2% 84.7%
ALL NON-TAX SUPPORT 3.1% 3.2% 3.4% 3.7% 3.6% 3.5%
NON-APPROPRIATED SUPPORT 0.1% 0.1% 0.1% 0.1% 0.1% 0.1%
STATE FUNDED ENDOWMENT EARNINGS 0.5% 0.5% 0.5% 0.4% 0.6% 0.6% 0.6%
OTHER (1) 0.2% 0.3% 0.6% 0.3% 0.3% 0.4%
FUNDS NOT AVAILABLE FOR USE (2) 0.7% 0.5% 1.0% 0.1% 0.1% 0.1%
STATE TOTAL 91.9% 90.9% 91.8% 89.5% 88.9% 89.3%
LOCAL TAX APPROPRIATIONS 9.5% 10.0% 10.1% 10.8% 11.3% 10.9%
TOTAL 101.4% 100.9% 101.9% 100.3% 100.2% 100.2%
USES
RESEARCH-AGRIC-MEDICAL 12.3% 11.8% 11.6% 12.1% 12.4% 12.2%
PUBLIC STUDENT AID (3) 6.1% 6.8% 7.4% 7.8% 8.0% 7.7%
INDEPENDENT STUDENT AID (4) 2.8% 2.7% 2.7% 2.8% 2.7% 2.6%
OUT-OF-STATE STUDENT AID 0.0%* 0.0%* 0.0%* 0.0%* 0.0%* 0.0%*
INDEPENDENT INSTITUTIONS 0.2% 0.2% 0.2% 0.2% 0.2% 0.2%
NON-CREDIT AND CONTINUING EDUCATION 0.4% 0.4% 0.4% 0.4% 0.4% 0.4%
GENERAL PUBLIC OPERATIONS 78.1% 78.0% 77.6% 76.5% 76.2% 76.8%
TOTAL 100.0% 100.0% 100.0% 100.0% 100.0% 100.0%
Percentages may not equal 100 due to rounding.
* Out-of-state student aid represents a very small percentage of state and local funding and is less than 0.1%. Notes:
1) “Other” includes multi-year appropriations from previous years and funds not classified in one of the other source categories.
2) “Funds Not Available for Use” includes appropriations that were returned to the state, and portions of multi-year appropriations to be spread over other years.
3) “Public Student Aid” is state appropriated student financial aid for public institution tuition and fees. Includes aid appropriated outside the recognized state student aid program(s). Some respondents could not separate tuition aid from aid for living expenses.
4) “Independent Student Aid” is state appropriated student financial aid for students attending independent institutions in the state.
Source: State Higher Education Executive Officers

SHEEO: STATE HIGHER EDUCATION FINANCE: FY 2014 18
NATIONAL TRENDS IN ENROLLMENT AND REVENUE
This section highlights national trends in higher education enrollment and the relationship between these trends and available revenue (and other components of financing). These “national” trends are actually composites of 50 unique and varied state trends, which are shown in the following section, Interstate Comparisons–Making Sense of Many Variables. For example, “national educational appropriations per FTE” is the sum of all educational appropriations divided by the sum of all net FTE across the 50 states. It is not the average of each of the 50 states’ individual per-FTE calculations. Please refer to the Methods, Measures, and Analytical Tools section for more information on the metrics presented here and the adjustment factors utilized.
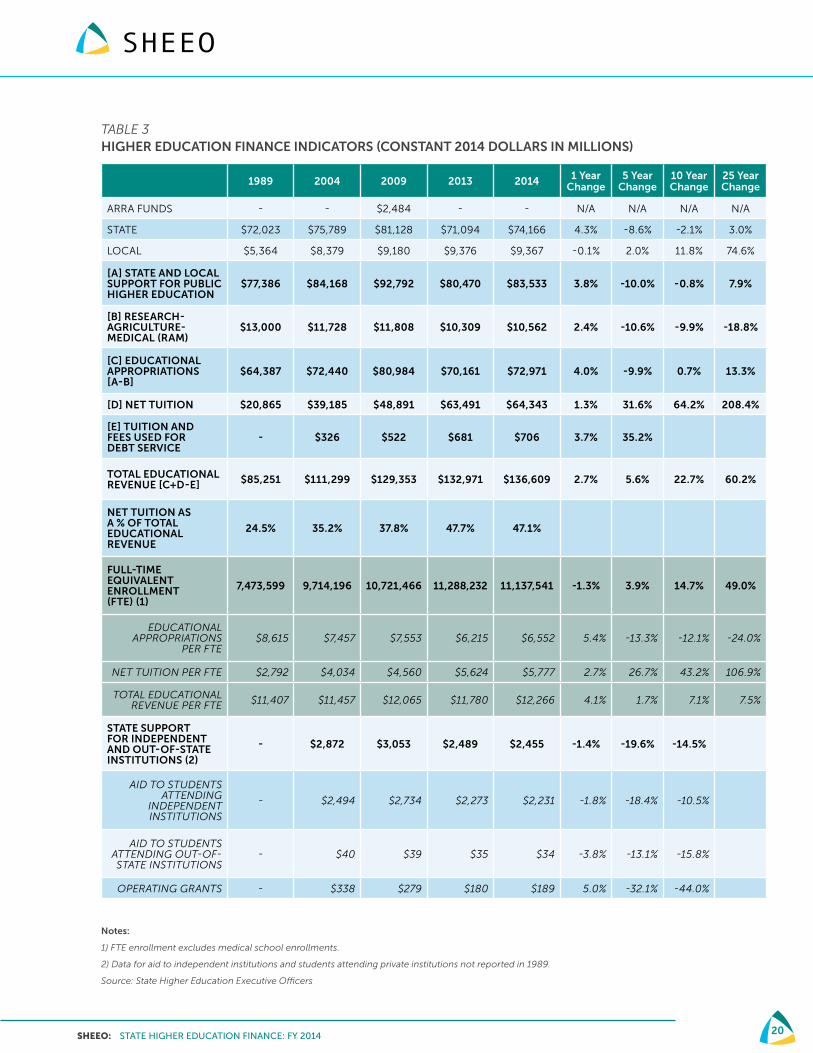
Tables 2 and 3 provide a starting point for understanding the national story of public higher education funding from state and local sources, tuition revenue from students and families, and the impact of inflation on these funds. Enrollment at public institutions as measured by full-time equivalent (FTE) students is also shown. Table 2 shows indicators in current, unadjusted dollars, while Table 3 shows the same indicators adjusted to 2014 dollars for the years 1989, 2004, 2009, 2013, and 2014.

SHEEO: STATE HIGHER EDUCATION FINANCE: FY 2014 19
TABLE 2HIGHER EDUCATION FINANCE INDICATORS (CURRENT DOLLARS IN MILLIONS)
1989 2004 2009 2013 2014 1 Year Change
ARRA FUNDS - - $2,268 - - N/A
STATE $34,857 $59,914 $74,080 $69,715 $74,166 6.4%
LOCAL $2,596 $6,624 $8,382 $9,194 $9,367 1.9%
[A] STATE AND LOCAL SUPPORT FOR PUBLIC HIGHER EDUCATION
$37,452 $66,537 $84,730 $78,910 $83,533 5.9%
[B] RESEARCH-AGRICUL-TURE-MEDICAL (RAM) $6,292 $9,272 $10,782 $10,109 $10,562 4.5%
[C] EDUCATIONAL APPROPRIATIONS [A-B] $31,161 $57,266 $73,948 $68,800 $72,971 6.1%
[D] NET TUITION $10,098 $30,977 $44,644 $62,259 $64,343 3.3%
[E] TUITION AND FEES USED FOR DEBT SERVICE - $258 $476 $668 $706 5.7%
TOTAL EDUCATIONAL REVENUE [C+D-E] $41,259 $87,986 $118,115 $130,392 $136,609 4.8%
NET TUITION AS A % OF TOTAL EDUCATIONAL REVENUE 24.5% 35.2% 37.8% 47.7% 47.1%
FULL-TIME EQUIVALENT ENROLLMENT (FTE) (1) 7,473,599 9,714,196 10,721,466 11,288,232 11,137,541 -1.3%
EDUCATIONAL APPROPRIATIONS PER FTE $4,169 $5,895 $6,897 $6,095 $6,552 7.5%
NET TUITION PER FTE $1,351 $3,189 $4,164 $5,515 $5,777 4.7%
TOTAL EDUCATIONAL REVENUE PER FTE $5,521 $9,057 $11,017 $11,551 $12,266 6.2%
STATE SUPPORT FOR INDEPENDENT AND OUT- OF-STATE INSTITUTIONS (2)
- $2,271 $2,787 $2,440 $2,455 0.6%
AID TO STUDENTS ATTENDING INDEPENDENT
INSTITUTIONS- $1,972 $2,497 $2,229 $2,231 0.1%
AID TO STUDENTS ATTENDING OUT-OF- STATE INSTITUTIONS
- $32 $36 $35 $34 -1.9%
OPERATING GRANTS - $267 $255 $177 $189 7.1%
Notes:
1) FTE enrollment excludes medical school enrollments.
2) Data for aid to independent institutions and students attending private institutions not reported in 1989.
Source: State Higher Education Executive Officers
Over the last 25 years, total state and local support for public higher education grew 123.0 percent in unadjusted terms, from $37.5 billion in 1989 to $83.5 billion in 2014. Adjusting for inflation, constant dollar total state and local support grew 7.9 percent over the same time period. From 1989 to 2014, FTE student enrollment grew by 49 percent, from 7,473,599 to 11,137,541. When both inflation and enrollment growth are considered, educational appropriations per FTE actually declined 24 percent over the last 25 years.
However, due to increases in tuition at public institutions, the total educational revenue per student FTE (from appropriations and tuition) is now 7.5 percent higher than in 1989 in constant dollars.
SHEEO: STATE HIGHER EDUCATION FINANCE: FY 2014 20
TABLE 3HIGHER EDUCATION FINANCE INDICATORS (CONSTANT 2014 DOLLARS IN MILLIONS)
1989 2004 2009 2013 2014 1 Year Change
5 Year Change
10 Year Change
25 Year Change
ARRA FUNDS - - $2,484 - - N/A N/A N/A N/A
STATE $72,023 $75,789 $81,128 $71,094 $74,166 4.3% -8.6% -2.1% 3.0%
LOCAL $5,364 $8,379 $9,180 $9,376 $9,367 -0.1% 2.0% 11.8% 74.6%
[A] STATE AND LOCAL SUPPORT FOR PUBLIC HIGHER EDUCATION
$77,386 $84,168 $92,792 $80,470 $83,533 3.8% -10.0% -0.8% 7.9%
[B] RESEARCH- AGRICULTURE- MEDICAL (RAM)
$13,000 $11,728 $11,808 $10,309 $10,562 2.4% -10.6% -9.9% -18.8%
[C] EDUCATIONAL APPROPRIATIONS [A-B]
$64,387 $72,440 $80,984 $70,161 $72,971 4.0% -9.9% 0.7% 13.3%
[D] NET TUITION $20,865 $39,185 $48,891 $63,491 $64,343 1.3% 31.6% 64.2% 208.4%
[E] TUITION AND FEES USED FOR DEBT SERVICE
- $326 $522 $681 $706 3.7% 35.2%
TOTAL EDUCATIONAL REVENUE [C+D-E] $85,251 $111,299 $129,353 $132,971 $136,609 2.7% 5.6% 22.7% 60.2%
NET TUITION AS A % OF TOTAL EDUCATIONAL REVENUE
24.5% 35.2% 37.8% 47.7% 47.1%
FULL-TIME EQUIVALENT ENROLLMENT (FTE) (1)
7,473,599 9,714,196 10,721,466 11,288,232 11,137,541 -1.3% 3.9% 14.7% 49.0%
EDUCATIONAL APPROPRIATIONS
PER FTE$8,615 $7,457 $7,553 $6,215 $6,552 5.4% -13.3% -12.1% -24.0%
NET TUITION PER FTE $2,792 $4,034 $4,560 $5,624 $5,777 2.7% 26.7% 43.2% 106.9%
TOTAL EDUCATIONAL REVENUE PER FTE $11,407 $11,457 $12,065 $11,780 $12,266 4.1% 1.7% 7.1% 7.5%
STATE SUPPORT FOR INDEPENDENT AND OUT-OF-STATE INSTITUTIONS (2)
- $2,872 $3,053 $2,489 $2,455 -1.4% -19.6% -14.5%
AID TO STUDENTS ATTENDING
INDEPENDENT INSTITUTIONS
- $2,494 $2,734 $2,273 $2,231 -1.8% -18.4% -10.5%
AID TO STUDENTS ATTENDING OUT-OF- STATE INSTITUTIONS
- $40 $39 $35 $34 -3.8% -13.1% -15.8%
OPERATING GRANTS - $338 $279 $180 $189 5.0% -32.1% -44.0%
Notes:
1) FTE enrollment excludes medical school enrollments.
2) Data for aid to independent institutions and students attending private institutions not reported in 1989.
Source: State Higher Education Executive Officers

SHEEO: STATE HIGHER EDUCATION FINANCE: FY 2014 21
The historical data in Figure 2 (the Wave Chart) demonstrate the relationships between higher education enrollment and revenue over time, especially the impact of the economic cycle on these measures over the last 25 years. Figure 2 also illustrates the longer-term trends. In the 2010 SHEF report, state and locally financed educational appropriations for public higher education hit the lowest level ($7,013 per FTE in constant 2014 dollars) in a quarter century, driven by accelerating enrollment growth and modest inflation, and the failure of state and local funding to keep pace with either during the previous two years. This downward trend continued in 2011 and 2012 with state and locally financed educational appropriations falling to $6,737 and $6,122 per FTE, respectively. Reversing the annual decline that began in 2009, 2013 educational appropriations per FTE rose to $6,215 in 2013, a constant dollar increase of $94 (1.5 percent) over 2012, indicating the beginnings of economic recovery. In 2014, educational appropriations grew more rapidly to $6,552 (5.4 percent), due in part by enrollment decline of 1.3 percent over 2013.
FIGURE 2PUBLIC FTE ENROLLMENT AND EDUCATIONAL APPROPRIATIONS PER FTE, U.S., FISCAL 1989-2014
2.0
4.0
6.0
8.0
10.0
12.0
14.0
$8
,615
$8
,52
0
$8
,30
1
$7,
84
2
$7,
572
$7,
670
$7,
92
0
$8
,00
6
$8
,30
5
$8
,577
$8
,79
9
$8
,717
$8
,96
4
$8
,63
8
$7,
99
3
$7,
45
7
$7,
40
1
$7,
764
$7,
95
8
$8
,08
1
$7,
55
3
$7,
013
$6
,73
7
$6
,12
2
$6
,215
$6
,55
2
$2
,79
2
$2
,84
0
$2
,93
7
$3
,175
$3
,377
$3
,49
4
$3
,58
7
$3
,70
9
$3
,76
2
$3
,78
7
$3
,78
9
$3
,60
6
$3
,73
6
$3
,75
0
$3
,83
4
$4
,03
4
$4
,19
3
$4
,475
$4
,54
7
$4
,48
2
$4
,56
0
$4
,76
9
$4
,96
2
$5
,34
8
$5
,62
4
$5
,777
$2,000
$4,000
$6,000
$8,000
$10,000
$12,000
$14,000
FIGURE 2
198
9
199
0
199
1
199
2
199
3
199
4
199
5
199
6
199
7
199
8
199
9
20
00
20
01
20
02
20
03
20
04
20
05
20
06
20
07
20
08
20
09
20
10
20
11
20
12
20
13
20
14
EDUCATIONAL APPROPRIATIONS PER FTE (CONSTANT $)
NET TUITION REVENUE PER FTE(CONSTANT $)
PUBLIC FTE ENROLLMENT(MILLIONS)
NOTE: Net tuition revenue used for capital debt service included in the above figures. Constant 2014 dollars adjusted by SHEEO Higher Education Cost Adjustment (HECA).
SOURCE: State Higher Education Executive O�cers
DO
LL
AR
S P
ER
FT
E
PU
BL
IC F
TE
EN
RO
LL
ME
NT
(M
ILL
ION
S)
PUBLIC FTE ENROLLMENT AND EDUCATIONAL APPROPRIATIONS PER FTE, U.S., FISCAL 1989-2014

SHEEO: STATE HIGHER EDUCATION FINANCE: FY 2014 22
FULL-TIME EQUIVALENT ENROLLMENT (FTE)
• Nationally, the explosive enrollment growth at public institutions from 2008 through 2011 tapered off in 2012 (falling 0.5 percent) then continued downward in 2013, falling 2.6 percent. In 2014, enrollment fell another 1.3 percent. Despite these declines, 2014 enrollment is 14.7 percent higher than in 2004 and 49.0 percent higher than in 1989.
• Enrollment grew rapidly from 2000 to 2005, and then more modestly in 2007 (see the “public FTE enrollment” trend line in Figure 2). Growth accelerated again in 2009 (4.6 percent) and 2010 (5.9 percent). 2011 shows more modest growth of 2.5 percent over 2010.
• The rate of enrollment growth normally varies from year to year and state to state in response to the economy and job market as well as underlying demographic factors. During the Great Recession, enrollment growth was more pronounced than during prior downturns. Budget conditions in 2012 and 2013, however, may have had an especially adverse effect on higher education enrollments. Budget-driven enrollment caps, increased tuition and fees, along with the beginnings of economic recovery likely drove enrollments down in 2012 and 2013. The reduction in 2014 is likely due to the recovering economy.
EDUCATIONAL APPROPRIATIONS
• Constant dollar educational appropriations per FTE (see the light blue bars in Figure 2) reached a high of $8,964 in 2001.
• Following four years of decline (2002, 2003, 2004, and 2005), per-student educational appropriations increased in 2006, 2007, and 2008, recovering to $8,081 and then declining each of the following four years to $6,122 in 2012.
• 2013 saw a small increase in appropriations per FTE to $6,215. In constant dollars, 2009 through 2013 had the lowest per FTE appropriations over the last 25 years. 2014 educational appropriations per FTE were $6,552, indicative of a more pronounced economic recovery; however, they were still below historic, pre-recession levels.
Both Figures 2 and 4 provide information on net tuition revenue and states’ growing reliance on this funding source for the general operations and educational delivery at public institutions of higher education.

SHEEO: STATE HIGHER EDUCATION FINANCE: FY 2014 23
SHEF CASE STUDYIMPACT OF BASE YEAR ON PERCENT CHANGES
Every SHEF report has focused on one-year, five-year, and 25-year percent changes for each of the basic SHEF metrics in order to provide historical context and perspective. The selection of a “base” year for any percent-change calculation obviously impacts the end result, and readers should consider the full history when comparing data over time or across states. Large-percent increases, year over year, may be due to growth following a historically-low base. For example, consider 2008 (just before the Great Recession) as the recent high point in educational appropriations per FTE. After annual declines of 6.5, 7.2, 3.9, and 9.1 percent between 2008 and 2012, appropriations per student reached historic constant dollar lows not seen in the entire dataset. It is against these lower base years that future increases will be compared.
For example, the following chart shows the percent change in 2014 educational appropriations compared to base years 2008—2013 and illustrates the impact and importance of considering the context of the data.
FIGURE 3PERCENT CHANGE IN FISCAL 2014 EDUCATIONAL APPROPRIATIONS PER FTE SINCE FISCAL 2008
2008-2014
Percent Change
2009-2014 Percent Change
2010-2014 Percent Change
2011-2014 Percent Change
2012-2014 Percent Change
2013-2014 Percent Change
-18.9% -13.3% -6.6% -2.7% 7.0% 5.4%
SOURCE: State Higher Education Executive Officers
PERCENT CHANGE IN FISCAL 2014 EDUCATIONAL APPROPRIATIONSPER FTE COMPARED TO BASE FISCAL YEARS 2008 - 2013
FIGURE 6
0
$2,000
$4,000
$6,000
$8,000
$10,000
2008
-18.9% -6.6%-13.3% -2.7% +7.0% +5.4%
2014 2009 2014 2010 2014 2011 2014 2012 2014 2013 2014
SHEEO: STATE HIGHER EDUCATION FINANCE: FY 2014 24
FIGURE 4NET TUITION AS A PERCENT OF PUBLIC HIGHER EDUCATION TOTAL EDUCATIONAL REVENUE, U.S., FISCAL 1989-2014
NET TUITION REVENUE
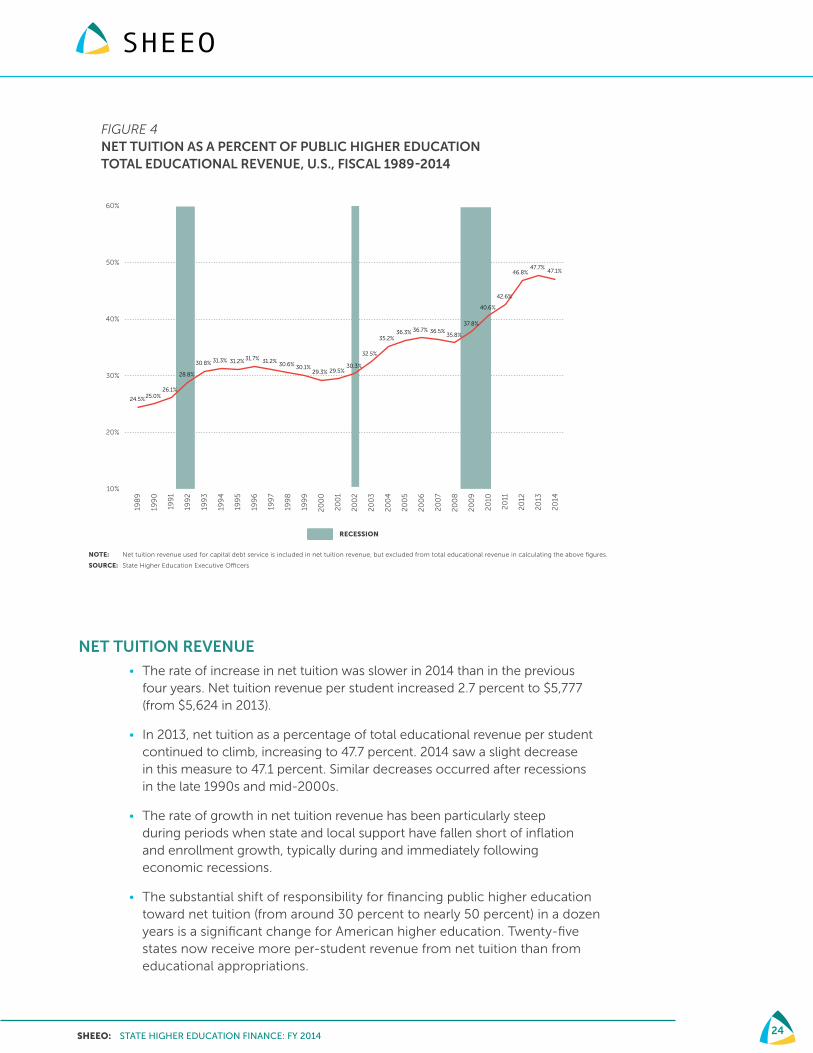
• The rate of increase in net tuition was slower in 2014 than in the previous four years. Net tuition revenue per student increased 2.7 percent to $5,777 (from $5,624 in 2013).
• In 2013, net tuition as a percentage of total educational revenue per student continued to climb, increasing to 47.7 percent. 2014 saw a slight decrease in this measure to 47.1 percent. Similar decreases occurred after recessions in the late 1990s and mid-2000s.
• The rate of growth in net tuition revenue has been particularly steep during periods when state and local support have fallen short of inflation and enrollment growth, typically during and immediately following economic recessions.
• The substantial shift of responsibility for financing public higher education toward net tuition (from around 30 percent to nearly 50 percent) in a dozen years is a significant change for American higher education. Twenty-five states now receive more per-student revenue from net tuition than from educational appropriations.
FIGURE 3
NET TUITION AS A PERCENT OF PUBLIC HIGHER EDUCATIONTOTAL EDUCATIONAL REVENUE, U.S., FISCAL 1989-2014
24.5%25.0%26.1%
28.8%
30.8% 31.3% 31.2% 31.7% 31.2% 30.6% 30.1%29.3% 29.5%
30.3%
32.5%
35.2%36.3% 36.7% 36.5%
35.8%
37.8%
40.6%
42.6%
46.8%47.7%
47.1%
10%
20%
30%
40%
50%
60%
198
9
199
0
199
1
199
2
199
3
199
4
199
5
199
6
199
7
199
8
199
9
20
00
20
01
20
02
20
03
20
04
20
05
20
06
20
07
20
08
20
09
20
10
20
11
20
12
20
13
20
14NOTE: Net tuition revenue used for capital debt service is included in net tuition revenue, but excluded from total educational revenue in calculating the above figures.
SOURCE: State Higher Education Executive O�cers
RECESSION
SHEEO: STATE HIGHER EDUCATION FINANCE: FY 2014 25
SHEF CASE STUDYREVENUE VS. RATE PERCENT CHANGES
Table 6 presents net tuition revenue per student and one-year and five-year percent changes by state and for the U.S. as a whole. The fundamental purpose of SHEF is to measure the revenue available to public institutions of higher education, thus, the report tracks changes in revenue over time. Changes in net tuition revenue should not be construed as being driven entirely by rate increases or associated with rate increases for resident undergraduate students exclusively. SHEF tuition data include resident and non-resident student tuition charges, as well as tuition charges to undergraduate and graduate students.
Changes in tuition revenue are partially due to rate increases, but changes in enrollment mix (e.g., more non-resident students paying a higher tuition rate) significantly impact changes in overall tuition revenue.
As shown in Figures 2 and 4, net tuition revenue has grown most rapidly as a percentage of total educational revenue in public institutions during periods when constant dollar state support per student has declined, that is, during economic downturns. This inverse correlation illustrates the relationship between state support and tuition. This relationship is further supported by SHEEO’s survey on State Tuition, Fees, and Financial Assistance Policies4 where we found that the level of state support was the primary driver of how tuition rates were set each year. Further, most governing boards set tuition in the spring once state support has been established through the budget process. However, if tuition only increased to offset reductions in state support, we would expect to see decreases in tuition when state funding cuts (in constant dollars per FTE student) are restored. The full relationship between the two funding sources is more complicated.
The SHEF data presented in Figures 2 and 4 show the sharpest increases in reliance on tuition revenue during economic downturns, but after each downturn that level of reliance remains relatively steady. Nationally, net tuition accounted for just about 24.5 percent of educational revenue in 1989. Following the recession of 1990-91, the net tuition share of educational revenue grew rapidly to 31 percent where it stayed through the 1990s. In the three years following the recession in 2001, during which enrollment grew rapidly and aggregate state funding remained relatively constant, the net tuition share of total educational revenue rose to 35 percent. Following the Great Recession, net tuition climbed quickly to 47.7 percent in 2013 before beginning to decline in 2014–a sign of continued economic recovery, enrollment declines, and perhaps greater state focus on moderating tuition increases. These figures are nationwide averages. Many states saw much more dramatic increases in each of these periods. In half the states, more support for colleges and universities comes from student tuition fees than from state and local appropriations.
CERTIFICATE AND DEGREE COMPLETION
Many states have adopted completion and attainment goals that are often tied to statewide strategic plans. These goals build upon the efforts of foundations, such as Lumina Foundation,
4. State Tuition, Fees, and Financial Assistance Policies for Public Colleges and Universities 2012-2013. Carlson, A., (2013) SHEEO can be found at www.sheeo.org

SHEEO: STATE HIGHER EDUCATION FINANCE: FY 2014 26
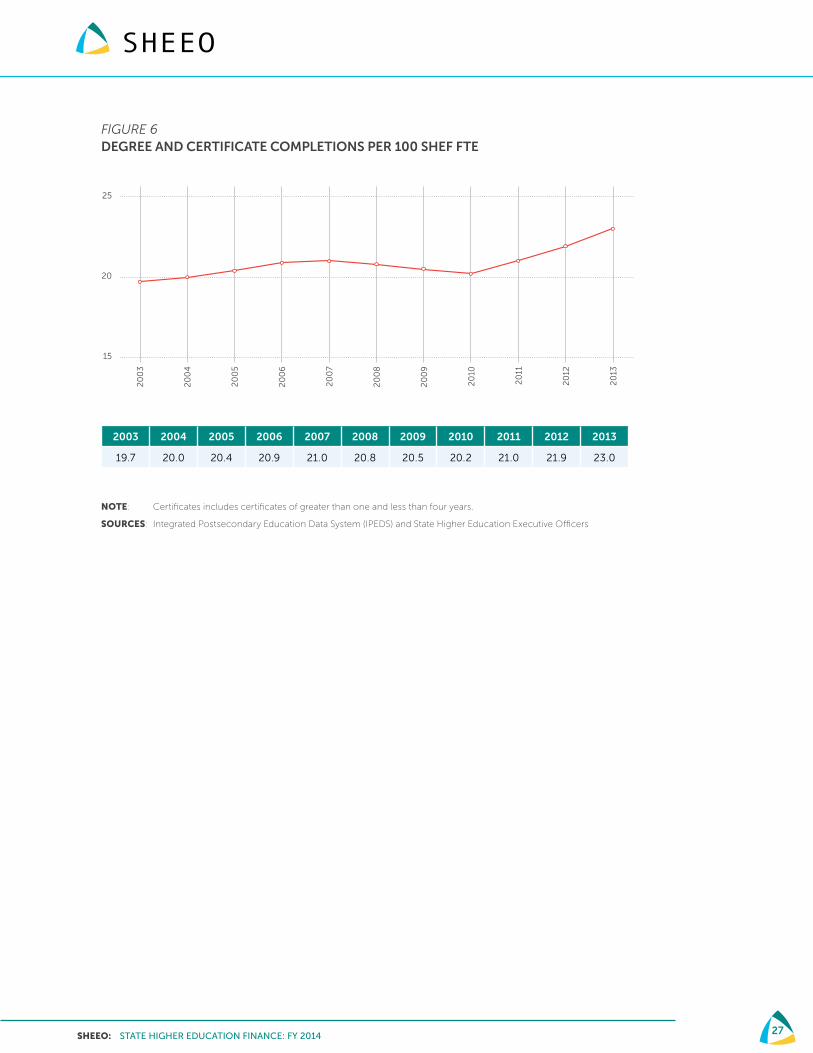
and President Obama’s call to arms to improve educational attainment.5 Using data from the Integrated Postsecondary Education Data System (IPEDS) for 2003-2013 (the most recent years available), for certificate and degree completions6 at public institutions of higher education and SHEF FTE enrollment data, it is possible to compare and track progress towards these attainment goals. Figure 5 shows the ten-year trend in certificate and degree completion (stacked bars) and SHEF FTE enrollment (trend line) from 2003–2013. Figure 6 provides certificates and degrees per 100 SHEF FTE over the same time period, a standard way to normalize the data.
• Over ten years, SHEF FTE grew 18.8 percent to 11,282,232, while certificate and degree production grew 38.5 percent from 1,874,816 to 2,596,852.
• SHEF FTE enrollment peaked in 2011, while certificate and degree production continued to grow in 2012 and 2013, indicating a correlation between enrollment growth and overall completion of degrees and certificates, leading to greater degree production in following years.
• Certificate production grew 41.2 percent, associate degrees grew by 50.5 percent, while bachelor’s degree production grew by 33.0 percent from 2003-2013.
• Over this ten-year period, certificates and degrees per 100 FTE grew 16.6 percent, with the greatest growth occurring over the last three years—possibly the result of greater focus on student success at the state and institution levels.
FIGURE 5DEGREE AND CERTIFICATE COMPLETIONS BY LEVEL AND SHEF FTE ENROLLMENT
DEGREE AND CERTIFICATE COMPLETIONS BY LEVEL AND SHEF FTE ENROLLMENT
2
4
6
8
10
12
14
00
50,0000
1,000,000
1,500,000
2,000,000
2,500,000
3,000,000
2003 2004 2005 2006 2007 2008 2009 2010 2011 2012 2013
CERTIFICATES ASSOCIATE DEGREES BACHELOR'S DEGREES MASTER'S DEGREES DOCTORAL DEGREES
SHEF FTE ENROLLMENT
FIGURE 4
NOTE: Certificates includes certificates of greater than one and less than four years.
SOURCES: Integrated Postsecondary Education Data System (IPEDS) and State Higher Education Executive O�cers
PU
BL
IC F
TE
EN
RO
LL
ME
NT
(M
ILL
ION
S)
CO
MP
LE
TIO
NS
5. https://www.whitehouse.gov/issues/education/higher-education
6. SHEEO’s calculations from the Completions Survey of the Integrated Postsecondary Data Systems (IPEDS). Includes only certificates greater than 1-Year and Less than 4-Years and all degrees awarded at public institutions.
SHEEO: STATE HIGHER EDUCATION FINANCE: FY 2014 27
FIGURE 6DEGREE AND CERTIFICATE COMPLETIONS PER 100 SHEF FTE
2003 2004 2005 2006 2007 2008 2009 2010 2011 2012 2013
19.7 20.0 20.4 20.9 21.0 20.8 20.5 20.2 21.0 21.9 23.0
NOTE: Certificates includes certificates of greater than one and less than four years.
SOURCES: Integrated Postsecondary Education Data System (IPEDS) and State Higher Education Executive Officers
DEGREE AND CERTIFICATE COMPLETIONS PER 100 SHEF FTE
20
03
20
04
20
05
20
06
20
07
20
08
20
09
20
10
20
11
20
12
20
13
15
20
25
FIGURE 5
NOTE: Certificates includes certificates of greater than one and less than four years.
SOURCES: Integrated Postsecondary Education Data System (IPEDS) and State Higher Education Executive O�cers
SHEEO: STATE HIGHER EDUCATION FINANCE: FY 2014 28
INTERSTATE COMPARISONS—MAKING SENSE OF MANY VARIABLES
National averages and trends often mask substantial variation and important differences across the 50 states. This section provides ways to examine interstate differences more closely. First, it explains in greater detail the adjustments SHEF makes to state-level data. Next, it illustrates differences across single variables or dimensions of higher education financing, for example, rates of enrollment growth or the varying proportions of public versus tuition financing.
SHEF ADJUSTMENTS TO FACILITATE INTERSTATE COMPARISONS
Many factors affect the decisions and relative positions of states in their funding of higher education. Although no comparative analysis can take all of these into account, SHEF makes two adjustments to reflect the most basic differences—differences in the cost of living across states and in the public postsecondary enrollment mix among different types of institutions.
Technical Paper Table 1 (in Technical Paper B on the SHEF webpage) shows the impact of SHEF cost of living and enrollment mix adjustments on total educational revenue per FTE. These adjustments tend to draw states toward the national average; for example, states with a high cost of living also often tend to support higher education at above average levels, in which cases, the SHEF adjustments for living costs reduce the extent of their above average higher education revenues per student. The size and direction of these adjustments vary across states. In brief:
• In states where the cost of living exceeds the national average, dollars per FTE are adjusted downward (e.g., Massachusetts). In states where the cost of living is below the national average, dollars per FTE are adjusted upward (e.g., Arkansas).
• If the proportion of enrollment in higher-cost institutions (e.g., research institutions) exceeds the national average, the dollars per FTE are adjusted downward. In states with a relatively inexpensive enrollment mix (e.g., more community colleges), the dollars per FTE are adjusted upward.7
• Dollars per FTE are adjusted upward the most in states with an inexpensive enrollment mix and low cost of living (e.g., Mississippi). The reverse is true for states that possess both a more expensive enrollment mix and a higher cost of living (e.g., Colorado). In some states, the two factors cancel out each other (e.g., Washington).
7. SHEEO’s Enrollment Mix Index adjusts state metrics based on the distribution of enrollment across institution type in a state. The adjustment does not account for distribution of students across educational level or the discipline mix offered across a state’s institutions.

SHEEO: STATE HIGHER EDUCATION FINANCE: FY 2014 29
COMPARING STATES ACROSS SINGLE DIMENSIONS OR VARIABLES
This section illustrates the variability across states and over time with respect to higher education enrollment growth, total state and local appropriations, the proportion of tuition-derived revenue, total revenue available for public educational programs, and current funding in the context of each state’s average national position over the past 25 years.
Figure 7 (and the accompanying data in Table 4) shows changes in full-time equivalent enrollment (FTE) in public higher education by state for the five years between 2009 and 2014, and also since the Great Recession (2008).
• Forty-three of the fifty states have seen enrollment growth over the last five years, ranging from 0.7 percent in Maryland to 25.7 percent in Idaho. Seven states saw declines over this time period ranging from 17.8 percent in Illinois to 0.1 percent in Wisconsin. The U.S. average is 3.9 percent growth over the five-year time period.
• Since the Great Recession, enrollment growth is up 8.6 percent nationally, with 49 states higher than they were in 2008.
• Thirteen states saw enrollment growth of more than 10 percent, while three states exceeded 15 percent.
• Between 2013 and 2014, enrollment declined 1.3 percent nationally and most states saw declines in enrollment.
FIGURE 7FULL-TIME EQUIVALENT (FTE) ENROLLMENT IN PUBLIC HIGHER EDUCATION PERCENT CHANGE BY STATE, FISCAL 2009-2014
FIGURE 4
-20%
-15%
-10%
-5%
0%
5%
10%
15%
20%
25%
30%
ILLI
NO
IS
CA
LIFO
RN
IA
MIC
HIG
AN
NE
VA
DA
ALA
BA
MA
LOU
ISIA
NA
WIS
CO
NSI
N
MA
RY
LAN
D
NO
RT
H D
AK
OT
A
VE
RM
ON
T
PE
NN
SYLV
AN
IA
MIN
NE
SOT
A
MA
INE
RH
OD
E IS
LAN
D
WE
ST V
IRG
INIA
NE
BR
ASK
A
OH
IO
NE
W Y
OR
K
WA
SHIN
GT
ON
IND
IAN
A
US
NO
RT
H C
AR
OLI
NA
GE
OR
GIA
WY
OM
ING
KA
NSA
S
TE
NN
ESS
EE
KE
NT
UC
KY
ALA
SKA
FLO
RID
A
CO
LOR
AD
O
NE
W H
AM
PSH
IRE
VIR
GIN
IA
MO
NT
AN
A
SOU
TH
DA
KO
TA
IOW
A
SOU
TH
CA
RO
LIN
A
HA
WA
II
AR
IZO
NA
DE
LAW
AR
E
CO
NN
EC
TIC
UT
NE
W M
EX
ICO
AR
KA
NSA
S
MIS
SISS
IPP
I
MIS
SOU
RI
MA
SSA
CH
USE
TT
S
UT
AH
NE
W J
ER
SEY
OK
LAH
OM
A
OR
EG
ON
TE
XA
S
IDA
HO
3.9%
-17.8%
25.7%
FULL-TIME EQUIVALENT (FTE) ENROLLMENT IN PUBLIC HIGHER EDUCATIONPERCENT CHANGE BY STATE, FISCAL 2009-14
SOURCE: State Higher Education Executive O�cers

SHEEO: STATE HIGHER EDUCATION FINANCE: FY 2014 30
TABLE 4PUBLIC HIGHER EDUCATION FULL-TIME EQUIVALENT (FTE) ENROLLMENT
FY 2008
(Pre-recession) FY 2009 FY 2013 FY 2014
1 Year % Change
5 Year % Change
% Change Since
Recession
ALABAMA 187,086 199,153 197,110 195,693 -0.7% -1.7% 4.6%
ALASKA 18,703 19,010 21,131 20,464 -3.2% 7.6% 9.4%
ARIZONA 233,255 245,680 270,644 269,902 -0.3% 9.9% 15.7%
ARKANSAS 107,428 108,474 122,431 119,608 -2.3% 10.3% 11.3%
CALIFORNIA 1,507,467 1,624,753 1,479,181 1,511,300 2.2% -7.0% 0.3%
COLORADO 164,638 171,564 188,405 184,836 -1.9% 7.7% 12.3%
CONNECTICUT 77,088 80,433 87,810 88,681 1.0% 10.3% 15.0%
DELAWARE 31,619 32,417 34,715 35,657 2.7% 10.0% 12.8%
FLORIDA 540,823 564,963 619,195 608,221 -1.8% 7.7% 12.5%
GEORGIA 310,759 330,866 354,989 347,733 -2.0% 5.1% 11.9%
HAWAII 35,469 37,070 41,088 40,417 -1.6% 9.0% 14.0%
IDAHO 43,968 44,705 57,837 56,177 -2.9% 25.7% 27.8%
ILLINOIS 391,386 397,018 375,190 326,329 -13.0% -17.8% -16.6%
INDIANA 230,323 239,827 252,848 249,019 -1.5% 3.8% 8.1%
IOWA 115,011 117,254 129,669 127,407 -1.7% 8.7% 10.8%
KANSAS 127,117 129,377 140,182 138,310 -1.3% 6.9% 8.8%
KENTUCKY 142,382 144,641 155,586 154,788 -0.5% 7.0% 8.7%
LOUISIANA 165,781 169,602 174,552 168,001 -3.8% -0.9% 1.3%
MAINE 35,533 35,968 37,342 36,577 -2.0% 1.7% 2.9%
MARYLAND 207,255 231,079 238,886 232,684 -2.6% 0.7% 12.3%
MASSACHUSETTS 148,288 155,387 171,974 172,574 0.3% 11.1% 16.4%
MICHIGAN 395,019 409,270 411,773 399,953 -2.9% -2.3% 1.2%
MINNESOTA 196,014 200,732 210,546 204,046 -3.1% 1.7% 4.1%
MISSISSIPPI 117,556 118,572 133,732 131,104 -2.0% 10.6% 11.5%
MISSOURI 164,160 177,751 196,659 196,831 0.1% 10.7% 19.9%
MONTANA 35,556 36,388 40,169 39,484 -1.7% 8.5% 11.0%
NEBRASKA 75,451 77,825 81,175 79,704 -1.8% 2.4% 5.6%
NEVADA 63,324 65,665 65,917 64,497 -2.2% -1.8% 1.9%
NEW HAMPSHIRE 32,982 34,311 39,224 36,988 -5.7% 7.8% 12.1%
NEW JERSEY 238,040 246,215 276,052 274,341 -0.6% 11.4% 15.2%
NEW MEXICO 85,203 89,450 101,239 98,630 -2.6% 10.3% 15.8%
NEW YORK 526,538 547,845 571,801 565,830 -1.0% 3.3% 7.5%
NORTH CAROLINA 357,601 385,792 410,622 402,199 -2.1% 4.3% 12.5%
NORTH DAKOTA 34,955 36,408 37,122 36,927 -0.5% 1.4% 5.6%
OHIO 375,932 391,546 400,796 401,874 0.3% 2.6% 6.9%
OKLAHOMA 131,191 127,058 144,138 145,401 0.9% 14.4% 10.8%
OREGON 129,626 141,532 165,564 165,480 -0.1% 16.9% 27.7%
PENNSYLVANIA 343,043 353,494 364,468 358,820 -1.5% 1.5% 4.6%
RHODE ISLAND 30,120 30,774 31,701 31,309 -1.2% 1.7% 3.9%
SOUTH CAROLINA 150,333 158,252 175,321 172,049 -1.9% 8.7% 14.4%
SOUTH DAKOTA 29,595 31,027 32,945 33,677 2.2% 8.5% 13.8%
TENNESSEE 173,706 178,100 196,097 190,485 -2.9% 7.0% 9.7%
TEXAS 804,918 822,131 1,002,892 994,745 -0.8% 21.0% 23.6%
UTAH 103,320 107,649 123,851 119,692 -3.4% 11.2% 15.8%
VERMONT 19,797 20,654 21,319 20,955 -1.7% 1.5% 5.8%
VIRGINIA 281,940 294,436 320,481 318,166 -0.7% 8.1% 12.8%
WASHINGTON 221,264 236,742 248,273 245,011 -1.3% 3.5% 10.7%
WEST VIRGINIA 73,525 74,864 78,458 76,202 -2.9% 1.8% 3.6%
WISCONSIN 219,006 224,113 229,463 223,777 -2.5% -0.1% 2.2%
WYOMING 23,054 23,628 25,669 24,986 -2.7% 5.7% 8.4%
U.S. 10,254,148 10,721,466 11,288,232 11,137,541 -1.3% 3.9% 8.6%
Notes:
1) Full-time equivalent enrollment equates student credit hours to full-time, academic year students, but excludes medical students.
Source: State Higher Education Executive Officers

SHEEO: STATE HIGHER EDUCATION FINANCE: FY 2014 31
Figure 8 (and the accompanying data in Table 5) shows the percent change by state in higher education appropriations per public FTE student between 2009 and 2014. The national average per-FTE funding for 2014 increased 5.4 percent over 2013 to $6,552 (see Table 5). This is the second consecutive year of per-student funding growth; however, educational appropriations per FTE remain 18.9 percent lower than in 2008 (the recent high point for funding prior to the Great Recession), and 13.3 percent lower than in 2009.
• Three states—Alaska, North Dakota, and Illinois—increased constant dollar per-student support for public institutions during the five-year period from 2009 to 2014. In Illinois, the increases were primarily to cover historical underfunding of pension programs. (Note: See the case studies for more detail on the funding situation in Illinois and for the oil-dependent states.)
• Forty-seven states decreased constant dollar per-student funding during this five-year period, 21 by more than 20 percent.
• Federal funds available through the American Recovery and Reinvestment Act were used to fill shortfalls in state support for general operating expenses at public colleges and universities in 2009, 2010, and 2011. These funds were largely spent by 2012 and were no longer available in 2013 or 2014.
FIGURE 8EDUCATIONAL APPROPRIATIONS PER FTE PERCENT CHANGE BY STATE, FISCAL 2009-2014
-40%
-30%
-20%
-10%
0%
10%
20%
30%
40%
50%
LOU
ISIA
NA
PE
NN
SYLV
AN
IA
AR
IZO
NA
CO
LOR
AD
O
NE
W H
AM
PSH
IRE
IDA
HO
NE
VA
DA
MIS
SOU
RI
HA
WA
II
OH
IO
OR
EG
ON
NE
W J
ER
SEY
VIR
GIN
IA
DE
LAW
AR
E
CO
NN
EC
TIC
UT
IOW
A
TE
NN
ESS
EE
OK
LAH
OM
A
FLO
RID
A
WA
SHIN
GT
ON
MIN
NE
SOT
A
SOU
TH
CA
RO
LIN
A
MIC
HIG
AN
KE
NT
UC
KY
WIS
CO
NSI
N
ALA
BA
MA
UT
AH
MIS
SISS
IPP
I
KA
NSA
S
GE
OR
GIA US
SOU
TH
DA
KO
TA
WE
ST V
IRG
INIA
NO
RT
H C
AR
OLI
NA
MA
SSA
CH
USE
TT
S
NE
W M
EX
ICO
MA
INE
TE
XA
S
RH
OD
E IS
LAN
D
WY
OM
ING
MO
NT
AN
A
IND
IAN
A
CA
LIFO
RN
IA
MA
RY
LAN
D
AR
KA
NSA
S
VE
RM
ON
T
NE
W Y
OR
K
NE
BR
ASK
A
ALA
SKA
NO
RT
H D
AK
OT
A
ILLI
NO
IS
-13.3%
-38.4%
49.5%
EDUCATIONAL APPROPRIATIONS PER FTE PERCENT CHANGE BY STATE, FISCAL 2009-14FIGURE 5
NOTE: Dollars adjusted by 2014 HECA, Cost of Living Adjustment, and Enrollment Index
SOURCE: State Higher Education Executive O�cers

SHEEO: STATE HIGHER EDUCATION FINANCE: FY 2014 32
TABLE 5EDUCATIONAL APPROPRIATIONS PER FTE (CONSTANT ADJUSTED 2014 DOLLARS)
FY 2008
(Pre-recession) FY 2009 FY 2013 FY 2014
1 Year % Change
FY 2014 Index to US
Average
5 Year % Change
% Change Since
Recession
ALABAMA 9,278 6,888 5,694 5,673 -0.4% 0.87 -17.6% -38.9%
ALASKA 13,214 13,650 13,188 13,978 6.0% 2.13 2.4% 5.8%
ARIZONA 8,046 7,736 5,056 5,171 2.3% 0.79 -33.2% -35.7%
ARKANSAS 8,123 7,987 7,731 7,653 -1.0% 1.17 -4.2% -5.8%
CALIFORNIA 8,825 7,938 7,252 7,509 3.5% 1.15 -5.4% -14.9%
COLORADO 4,173 4,514 2,822 3,022 7.1% 0.46 -33.0% -27.6%
CONNECTICUT 9,763 9,192 6,509 7,192 10.5% 1.10 -21.8% -26.3%
DELAWARE 6,682 6,476 4,954 5,052 2.0% 0.77 -22.0% -24.4%
FLORIDA 8,494 7,320 4,879 5,798 18.9% 0.88 -20.8% -31.7%
GEORGIA 9,496 8,497 6,836 7,297 6.7% 1.11 -14.1% -23.2%
HAWAII 10,129 10,255 7,532 7,618 1.1% 1.16 -25.7% -24.8%
IDAHO 10,520 10,266 6,676 7,004 4.9% 1.07 -31.8% -33.4%
ILLINOIS 8,187 8,223 9,626 12,293 27.7% 1.88 49.5% 50.2%
INDIANA 5,236 5,321 4,501 5,005 11.2% 0.76 -5.9% -4.4%
IOWA 6,739 6,810 5,112 5,335 4.4% 0.81 -21.7% -20.8%
KANSAS 6,924 6,711 5,745 5,648 -1.7% 0.86 -15.8% -18.4%
KENTUCKY 9,034 8,428 6,884 6,824 -0.9% 1.04 -19.0% -24.5%
LOUISIANA 9,426 9,096 5,625 5,606 -0.3% 0.86 -38.4% -40.5%
MAINE 7,170 6,920 6,096 6,252 2.5% 0.95 -9.7% -12.8%
MARYLAND 8,583 7,926 7,022 7,512 7.0% 1.15 -5.2% -12.5%
MASSACHUSETTS 7,898 6,805 5,785 6,073 5.0% 0.93 -10.8% -23.1%
MICHIGAN 6,179 5,905 4,564 4,765 4.4% 0.73 -19.3% -22.9%
MINNESOTA 7,007 6,680 4,814 5,327 10.7% 0.81 -20.2% -24.0%
MISSISSIPPI 8,534 7,775 6,274 6,514 3.8% 0.99 -16.2% -23.7%
MISSOURI 7,335 7,172 5,311 5,297 -0.3% 0.81 -26.1% -27.8%
MONTANA 5,205 5,274 4,379 4,939 12.8% 0.75 -6.4% -5.1%
NEBRASKA 8,300 7,976 7,503 7,840 4.5% 1.20 -1.7% -5.5%
NEVADA 10,140 9,678 6,826 7,016 2.8% 1.07 -27.5% -30.8%
NEW HAMPSHIRE 3,536 3,483 1,724 2,360 36.8% 0.36 -32.3% -33.3%
NEW JERSEY 7,698 7,206 5,658 5,520 -2.4% 0.84 -23.4% -28.3%
NEW MEXICO 10,530 8,985 8,269 8,029 -2.9% 1.23 -10.6% -23.7%
NEW YORK 8,868 8,659 8,129 8,454 4.0% 1.29 -2.4% -4.7%
NORTH CAROLINA 10,933 9,619 8,851 8,562 -3.3% 1.31 -11.0% -21.7%
NORTH DAKOTA 5,736 5,420 6,688 7,888 17.9% 1.20 45.5% 37.5%
OHIO 5,638 5,777 4,249 4,314 1.5% 0.66 -25.3% -23.5%
OKLAHOMA 8,998 8,951 7,193 7,080 -1.6% 1.08 -20.9% -21.3%
OREGON 5,972 5,587 3,952 4,214 6.6% 0.64 -24.6% -29.4%
PENNSYLVANIA 5,836 5,645 3,633 3,654 0.6% 0.56 -35.3% -37.4%
RHODE ISLAND 6,172 5,169 4,547 4,690 3.2% 0.72 -9.3% -24.0%
SOUTH CAROLINA 7,705 6,092 4,891 4,894 0.0% 0.75 -19.7% -36.5%
SOUTH DAKOTA 6,034 5,618 4,872 4,878 0.1% 0.74 -13.2% -19.2%
TENNESSEE 9,029 8,875 6,266 6,959 11.0% 1.06 -21.6% -22.9%
TEXAS 9,444 8,895 7,366 8,050 9.3% 1.23 -9.5% -14.8%
UTAH 7,406 6,648 5,106 5,506 7.8% 0.84 -17.2% -25.7%
VERMONT 3,166 2,889 2,708 2,816 4.0% 0.43 -2.5% -11.0%
VIRGINIA 6,469 6,215 4,635 4,779 3.1% 0.73 -23.1% -26.1%
WASHINGTON 7,616 7,178 4,945 5,700 15.3% 0.87 -20.6% -25.2%
WEST VIRGINIA 7,463 6,319 5,887 5,530 -6.1% 0.84 -12.5% -25.9%
WISCONSIN 7,071 7,100 5,990 5,786 -3.4% 0.88 -18.5% -18.2%
WYOMING 16,428 17,123 16,800 15,561 -7.4% 2.38 -9.1% -5.3%
U.S. 8,081 7,553 6,215 6,552 5.4% -13.3% -18.9%
Notes:
1) Educational appropriations are a measure of state and local support available for public higher education operating expenses including ARRA funds, and exclude appropriations for independent institutions, financial aid for students attending independent institutions, research, hospitals, and medical education.
2) Adjustment factors, to arrive at constant dollar figures, include Cost of Living Adjustment (COLA), Enrollment Mix Index (EMI), and Higher Education Cost Adjustment (HECA).The Cost of Living Adjustment (COLA) is not a measure of inflation over time.
Source: State Higher Education Executive Officers

SHEEO: STATE HIGHER EDUCATION FINANCE: FY 2014 33
Figure 9 shows net tuition revenue as a percent of total educational revenue for public higher education by state for 2014. The accompanying Table 6 shows the dollar values of net tuition per FTE by state.
• States vary widely in the percent of educational revenue supported by net tuition, from a low of 15.1 percent in Wyoming to a high of 84.5 percent in Vermont.
• Reliance on net tuition revenue fell slightly in 2014 from 47.7 percent to 47.1 percent.
• Twenty-eight states are above the national average of 47.1 percent in the proportion of educational revenue from tuition sources, while 15 states are above 60.0 percent.
FIGURE 9NET TUITION AS A PERCENT OF PUBLIC HIGHER EDUCATION TOTAL EDUCATIONAL REVENUE BY STATE, FISCAL 2014
0%
20%
40%
60%
80%
100%
WY
OM
ING
CA
LIFO
RN
IA
ALA
SKA
NE
W M
EX
ICO
NO
RT
H C
AR
OLI
NA
HA
WA
II
FLO
RID
A
ILLI
NO
IS
NE
W Y
OR
K
NE
VA
DA
IDA
HO
GE
OR
GIA
TE
XA
S
MIS
SISS
IPP
I
NE
BR
ASK
A
AR
KA
NSA
S
OK
LAH
OM
A
MA
SSA
CH
USE
TT
S
LOU
ISIA
NA
NO
RT
H D
AK
OT
A
UT
AH
TE
NN
ESS
EE
US
WA
SHIN
GT
ON
KE
NT
UC
KY
WIS
CO
NSI
N
MA
RY
LAN
D
KA
NSA
S
MIS
SOU
RI
CO
NN
EC
TIC
UT
MO
NT
AN
A
MIN
NE
SOT
A
IND
IAN
A
MA
INE
AR
IZO
NA
NE
W J
ER
SEY
IOW
A
WE
ST V
IRG
INIA
OR
EG
ON
VIR
GIN
IA
OH
IO
ALA
BA
MA
SOU
TH
CA
RO
LIN
A
SOU
TH
DA
KO
TA
MIC
HIG
AN
RH
OD
E IS
LAN
D
PE
NN
SYLV
AN
IA
CO
LOR
AD
O
DE
LAW
AR
E
NE
W H
AM
PSH
IRE
VE
RM
ON
T
47.1%
15.1%
84.5%
NET TUITION AS A PERCENT OF PUBLIC HIGHER EDUCATIONTOTAL EDUCATIONAL REVENUE BY STATE, FISCAL 2014
FIGURE 6
SOURCE: State Higher Education Executive O�cers

SHEEO: STATE HIGHER EDUCATION FINANCE: FY 2014 34
TABLE 6PUBLIC HIGHER EDUCATION NET TUITION REVENUE PER FTE (CONSTANT ADJUSTED 2014 DOLLARS)
FY 2009 FY 2013 FY 2014 1 Year % Change
FY 2014 Index to US Average
5 Year % Change
ALABAMA 6,616 10,088 9,905 -1.8% 1.71 49.7%
ALASKA 4,606 5,024 4,982 -0.8% 0.86 8.2%
ARIZONA 4,676 5,938 6,518 9.8% 1.13 39.4%
ARKANSAS 4,648 4,383 4,951 13.0% 0.86 6.5%
CALIFORNIA 1,631 2,207 2,084 -5.6% 0.36 27.8%
COLORADO 5,861 7,352 8,115 10.4% 1.40 38.5%
CONNECTICUT 6,464 6,931 7,749 11.8% 1.34 19.9%
DELAWARE 10,664 13,660 13,835 1.3% 2.39 29.7%
FLORIDA 2,039 3,171 3,121 -1.6% 0.54 53.0%
GEORGIA 2,224 4,358 4,468 2.5% 0.77 100.9%
HAWAII 3,204 3,805 3,932 3.3% 0.68 22.7%
IDAHO 2,705 4,008 4,261 6.3% 0.74 57.5%
ILLINOIS 4,013 5,420 6,664 23.0% 1.15 66.0%
INDIANA 5,897 6,627 6,685 0.9% 1.16 13.4%
IOWA 6,540 7,650 8,118 6.1% 1.41 24.1%
KANSAS 4,904 5,638 5,885 4.4% 1.02 20.0%
KENTUCKY 5,544 6,197 6,327 2.1% 1.10 14.1%
LOUISIANA 2,837 4,294 4,568 6.4% 0.79 61.0%
MAINE 8,033 8,389 8,400 0.1% 1.45 4.6%
MARYLAND 6,958 7,704 7,626 -1.0% 1.32 9.6%
MASSACHUSETTS 5,361 4,961 4,929 -0.6% 0.85 -8.1%
MICHIGAN 8,533 10,544 10,962 4.0% 1.90 28.5%
MINNESOTA 5,567 7,852 7,111 -9.4% 1.23 27.7%
MISSISSIPPI 3,795 4,142 4,433 7.0% 0.77 16.8%
MISSOURI 5,059 5,353 5,544 3.6% 0.96 9.6%
MONTANA 5,182 5,481 5,505 0.4% 0.95 6.2%
NEBRASKA 4,204 5,190 5,401 4.1% 0.93 28.5%
NEVADA 3,123 3,934 3,995 1.5% 0.69 27.9%
NEW HAMPSHIRE 8,477 9,700 9,857 1.6% 1.71 16.3%
NEW JERSEY 7,036 7,454 8,048 8.0% 1.39 14.4%
NEW MEXICO 2,074 3,399 3,760 10.6% 0.65 81.3%
NEW YORK 3,907 4,517 4,771 5.6% 0.83 22.1%
NORTH CAROLINA 3,088 4,030 4,317 7.1% 0.75 39.8%
NORTH DAKOTA 6,270 6,615 6,752 2.1% 1.17 7.7%
OHIO 6,365 7,475 7,344 -1.8% 1.27 15.4%
OKLAHOMA 4,742 5,146 5,352 4.0% 0.93 12.9%
OREGON 4,873 6,513 6,577 1.0% 1.14 35.0%
PENNSYLVANIA 8,295 9,079 9,236 1.7% 1.60 11.3%
RHODE ISLAND 9,402 11,023 10,971 -0.5% 1.90 16.7%
SOUTH CAROLINA 6,370 8,214 8,432 2.7% 1.46 32.4%
SOUTH DAKOTA 5,789 7,970 8,221 3.1% 1.42 42.0%
TENNESSEE 4,344 5,603 6,040 7.8% 1.05 39.0%
TEXAS 4,524 5,067 5,125 1.2% 0.89 13.3%
UTAH 3,539 4,635 4,869 5.0% 0.84 37.6%
VERMONT 13,034 13,085 12,951 -1.0% 2.24 -0.6%
VIRGINIA 6,176 7,681 7,709 0.4% 1.33 24.8%
WASHINGTON 3,215 5,070 5,256 3.7% 0.91 63.5%
WEST VIRGINIA 5,972 6,305 7,216 14.4% 1.25 20.8%
WISCONSIN 4,170 5,213 5,419 4.0% 0.94 30.0%
WYOMING 2,306 2,656 2,761 3.9% 0.48 19.7%
U.S. 4,560 5,624 5,777 2.7% 26.7%
Notes:
1) Net Tuition Revenue is calculated by taking the gross amount of tuition and fees, less state and institutional financial aid, tuition waivers or discounts, and medical student tuition and fees. Net tuition revenue used for capital debt service is included in the net tuition revenue figures above.
2) Adjustment factors, to arrive at constant dollar figures, include Cost of Living Adjustment (COLA), Enrollment Mix Index (EMI), and Higher Education Cost Adjustment (HECA).The Cost of Living Adjustment (COLA) is not a measure of inflation over time.
Source: State Higher Education Executive Officers
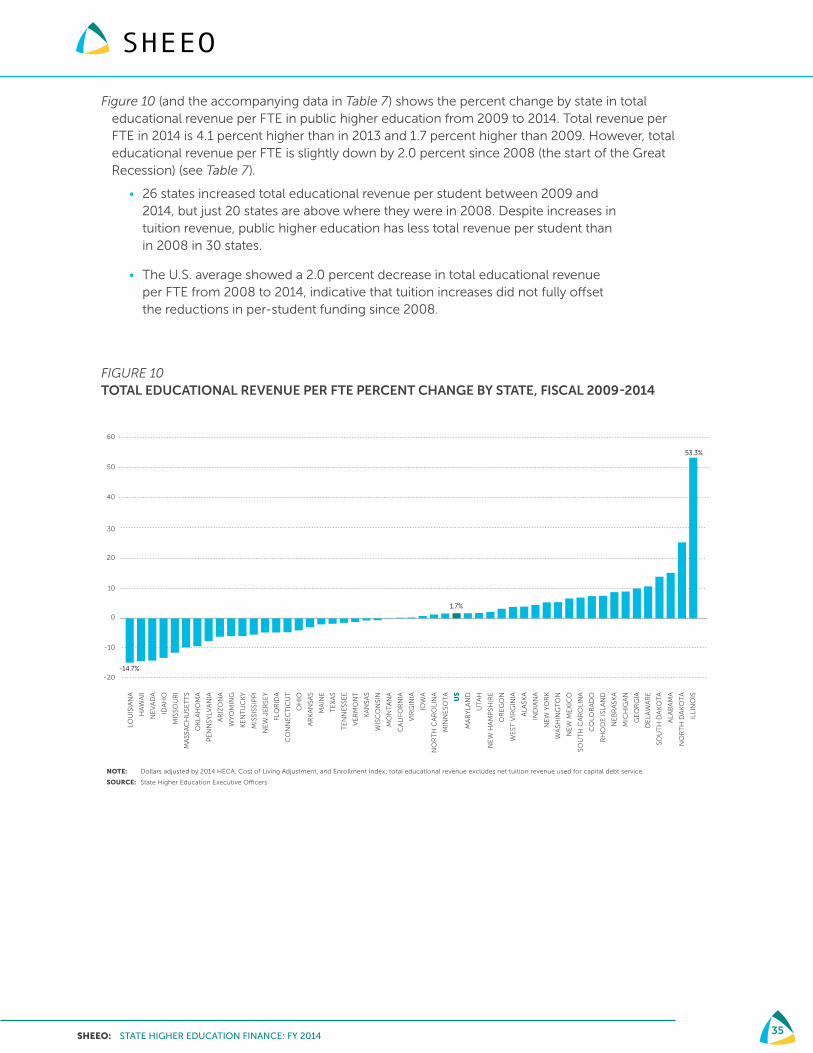
SHEEO: STATE HIGHER EDUCATION FINANCE: FY 2014 35
Figure 10 (and the accompanying data in Table 7) shows the percent change by state in total educational revenue per FTE in public higher education from 2009 to 2014. Total revenue per FTE in 2014 is 4.1 percent higher than in 2013 and 1.7 percent higher than 2009. However, total educational revenue per FTE is slightly down by 2.0 percent since 2008 (the start of the Great Recession) (see Table 7).
• 26 states increased total educational revenue per student between 2009 and 2014, but just 20 states are above where they were in 2008. Despite increases in tuition revenue, public higher education has less total revenue per student than in 2008 in 30 states.
• The U.S. average showed a 2.0 percent decrease in total educational revenue per FTE from 2008 to 2014, indicative that tuition increases did not fully offset the reductions in per-student funding since 2008.
FIGURE 10TOTAL EDUCATIONAL REVENUE PER FTE PERCENT CHANGE BY STATE, FISCAL 2009-2014
1.7%
-14.7%
53.3%
LOU
ISIA
NA
HA
WA
II
NE
VA
DA
IDA
HO
MIS
SOU
RI
MA
SSA
CH
USE
TT
S
OK
LAH
OM
A
PE
NN
SYLV
AN
IA
AR
IZO
NA
WY
OM
ING
KE
NT
UC
KY
MIS
SISS
IPP
I
NE
W J
ER
SEY
FLO
RID
A
CO
NN
EC
TIC
UT
OH
IO
AR
KA
NSA
S
MA
INE
TE
XA
S
TE
NN
ESS
EE
VE
RM
ON
T
KA
NSA
S
WIS
CO
NSI
N
MO
NT
AN
A
CA
LIFO
RN
IA
VIR
GIN
IA
IOW
A
NO
RT
H C
AR
OLI
NA
MIN
NE
SOT
A
US
MA
RY
LAN
D
UT
AH
NE
W H
AM
PSH
IRE
OR
EG
ON
WE
ST V
IRG
INIA
ALA
SKA
IND
IAN
A
NE
W Y
OR
K
WA
SHIN
GT
ON
NE
W M
EX
ICO
SOU
TH
CA
RO
LIN
A
CO
LOR
AD
O
RH
OD
E IS
LAN
D
NE
BR
ASK
A
MIC
HIG
AN
GE
OR
GIA
DE
LAW
AR
E
SOU
TH
DA
KO
TA
ALA
BA
MA
NO
RT
H D
AK
OT
A
ILLI
NO
IS
TOTAL EDUCATIONAL REVENUE PER FTE PERCENT CHANGE BY STATE, FISCAL 2009-2014
-20
-10
0
10
20
30
40
50
60
FIGURE 7
NOTE: Dollars adjusted by 2014 HECA, Cost of Living Adjustment, and Enrollment Index; total educational revenue excludes net tuition revenue used for capital debt service.
SOURCE: State Higher Education Executive O�cers

SHEEO: STATE HIGHER EDUCATION FINANCE: FY 2014 36
TABLE 7TOTAL EDUCATIONAL REVENUE PER FTE (CONSTANT ADJUSTED 2014 DOLLARS)
FY 2008
(Pre-recession) FY 2009 FY 2013 FY 2014
1 Year % Change
FY 2014 Index to US
Average
5 Year % Change
% Change Since
Recession
ALABAMA 15,079 12,970 15,113 14,927 -1.2% 1.22 15.1% -1.0%
ALASKA 17,677 18,256 18,212 18,960 4.1% 1.55 3.9% 7.3%
ARIZONA 12,114 12,074 10,667 11,339 6.3% 0.92 -6.1% -6.4%
ARKANSAS 11,632 12,082 11,071 11,731 6.0% 0.96 -2.9% 0.8%
CALIFORNIA 10,245 9,569 9,459 9,593 1.4% 0.78 0.2% -6.4%
COLORADO 9,702 10,375 10,174 11,138 9.5% 0.91 7.4% 14.8%
CONNECTICUT 16,108 15,656 13,439 14,941 11.2% 1.22 -4.6% -7.2%
DELAWARE 16,867 17,045 18,578 18,852 1.5% 1.54 10.6% 11.8%
FLORIDA 10,937 9,360 8,049 8,919 10.8% 0.73 -4.7% -18.4%
GEORGIA 11,833 10,701 11,177 11,757 5.2% 0.96 9.9% -0.6%
HAWAII 12,943 13,458 11,337 11,550 1.9% 0.94 -14.2% -10.8%
IDAHO 13,051 12,971 10,684 11,265 5.4% 0.92 -13.1% -13.7%
ILLINOIS 11,707 12,079 14,783 18,517 25.3% 1.51 53.3% 58.2%
INDIANA 10,828 11,186 11,128 11,690 5.1% 0.95 4.5% 8.0%
IOWA 13,022 13,350 12,762 13,453 5.4% 1.10 0.8% 3.3%
KANSAS 11,817 11,615 11,383 11,533 1.3% 0.94 -0.7% -2.4%
KENTUCKY 14,302 13,972 13,081 13,151 0.5% 1.07 -5.9% -8.0%
LOUISIANA 12,441 11,933 9,918 10,174 2.6% 0.83 -14.7% -18.2%
MAINE 14,312 14,954 14,485 14,652 1.1% 1.19 -2.0% 2.4%
MARYLAND 15,583 14,884 14,727 15,139 2.8% 1.23 1.7% -2.9%
MASSACHUSETTS 13,232 12,166 10,746 11,002 2.4% 0.90 -9.6% -16.9%
MICHIGAN 14,396 14,439 15,108 15,727 4.1% 1.28 8.9% 9.2%
MINNESOTA 12,471 12,247 12,666 12,439 -1.8% 1.01 1.6% -0.3%
MISSISSIPPI 13,186 11,570 10,416 10,947 5.1% 0.89 -5.4% -17.0%
MISSOURI 12,382 12,232 10,664 10,841 1.7% 0.88 -11.4% -12.4%
MONTANA 10,322 10,457 9,861 10,444 5.9% 0.85 -0.1% 1.2%
NEBRASKA 12,382 12,181 12,693 13,241 4.3% 1.08 8.7% 6.9%
NEVADA 13,092 12,802 10,760 11,011 2.3% 0.90 -14.0% -15.9%
NEW HAMPSHIRE 12,006 11,960 11,425 12,216 6.9% 1.00 2.1% 1.7%
NEW JERSEY 14,203 14,242 13,112 13,568 3.5% 1.11 -4.7% -4.5%
NEW MEXICO 11,712 11,059 11,669 11,789 1.0% 0.96 6.6% 0.7%
NEW YORK 12,674 12,565 12,646 13,225 4.6% 1.08 5.3% 4.3%
NORTH CAROLINA 14,211 12,708 12,881 12,879 0.0% 1.05 1.3% -9.4%
NORTH DAKOTA 11,851 11,691 13,303 14,640 10.1% 1.19 25.2% 23.5%
OHIO 12,175 12,142 11,724 11,658 -0.6% 0.95 -4.0% -4.2%
OKLAHOMA 13,142 13,692 12,339 12,432 0.8% 1.01 -9.2% -5.4%
OREGON 11,256 10,460 10,465 10,791 3.1% 0.88 3.2% -4.1%
PENNSYLVANIA 13,595 13,940 12,712 12,890 1.4% 1.05 -7.5% -5.2%
RHODE ISLAND 14,943 14,571 15,569 15,661 0.6% 1.28 7.5% 4.8%
SOUTH CAROLINA 13,773 11,825 12,431 12,639 1.7% 1.03 6.9% -8.2%
SOUTH DAKOTA 11,228 10,806 12,142 12,298 1.3% 1.00 13.8% 9.5%
TENNESSEE 13,251 13,049 11,712 12,848 9.7% 1.05 -1.5% -3.0%
TEXAS 14,343 13,417 12,433 13,175 6.0% 1.07 -1.8% -8.1%
UTAH 11,134 10,187 9,741 10,375 6.5% 0.85 1.8% -6.8%
VERMONT 15,079 15,503 15,346 15,320 -0.2% 1.25 -1.2% 1.6%
VIRGINIA 12,330 12,377 12,237 12,409 1.4% 1.01 0.3% 0.6%
WASHINGTON 10,861 10,393 10,014 10,956 9.4% 0.89 5.4% 0.9%
WEST VIRGINIA 12,247 11,493 11,391 11,930 4.7% 0.97 3.8% -2.6%
WISCONSIN 11,248 11,269 11,203 11,205 0.0% 0.91 -0.6% -0.4%
WYOMING 19,310 19,429 19,435 18,284 -5.9% 1.49 -5.9% -5.3%
U.S. 12,521 12,065 11,780 12,266 4.1% 1.7% -2.0%
Notes:
1) Total educational revenue is the sum of educational appropriations and net tuition excluding net tuition revenue used for capital debt service.
2) Adjustment factors, to arrive at constant dollar figures, include Cost of Living Adjustment (COLA), Enrollment Mix Index (EMI), and Higher Education Cost Adjustment (HECA).The Cost of Living Adjustment (COLA) is not a measure of inflation over time.
Source: State Higher Education Executive Officers
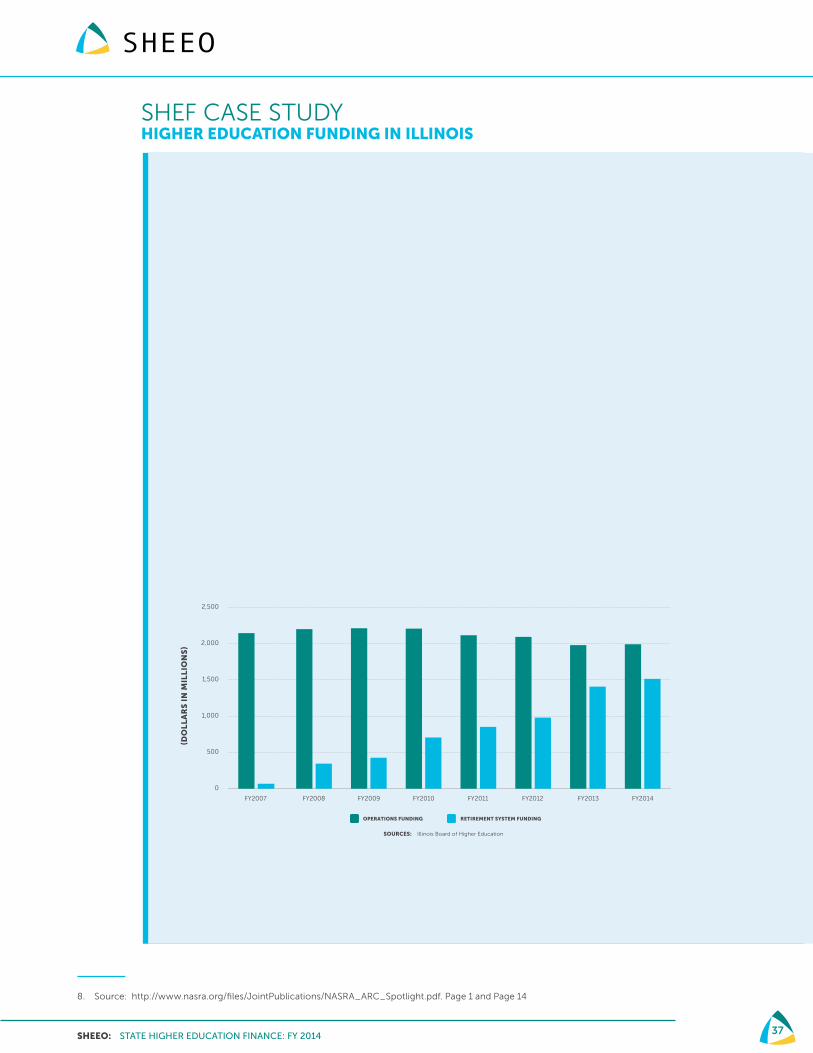
SHEEO: STATE HIGHER EDUCATION FINANCE: FY 2014 37
SHEF CASE STUDYHIGHER EDUCATION FUNDING IN ILLINOIS
State retirement and pensions systems require major expenditure outlays that must be covered by general operating revenues available to public institutions of higher education. In some states, funds may be directly appropriated for this purpose. In others, they are part of what general appropriations and tuition must cover. Concern that these systems are underfunded and will not be able to meet future obligations as the baby boom generation reaches retirement age has led some states (e.g., Oregon and Colorado) to take action to make their systems more solvent.
According to data provided by the Illinois Board of Higher Education, Illinois historically underfunded its higher education pension system until 2008, when the legislature began to significantly increase its funding. Since 2007, funding to the retirement system has increased from $68.7 million to $1.5 billion, while funding for the other general obligations has declined slightly from $2.1 billion to $2.0 billion. Of the $1.5 billion, $1.1 billion is covering previous underfunding of the program, while $400 million is covering current year costs. Retirement appropriations now make up 43.2 percent of the total funding provided while in 2007 they comprised just 3.1 percent, and the majority of this revenue is making up for previously underfunding of these obligations.
Coupled with these large funding increases that are earmarked for the pension system, the enrollment decline in Illinois (17.8 percent since 2009) means per-student educational appropriations have grown nearly 50 percent over the last five years.
FIGURE 11ILLINOIS STATE FUNDING COMPARED TO RETIREMENT SYSTEM FUNDING, FISCAL 2007-2014
While the pension shortfall in Illinois is extreme, the state is taking actions to address it. According to the National Association of State Retirement Administrators, most states are making good faith efforts to meet their current and future pension obligations; however, in many states, a shortfall remains.8
8. Source: http://www.nasra.org/files/JointPublications/NASRA_ARC_Spotlight.pdf. Page 1 and Page 14
OPERATIONS FUNDING RETIREMENT SYSTEM FUNDING
FY2007 FY2008 FY2009 FY2010 FY2011 FY2012 FY2013 FY2014
0
500
1,000
1,500
2,000
2,500
ILLINOIS STATE FUNDING COMPARED TO RETIREMENT SYSTEM FUNDING, FISCAL 2007 - 2014FIGURE 7
SOURCES: Illinois Board of Higher Education
(DO
LL
AR
S I
N M
ILL
ION
S)

SHEEO: STATE HIGHER EDUCATION FINANCE: FY 2014 38
Figures 12 and 13 compare states to the national average on Fiscal 2014 educational appropriations per FTE and total educational revenue per FTE, respectively. In 18 states, educational appropriations per FTE are within $1,000 of the U.S. average and a majority of states are within $2,000. In total education revenue per FTE, 22 states are within $1,000 of the U.S. average, and 35 are within $2,000. Comparing states across both charts, traditionally high-tuition states like New Hampshire and Vermont are well below the national average for education appropriations (Figure 12) but average and above average, respectively, on total revenue (Figure 13).
SHEF CASE STUDYIMPACT OF FALLING OIL AND GAS PRICES ON SELECTED STATES
The federal government and states tax the extraction of natural resources, including oil, and while many people view the falling price of oil as a positive economic development, for some state budgets the outcome is possible budget shortfalls. According to the U.S. Census Bureau, these severance taxes accounted for 1.9 percent of the total state tax collections in Fiscal Year 2012. A few states, however, are far more dependent on this revenue source than others. Specifically, Alaska, North Dakota, and Wyoming received 78.3 percent, 46.4 percent, and 39.7 percent of total state tax revenue from severance taxes in 2012, respectively.9 On a per-student FTE basis, Alaska and Wyoming provided the most state and local funding to higher education in 2014, while North Dakota has increased its higher education funding significantly in recent years.
The impact of continued low oil prices will mean increased budget pressures and possible reductions in higher education support in those states that are more reliant on severance tax revenue. Further, layoffs in the extraction industries may lead to increased enrollment at institutions of higher education in these states as often happens during economic downturns when the unemployed seek to update or refresh their skills through postsecondary education.
9. Source: U.S. Census Bureau, 2013 Annual Survey of State Government Tax Collections. See more at: NASBO http://www.nasbo.org/budget-blog/state-severance-tax-revenue-and-falling-price-oil

SHEEO: STATE HIGHER EDUCATION FINANCE: FY 2014 39
FIGURE 12EDUCATIONAL APPROPRIATIONS PER FTE–STATE DIFFERENCES FROM U.S. AVERAGE, FISCAL 2014
NOTE: Dollars adjusted by Cost of Living Adjustment and Enrollment Index
SOURCE: State Higher Education Executive O�cers
EDUCATIONAL APPROPRIATIONS PER FTE STATE DIFFERENCES FROM U.S. AVERAGE, FISCAL 2014
-6000 -4000 -2000 0 2000 4000 6000 8000 10000
9,009
7,426
5,741
2,010
1,902
1,499
1,477
1,336
1,288
1,101
1,066
960
957
745
640
528
464
453
407
272
0
-38
-300
-479
-753
-766
-852
-879
-904
-946
-1,021
-1,032
-1,046
-1,217
-1,224
-1,255
-1,381
-1,499
-1,546
-1,613
-1,658
-1,674
-1,773
-1,787
-1,862
-2,237
-2,338
-2,898
-3,529
-3,736
-4,192
WYOMING
ALASKA
ILLINOIS
NORTH CAROLINA
NEW YORK
TEXAS
NEW MEXICO
NORTH DAKOTA
NEBRASKA
ARKANSAS
HAWAII
MARYLAND
CALIFORNIA
GEORGIA
CONNECTICUT
OKLAHOMA
NEVADA
IDAHO
TENNESSEE
KENTUCKY
US
MISSISSIPPI
MAINE
MASSACHUSETTS
FLORIDA
WISCONSIN
WASHINGTON
ALABAMA
KANSAS
LOUISIANA
WEST VIRGINIA
NEW JERSEY
UTAH
IOWA
MINNESOTA
MISSOURI
ARIZONA
DELAWARE
INDIANA
MONTANA
SOUTH CAROLINA
SOUTH DAKOTA
VIRGINIA
MICHIGAN
RHODE ISLAND
OHIO
OREGON
PENNSYLVANIA
COLORADO
VERMONT
NEW HAMPSHIRE
FIGURE 8
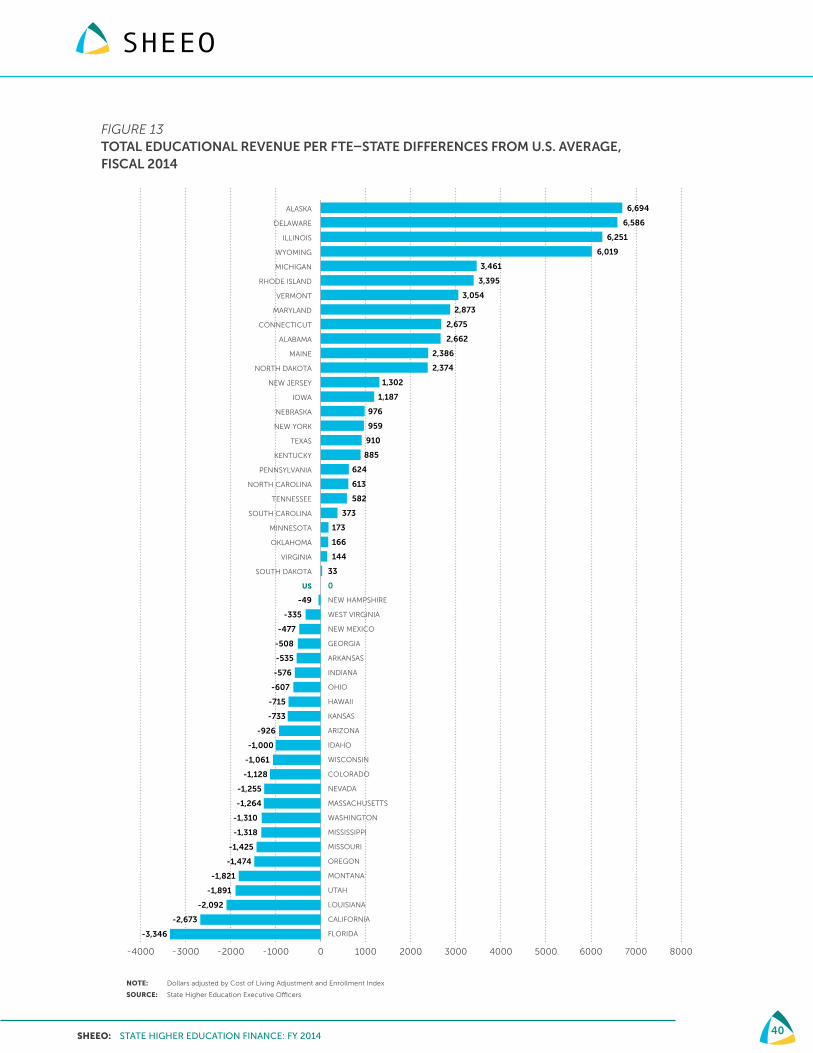
SHEEO: STATE HIGHER EDUCATION FINANCE: FY 2014 40
FIGURE 13TOTAL EDUCATIONAL REVENUE PER FTE–STATE DIFFERENCES FROM U.S. AVERAGE, FISCAL 2014
NOTE: Dollars adjusted by Cost of Living Adjustment and Enrollment Index
SOURCE: State Higher Education Executive O�cers
TOTAL EDUCATIONAL REVENUE PER FTE STATE DIFFERENCES FROM U.S. AVERAGE, FISCAL 2014
-4000 -3000 -2000 -1000 0 1000 2000 3000 4000 5000 6000 7000 8000
ALASKA
DELAWARE
ILLINOIS
WYOMING
MICHIGAN
RHODE ISLAND
VERMONT
MARYLAND
CONNECTICUT
ALABAMA
MAINE
NORTH DAKOTA
NEW JERSEY
IOWA
NEBRASKA
NEW YORK
TEXAS
KENTUCKY
PENNSYLVANIA
NORTH CAROLINA
TENNESSEE
SOUTH CAROLINA
MINNESOTA
OKLAHOMA
VIRGINIA
SOUTH DAKOTA
US
NEW HAMPSHIRE
WEST VIRGINIA
NEW MEXICO
GEORGIA
ARKANSAS
INDIANA
OHIO
HAWAII
KANSAS
ARIZONA
IDAHO
WISCONSIN
COLORADO
NEVADA
MASSACHUSETTS
WASHINGTON
MISSISSIPPI
MISSOURI
OREGON
MONTANA
UTAH
LOUISIANA
CALIFORNIA
FLORIDA
-49
-335
-477
-508
-535
-576
-607
-715
-733
-926
-1,000
-1,061
-1,128
-1,255
-1,264
-1,310
-1,318
-1,425
-1,474
-1,821
-1,891
-2,092
-2,673
-3,346
6,694
6,586
6,251
6,019
3,461
3,395
3,054
2,873
2,675
2,662
2,386
2,374
1,302
1,187
976
959
910
885
624
613
582
373
173
166
144
33
0
FIGURE 9
SHEEO: STATE HIGHER EDUCATION FINANCE: FY 2014 41
STATE WEALTH, TAXES, AND ALLOCATIONS FOR HIGHER EDUCATION
Within each state, policies and decisions about the financing of higher education are made in the context of prevailing economic conditions, tax structures, and competing budgetary priorities. Within this context, state policymakers face challenging questions, including:
• What revenue is needed to support important public services?
• What level of taxation will generate that revenue without impairing economic productivity or individual opportunities?
• What combination of public services, spending, and tax policy is most likely to enhance economic growth, future assets, and the quality of life?
• What should the spending priorities be for different public services and investments?
Opinions vary widely about a host of issues concerning taxes, public services, and public investments. Differences of opinion and philosophy combine with conditions in the economy and demography to affect state taxing and spending decisions. As these conditions change, policymakers reevaluate taxation and spending policies. That reevaluation may be less likely to lead to changes in those states where tax and/or spending policies are dictated or influenced by provisions of the state constitution rather than by state statute.
No single standard exists to evaluate public policy decisions with respect to funding for higher education. Relevant, comparative information about states can, however, help inform higher education financing decisions. This section explores several types of comparative data and indicators, including population, relative state and personal wealth, tax capacity and effort, and comparative allocations to higher education.10 The data presented here are in nominal terms and are not adjusted for inflation. In all cases, the most recent available is presented. In some cases, this means an additional one- to two-year lag from 2014.
Nationally, effective state and local tax rates were nearly unchanged over the last decade. As shown in Table 8, based on a combination of federal government data sources:
• Aggregate state wealth (total taxable resources) per capita increased 44.5 percent from 2002 to 2012, from $40,242 to $58,163. The effects of the 2008 recession are evident in 2009 and 2010 numbers. Total taxable resources per capita reached a high of $53,612 in 2007, declining to $53,071 in 2008 and to $50,051 in 2009. 2010 total taxable resources rebounded 1.8 percent in 2010 to $50,974, signaling the beginning of a slow recovery. In 2011, they grew more quickly, increasing 4.0% to $53,017. Total taxable resources per capita in 2012 grew 9.7 percent to $58,163, indicating continued and stronger economic recovery.
• Total state and local tax revenues per capita increased 40.5 percent from $3,140 in 2002 to $4,412 in 2012, slightly higher than the pre-recession high of $4,362.
10. Part of this section draws on previous work by Kent Halstead to assemble data and develop indicators for higher education support per capita and relative to wealth (personal income), state tax capacity, and tax effort.
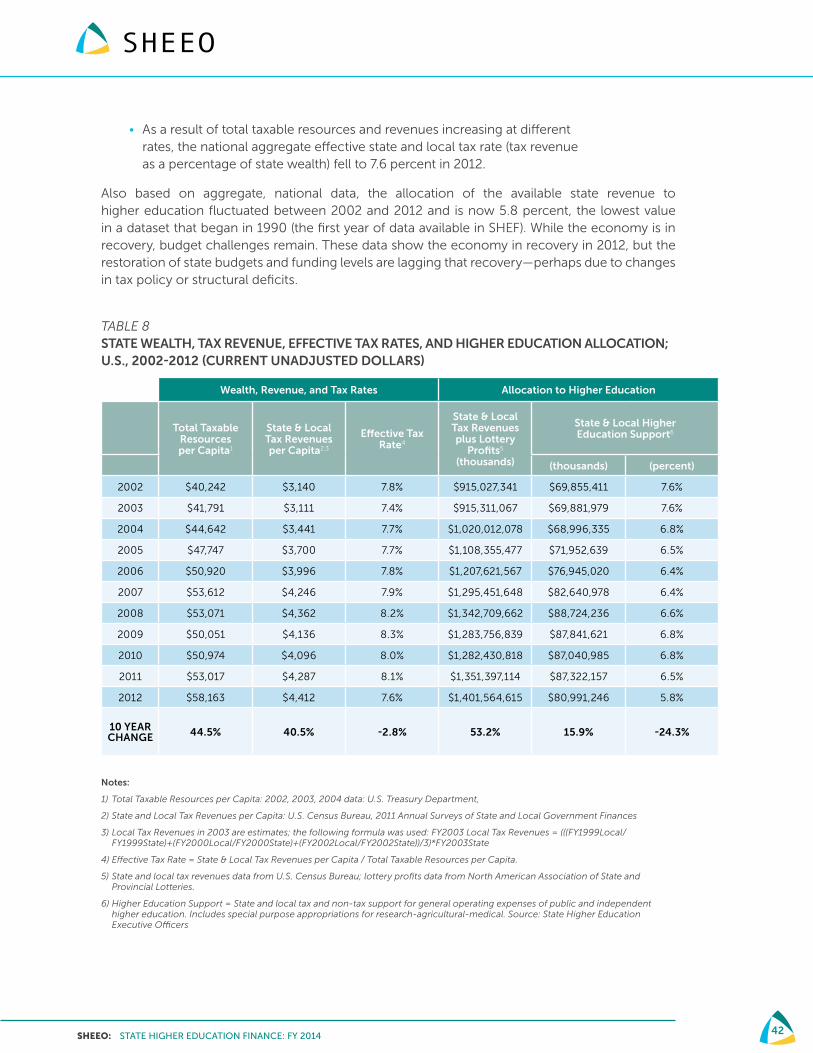
SHEEO: STATE HIGHER EDUCATION FINANCE: FY 2014 42
• As a result of total taxable resources and revenues increasing at different rates, the national aggregate effective state and local tax rate (tax revenue as a percentage of state wealth) fell to 7.6 percent in 2012.
Also based on aggregate, national data, the allocation of the available state revenue to higher education fluctuated between 2002 and 2012 and is now 5.8 percent, the lowest value in a dataset that began in 1990 (the first year of data available in SHEF). While the economy is in recovery, budget challenges remain. These data show the economy in recovery in 2012, but the restoration of state budgets and funding levels are lagging that recovery—perhaps due to changes in tax policy or structural deficits.
TABLE 8 STATE WEALTH, TAX REVENUE, EFFECTIVE TAX RATES, AND HIGHER EDUCATION ALLOCATION; U.S., 2002-2012 (CURRENT UNADJUSTED DOLLARS)
Wealth, Revenue, and Tax Rates Allocation to Higher Education
Total Taxable Resources per Capita1
State & Local Tax Revenues per Capita2,3
Effective Tax Rate4
State & Local Tax Revenues plus Lottery
Profits5
(thousands)
State & Local Higher Education Support6
(thousands) (percent)
2002 $40,242 $3,140 7.8% $915,027,341 $69,855,411 7.6%
2003 $41,791 $3,111 7.4% $915,311,067 $69,881,979 7.6%
2004 $44,642 $3,441 7.7% $1,020,012,078 $68,996,335 6.8%
2005 $47,747 $3,700 7.7% $1,108,355,477 $71,952,639 6.5%
2006 $50,920 $3,996 7.8% $1,207,621,567 $76,945,020 6.4%
2007 $53,612 $4,246 7.9% $1,295,451,648 $82,640,978 6.4%
2008 $53,071 $4,362 8.2% $1,342,709,662 $88,724,236 6.6%
2009 $50,051 $4,136 8.3% $1,283,756,839 $87,841,621 6.8%
2010 $50,974 $4,096 8.0% $1,282,430,818 $87,040,985 6.8%
2011 $53,017 $4,287 8.1% $1,351,397,114 $87,322,157 6.5%
2012 $58,163 $4,412 7.6% $1,401,564,615 $80,991,246 5.8%
10 YEAR CHANGE 44.5% 40.5% -2.8% 53.2% 15.9% -24.3%
Notes:
1) Total Taxable Resources per Capita: 2002, 2003, 2004 data: U.S. Treasury Department,
2) State and Local Tax Revenues per Capita: U.S. Census Bureau, 2011 Annual Surveys of State and Local Government Finances
3) Local Tax Revenues in 2003 are estimates; the following formula was used: FY2003 Local Tax Revenues = (((FY1999Local/FY1999State)+(FY2000Local/FY2000State)+(FY2002Local/FY2002State))/3)*FY2003State
4) Effective Tax Rate = State & Local Tax Revenues per Capita / Total Taxable Resources per Capita.
5) State and local tax revenues data from U.S. Census Bureau; lottery profits data from North American Association of State and Provincial Lotteries.
6) Higher Education Support = State and local tax and non-tax support for general operating expenses of public and independent higher education. Includes special purpose appropriations for research-agricultural-medical. Source: State Higher Education Executive Officers
SHEEO: STATE HIGHER EDUCATION FINANCE: FY 2014 43
In Table 9, state tax revenue per capita, total taxable resources per capita, and the effective tax rates are indexed to the national average in order to indicate the variability across states relative to the national average. Taxable resources per capita vary by a factor of two, from a low of $39,764 to a high of $85,616. The U.S. average is $58,163. Effective tax rates also vary substantially, from a low of 5.6 percent to a high of 13.8 percent, while the U.S. average is 7.6 percent.
Table 9, along with Figures 14 and 15, based on federal data sources, shows two measures of state-by-state support for higher education (per capita and per $1,000 in personal income) for 2013. Per-capita support for higher education averages $259 nationally and ranges from $65 in New Hampshire to $717 in Wyoming. Support for higher education relative to personal income varies from $1.27 to $13.57 per $1,000 of personal income across the states. Nationally, state and local support for higher education per $1,000 of personal income was $5.79 in 2013.
These comparative statistics reflect interstate differences in wealth, population characteristics and density, participation rates, the relative size of the public and independent higher education sectors, student mobility, and numerous other factors. Poorer states may lag the national average in per-capita support, but exceed the national average in support per thousand dollars of personal income. Similarly, sparsely populated states sometimes exceed the national average in both per-capita support and per $1,000 of personal income.
Table 10 also provides an analysis of state support as a percentage of state budgets in 2012. While such statistics show relative investments in higher education, they do not necessarily indicate the relative “priority” or valuation of higher education by each state. They do reflect the different paths states have taken in financing a set of public purposes as they assess need, urgency, and financing options. As previously discussed, tuition revenue frequently (but not universally) has increased when state and local sources of support have not kept pace with enrollment growth and inflation. The data in Table 8, indicating a decrease in the effective state tax rate combined with the pressures created by growing higher education enrollment, demands for elementary and secondary funding, rising Medicaid costs, and other factors, help explain the stress on state budgets and policymakers. Starting with California’s Proposition 13 in 1978, many states saw limits on taxation and, sometimes, mandatory spending for programs such as K-12 education and corrections placed in their constitutions. These factors are unique to each state and affect what states are able to devote to supporting higher education. States that rely heavily on revenue from retail sales taxes may not yet have adjusted to changes being wrought by online shopping and a shift from purchases of goods to purchases of services.
Pursuing the goals of assuring higher education access, determining appropriate levels of support, and sorting out “who pays, who benefits” in the context of state needs, resources, and other policy objectives, remains a complex task in every state.
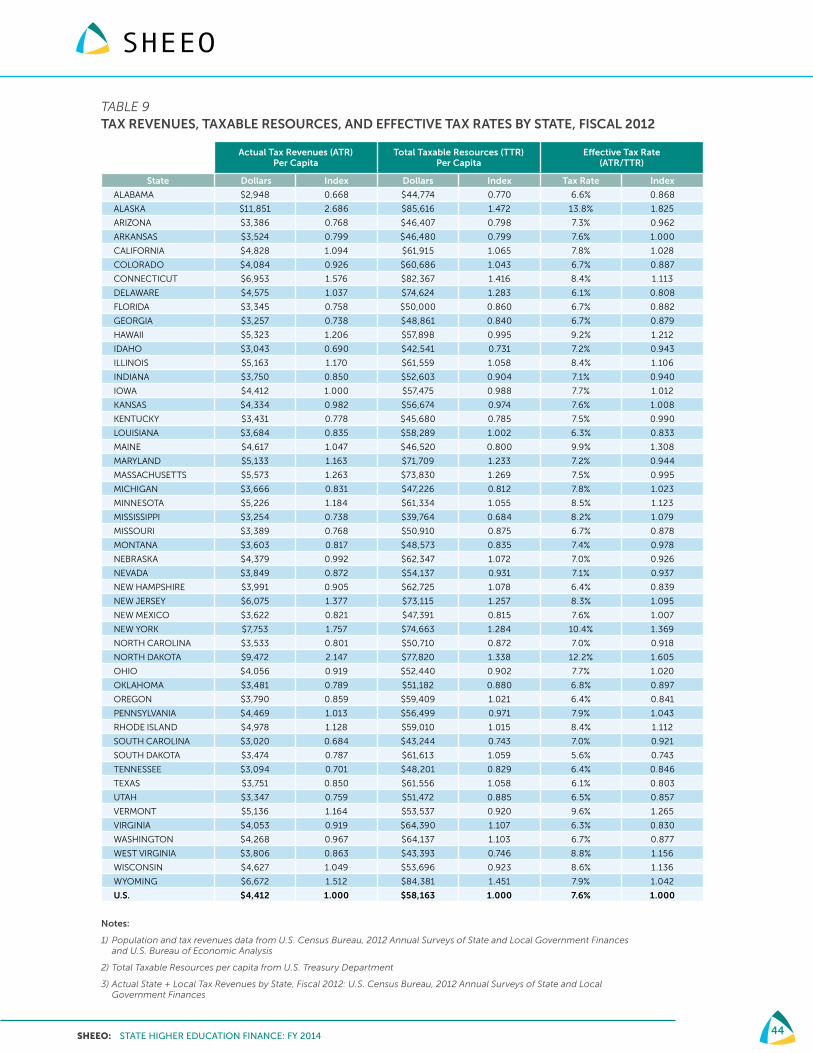
SHEEO: STATE HIGHER EDUCATION FINANCE: FY 2014 44
TABLE 9 TAX REVENUES, TAXABLE RESOURCES, AND EFFECTIVE TAX RATES BY STATE, FISCAL 2012
Actual Tax Revenues (ATR)
Per Capita Total Taxable Resources (TTR)
Per CapitaEffective Tax Rate
(ATR/TTR)
State Dollars Index Dollars Index Tax Rate Index
ALABAMA $2,948 0.668 $44,774 0.770 6.6% 0.868
ALASKA $11,851 2.686 $85,616 1.472 13.8% 1.825
ARIZONA $3,386 0.768 $46,407 0.798 7.3% 0.962
ARKANSAS $3,524 0.799 $46,480 0.799 7.6% 1.000
CALIFORNIA $4,828 1.094 $61,915 1.065 7.8% 1.028
COLORADO $4,084 0.926 $60,686 1.043 6.7% 0.887
CONNECTICUT $6,953 1.576 $82,367 1.416 8.4% 1.113
DELAWARE $4,575 1.037 $74,624 1.283 6.1% 0.808
FLORIDA $3,345 0.758 $50,000 0.860 6.7% 0.882
GEORGIA $3,257 0.738 $48,861 0.840 6.7% 0.879
HAWAII $5,323 1.206 $57,898 0.995 9.2% 1.212
IDAHO $3,043 0.690 $42,541 0.731 7.2% 0.943
ILLINOIS $5,163 1.170 $61,559 1.058 8.4% 1.106
INDIANA $3,750 0.850 $52,603 0.904 7.1% 0.940
IOWA $4,412 1.000 $57,475 0.988 7.7% 1.012
KANSAS $4,334 0.982 $56,674 0.974 7.6% 1.008
KENTUCKY $3,431 0.778 $45,680 0.785 7.5% 0.990
LOUISIANA $3,684 0.835 $58,289 1.002 6.3% 0.833
MAINE $4,617 1.047 $46,520 0.800 9.9% 1.308
MARYLAND $5,133 1.163 $71,709 1.233 7.2% 0.944
MASSACHUSETTS $5,573 1.263 $73,830 1.269 7.5% 0.995
MICHIGAN $3,666 0.831 $47,226 0.812 7.8% 1.023
MINNESOTA $5,226 1.184 $61,334 1.055 8.5% 1.123
MISSISSIPPI $3,254 0.738 $39,764 0.684 8.2% 1.079
MISSOURI $3,389 0.768 $50,910 0.875 6.7% 0.878
MONTANA $3,603 0.817 $48,573 0.835 7.4% 0.978
NEBRASKA $4,379 0.992 $62,347 1.072 7.0% 0.926
NEVADA $3,849 0.872 $54,137 0.931 7.1% 0.937
NEW HAMPSHIRE $3,991 0.905 $62,725 1.078 6.4% 0.839
NEW JERSEY $6,075 1.377 $73,115 1.257 8.3% 1.095
NEW MEXICO $3,622 0.821 $47,391 0.815 7.6% 1.007
NEW YORK $7,753 1.757 $74,663 1.284 10.4% 1.369
NORTH CAROLINA $3,533 0.801 $50,710 0.872 7.0% 0.918
NORTH DAKOTA $9,472 2.147 $77,820 1.338 12.2% 1.605
OHIO $4,056 0.919 $52,440 0.902 7.7% 1.020
OKLAHOMA $3,481 0.789 $51,182 0.880 6.8% 0.897
OREGON $3,790 0.859 $59,409 1.021 6.4% 0.841
PENNSYLVANIA $4,469 1.013 $56,499 0.971 7.9% 1.043
RHODE ISLAND $4,978 1.128 $59,010 1.015 8.4% 1.112
SOUTH CAROLINA $3,020 0.684 $43,244 0.743 7.0% 0.921
SOUTH DAKOTA $3,474 0.787 $61,613 1.059 5.6% 0.743
TENNESSEE $3,094 0.701 $48,201 0.829 6.4% 0.846
TEXAS $3,751 0.850 $61,556 1.058 6.1% 0.803
UTAH $3,347 0.759 $51,472 0.885 6.5% 0.857
VERMONT $5,136 1.164 $53,537 0.920 9.6% 1.265
VIRGINIA $4,053 0.919 $64,390 1.107 6.3% 0.830
WASHINGTON $4,268 0.967 $64,137 1.103 6.7% 0.877
WEST VIRGINIA $3,806 0.863 $43,393 0.746 8.8% 1.156
WISCONSIN $4,627 1.049 $53,696 0.923 8.6% 1.136
WYOMING $6,672 1.512 $84,381 1.451 7.9% 1.042
U.S. $4,412 1.000 $58,163 1.000 7.6% 1.000
Notes:
1) Population and tax revenues data from U.S. Census Bureau, 2012 Annual Surveys of State and Local Government Finances and U.S. Bureau of Economic Analysis
2) Total Taxable Resources per capita from U.S. Treasury Department
3) Actual State + Local Tax Revenues by State, Fiscal 2012: U.S. Census Bureau, 2012 Annual Surveys of State and Local Government Finances
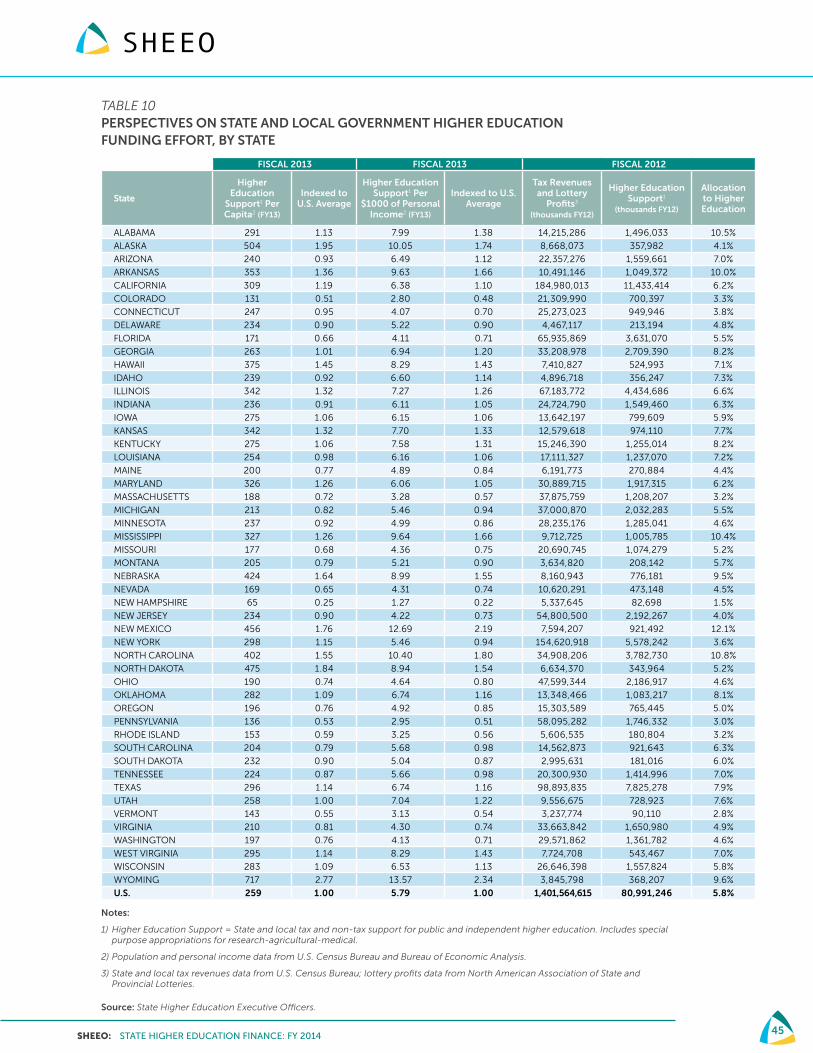
SHEEO: STATE HIGHER EDUCATION FINANCE: FY 2014 45
TABLE 10 PERSPECTIVES ON STATE AND LOCAL GOVERNMENT HIGHER EDUCATION FUNDING EFFORT, BY STATE
FISCAL 2013 FISCAL 2013 FISCAL 2012
State
Higher Education
Support1 Per Capita2 (FY13)
Indexed to U.S. Average
Higher Education Support1 Per
$1000 of Personal Income2 (FY13)
Indexed to U.S. Average
Tax Revenues and Lottery
Profits3 (thousands FY12)
Higher Education Support1
(thousands FY12)
Allocation to Higher Education
ALABAMA 291 1.13 7.99 1.38 14,215,286 1,496,033 10.5%
ALASKA 504 1.95 10.05 1.74 8,668,073 357,982 4.1%
ARIZONA 240 0.93 6.49 1.12 22,357,276 1,559,661 7.0%
ARKANSAS 353 1.36 9.63 1.66 10,491,146 1,049,372 10.0%
CALIFORNIA 309 1.19 6.38 1.10 184,980,013 11,433,414 6.2%
COLORADO 131 0.51 2.80 0.48 21,309,990 700,397 3.3%
CONNECTICUT 247 0.95 4.07 0.70 25,273,023 949,946 3.8%
DELAWARE 234 0.90 5.22 0.90 4,467,117 213,194 4.8%
FLORIDA 171 0.66 4.11 0.71 65,935,869 3,631,070 5.5%
GEORGIA 263 1.01 6.94 1.20 33,208,978 2,709,390 8.2%
HAWAII 375 1.45 8.29 1.43 7,410,827 524,993 7.1%
IDAHO 239 0.92 6.60 1.14 4,896,718 356,247 7.3%
ILLINOIS 342 1.32 7.27 1.26 67,183,772 4,434,686 6.6%
INDIANA 236 0.91 6.11 1.05 24,724,790 1,549,460 6.3%
IOWA 275 1.06 6.15 1.06 13,642,197 799,609 5.9%
KANSAS 342 1.32 7.70 1.33 12,579,618 974,110 7.7%
KENTUCKY 275 1.06 7.58 1.31 15,246,390 1,255,014 8.2%
LOUISIANA 254 0.98 6.16 1.06 17,111,327 1,237,070 7.2%
MAINE 200 0.77 4.89 0.84 6,191,773 270,884 4.4%
MARYLAND 326 1.26 6.06 1.05 30,889,715 1,917,315 6.2%
MASSACHUSETTS 188 0.72 3.28 0.57 37,875,759 1,208,207 3.2%
MICHIGAN 213 0.82 5.46 0.94 37,000,870 2,032,283 5.5%
MINNESOTA 237 0.92 4.99 0.86 28,235,176 1,285,041 4.6%
MISSISSIPPI 327 1.26 9.64 1.66 9,712,725 1,005,785 10.4%
MISSOURI 177 0.68 4.36 0.75 20,690,745 1,074,279 5.2%
MONTANA 205 0.79 5.21 0.90 3,634,820 208,142 5.7%
NEBRASKA 424 1.64 8.99 1.55 8,160,943 776,181 9.5%
NEVADA 169 0.65 4.31 0.74 10,620,291 473,148 4.5%
NEW HAMPSHIRE 65 0.25 1.27 0.22 5,337,645 82,698 1.5%
NEW JERSEY 234 0.90 4.22 0.73 54,800,500 2,192,267 4.0%
NEW MEXICO 456 1.76 12.69 2.19 7,594,207 921,492 12.1%
NEW YORK 298 1.15 5.46 0.94 154,620,918 5,578,242 3.6%
NORTH CAROLINA 402 1.55 10.40 1.80 34,908,206 3,782,730 10.8%
NORTH DAKOTA 475 1.84 8.94 1.54 6,634,370 343,964 5.2%
OHIO 190 0.74 4.64 0.80 47,599,344 2,186,917 4.6%
OKLAHOMA 282 1.09 6.74 1.16 13,348,466 1,083,217 8.1%
OREGON 196 0.76 4.92 0.85 15,303,589 765,445 5.0%
PENNSYLVANIA 136 0.53 2.95 0.51 58,095,282 1,746,332 3.0%
RHODE ISLAND 153 0.59 3.25 0.56 5,606,535 180,804 3.2%
SOUTH CAROLINA 204 0.79 5.68 0.98 14,562,873 921,643 6.3%
SOUTH DAKOTA 232 0.90 5.04 0.87 2,995,631 181,016 6.0%
TENNESSEE 224 0.87 5.66 0.98 20,300,930 1,414,996 7.0%
TEXAS 296 1.14 6.74 1.16 98,893,835 7,825,278 7.9%
UTAH 258 1.00 7.04 1.22 9,556,675 728,923 7.6%
VERMONT 143 0.55 3.13 0.54 3,237,774 90,110 2.8%
VIRGINIA 210 0.81 4.30 0.74 33,663,842 1,650,980 4.9%
WASHINGTON 197 0.76 4.13 0.71 29,571,862 1,361,782 4.6%
WEST VIRGINIA 295 1.14 8.29 1.43 7,724,708 543,467 7.0%
WISCONSIN 283 1.09 6.53 1.13 26,646,398 1,557,824 5.8%
WYOMING 717 2.77 13.57 2.34 3,845,798 368,207 9.6%
U.S. 259 1.00 5.79 1.00 1,401,564,615 80,991,246 5.8%
Notes:
1) Higher Education Support = State and local tax and non-tax support for public and independent higher education. Includes special purpose appropriations for research-agricultural-medical.
2) Population and personal income data from U.S. Census Bureau and Bureau of Economic Analysis.
3) State and local tax revenues data from U.S. Census Bureau; lottery profits data from North American Association of State and Provincial Lotteries.
Source: State Higher Education Executive Officers.
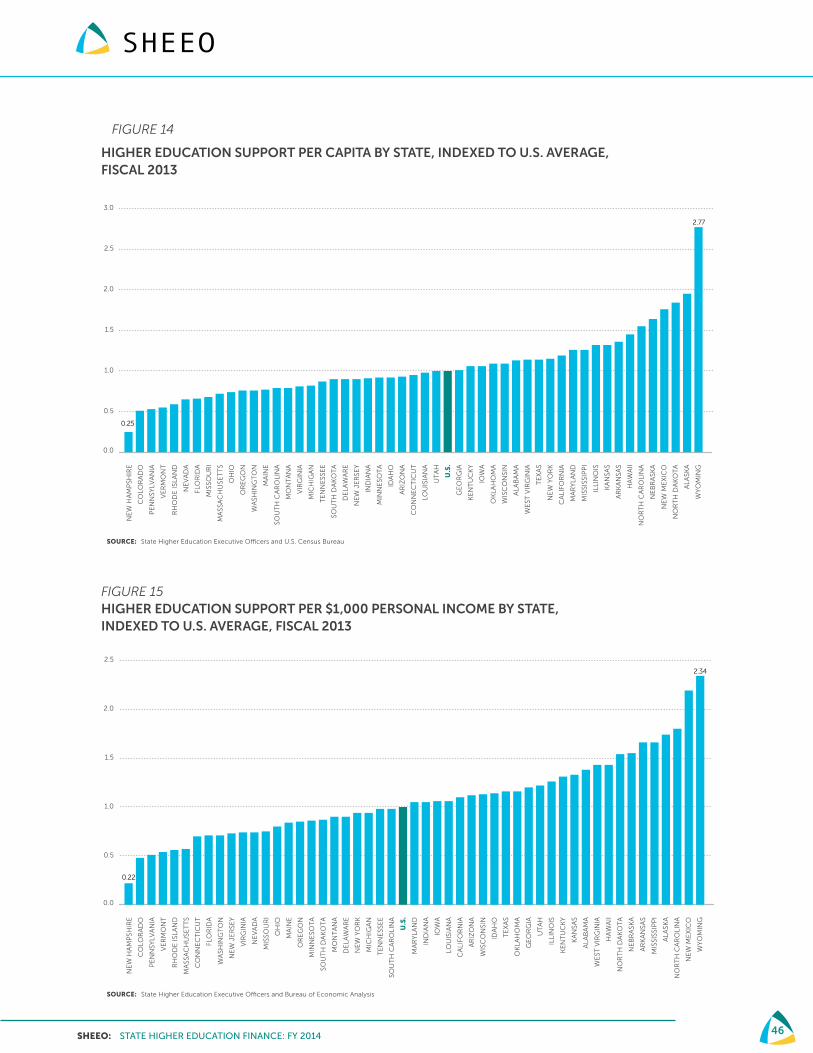
SHEEO: STATE HIGHER EDUCATION FINANCE: FY 2014 46
FIGURE 14
HIGHER EDUCATION SUPPORT PER CAPITA BY STATE, INDEXED TO U.S. AVERAGE, FISCAL 2013
HIGHER EDUCATION SUPPORT PER CAPITA BY STATE, INDEXED TO U.S. AVERAGE, FISCAL 2013
0.0
0.5
1.0
1.5
2.0
2.5
3.0
NE
W H
AM
PSH
IRE
CO
LOR
AD
O
PE
NN
SYLV
AN
IA
VE
RM
ON
T
RH
OD
E IS
LAN
D
NE
VA
DA
FLO
RID
A
MIS
SOU
RI
MA
SSA
CH
USE
TT
S
OH
IO
OR
EG
ON
WA
SHIN
GT
ON
MA
INE
SOU
TH
CA
RO
LIN
A
MO
NT
AN
A
VIR
GIN
IA
MIC
HIG
AN
TE
NN
ESS
EE
SOU
TH
DA
KO
TA
DE
LAW
AR
E
NE
W J
ER
SEY
IND
IAN
A
MIN
NE
SOT
A
IDA
HO
AR
IZO
NA
CO
NN
EC
TIC
UT
LOU
ISIA
NA
UT
AH
U.S
.
GE
OR
GIA
KE
NT
UC
KY
IOW
A
OK
LAH
OM
A
WIS
CO
NSI
N
ALA
BA
MA
WE
ST V
IRG
INIA
TE
XA
S
NE
W Y
OR
K
CA
LIFO
RN
IA
MA
RY
LAN
D
MIS
SISS
IPP
I
ILLI
NO
IS
KA
NSA
S
AR
KA
NSA
S
HA
WA
II
NO
RT
H C
AR
OLI
NA
NE
BR
ASK
A
NE
W M
EX
ICO
NO
RT
H D
AK
OT
A
ALA
SKA
WY
OM
ING
FIGURE 10
SOURCE: State Higher Education Executive O�cers and U.S. Census Bureau
0.25
2.77
FIGURE 15HIGHER EDUCATION SUPPORT PER $1,000 PERSONAL INCOME BY STATE, INDEXED TO U.S. AVERAGE, FISCAL 2013HIGHER EDUCATION SUPPORT PER $1,000 PERSONAL INCOME BY STATE,
INDEXED TO U.S. AVERAGE, FISCAL 2013
0.0
0.5
1.0
1.5
2.0
2.5
NE
W H
AM
PSH
IRE
CO
LOR
AD
O
PE
NN
SYLV
AN
IA
VE
RM
ON
T
RH
OD
E IS
LAN
D
MA
SSA
CH
USE
TT
S
CO
NN
EC
TIC
UT
FLO
RID
A
WA
SHIN
GT
ON
NE
W J
ER
SEY
VIR
GIN
IA
NE
VA
DA
MIS
SOU
RI
OH
IO
MA
INE
OR
EG
ON
MIN
NE
SOT
A
SOU
TH
DA
KO
TA
MO
NT
AN
A
DE
LAW
AR
E
NE
W Y
OR
K
MIC
HIG
AN
TE
NN
ESS
EE
SOU
TH
CA
RO
LIN
A
U.S
.
MA
RY
LAN
D
IND
IAN
A
IOW
A
LOU
ISIA
NA
CA
LIFO
RN
IA
AR
IZO
NA
WIS
CO
NSI
N
IDA
HO
TE
XA
S
OK
LAH
OM
A
GE
OR
GIA
UT
AH
ILLI
NO
IS
KE
NT
UC
KY
KA
NSA
S
ALA
BA
MA
WE
ST V
IRG
INIA
HA
WA
II
NO
RT
H D
AK
OT
A
NE
BR
ASK
A
AR
KA
NSA
S
MIS
SISS
IPP
I
ALA
SKA
NO
RT
H C
AR
OLI
NA
NE
W M
EX
ICO
WY
OM
ING
FIGURE 11
0.22
SOURCE: State Higher Education Executive O�cers and Bureau of Economic Analysis
2.34

SHEEO: STATE HIGHER EDUCATION FINANCE: FY 2014 47
CONCLUSION
Since the beginning of the 21st century, higher education enrollment has grown faster than in any decade since the 1960s. Simultaneously, state and local funding for higher education stagnated twice due to recessions. From 2002 to 2004, total state and local funding hovered around $70 billion. Then, over four years (2005 to 2008), state and local support for public higher education grew to $88.7 billion, partially restoring the per-student support eroded by the 2001 recession. This four-year recovery abruptly ended when, in 2008, the nation suffered the worst recession since the Great Depression. From 2008 to 2011, enrollment grew by an additional 13.6 percent; but state and local support, even with the assistance of the federal economic stimulus funds, stagnated, declining modestly for the nation as a whole and falling dramatically in some states.
This report has summarized enrollment and funding data for 2014. For the second consecutive year, average state and local support per student grew—this time more significantly to $6,552 (5.4 percent) in constant dollars. Further, the share of total revenue per student coming from net tuition revenue declined slightly to 47.1 percent in 2014. These two measures clearly indicate continued economic recovery and recommitment by states to supporting higher education and students; however, as it is for many American families, higher education’s economic recovery remains precarious. Despite two years of per-student funding increases, educational appropriations per student are 18.9 percent below 2008 pre-recession levels. Only three states have increased per-student funding over this time period. Factoring in the rapid tuition increases that occurred to offset cuts in state and local support, total educational revenues per student are also down 2.0 percent from 2008, and only 20 states show positive gains in total educational revenues per student since before the downturn. Further, thirteen states in 2014 reduced their support for higher education, perhaps due to a slower economic recovery than prevailed in other states.
Initial estimates from the Grapevine survey of FY 2015 appropriations for higher education show continued growth overall of 5.2 percent in nominal terms. However, ten states made reductions in 2015 and there is evidence that other states will make cuts in 2016 due to state budget revenue shortfalls, some caused by the low price of oil and others by slow economic recovery and changes in tax policy.
In the past decade, these two recessions and the larger macroeconomic challenges facing the United States have created what some are calling the “new normal” for state funding for public higher education and other public services. In the new normal, retirement and health care costs simultaneously drive up the cost of higher education and compete with education for limited public resources. The new normal no longer expects to see a recovery of state support for higher education such as occurred repeatedly in the last half of the 20th century. The new normal expects students and their families to continue to make increasingly greater financial sacrifices in order to complete a postsecondary education. The new normal expects schools and colleges to find ways of increasing productivity and to absorb reductions in state support while increasing degree production without compromising quality.
At the same time, more and more states are adopting daring completion and attainment goals which will only be achievable by better serving those students who have typically been underserved—first generation, low-income, and minority students. To do so with constrained resources will be challenging. Somehow, the nation and its educators must come to grips with these realities and create effective responses to them. Colleges and universities must find ways to reduce the cost of instruction, improve student progress and reduce the time to a degree, while improving student learning and increasing the number of students who graduate ready
SHEEO: STATE HIGHER EDUCATION FINANCE: FY 2014 48
to be productive citizens. Parents, students, institutions, and states must make tough decisions about priorities—what investments are essential for a better future and where can we and should we reduce spending on non-essentials in order to secure what is essential?
But avoiding bad judgments can be difficult when facing tough choices. Institutions may cut too many quality corners or compete with each other to raise revenue from “new” sources (such as out-of-state or international students) rather than make difficult decisions about priorities or the extra effort required to create and effectively implement innovative practices. Policymakers may overestimate how many students can be well educated within existing resources, or make unrealistic assumptions about the potential for technology and new delivery methods to rapidly become a panacea offsetting the long-term negative effects of budget cuts or tuition increases on access to higher education and the quality of our graduates and workforce. Or the better-off public may be lulled into thinking that the American economy can get by with limited opportunities and 20th-century standards for educational attainment, so long as their own families are well educated. The educational and economic edge the United States once enjoyed in comparison to other nations is eroding rapidly. Sound judgment about priorities and extra measures of commitment and creativity are needed in order to regain our educational and economic momentum.
The data and analysis of this and future SHEF reports are intended to help higher education leaders and state policymakers focus on how discrete, year-to-year decisions fit into broader patterns of change over time, and to help them make decisions in the coming years that will meet the long-term needs of each state’s citizens and of the American people as a whole.


STATE HIGHER EDUCATION EXECUTIVE OFFICERS
3035 CENTER GREEN DRIVE, SUITE 100, BOULDER, COLORADO, 80301 303.541.1600 • SHEEO.org


