Shelley R. Johnson M.A.A.A, A.S.A, F.C.A. P.O Box 1157 Prairieville, LA 70769-1157 (225) 272-7339 February 27, 2013 Board of Trustees LOUISIANA STATE EMPLOYEES' RETIREMENT SYSTEM Post Office Box 44213 Baton Rouge, Louisiana 70804-4213 Ladies and Gentlemen: This report presents the results of the actuarial valuation of assets and liabilities, as well as funding requirements, for the Louisiana State Employees' Retirement System as of June 30, 2012. This report has been prepared in accordance with generally accepted actuarial principles and practices and to the best of my knowledge, fairly reflects the actuarial present value of accrued benefits of the Louisiana State Employees' Retirement System, unless otherwise noted. In preparing this valuation, I have relied upon the information provided regarding plan provisions, plan membership, plan assets and other matters as detailed in the exhibits of this report. In particular, I have relied upon the statement of assets as audited by Duplantier, Hrapmann, Hogan & Mahers, LLP, Certified Public Accountants. The present values shown herein have been calculated on the basis of the actuarial cost methods as specified in Louisiana Revised Statutes Title 11 Section 22(6). All actuarial assumptions have been approved by the Board of Trustees, are appropriate for the purposes of this valuation, and represent my best estimate of the anticipated experience under the plan.
Transcript
Shelley R. Johnson M.A.A.A, A.S.A, F.C.A.
P.O Box 1157 Prairieville, LA 70769-1157
(225) 272-7339
February 27, 2013 Board of Trustees LOUISIANA STATE EMPLOYEES' RETIREMENT SYSTEM Post Office Box 44213 Baton Rouge, Louisiana 70804-4213
Ladies and Gentlemen: This report presents the results of the actuarial valuation of assets and liabilities, as well as funding requirements, for the Louisiana State Employees' Retirement System as of June 30, 2012. This report has been prepared in accordance with generally accepted actuarial principles and practices and to the best of my knowledge, fairly reflects the actuarial present value of accrued benefits of the Louisiana State Employees' Retirement System, unless otherwise noted. In preparing this valuation, I have relied upon the information provided regarding plan provisions, plan membership, plan assets and other matters as detailed in the exhibits of this report. In particular, I have relied upon the statement of assets as audited by Duplantier, Hrapmann, Hogan & Mahers, LLP, Certified Public Accountants. The present values shown herein have been calculated on the basis of the actuarial cost methods as specified in Louisiana Revised Statutes Title 11 Section 22(6). All actuarial assumptions have been approved by the Board of Trustees, are appropriate for the purposes of this valuation, and represent my best estimate of the anticipated experience under the plan.
SJ Actuarial Associates
- 2 -
Board of Trustees LASERS February 27, 2013 A brief summary of the more important figures developed in this valuation, with comparable results from previous valuations are as follows:
I. Membership Census June 30, 2012 June 30, 2011 June 30, 2010 1) Retirees 42,722 41,142 39,385 2) Actives 52,352 54,930 58,881 3) DROP 2,577 2,569 2,629 4) Terminated Vested 2,222 2,125 1,981
II. Annual Benefits $908,116,716 $841,528,896 $774,119,808
III. Total Payroll 2,341,703,286 2,408,839,604 2,546,456,790
IV. Valuation Assets 9,026,415,878 8,763,101,022 8,512,402,951
V. Experience Account 0 0 0
VI. Investment YieldMarket Value (Total Assets) -0.10% 23.17% 16.24%Market Value (Excl. Self Directed, ORP) -0.20% 23.86% 16.68%Actuarial Value 5.20% 5.45% 2.21%DROP 4.70% 4.95% 1.71%
VII. Total Normal Cost 343,529,375 368,632,629 393,664,176Total Normal Cost (% of Payroll) 14.67% 15.30% 15.46%Employer Normal Cost (% of Payroll) 6.10% 6.78% 6.98%
VIII. Unfunded Actuarial Accrued Liability 7,131,481,688 6,457,954,026 6,251,611,737
Plus Alc/Tob Control appropriation 2 81,344 81,344 1 81,868
Composite Rate (Next Year) 3 31.7% 29.4% 1 25.9%
------- Prior Years -------
The above funding requirements measure the cost of benefits that were in effect on June 30, 2012, and Acts of the 2012 Regular Legislative Session.
1 Revised from published 2011 Actuarial Valuation based on change in assumed rate of return, effective 7/1/2012. 2 Peace Officers appropriation is per Act 414 of 2007. Alcohol/Tobacco appropriation is per Act 740 of 2008. 3 Composite rate for all plans. See page 7 for employer rate applicable to each plan, per Act 1026 of 2010.
SJ Actuarial Associates
- 3 -
Board of Trustees LASERS February 27, 2013 Current Funding The Actuarial Valuation for the plan year ending June 30, 2012, discloses an increase in the value of the plan's unfunded accrued liability as well as prospective funding requirements. It is generally appropriate for the current valuation process to disclose the source or cause of any significant changes in the plan from year to year. Changes that occur are usually the result of changes in actuarial assumptions, and/or gains or losses resulting from actual experience differing from expected plan experience. The change in employer rate is impacted by both the change in the total dollar contribution required and by the total aggregate payroll for active members. The increase in the projected employer rate for fiscal year 2012/2013 is primarily affected by the reduction in total payroll and to a lesser extent, by investment losses relative to the assumed actuarial return of 8.25% for last fiscal year. The basic elements of the annual required contribution are the normal cost and amortization of the Unfunded Actuarial Accrued Liability (UAAL). The normal cost is the annual cost to provide an additional year of benefit accrual. The normal cost is divided into two parts, the employee portion and the employer portion, both are expressed as a percentage of payroll. Act 81 of the 1988 Legislative Session provides for the amortization of the initial UAL, plus subsequent changes in benefits, methods or gain/loss experience. Act 497 of the 2009 Legislative Session revised the amortization of the initial UAL and other schedules, as described in Exhibit A-3 of this report. To assist the Board of Trustees in reconciling changes in the unfunded actuarial accrued liability, the following gain/loss analysis is presented as follows:
Unfunded Liability - June 30, 2011 6,457,954,026$
INCREASESInterest on Unfunded Liability $532,781,207Employer Shortfall Deficit 50,918,231Assumption Change 357,645,630Legislative Changes 533,971Experience Loss 1 18,140,119Investment Loss 254,603,759Total Increases 1,214,622,917
1 Reflects experience other than investment experience.
SJ Actuarial Associates
- 4 -
Board of Trustees LASERS February 27, 2013
The employer contribution rate established by the Public Retirement Systems' Actuarial Committee for the 2012/13 plan year is 29.4%. The actual employer contribution rate determined by this valuation for the 2012/13 plan year is 30.6%. Therefore, an employer contribution deficit of 1.2% of payroll is expected next year. Since the contribution rate is attributable to many factors, the following sections address the source and respective impact to the required employer contribution rate.
Recent Legislative Changes
Act 483 of 2012 created a cash balance plan for all non-hazardous duty members whose first employment for membership in LASERS, Teachers Retirement System of Louisiana, or Louisiana School Employees Retirement System occurred on or after July 1, 2013. All provisions in effect on June 30, 2013 will be known as Tier 1. Detailed provisions of the cash balance plan are outlined in Exhibit 5. A general description of the plan is as follows. The member’s cash balance account will be credited with 12% of pay monthly and an interest credit annually. The interest credit will be one percent less than the actuarial rate of return, as determined by the system’s actuary in the actuarial valuation. The accounts will not be debited if the actuarial return less one percent is negative. Upon retirement, on or after age 60 with five years of service, members may choose to withdraw or annuitize the balance in the account. All retirement options available for Tier 1 members are applicable. Employees will contribute 8% of pay. The employer contribution will be actuarially determined, and will include the UAL payments that are shared by all plans, regardless of the source of the UAL. Assets accumulated for the cash balance plan will be excluded from any determination of funds to credit to the experience account and the cash balance plan members are not eligible for permanent benefit increases funded from the experience account. Act 992 of 2010 created three new plans for all members whose first employment makes them eligible for membership in a Louisiana state retirement system on or after January 1, 2011: regular members, judges, and hazardous duty. Members who are in a position that is currently eligible for the hazardous plan may choose to join the hazardous duty plan for prospective service only, or may actuarially transfer all prior service into this plan. Members joining prospectively, without actuarially transferring prior service, will have benefits earned in prior service paid in the normal form of the Hazardous Duty Plan. The cost for members who joined prospectively between July 1, 2012 and July 1, 2013, is reflected in the accrued liability and is amortized over a ten year period with level payments. Act 497 of 2009 consolidated all LASERS amortization schedules established on or before July 1, 2008, except those established due to benefit changes for a specific plan, into two schedules: the Original Amortization Base (OAB) and the Experience Account Amortization Base (EAAB). The OAB consists of the outstanding balance of the Initial Unfunded Accrued Liability (IUAL) and other schedules with negative outstanding balances, and was credited with the balance of funds from the IUAL fund. The EAAB consists of the 2004 schedule and all other remaining schedules.The outstanding balance of this schedule was credited with funds from the IUAL subaccount, which were originally transferred from the Employee Experience Account on June 30, 2009. The payment schedules are established by the Act and are shown in Exhibit A.
SJ Actuarial Associates
- 5 -
Board of Trustees LASERS February 27, 2013 Act 497 revised the amortization of contribution variances resulting in a credit. The act specifies that any overpayment through fiscal year 2016/2017 will be credited to the OAB. The OAB will then be re-amortized according to the new payment schedule. Similarly, any overpayment resulting from the statutory minimum contribution of 15.5% exceeding the actuarially calculated contribution through 2016/2017 will be credited to the EAAB and the EAAB will be re-amortized. In addition, the Act changes the provisions for crediting the Employee Experience Account and for granting future permanent benefit increases. The first $50,000,000 of investment gain above the actuarially assumed investment rate will be used to reduce and re-amortize the OAB. The next $50,000,000 of excess investment return will be used to reduce and re-amortize the EAAB. Fifty percent of any excess return above $100,000,000 will be credited to the Employee Experience Account. Actuarial Assets/Valuation Assets The Actuarial Value of Assets represents the gross actuarial assets determined in accordance with the methodology set forth in Exhibit 6 to fund all liabilities of the pension plan as well as side-fund accounts dedicated for other programs. The Valuation Assets exclude the side-fund accounts for purposes of determining the employer contribution rate as illustrated on page 13, Exhibit 2. The side-fund accounts excluded from valuation assets are as follows:
• Experience Account Fund: The fund accumulates 50% of the excess investment gain relative to
the actuarial valuation rate after such excess return exceeds $100,000,000. The account is used to fund permanent benefit increases for retirees. The benefit increase granted must be funded at 100% of the actuarial cost. The account balance is restricted to the reserve for two permanent benefit increases. The account continues to have a zero balance.
• Employer Credit Account: This fund accumulates the excess of the minimum employer
contribution rate established by Act 588 of 2004 over the tabular rate. The account continues to have a zero balance.
Investment Experience The historical investment yield on the actuarial value of assets for plan years ending June 30 has been as follows:
Actuarial Rate
of Return Average 2008 8.49% 5 Year 2.58% 2009 -7.64% 10 Year 5.29% 2010 2.21% 20 Year 6.98% 2011 5.45% 25 Year 7.60% 2012 5.20% 29 Year 8.02%
For the plan year ending June 30, 2012, the net realized actuarial rate of return of 5.28% was less than the assumed rate of 8.25%, used to discount benefits. The result was a net investment experience loss of $254,603,759 relative to projected investment income. The Board recently adopted a reduction in the discount rate from 8.25% to 8.00%, effective July 1, 2012. PRSAC subsequently approved the revised rate.
SJ Actuarial Associates
- 6 -
Board of Trustees LASERS February 27, 2013
Plan Experience The actuary is charged with making the best estimate of future plan experience to properly fund future benefits. If the actual experience differs from the projected plan experience, a gain or loss occurs. This gain or loss is then amortized over a 30-year period as a level dollar payment. During the 2011/12 plan year, the system incurred a $18,140,119 experience loss from sources other than investments. Funding as a Percentage of Payroll Act 81 of 1987 required employees to contribute 7.5% of payroll beginning in 1989. Act 75 of 2005 revised the contribution rate for regular members hired on or after July 1, 2006, to 8.0%. The employer pays a percentage of the normal cost plus a dollar amount sufficient to amortize the unfunded liability. The employer contribution rate cannot drop below 12%, without regard to employer credits, and without a corresponding adjustment to the employee contribution rate. Prior to July 1, 2010, payments to fund the IUAL increased by 4.5% annually. Subsequent changes to the UAL were amortized as an increasing or level dollar payment as required by statute. Beginning July 1, 2010, payments to amortize the Original Amortization Base and Experience Account Amortization Base will increase as shown in the following table. All other schedules will have level payments.
2018/2019 + 2.0% Level Payments If aggregate payroll increases at the same rate as the increase in amortization payments, this would allow the employer contribution rate attributable to the amortization payments to maintain a level percentage of payroll. During the last 10 years the aggregate salaries from all sources has increased at an annualized rate of 2.32%. If the trend continues at the average rate, the percentage of pay required to amortize the unfunded liability can be expected to increase through fiscal year 2017/2018 in the absence of other experience gains or losses.
Distribution of Cost and Liabilities The aggregate funding for the Plan appears in Exhibit 1. Act 1026 of the 2010 Legislative Session requires that the employer contribution rate be determined separately for each of the following plans. The normal cost portion of each plan’s employer contribution rate varies based upon that plan’s benefits, member demographics, and the rate contributed by employees. The shared UAL contribution rate is determined in aggregate for all plans. The UAL established due to a specific plan or group of plans due to legislation will be allocated entirely to that plan or those plans. The Total Employer Contribution rate is applicable to Appellate Law Clerks, as determined by PRSAC, therefore, the determination of the Rank and File funding requirements include plan experience for Appellate Law Clerks.
The variation in normal cost by plan reflects differences in benefits, actuarial assumptions, and member demographics based on the projected unit credit cost method. One aspect of this method is that the average normal cost tends to increase as the average age of members increase. Therefore, it is expected that the average cost for plans closed to new entrants and for newly created plans will increase in future years. However the aggregate normal cost rate would be expected to remain fairly level if the total average membership age remains level. Given the expectation for an aging population within each plan, the Entry Age Normal cost method would result in more stable funding requirements by plan and should be considered. Comments and Disclosures Exhibit 3, "Pension Accounting and Financial Disclosure," contains disclosure of the accrued liabilities under the Entry Age Normal Actuarial Cost Method required by the Governmental Accounting Standards Board Statement No. 25. The format of this report was designed with the intent of highlighting the pertinent results of the valuation's funding requirements. Please contact me if you have any questions or comments. Sincerely,
Shelley R. Johnson, FCA, MAAA, ASA Actuary
SJ Actuarial Associates
- 8 -
TABLE OF CONTENTS Pages EXHIBIT 1 DEVELOPMENT OF COSTS, LIABILITIES & CONTRIBUTIONS 9 - 10 Provides a detail by benefit type of the cost to accrue annual pension benefits, liabilities accrued to date, and funding requirements EXHIBIT 2 FINANCIAL SUMMARY 11 - 13 Contains the statement of revenue and expenses as well as assets available to pay pension benefits EXHIBIT 3 PENSION ACCOUNTING AND FINANCIAL DISCLOSURE 14 - 16
Disclosures and statistical tables in accordance with GASB Statement No. 25
EXHIBIT 4 CENSUS DATA 17 - 37 Describes the employee data, data processing for valuation purposes and depicts employee profiles by classification, age and service EXHIBIT 5 SUMMARY OF PLAN PROVISIONS 38 - 49 Restates in summary outline form the basic plan provisions which are incorporated in the projected retirement pension benefit EXHIBIT 6 ACTUARIAL COST METHODS AND ASSUMPTIONS 50 - 56 Discloses rates of mortality, disability, retirement, termination and other assumptions which are presumed to reflect the experience of the retirement system in aggregate
EXHIBIT A AMORTIZATION SCHEDULES 57 - 60 Exhibit A-1 – June 20, 2012 Exhibit A-2 – June 20, 2013 – Projected Exhibit A-3 – Amortization Schedule Notes Exhibit A-4 – Components of Original Amortization Base
SJ Actuarial Associates
- 9 -
EXHIBIT 1
DEVELOPMENT OF
COSTS, LIABILITIES AND CONTRIBUTIONS
Normal Costs and Accrued Liabilities are calculated in accordance with the Projected Unit Credit cost method, and the Actuarial Assumptions outlined in Exhibit 6 based on the Provisions of the Plan as summarized in Exhibit 5.
I. Normal Costs Dollar Amount% of
Salary Dollar Amount% of
Salary (to fund annual pension accruals)
Active Members with Complete Dataa) Retirement Benefits 259,757,933 11.09% 277,980,701 11.54%b) Disability Benefits 6,329,773 0.27% 6,459,872 0.27%c) Survivor Benefits 6,949,735 0.30% 7,496,653 0.31%d) Voluntary Termination 53,991,934 2.31% 60,395,403 2.50%e) Expenses 16,500,000 0.70% 16,300,000 0.68% TOTAL 343,529,375 14.67% 368,632,629 15.30%
II. Actuarial Accrued Liability
a) Active Members 1) Retirement Benefits 4,381,448,861 4,355,874,505 2) Disability Benefits 92,370,629 87,736,675 3) Survivor Benefits 91,227,907 84,881,154 4) Voluntary Termination 562,678,212 534,353,264
5,127,725,609 5,062,845,598
b) Retired and Inactive Members 1) Regular Retirees 7,360,741,511 6,633,293,150 2) Disability Benefits 273,268,019 269,468,313 3) Survivors 660,965,505 631,092,458 4) Vested Deferred 182,861,529 174,477,385 5) Contributions Refunded 80,269,264 76,957,888 6) DROP Deferred Benefits 1,597,322,115 1,544,856,298 7) DROP Account Balances 868,143,454 821,745,024 8) ORP Account Balances 6,600,560 6,318,934
11,030,171,957 10,158,209,450
c) Total 16,157,897,566 15,221,055,048
June 30, 2012 June 30, 2011 1---- Prior Year ----
1 The June 30, 2011 values are based on a valuation rate of 8.25%.
II. Actuarial Accrued Liability 16,157,897,566 15,221,055,048
III. Valuation Assets 9,026,415,878 8,763,101,022
IV. Unfunded Actuarial AccruedLiabilities - Projected Unit Credit 1 7,131,481,688 6,457,954,026
a) Change over prior year 673,527,662 206,342,289 b) Funded Percentage 55.9% 57.6%
V. Employer ContributionsTo Fund Current Plan Year 1
a) Employer Portion of Normal Cost 147,061,437 168,315,141 b) Amortization Payments 557,269,001 495,459,127 c) Prior Contribution Variance Amort. Pmt 33,617,223 24,608,443
Projected Aggregate Employer Normal Cost Rate 6.0954% 6.7827%Projected Rank and File Employer Normal Cost Rate 5.7244%
VI. Projected Employer ContributionsTo Fund Next Plan Year 1
a) Employer Portion of Normal Cost 151,063,053 186,106,576 3
b) Amortization Payments 576,035,965 531,955,696 3
c) Prior Contribution Variance Amort. Pmt 57,864,328 32,546,154 3
TOTAL Required Contribution 784,963,346 750,608,426 3
Less, Act 414 appropriation 311,064 311,064 3
Less, Act 353 & 740 appropriation 81,344 81,344 3
NET contribution required 784,570,938 750,216,018 3
31.7% 29.4% 3
VII. Current Payroll 2,341,703,286 2,408,839,604 Projected Payroll - Mid Year 2,412,643,275 2,481,552,887 Projected Payroll - Next Year 2,478,292,514 2,549,614,128
1 Dollar Amounts reflect estimated payments due mid-year on January 1st per Act 81.
2 Constitutional Minimum is 12% without regard to Employer Credits.
3 Values shown for the projected employer contribution rate for Fiscal Year 2012/2013 differ from the originally published valuation. Values shown are based on a valuation rate of 8.00%.
SJ Actuarial Associates
- 11 -
EXHIBIT 2
FINANCIAL SUMMARY
STATEMENT OF REVENUES AND EXPENSES FOR FISCAL YEAR ENDING
1 Amounts shown reflect values used in the 2010 actuarial valuation, rather than the restated 2010 Statement of Assets.
Plan Year - 2 (wt. 3/4) 698,024,720 (1,410,353,074) (1,064,807,621) Plan Year - 1 (wt. 2/4) 1,258,628,704 698,024,720 (1,410,353,074) Plan Year (wt. 1/4) (419,282,757) 1,258,628,704 698,024,720
9,026,415,878 8,763,101,022 8,512,402,951
CORRIDOR LIMITS Minimum = 80% of Market Value 7,612,619,474 7,762,797,313 6,451,634,439 Maximum = 120% of Market Value 11,418,929,210 11,644,195,969 9,677,451,659
Actuarial Value of Assets 9,026,415,878 8,763,101,022 8,512,402,951
Yield-to-Market Value (Total Assets) -0.10% 23.17% 16.24%Yield-to-MV (Excl. Self Directed, ORP) -0.20% 23.86% 16.68%Yield-to-Actuarial Value 5.28% 5.45% 2.21%Five-Year Actuarial Value 2.60% 4.29% 5.73%
DROP Account Yield 4.78% 4.95% 1.71%
Preliminary Actuarial Value of Assets
TOTAL ASSETSChange in Unrealized (G/L)
Securities Lending Assets - Liabilities
INVESTMENT YIELD:
----Prior Years---
Other Assets
Receivables(-)Payables
TOTAL ASSETS - Market Value Cost Value
Short-Term Assets
Bonds
Equities
ACTUARIAL VALUE OF ASSETS:
1 Amounts shown reflect values used in the 2010 actuarial valuation, rather than the restated 2010 Statement of Assets.
SJ Actuarial Associates
- 13 -
EXHIBIT 2 (Continued) Financial Summary
FINANCIAL SUMMARY STATEMENT OF ASSETS
FOR FISCAL YEAR ENDING
June 30, 2012 June 30, 2011 June 30, 2010
Prior Year Ending Balance -$ -$ -$ + Current Year Allocation - - - - Current Year Disbursements - - - + Accumulated Interest - - -
1 The Employer Credit Account was created by ACT 588 of 2004. 2 Disbursement to reduce OAB or EAAB, per Act 497 of 2009.
SJ Actuarial Associates
- 14 -
EXHIBIT 3
PENSION ACCOUNTING
AND FINANCIAL DISCLOSURE
The Governmental Accounting Standards Board (GASB) was established as an arm of the Financial Accounting Foundation in April 1984 by amendment to the Foundation's certificate of incorporation and by-laws. GASB's objective is to promulgate standards of financial accounting and reporting relative to the activities and transactions of state and local governmental entities. The following disclosures and statistical tables are in accordance with the GASB's Statement No. 25.
SCHEDULE OF FUNDING PROGRESS(Dollar amounts in thousands)
The total actuarial accrued liability, determined using the Projected Unit Credit cost method, increased by $936,842,518 from June 30, 2011, to June 30, 2012. There was an investment loss of $254,603,759, an experience loss from sources other than investments of $18,140,119, and an increase in liabilities of $357,645,630 due to a change in the valuation rate. See page 3 for complete allocation of change in UAAL. 1
UAAL differs from the UFAL for funding purposes when the IUAL Account or Employer Credit Account hold fund balances. UFAL for funding purposes excludes the IUAL Account and the Employer Credit Account.
SUPPLEMENTARY INFORMATIONSCHEDULE OF EMPLOYER CONTRIBUTIONS
The Actuarial Required Contribution and the Annual Pension Cost are interest adjusted at the valuation rate to the end of the fiscal year. Calculations are in accordance with GASB’s Statement No 27, paragraph 21. The difference between the Actuarial Required Contribution and the Annual Pension Cost is the amortization payment for the Net Pension Obligation. (See Exhibit A.) The percentage of ARC contributed provides a general indication of the funding progress for the liabilities of the LASERS. However, it should be noted that employers pay 100% of the required contribution based on a percentage of pay, which is determined following statutory requirements. The employer contribution rate is projected one year beyond the rate for which the ARC is determined. The resulting contribution variance between the ARC and the required employer rate can be either a credit or deficit. If it is a deficit, the deficit is amortized with level dollar payments over a five year period and paid through future employer contributions. If it is a surplus, the surplus is used to reduce and reamortize the existing UAL schedules.
(1) Actuarial Required Contribution 713,971,279 (2) Interest on Net Pension Obligation 10,118,206 (3) Amortization of Net Pension Obligation 25,603,426 (4) Annual Pension Cost (1)+(2)-(3) 698,486,059
(5) Employer Contribution 663,053,048 (6) Increase (decrease) in Net Pension Obligation 35,433,011 (7) Net Pension Obligation Beginning of Year 122,644,938 (8) Net Pension Obligation End of Year (6)+(7) 158,077,949
1 Includes transfers and purchases and the annual employer contribution, and any legislative appropriations.
2 The auditors have restated Net Income to include unrealized market value from the security lending program previously reported as $889,281,150 for 2004 and $98,865,745 for 2003. The adjustments were deemed immaterial for valuation purposes for prior years.
3 Includes other expenses, not related to the administration of daily operation. Beginning in 2008, includes the net OPEB obligation.
4 Amounts shown reflect values used in the 2010 actuarial valuation, rather than the restated 2010 Statement of Assets.
AND EXPENSES BY TYPECOMPARATIVE SUMMARY OF REVENUES BY SOURCE
SJ Actuarial Associates
- 17 -
EXHIBIT 4
CENSUS DATA
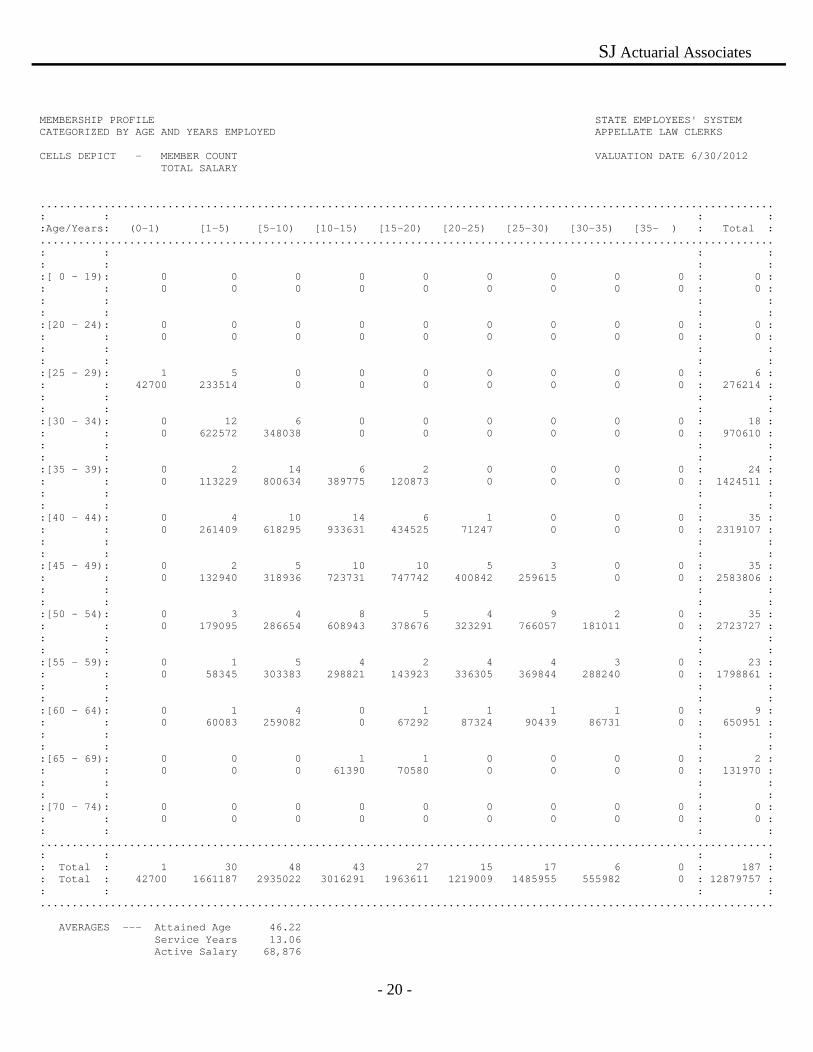
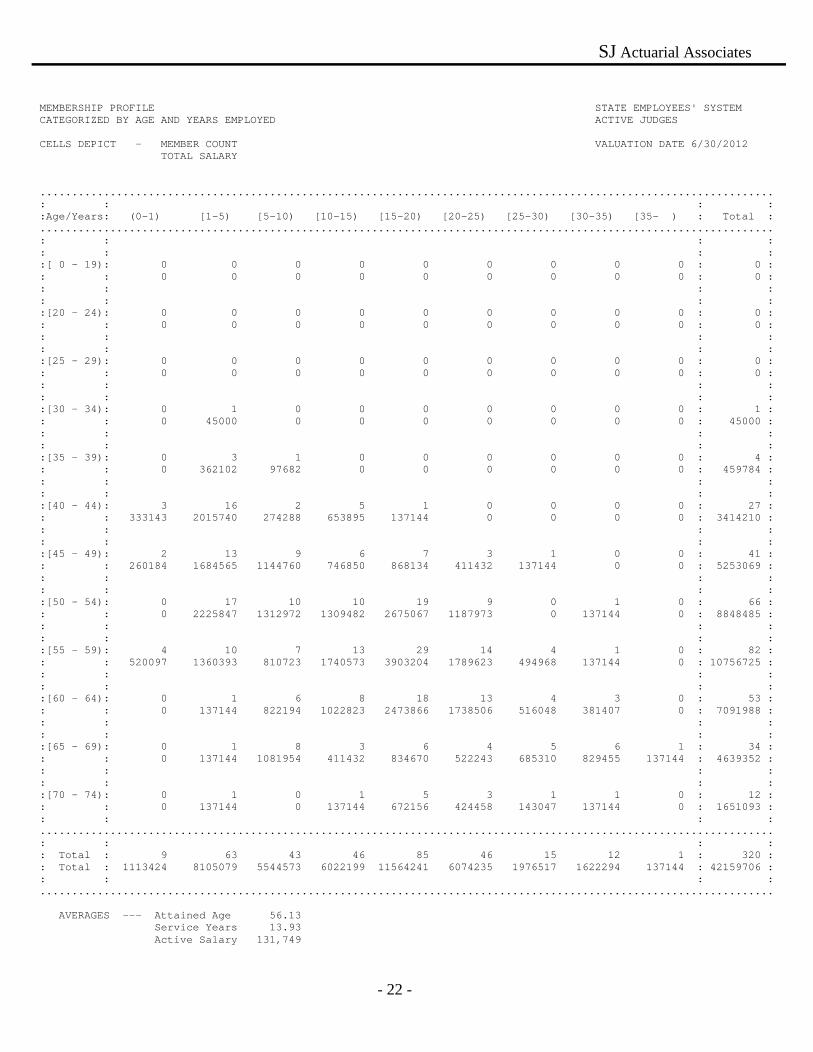
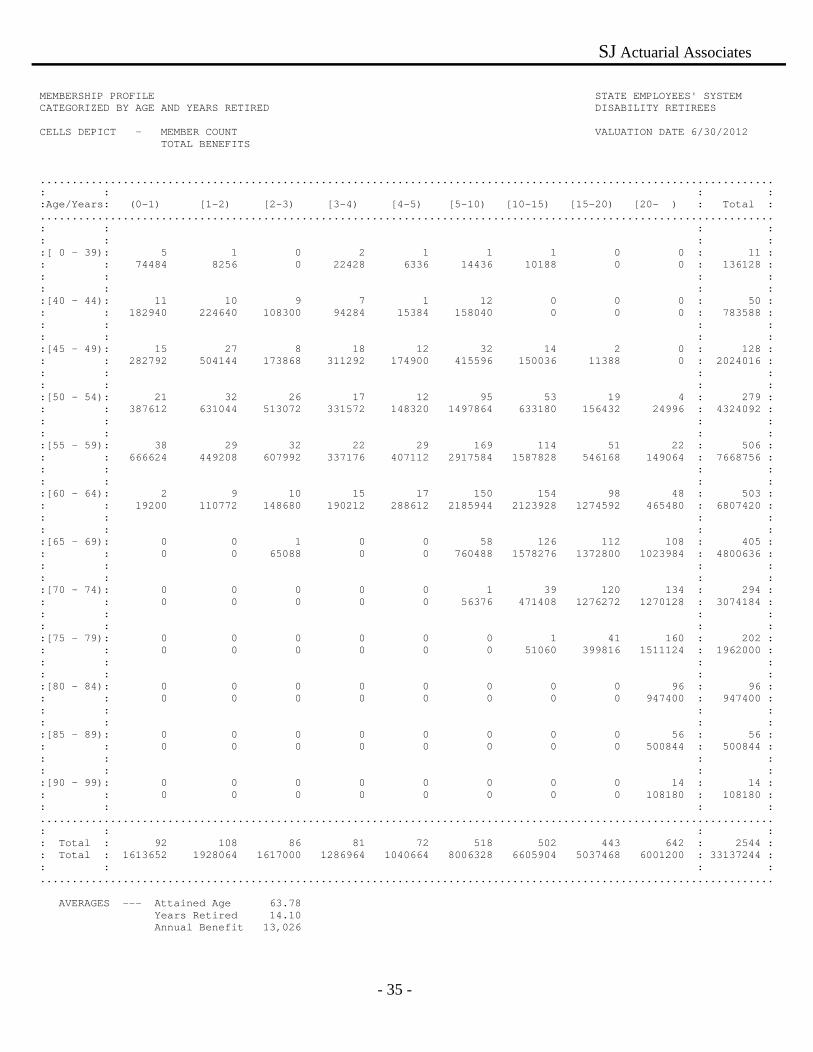
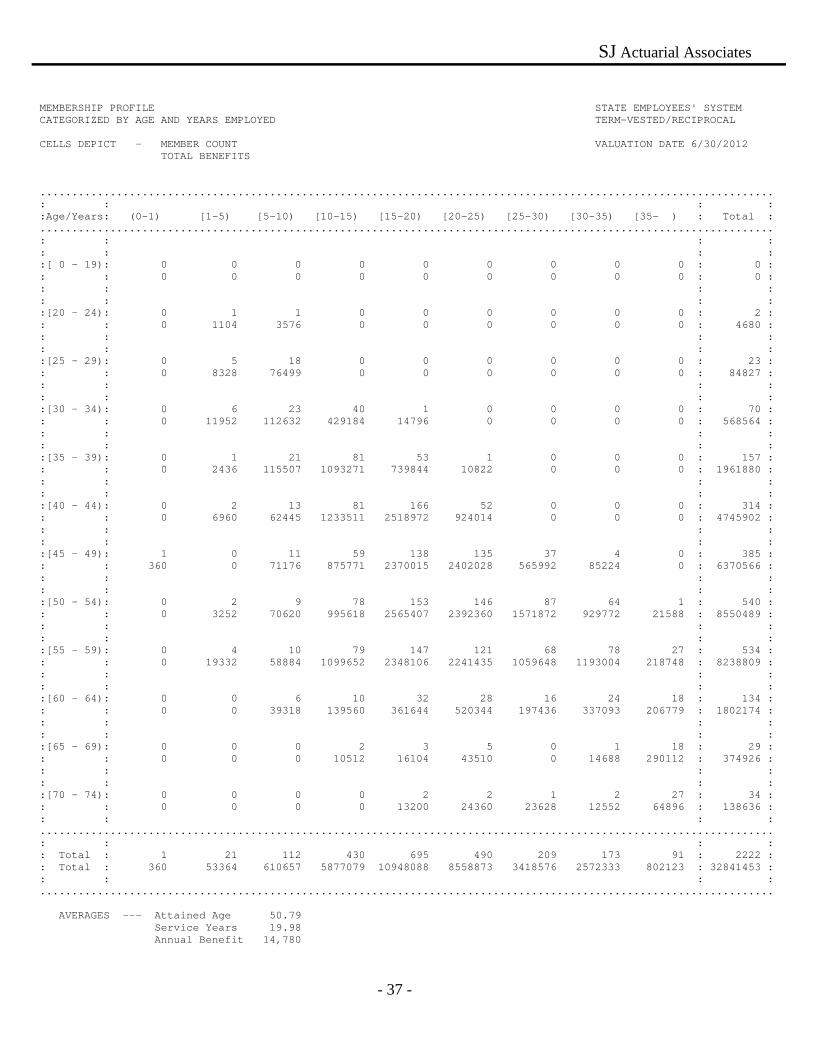
The data contained in this valuation is summarized on the following pages with exceptions noted below. The profile depicted in the cellular graphs represents "error-free data," which serves as the basis for determining costs and liabilities. Active members are allocated to cells based upon attained age and years of service. Retirees and Survivors are allocated to cells based upon attained age and years elapsed since retirement or commencement of benefits. The validity of the results of any actuarial valuation is dependent upon the accuracy of the database. Prior to processing, records identified as containing suspicious data were assumed to possess the same characteristics of “good data” in the same cohort based upon the following possible errors: - missing sex code - missing or invalid date of birth - missing or invalid date of employment - missing or invalid salary - invalid retirement dates Suspicious data are not necessarily errors, but data, which fall outside the parameters of the editing process for further checking. There were no records purged from the database. Salary data contained in the profiles and valuation report exceed the amount reported by internal audit due to salary annualization. In the valuation process, membership data with fractional service in the first year of employment annualizes the salary. Disability retirees who have reached normal retirement eligibility requirements are considered regular retirees by LASERS but are classified as disability retirees for purposes of the actuarial valuation. Liabilities are calculated accordingly. The following is a summary by plan of the data submitted for valuation:
TIER 1 – All Plans other than Cash Balance Plan EFFECTIVE DATE:
July 1, 1947 EMPLOYEE:
Any person legally occupying a position in state service. EMPLOYER:
The State of Louisiana or any of its boards, commissions, departments, agencies and courts which are contributing members and those approved for membership by the legislature from which any employee receives his compensation.
ELIGIBILITY FOR PARTICIPATION:
Condition of employment in state service except the following: elected or appointed officials or employees who are contributing members of any other state system; public officials and state employees who receive a per diem in lieu of compensation; persons employed prior to January 1, 1973, who work on a part-time basis and elect not to participate; patient or inmate help in state charitable, penal or correctional institutions; part-time students, interns and resident physicians; independent contractors; employees who are age 60 or older at time of employment; retirees of the retirement system who return to work under certain conditions; judges who failed to elect membership prior to October 2, 1976; civilian employees who on November 1, 1981, were within five years of retirement eligibility in the Federal Civil Service Retirement and Disability Fund; teachers employed after September 10, 1982; nurses employed from employment pools at state charity hospitals; temporary, seasonal, part-time employees of DOTC, or as defined in federal law.
SERVICE:
Service as an "Employee," defined above. CREDITABLE SERVICE:
For service prior to January 1, 1973: 1/4 year granted for each 89 day interval of service, not to exceed one credit per fiscal year. Minimum 15 days required for 1st Quarter credit. For service on or after January 1, 1973, a member shall receive credit based on the ratio of actual pay to the annual base per calendar year. Fractional service shall be rounded to the next highest 1/10th, not to exceed 100 percent per year.
SJ Actuarial Associates
- 39 -
EXHIBIT 5 (Continued) Summary of Plan Provisions ADDITIONAL CREDITABLE SERVICE:
1. Credit for service canceled by withdrawal of accumulated contributions may be restored by member by paying into system the amount withdrawn plus interest at the Actuarial Valuation rate.
2. Maximum of four years of credit for military service may be obtained for each member with at least two years service, contingent on payment of Actuarial Cost.
3. Credit for service which was classified as a job appointment or emergency appointment where the intended duration of employment exceeds two years service.
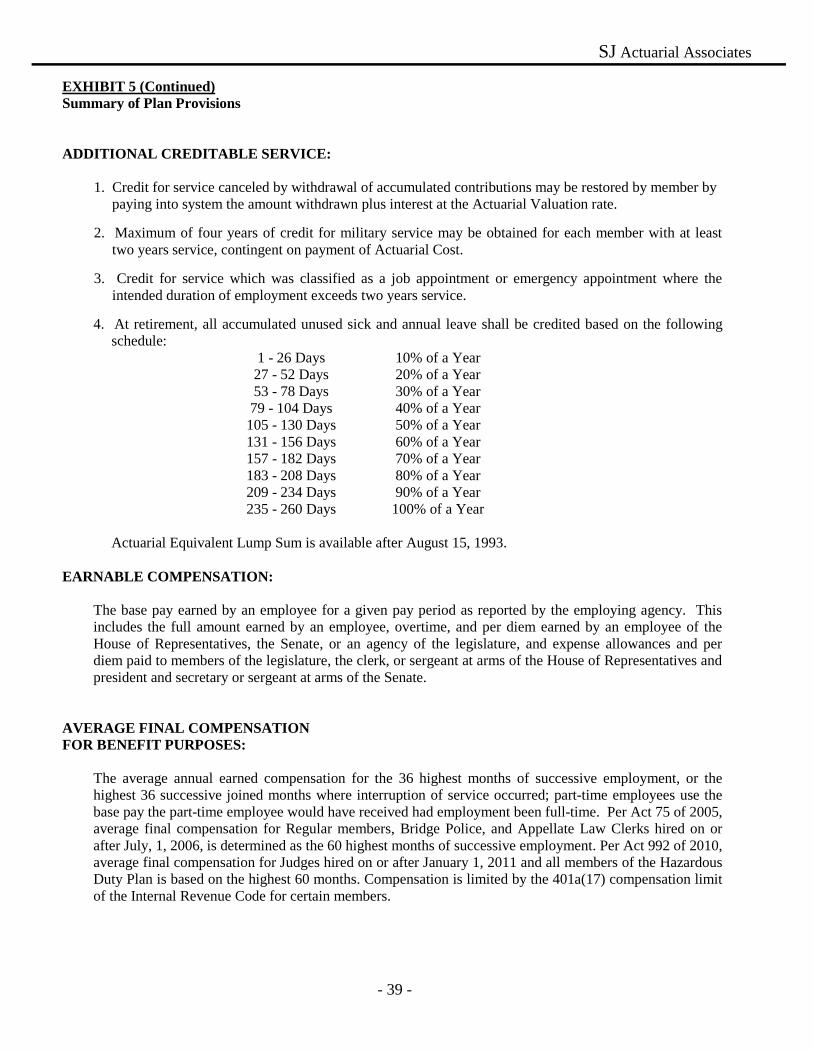
4. At retirement, all accumulated unused sick and annual leave shall be credited based on the following schedule:
1 - 26 Days 10% of a Year 27 - 52 Days 20% of a Year 53 - 78 Days 30% of a Year
79 - 104 Days 40% of a Year 105 - 130 Days 50% of a Year 131 - 156 Days 60% of a Year 157 - 182 Days 70% of a Year 183 - 208 Days 80% of a Year 209 - 234 Days 90% of a Year 235 - 260 Days 100% of a Year
Actuarial Equivalent Lump Sum is available after August 15, 1993.
EARNABLE COMPENSATION:
The base pay earned by an employee for a given pay period as reported by the employing agency. This includes the full amount earned by an employee, overtime, and per diem earned by an employee of the House of Representatives, the Senate, or an agency of the legislature, and expense allowances and per diem paid to members of the legislature, the clerk, or sergeant at arms of the House of Representatives and president and secretary or sergeant at arms of the Senate.
AVERAGE FINAL COMPENSATION FOR BENEFIT PURPOSES:
The average annual earned compensation for the 36 highest months of successive employment, or the highest 36 successive joined months where interruption of service occurred; part-time employees use the base pay the part-time employee would have received had employment been full-time. Per Act 75 of 2005, average final compensation for Regular members, Bridge Police, and Appellate Law Clerks hired on or after July, 1, 2006, is determined as the 60 highest months of successive employment. Per Act 992 of 2010, average final compensation for Judges hired on or after January 1, 2011 and all members of the Hazardous Duty Plan is based on the highest 60 months. Compensation is limited by the 401a(17) compensation limit of the Internal Revenue Code for certain members.
SJ Actuarial Associates
- 40 -
EXHIBIT 5 (Continued) Summary of Plan Provisions ACCUMULATED CONTRIBUTIONS:
The sum of all amounts deducted from the earned compensation of a member and credited to the individual account in the employee's savings account, together with regular interest credited prior to July 1971.
EMPLOYEE CONTRIBUTIONS:
Plan Current Contribution Regular Employees and Appellate Law Clerks Pre Act 75 (hired before 7/1/2006) 7.5% Post Act 75 (hired after 6/30/2006) 8.0% Legislators 11.5% Judges hired before 1/1/2011 11.5% Judges hired after 12/31/2010 13% Corrections Primary and Secondary 9.0% Wildlife and Fisheries 9.5% Peace Officers/Alcohol Tobacco Control 9.0% Bridge Police 8.5% Hazardous Duty 9.5%
EMPLOYER CONTRIBUTIONS:
Act 81 of 1988 requires the employer rate to be actuarially determined and set annually, based on the Public Retirement Systems' Actuarial Committee's recommendation to the Legislature. Act 1026 of the 2010 Legislative Session further requires that the employer contribution rate be determined separately by plan. The normal cost portion of each plan’s employer contribution rate varies based upon that plan’s benefits, member demographics, and the rate contributed by employees. The shared UAL contribution rate is determined in aggregate for all plans. The UAL established due to a specific plan or group of plans due to legislation will be allocated entirely to the applicable plan(s).
RETIREMENT BENEFIT: NORMAL RETIREMENT: Eligibility and Benefit:
Members whose first employment which makes them eligible for membership in a Louisiana state retirement system occurs on or after January 1, 2011: 1. Regular Plan: Eligible with 5 years at age 60. Benefit accrual rate is 2.5%. 2. Judges: Eligible with 5 years at age 60. Benefit accrual is 3.5%, plus regular plan benefits for prior
service.
SJ Actuarial Associates
- 41 -
EXHIBIT 5 (Continued) Summary of Plan Provisions
3. Hazardous Duty Plan: Eligible with 12 years at age 55 or 25 years at any age. Benefit accrual rate is 3.33% for service earned in the Hazardous Duty Plan if the last 10 years of service was earned in a hazardous duty position; otherwise, the accrual rate is 2.5%.
Members whose first employment which makes them eligible for membership in a Louisiana state retirement system occurs prior to January 1, 2011: 1. Regular members hired prior to July 1, 2006: Eligible with 10 years at age 60, or 25 years at age 55, or
30 years at any age. Regular members hired on or after July 1, 2006 are eligible with 5 years at age 60. Benefit accrual rate is 2.5% for all years of service.
2. Judges, Court Officers, and Appellate Law Clerks: Eligible with 18 years at any age, 10 years at age 65,
20 total years with at least 12 years as a judge or court officer at age 50, 12 years at age 55, or age 70 regardless of service. Judges and Court Officers earn 3.5% for year of service, plus regular plan benefits for prior service. Appellate Law Clerks earn 2.5% for all years of service.
3. Members of the legislature, governor, lieutenant governor and state treasurer: Eligible with 16 years of
service at any age, 20 total years with at least 12 years as a member of this class at age 50, or 12 years at age 55. Members earn 3.5% per year of service, plus regular plan benefits for prior service.
4. Plans for certain employees of the Department of Public Safety and Corrections:
a. Corrections Primary, hired before 8/15/1986: Eligible with 10 years at age 60 or 20 years at any age. Benefit accrual rate is 2.5%.
b. Corrections Primary, hired between 8/15/1986 and 12/31/2001: Eligible with 10 years at age 60 or 20 years at age 50. Benefit accrual rate is 2.5%.
c. Corrections Secondary Plan, hired after 1/1/2002, or transferred from Corrections Primary Plan: Eligible with 10 years at age 60 or 25 years at any age. Benefit accrual rate is 3.33%.
5. Wildlife and Fisheries:
a. Members hired before July 1, 2003: 10 years at age 55, or 20 years at any age. Benefit accrual is 3.0% for service earned prior to July 1, 2003 and 3.33% for service earned after July 1, 2003.
b. Members hired on or after July 1, 2003: 10 years at age 60, or 25 years at any age. Benefit accrual is 3.33%.
6. Peace Officers: Eligible with 10 years of service and age 60 or at 25 years at age 55, or 30 years at any
age. Benefit accrual is 3.33%.
7. Alcohol Tobacco Control: Eligible with 10 years of service and age 60 or at 25 years of service at any age. Benefit accrual is 3.33%.
8. Bridge Police: Eligible with 10 years at age 60, or 25 years at any age. Benefit accrual is 2.5%
NOTES:
A. Benefit is limited to 100% of average compensation.
SJ Actuarial Associates
- 42 -
EXHIBIT 5 (Continued) Summary of Plan Provisions
B. Retirees who return to work will continue to receive unreduced benefits if compensation does not
exceed 50% of the annual benefit during the fiscal year. Earnings above this limit will result in a corresponding reduction to benefits. Retirees who return to work may choose to suspend their retirement benefits and resume making contributions in the system. Upon subsequent retirement, benefit will resume. If post-retirement employment is at least 36 months, a supplemental benefit will be calculated. Otherwise, employee contributions will be refunded.
C. A $300 annual supplemental benefit is provided to persons who become members of the retirement
system prior to July 1, 1986 (Act 608 of 1986). D. For members employed after January 1, 1990, the annual pension paid from the trust cannot exceed
the maximum benefit provided under Section 415(b) of the Internal Revenue Service Code, and related Section 415 regulations, as adjusted for inflation and form of benefit other than life annuity or qualified joint and survivor annuity for retirement ages as follows:
Members with 20 years of service credit at any age are eligible for an actuarially reduced benefit from the earliest date member would be eligible if employment had continued, to the earliest normal retirement date, based on service earned to date. This does not apply to the correctional secondary plan members or wildlife agents hired on or after July 1, 2003.
POST RETIREMENT INCREASES:
Permanent benefit increases, previously referred to as cost of living adjustments, may be granted, with legislative approval, provided there are sufficient funds in the Experience Account to fully fund the increase on an actuarial basis. Beginning July 1, 2009, the Experience Account is credited with fifty percent of excess investment income above $100,000,000. Excess investment income is investment income over the actuarial valuation rate of 8.25%. Balances in the Experience Account accrue interest at the average actuarial yield for the System portfolio. The Employee Experience Account balance is limited to the funds necessary to fund two benefit increases. The Experience Account is debited for the increase in actuarial accrued liability resulting from the increases.
SJ Actuarial Associates
- 43 -
EXHIBIT 5 (Continued) Summary of Plan Provisions
If the actuarial rate of return for the prior fiscal year is at least 8.25%, regardless of the actuarial valuation rate, the benefit increase is limited to the lesser of 3% or the increase in the CPI-U for the calendar year immediately preceding the increase. If the actuarial rate of return for the prior fiscal year is less than 8.25%, regardless of the actuarial valuation rate, the benefit increase is limited to the lesser of 2% or the increase in the CPI-U for the calendar year immediately preceding the increase, provided the System is at least 80% funded. If the actuarial rate of return for the prior fiscal year is less than the actuarial valuation rate and the System is not at least 80% funded, no increase can be granted. Benefits are restricted to those retirees who have attained the age of 60 and have been retired for at least one year. The minimum age of 60 for the receipt of a benefit increase does not apply to disability retirees. The increase shall be based on the first seventy thousand dollars of the retiree’s annual benefit, indexed annually for years after 1999.
MINIMUM BENEFITS:
Effective September 1, 2001, retirees and beneficiaries receiving retirement benefits shall be entitled to a minimum benefit which is not less than $30.00 per month for each year of creditable service. The minimum benefit is adjusted for the option elected at retirement.
DISABILITY RETIREMENT: Eligibility:
Ten years of creditable service and certification of disability by medical board. (Medical examination may be required once per year for the first five years of disability retirement, and once every three years thereafter, until age 60.)
Benefit:
1) The disability retirement annuity shall be equivalent to the regular retirement formula without reduction by reason of age for all classes of membership.
2) For judges and court officers, the benefit in (1) but not less than 50% of current salary.
3) Members of the Corrections Primary Plan with disabilities incurred in the line of duty may retire with 60% of their final average compensation, regardless of years of service Disabilities incurred not in the line of duty paid according to (1) above.
4) Members of the Corrections Secondary Plan with disabilities incurred in the line of duty may retire with 40% of their final average compensation regardless of service. If the member has 10 or more years of service, the benefit will be the greater of 40% of final average compensation or the benefit determined by (1) above. Disabilities incurred not in the line of duty determined according to (1) above.
5) For certain Wildlife agents; partial disabilities not eligible for (1) above receive 75% of the benefit in (1); members totally disabled while in the line of duty receive 60% of average compensation.
6) Members of the Hazardous Duty Plan with disabilities incurred in the line of duty may retire with 75% of their final average compensation, regardless of years of service Disabilities incurred not in the line of duty paid according to (1) above.
SJ Actuarial Associates
- 44 -
EXHIBIT 5 (Continued) Summary of Plan Provisions
SURVIVOR'S BENEFITS:
Members whose first employment which makes them eligible for membership in a Louisiana state retirement system occurs on or after January 1, 2011, or members of the Hazardous Duty Plan regardless of when hired:
Eligibility and Benefit:
1. Regular Members and Judges a. Surviving spouse with minor children of a deceased member with five years of service credit, two of
which were earned immediately prior to death, or 20 years of service will receive 50% of the retirement benefit that would have been due the member, or $600 per month if greater. Each qualifying child will receive 50% of the spouses benefit, up to 2 children. The total paid to the spouse and children subject to a minimum based on the Option 2A equivalent for the surviving spouse.
b. Surviving spouse, legally married one year prior to death, of a deceased member with 10 years of service credit, two of which were earned immediately prior to death, or 20 years of service regardless of date earned will receive the Option 2A equivalent of the retirement benefit that would have been due the member, or $600 per month if greater.
c. Surviving minor children will each (up to two) receive 50% of the benefit paid to a surviving spouse with children. This amount will be divided equally among all eligible children.
d. Surviving handicapped or mentally retarded children continue to receive a minor child's benefit described above in (1) or (3) whichever is applicable.
2. Hazardous duty members:
a. Surviving spouse and children of members who did not die in the line of duty receive benefits described for non-Hazardous Duty members
b. Surviving spouse and children of members who died in the line of duty receive 80% of the member’s final average compensation. The benefit is shared equally.
c. Surviving spouse of a retired member will receive 75% of members' monthly benefit. If no spouse, then surviving children receive 1.c. above.
3. If no one eligible to receive a survivor benefit, then the named beneficiary will receive the member's accumulated contributions.
Members whose first employment which makes them eligible for membership in a Louisiana state retirement system occurs prior to January 1, 2011:
Eligibility and Benefit:
1. Regular members:
a. Surviving spouse, legally married one year prior to death, of a deceased member with 10 years of service credit, two of which were earned immediately prior to death, or 20 years of service regardless of date earned, receive the greater of 50% of member's average compensation or $200 per month.
SJ Actuarial Associates
- 45 -
EXHIBIT 5 (Continued)
Summary of Plan Provisions
b. If member with no spouse has surviving minor child, and 5 years of service credit, two of which were earned immediately prior to death, or 20 years of service regardless of date earned, minor children receive the greater of 75% of member's average compensation or $300 per month.
c. For surviving spouse with minor children, the spouse must be eligible per (a) above and the children per (b) above to receive these benefits. If either one is ineligible, then the criteria in (a) or (b) would apply accordingly.
d. Surviving handicapped or mentally retarded children continue to receive a minor child's benefit described above in (1a) or (1c) whichever is applicable.
2. Surviving spouse of a judge or court officer receive survivor's benefit described in (1a) or (1b), but not
less than the greater of 1/3 the member's current compensation, 50% of the retirement pay which such member was entitled or receiving prior to death, or 50% of the members final average compensation (if the provisions of R.S. 11:471 are met). Benefit limited to 75% of average compensation.
3. Corrections
a. In the line of duty: i. Surviving spouse with no minor children: 60% of average compensation if member had less
than 25 years of service, or 75% of average compensation if member had 25 or more years of service.
ii. Minor children or disabled children and no spouse: 60% of average compensation if member had less than 5 years of service (25 years for Secondary Plan), or 75% of average compensation if member had 5 or more years of service (25 years for Secondary Plan).
iii. Surviving spouse with minor children: 60% of average compensation if member had less than 5 years of service (25 years for secondary plan) and benefit divided 1/3 to spouse and 2/3 to minor children equally. 75% of average compensation if member had 5 or more years of service (25 years for Secondary Plan) and benefit divided 1/3 to spouse and 2/3 to minor children equally.
b. Not in the line of duty surviving spouse of receives benefits in accordance with the provisions for regular members.
4. Wildlife agents
a. In line of duty: i. Surviving spouse receives 75% of average compensation if member has 25 or more years of
service, otherwise, spouse receives 60% of compensation. Benefits cease upon remarriage. ii. Children under age 18: one child – 30% of average compensation, 2 children – 40%, 3 children
– 50%, 4 or more children – 60%, divided equally among children.
b. Not in the line of duty benefit to surviving spouse and children: Surviving spouse receives a benefit as if the member retired on the date of death, until remarried. If member dies prior to age 55 with at least 15 years of service, benefit computed based on years of service without regard to age.
c. Survivors of retired wildlife agents will receive 75% of the retiree benefit in priority order: surviving spouse (until remarriage), children under age 18, parents who derive main support from retired agent.
5. If no one is eligible to receive a survivor benefit, then the named beneficiary will receive the member's
accumulated contributions.
SJ Actuarial Associates
- 46 -
EXHIBIT 5 (Continued) Summary of Plan Provisions
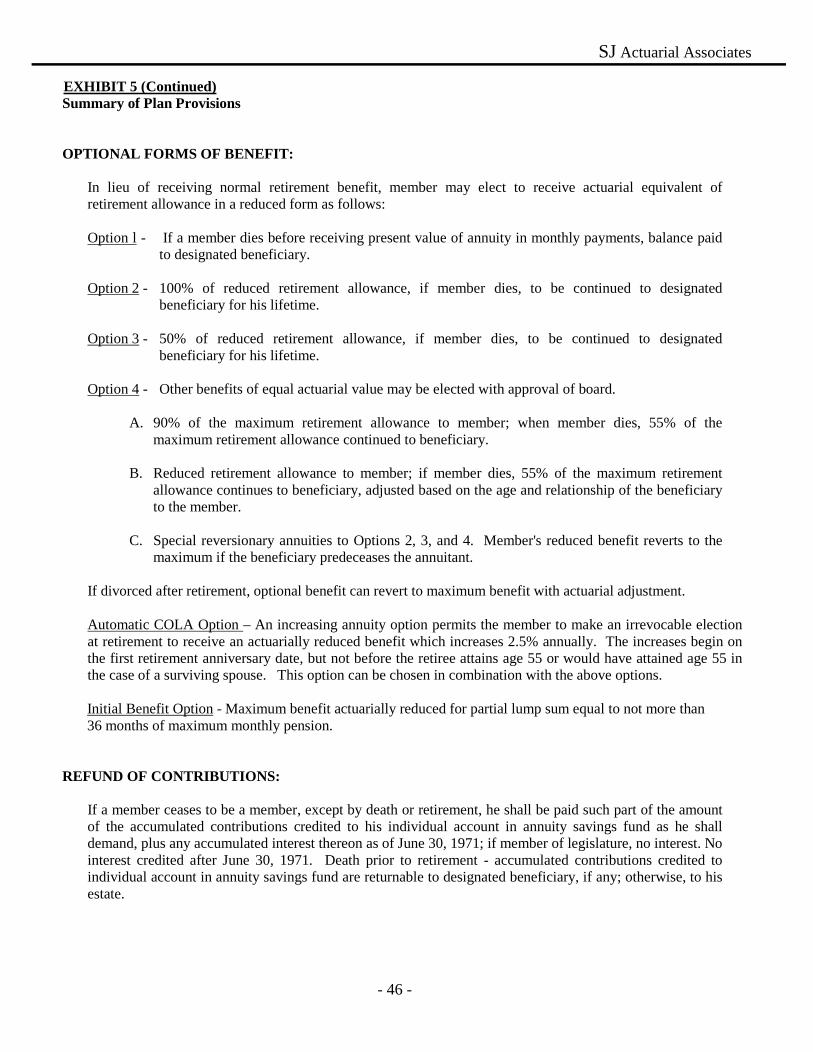
OPTIONAL FORMS OF BENEFIT:
In lieu of receiving normal retirement benefit, member may elect to receive actuarial equivalent of retirement allowance in a reduced form as follows: Option l - If a member dies before receiving present value of annuity in monthly payments, balance paid
to designated beneficiary. Option 2 - 100% of reduced retirement allowance, if member dies, to be continued to designated
beneficiary for his lifetime. Option 3 - 50% of reduced retirement allowance, if member dies, to be continued to designated
beneficiary for his lifetime. Option 4 - Other benefits of equal actuarial value may be elected with approval of board.
A. 90% of the maximum retirement allowance to member; when member dies, 55% of the maximum retirement allowance continued to beneficiary.
B. Reduced retirement allowance to member; if member dies, 55% of the maximum retirement
allowance continues to beneficiary, adjusted based on the age and relationship of the beneficiary to the member.
C. Special reversionary annuities to Options 2, 3, and 4. Member's reduced benefit reverts to the
maximum if the beneficiary predeceases the annuitant. If divorced after retirement, optional benefit can revert to maximum benefit with actuarial adjustment. Automatic COLA Option – An increasing annuity option permits the member to make an irrevocable election at retirement to receive an actuarially reduced benefit which increases 2.5% annually. The increases begin on the first retirement anniversary date, but not before the retiree attains age 55 or would have attained age 55 in the case of a surviving spouse. This option can be chosen in combination with the above options. Initial Benefit Option - Maximum benefit actuarially reduced for partial lump sum equal to not more than 36 months of maximum monthly pension.
REFUND OF CONTRIBUTIONS:
If a member ceases to be a member, except by death or retirement, he shall be paid such part of the amount of the accumulated contributions credited to his individual account in annuity savings fund as he shall demand, plus any accumulated interest thereon as of June 30, 1971; if member of legislature, no interest. No interest credited after June 30, 1971. Death prior to retirement - accumulated contributions credited to individual account in annuity savings fund are returnable to designated beneficiary, if any; otherwise, to his estate.
SJ Actuarial Associates
- 47 -
EXHIBIT 5 (Continued) Summary of Plan Provisions DEFERRED RETIREMENT OPTION PLAN:
Instead of terminating employment and accepting a service retirement allowance, any member who has met the normal eligibility requirements may participate in the Deferred Retirement Option Plan (DROP).
Normal Eligibility:
Any member who is eligible for unreduced service retirement allowance may begin participation on the first retirement eligibility date for a period not to exceed the third anniversary of retirement eligibility.
Benefit: Upon termination of employment, a participant will receive, at his option:
(1) Lump sum payment (equal to the payments to the account); (2) A true annuity based upon his account; or (3) Other methods of payment approved by the Board of Trustees.
If a participant dies during the period of participation in the program, his account balance shall be paid to the beneficiary, or if none, to his estate in any form approved by the Board of Trustees. If employment is not terminated at the end of DROP participation, then:
(1) Payment into account shall cease; (2) Payment from account only upon termination of employment; and (3) The participant shall resume active contributing membership.
Then, upon termination of employment, the benefit payments indicated above shall be paid. The participant shall receive an additional retirement benefit based on additional service rendered since termination of participation in the fund, usually the normal method of computation of benefit subject to the following:
(1) If additional service was less than the period used to determine the average compensation, then the average compensation figure used to calculate the additional benefit shall be based on compensation used to determine the initial benefit.
(2) If additional service was greater than the period used to determine the average
compensation, the average compensation figure used to calculate the additional benefit shall be based on compensation earned during the period of additional service.
DROP accounts for members who become eligible for retirement prior to January 1, 2004, and participate in DROP shall earn interest, following termination of DROP, at a rate of 0.5% below the actuarial rate of the System's investment portfolio. Members eligible for retirement on or after January 1, 2004, must invest their DROP accounts in self- directed accounts approved by the Board of Trustees.
SJ Actuarial Associates
- 48 -
EXHIBIT 5 (Continued) Summary of Plan Provisions
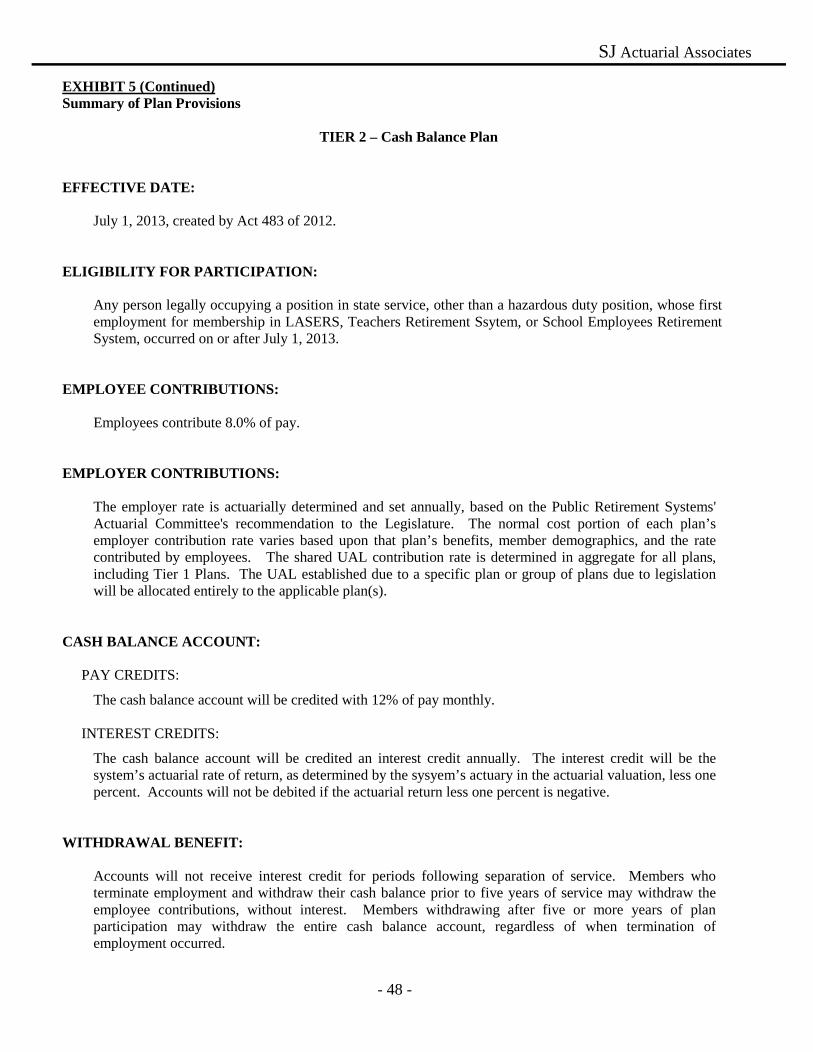
TIER 2 – Cash Balance Plan
EFFECTIVE DATE:
July 1, 2013, created by Act 483 of 2012. ELIGIBILITY FOR PARTICIPATION:
Any person legally occupying a position in state service, other than a hazardous duty position, whose first employment for membership in LASERS, Teachers Retirement Ssytem, or School Employees Retirement System, occurred on or after July 1, 2013.
EMPLOYEE CONTRIBUTIONS:
Employees contribute 8.0% of pay. EMPLOYER CONTRIBUTIONS:
The employer rate is actuarially determined and set annually, based on the Public Retirement Systems' Actuarial Committee's recommendation to the Legislature. The normal cost portion of each plan’s employer contribution rate varies based upon that plan’s benefits, member demographics, and the rate contributed by employees. The shared UAL contribution rate is determined in aggregate for all plans, including Tier 1 Plans. The UAL established due to a specific plan or group of plans due to legislation will be allocated entirely to the applicable plan(s).
CASH BALANCE ACCOUNT: PAY CREDITS:
The cash balance account will be credited with 12% of pay monthly.
INTEREST CREDITS:
The cash balance account will be credited an interest credit annually. The interest credit will be the system’s actuarial rate of return, as determined by the sysyem’s actuary in the actuarial valuation, less one percent. Accounts will not be debited if the actuarial return less one percent is negative.
WITHDRAWAL BENEFIT:
Accounts will not receive interest credit for periods following separation of service. Members who terminate employment and withdraw their cash balance prior to five years of service may withdraw the employee contributions, without interest. Members withdrawing after five or more years of plan participation may withdraw the entire cash balance account, regardless of when termination of employment occurred.
SJ Actuarial Associates
- 49 -
EXHIBIT 5 (Continued) Summary of Plan Provisions RETIREMENT BENEFIT:
Upon attaining age 60 with at least five years of service, members may choose to withdraw their cash balance account or annuitize the balance. If a member annuitizes the cash balance account and dies prior to receiving benefits exceeding total employee contribution, the difference shall be paid to the estate of the decedent.
DISABILITY RETIREMENT:
Disability benefits for members becoming disabled prior to withdrawing from the cash balance plan or annuitizing the benefit may choose to receive a lump sum of the balance in the member’s cash balance account. Members who meet the eligibility requirements of the applicable Tier 1 plan may choose to receive the applicable Tier 1 disability benefit.
SURVIVOR BENEFITS:
Survivor benefits for members who die prior to withdrawing from the cash balance plan or annuitizing the benefit: Members who meet the eligibility requirements of the applicable Tier 1 plan:
Spouse and no children: the spouse may choose to receive a lump sum payment of the cash balance or to receive the applicable Tier 1 survivor benefit.
Minor child or handicapped or mentally disabled child: all survivors otherwise qualifying under the Tier 1 plan shall receive the Tier 1 survivors' benefits but shall not receive the cash balance account balance.
Members who do not meet the eligibility requirements of the applicable Tier 1 plan:
The designated beneficiary or member’s estate has the option to receive the member’s account balance as a lump-sum payment.
Note: The applicable Tier 1 plan is the plan the member would have been enrolled in the absence of the cash balance plan. If a survivor is eligible to and elects to receive a Tier 1 survivors' benefit, the balance in the member’s cash balance account shall be retained by the retirement system.
OPTIONAL FORMS OF BENEFIT:
Members who annuitize their cash balance may elect options as described in the Tier 1 provisions. REEMPLOYMENT:
If a member becomes reemployed in a position covered by the cash balance plan after withdrawing from the cash balance plan or annuitizing the balance, the member’s accumulation in the cash balance plan will begin again. However, the reemployment will not affect the receipt of the lump sum or annuitized payments from the first cash balance account.
SJ Actuarial Associates
- 50 -
EXHIBIT 6
ACTUARIAL COST METHODS AND ASSUMPTIONS
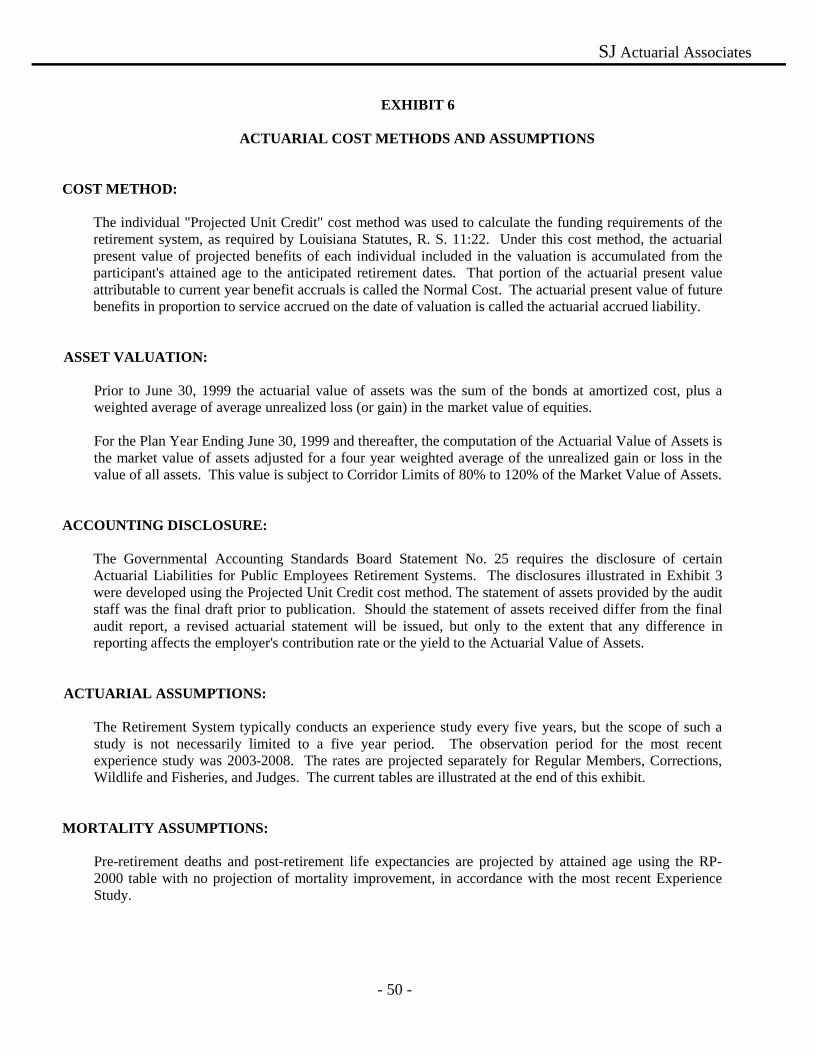
COST METHOD:
The individual "Projected Unit Credit" cost method was used to calculate the funding requirements of the retirement system, as required by Louisiana Statutes, R. S. 11:22. Under this cost method, the actuarial present value of projected benefits of each individual included in the valuation is accumulated from the participant's attained age to the anticipated retirement dates. That portion of the actuarial present value attributable to current year benefit accruals is called the Normal Cost. The actuarial present value of future benefits in proportion to service accrued on the date of valuation is called the actuarial accrued liability.
ASSET VALUATION:
Prior to June 30, 1999 the actuarial value of assets was the sum of the bonds at amortized cost, plus a weighted average of average unrealized loss (or gain) in the market value of equities. For the Plan Year Ending June 30, 1999 and thereafter, the computation of the Actuarial Value of Assets is the market value of assets adjusted for a four year weighted average of the unrealized gain or loss in the value of all assets. This value is subject to Corridor Limits of 80% to 120% of the Market Value of Assets.
ACCOUNTING DISCLOSURE:
The Governmental Accounting Standards Board Statement No. 25 requires the disclosure of certain Actuarial Liabilities for Public Employees Retirement Systems. The disclosures illustrated in Exhibit 3 were developed using the Projected Unit Credit cost method. The statement of assets provided by the audit staff was the final draft prior to publication. Should the statement of assets received differ from the final audit report, a revised actuarial statement will be issued, but only to the extent that any difference in reporting affects the employer's contribution rate or the yield to the Actuarial Value of Assets.
ACTUARIAL ASSUMPTIONS:
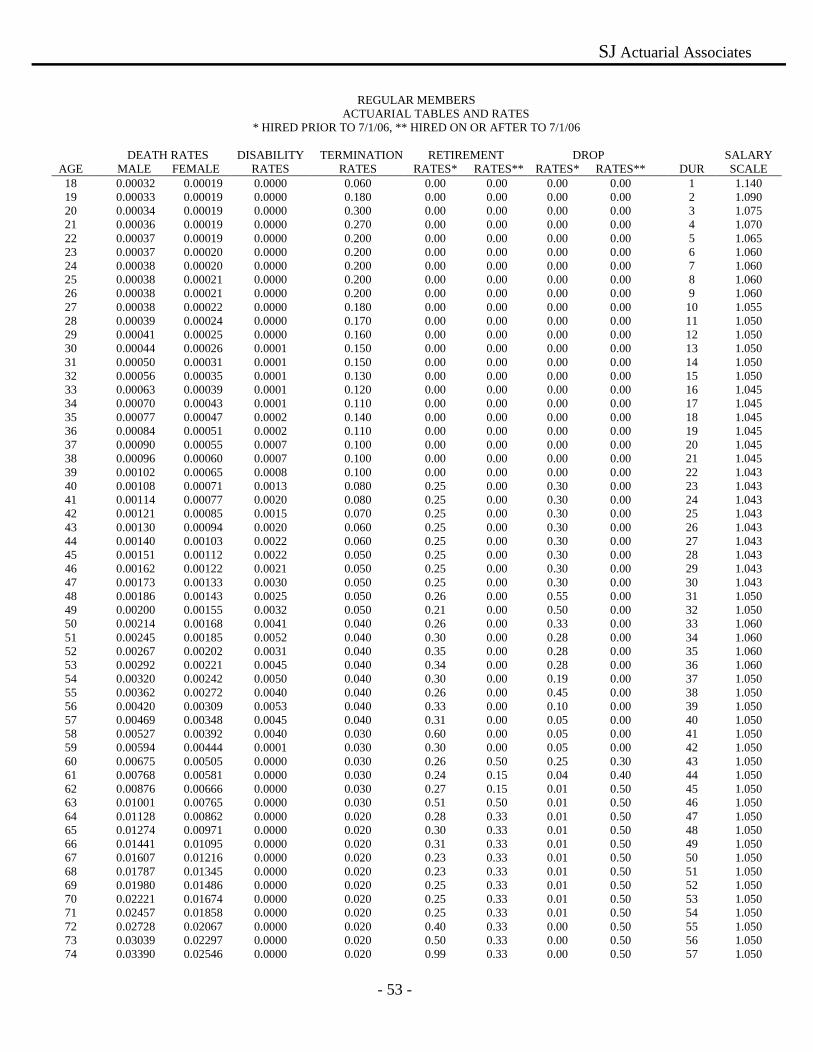
The Retirement System typically conducts an experience study every five years, but the scope of such a study is not necessarily limited to a five year period. The observation period for the most recent experience study was 2003-2008. The rates are projected separately for Regular Members, Corrections, Wildlife and Fisheries, and Judges. The current tables are illustrated at the end of this exhibit.
MORTALITY ASSUMPTIONS:
Pre-retirement deaths and post-retirement life expectancies are projected by attained age using the RP-2000 table with no projection of mortality improvement, in accordance with the most recent Experience Study.
Rates of total and permanent disability are projected in accordance with the most recent Experience Study. The rates are based upon attained age. For mortality after disability, rates are based upon the RP-2000 disability table with no projection of mortality improvement.
RETIREMENT/DROP ASSUMPTION:
Retirement rates are based on age and service eligibility requirements for normal benefits. Age and service requirements vary by plan. DROP is viewed as an alternative form of benefit accrual since mandatory termination is not required following participation. Therefore, at eligibility, the probability of DROP accrual is determined in conjunction with regular benefit accrual. Retirement rates and DROP probabilities are based on the most recent Experience Study.
TERMINATION ASSUMPTIONS:
Voluntary termination or withdrawal rates are based on the most recent Experience Study. During the first five years of employment, the probability of voluntarily terminating is a multiple of service duration as follows:
Regular Members
Corrections, Wildlife,
Hazardous Duty Judges1st year 1.3x 1.5x 1.0x
2nd year 1.0x 1.0x 1.0x3rd year 1.0x 1.0x 1.0x4th year 1.0x 1.0x 1.0x5th year 1.0x 1.0x 1.0x
Furthermore, for members terminating with ten (10) or more years of service, it is assumed that 75% will not withdraw their accumulated employee contributions.
SALARY GROWTH:
The rates of annual salary growth are based upon the member’s years of service.
SJ Actuarial Associates
- 52 -
EXHIBIT 6 (Continued) Cost Methods & Assumptions FAMILY STATISTICS:
The composition of the family is based upon Current Population Reports published by the United States Census Bureau. Seventy-five percent of the membership is assumed to be married. The wife is assumed to be three years younger than the husband. Sample rates for the assumed number of minor children are as follows:
Records identified as containing suspicious data or errors in data were assumed to possess the same characteristics of "good data" in the same cohort.
INVESTMENT EARNINGS:
An effective discount rate of 8.25% net of expenses is assumed prior to July 1, 2012. The Board of Trustees adopted a discount rate of 8.00% net of expenses to be used beginning with the 2012 actuarial valuation and for the projected employer rate for fiscal year 2012/2013.
ADMINISTRATIVE EXPENSES:
Expenses are included in aggregate normal cost and are assumed to be $16,500,000 per year. Investment manager fees are not included in normal cost but are treated as a direct offset to investment income. The employer portion of the normal cost excludes an allocation for administrative expenses.
COST-OF-LIVING:
The liability for previously granted cost-of-living benefit increases is included in the retiree reserve. OTHER ASSUMPTIONS SIGNIFICANT FOR CASH BALANCE PLAN:
The interest credit is assumed to be 8.0% annually. This includes the actual interest credit of 1% less than the actuarial rate of return, plus an additional 1% to for years where the actuarial return is less than zero, where the funds will not be debited. Members have a choice between the tier 1 and tier 2 plan provisions for disability and survivor benefits. Plan costs are based on an assumption that all members will chose the tier 1 plan provisions for disability and survivor benefits.
SJ Actuarial Associates
- 53 -
REGULAR MEMBERS
ACTUARIAL TABLES AND RATES * HIRED PRIOR TO 7/1/06, ** HIRED ON OR AFTER TO 7/1/06
DEATH RATES DISABILITY TERMINATION RETIREMENT DROP SALARY
2012 OAB Note 1 17 1,945,944,622 17 1,945,944,622 159,970,851 2012 EAAB Note 2 28 2,552,986,965 28 2,552,986,965 181,246,671 2012 2009 Change in Assumptions L 27 (215,375,826) 27 (215,375,826) (18,952,205) 2012 2009 Change in Liability L 27 1,343,195,300 27 1,343,195,300 118,195,775 2012 2010 Change in Liability L 28 619,512,022 28 619,512,022 53,942,764 2012 2011 Change in Liability L 29 86,250,401 29 86,250,401 7,437,844 2012 Change in Lia (Assumed Rate) L 30 357,645,630 30 357,645,630 30,569,488 2012 Chg in Lia (Experience/Program) L 30 272,743,878 30 272,743,878 23,312,575
2012 Act 414 - Chg in Lia L 25 3,450,803 25 3,450,803 311,064 2012 Act 262 - Chg in Lia L 6 1,382,505 6 1,382,505 287,768 2012 Act 740 - Chg in Lia L 6 390,798 6 390,798 81,344 2012 Act 992 - 2010 Chg in Lia - Note 3 L 8 4,321,326 8 4,321,326 723,588 2012 Act 992 - 2011 Chg in Lia - Note 4 L 9 421,344 9 421,344 64,902 2012 Act 992 - 2012 Chg in Lia - Note 5 L 10 533,971 10 533,971 76,573
Total Outstanding Balance 6,973,403,739$ 557,269,001$
Total Unfunded Actuarial Accrued Liability 7,131,481,688$ 590,886,224$
Exhibit A-1
AMORTIZATION OF UNFUNDED ACTUARIAL ACCRUED LIABILITYJune 30, 2012
Plan Specific UAL
See exhibit A-3 for notes and explanations.
SJ Actuarial Associates
- 58 -
Date DescriptionAmtz.
MethodAmtz. Period Initial Liability
Years Remain
Remaining Balance
Mid-Year Payment
2012 OAB Note 1 17 1,945,944,622 16 1,935,373,607 168,769,248 2012 EAAB Note 2 28 2,552,986,965 27 2,568,868,857 191,215,238 2012 2009 Change in Assumptions L 27 (215,375,826) 26 (212,910,183) (18,952,205) 2012 2009 Change in Liability L 27 1,343,195,300 26 1,327,818,271 118,195,775 2012 2010 Change in Liability L 28 619,512,022 27 613,014,019 53,942,764 2012 2011 Change in Liability L 29 86,250,401 28 85,420,798 7,437,844 2012 Change in Lia (Assumed Rate) L 30 357,645,630 29 354,488,537 30,569,488 2012 Chg in Lia (Experience/Program) L 30 272,743,878 29 270,336,250 23,312,575
2012 Act 414 - Chg in Lia L 25 3,450,803 24 3,403,600 311,064 2012 Act 262 - Chg in Lia L 6 1,382,505 5 1,194,048 287,768 2012 Act 740 - Chg in Lia L 6 390,798 5 337,526 81,344 2012 Act 992 - 2010 Chg in Lia - Note 3 L 8 4,321,326 7 3,915,058 723,588 2012 Act 992 - 2011 Chg in Lia - Note 4 L 9 421,344 8 387,603 64,902 2012 Act 992 - 2012 Chg in Lia - Note 5 L 10 533,971 9 497,111 76,573
Total Outstanding Balance 6,952,145,102$ 576,035,965$
Total Unfunded Actuarial Accrued Liability 7,118,020,753$ 633,900,293$
Plan Specific UAL
Exhibit A-2
AMORTIZATION OF UNFUNDED ACTUARIAL ACCRUED LIABILITYJune 30, 2013 - Projected
See exhibit A-3 for notes and explanations.
SJ Actuarial Associates
- 59 -
Exhibit A-3
Amortization Schedule Notes
All schedules were reamortized, effective July, 1, 2012, using a rate of 8.00%. Act 497 of 2009 consolidated all LASERS amortization schedules established on or before July 1, 2008, except those established due to benefit changes for a specific plan, into two schedules: the Original Amortization Base (OAB) and the Experience Account Amortization Base (EAAB). The OAB consists of the outstanding balance of the Initial Unfunded Accrued Liability (IUAL) and other schedules with negative outstanding balances, and was credited with the balance of funds from the IUAL fund. The EAAB consists of the 2004 schedule and all other remaining schedules. The outstanding balance of this schedule was credited with funds from the IUAL subaccount, which were originally transferred from the Employee Experience Account on June 30, 2009. The payment schedules are established by the Act and are shown in Exhibit_A. Act 497 revised the amortization of contribution variances resulting in a credit. The act specifies that any overpayment through fiscal year 2016/2017 will be credited to the OAB. The OAB will then be re-amortized according to the new payment schedule. Similarly, any overpayment resulting from the statutory minimum contribution of 15.5% exceeding the actuarially calculated contribution through 2016/2017 will be credited to the EAAB and the EAAB will be re-amortized. In addition, the Act changes the provisions for crediting the Employee Experience Account and for granting future permanent benefit increases. The first $50,000,000 of investment gain above the actuarially assumed investment rate will be used to reduce and re-amortize the OAB. The next $50,000,000 of excess investment return will be used to reduce and re-amortize the EAAB. Fifty percent of any excess return above $100,000,000 will be credited to the Employee Experience Account. Note 1: The Original Amortization Base includes the following bases that existed prior to Act 197 of 2009: 1993 (Initial Liability) 1993 (Change in Liability), 1994, 1995, 1997, 1998, 2005, 2006, and 2007 (excluding schedules established to amortize liability resulting from Acts 414, 262, and 740). The new combined balance was credited with funds from IUAL Account. Payment will increase by 6.5% for 1 year, 5.5% for 4 years, 5% for two years, and thereafter at 2% until paid off in 2029. Note 2: The Experience Account Amortization Base includes the following bases that existed prior to Act 197 of 2009: 1996, 1999 – 2003, 2004 (the liability resulting from Act 588 of 2004 which zeroed out the experience account), and 2008. The new combined balance was credited withfunds from the sub-account of the IUAL Fund, which were transferred from the Experience Account on June 30, 2009. Payments will increase by 6.5% for 1 year, 5.5% for 4 years, 5% for two years, and level thereafter until paid off in 2040.
Note 3: Act 992 2010 Increase in Accrued Liability - Change in retirement eligibility for Act 75 members (members hired on or after July 1, 2006 from 10 years of service at age 60 to 5 years of service at age 60 Note 4: Act 992 2011 Increase in Accrued Liability - Change in normal form of benefit for prior members joining the Hazardous Duty Plan prospectively between January 1, 2011 and June 30, 2011. Note 5: Act 992 2012 Increase in Accrued Liability - Change in normal form of benefits for prior members joining the Hazardous Duty Plan prospectively between July 1, 2011 and June 30, 2012.
Outstanding balance and payments changed from values shown in prior valuations due to actuarial valuation rate change from 8.25% to 8.00%, effective July 1, 2012.