Economic History Association Shelter from the Storm: Housing and the Industrial Revolution, 1550-1909 Author(s): Gregory Clark Source: The Journal of Economic History, Vol. 62, No. 2 (Jun., 2002), pp. 489-511 Published by: Cambridge University Press on behalf of the Economic History Association Stable URL: http://www.jstor.org/stable/2698188 . Accessed: 25/06/2014 02:18 Your use of the JSTOR archive indicates your acceptance of the Terms & Conditions of Use, available at . http://www.jstor.org/page/info/about/policies/terms.jsp . JSTOR is a not-for-profit service that helps scholars, researchers, and students discover, use, and build upon a wide range of content in a trusted digital archive. We use information technology and tools to increase productivity and facilitate new forms of scholarship. For more information about JSTOR, please contact [email protected]. . Cambridge University Press and Economic History Association are collaborating with JSTOR to digitize, preserve and extend access to The Journal of Economic History. http://www.jstor.org This content downloaded from 91.229.229.111 on Wed, 25 Jun 2014 02:18:54 AM All use subject to JSTOR Terms and Conditions
Transcript
Economic History Association
Shelter from the Storm: Housing and the Industrial Revolution, 1550-1909Author(s): Gregory ClarkSource: The Journal of Economic History, Vol. 62, No. 2 (Jun., 2002), pp. 489-511Published by: Cambridge University Press on behalf of the Economic History AssociationStable URL: http://www.jstor.org/stable/2698188 .
Accessed: 25/06/2014 02:18
Your use of the JSTOR archive indicates your acceptance of the Terms & Conditions of Use, available at .http://www.jstor.org/page/info/about/policies/terms.jsp
.JSTOR is a not-for-profit service that helps scholars, researchers, and students discover, use, and build upon a wide range ofcontent in a trusted digital archive. We use information technology and tools to increase productivity and facilitate new formsof scholarship. For more information about JSTOR, please contact [email protected].
.
Cambridge University Press and Economic History Association are collaborating with JSTOR to digitize,preserve and extend access to The Journal of Economic History.
http://www.jstor.org
This content downloaded from 91.229.229.111 on Wed, 25 Jun 2014 02:18:54 AMAll use subject to JSTOR Terms and Conditions
Shelter from the Storm: Housing and the Industrial Revolution, 1550-1909
GREGORY CLARK
Housing was a major item of English consumer expenditure. Yet little is known of its average quality or rental cost. I estimate average rents, constant-quality rents, and housing quality from 1550 to 1909. Constant-quality rents rose substantially relative to other costs of living during the Industrial Revolution. This probably explains why, despite rising real wages, housing quality appears to have declined from 1760 to 1860. There were, however, substantial quality gains in the eighteenth century prior to the Industrial Revolution. The implications of these new series for measurement of growth during the Industrial Revolution are briefly explored.
ousing has long been an important item in the British household budget, and yet we know all too little about its quality and cost through history.
There is good information on housing costs in England for the years after 1842, thanks to the Income Tax and Inhabited House Tax returns. Charles Feinstein has constructed from these a constant-quality index of housing rental values.' For the period before 1842, however, the existing narrative histories of housing, such as John Burnett's Social History of Housing, 1815-1985 and C. W. Chalklin's Provincial Towns of Georgian England, give no systematic information on rents or quality. The only tax information on housing before 1842 is for six years between 1803 and 1814. Thus Feinstein in his recent paper on living standards in the Industrial Revolution interpolates bravely to estimate housing rents between 1814 and 1842.2 For the years 1770-1803 he employs contemporary estimates of unknown reli- ability. There is no evidence on housing quality before 1845.
This article uses information from a sample of 16,241 dwellings pur- chased, rented, or sold by charities and other property holders in England and Wales over the years 1550-1909 to estimate three things: the rental cost of dwellings of constant quality, the rental cost of the average dwelling, and the average quality of housing. The fact that our series overlaps with the more complete post-1842 data serves as a check on how well charity re- cords proxy for national trends. Table 1 summarizes by decade the size and
The Journal of Economic History, Vol. 62, No. 2 (June 2002). C The Economic History Association. All rights reserved. ISSN 0022-0507.
Gregory Clark is Professor, Departnent of Economics, University of California, Davis, CA 95616- 8578. E-mail: gclark~ucdavis.edu.
I thank Charles Feinstein, Peter Lindert, and five anonymous referees for comments and suggestions, without implicating them in the conclusions of the article. Eric Jamelske gave excellent research assistance.
' Feinstein, "Annex A." Singer ("Index") earlier constructed a constant-quality rental series for a wider definition of houses and commercial properties.
2Feinstein, "Changes," pp. 23-24.
489
This content downloaded from 91.229.229.111 on Wed, 25 Jun 2014 02:18:54 AMAll use subject to JSTOR Terms and Conditions
Note: The number of dwellings is greater than the number of observations, since often a single lease or sale involved several dwellings. Sources: See the text.
composition of the sample. While the evidence is rather thin for most of the sixteenth, seventeenth, and eighteenth centuries, there is a large body of data for the years 1810-1839 and 1890-1909, and a moderate amount for other decades after 1780.
The principal sources for these data are a variety of investigations into the activities of charities conducted in the nineteenth century. More than half the
This content downloaded from 91.229.229.111 on Wed, 25 Jun 2014 02:18:54 AMAll use subject to JSTOR Terms and Conditions
observations (9,189) are from the 26,000 pages of reports by the Brougham Commission of 1818-1837, which contain extensive evidence on the rental values of housing owned by charities in the years before 1838; most of the remaining observations (4,531) are from subsequent reports and inquiries published by the permanent Charity Commission from 1856 on.3 In an at- tempt to improve the coverage of earlier years and of the north of England, these published reports have been supplemented by 2,241 further observa- tions from various archives of deeds and leases for these charities or for other property owners such as the London Livery Companies.4
Charities owned properties of all descriptions, from the meanest cottages to the grandest houses. Thus in the years 1817-1837 the rental value of charity dwellings varied from two shillings per year (a cottage in Peterstow, Hereford) to ?319 per year (a house in Cornhill, London). The charity re- ports generally give the parish or township a property was located in, and often some description of the structure (such as "cottage" or "house"), or the size of its lot. Where rental values were not stated explicitly, they have been inferred from leases or sale prices. Where the lease involved a fine paid by the tenant or a specified amount to be spent on repairs this has been annual- ized (using the rate of return on mortgages and bonds for that decade) and added to the rent.5 Unless the amount expended by a tenant at the beginning of a lease is given, or there is reason to believe no fine or house building was required, rents from leases of terms of more than 21 years were not used. Where a lease was for three lives the expected term was assumed to be 61 years, based on life expectancies in the eighteenth century.6 It makes little difference to the implied annual rent if this is changed to 40 or 50 years. House prices were converted into implied rentals by multiplying by the rate of return on land plus 1.9 percent to account from the higher rate of depreciation on housing.7 About 19 percent of rental values were estimated from prices.
Questions naturally arise about how representative these mainly charity properties were of all housing in the country, how diligently the property was managed, and how close prices and rents were to market value. I draw reassurance about representativeness from two facts. The first is that the sample houses, once we control for regional oversampling, had average rents in the years 1850-1909 that were very close to Feinstein's estimates
3 These reports are discussed in Clark, "Charity Commissioners." ' To make the collection of this amount of archival evidence feasible, where possible just the cata-
logue description of the property and its price or rental was used. The principal sources were the London Livery Companies (3 10 observations), Essex Record Office (491 observations), Surrey History Services (307 observations), Durham Record Office (596 observations), and Hull University Library (288 observations).
'The return on bonds and mortgages is from Clark, "Land Hunger." 6 This was calculated assuming that two of the lives were aged ten. 'The return on land is from Clark, "Land Hunger."
This content downloaded from 91.229.229.111 on Wed, 25 Jun 2014 02:18:54 AMAll use subject to JSTOR Terms and Conditions
of average house rents from the Income Tax.8 The second is that the level of rents across counties on charity properties in the years 1817-1837 echoes the national pattern across counties revealed in the tax assessments of 1842. Indeed, if we regress the average calculated charity house rental value in 1817-1837 (RENTCHAR) on the average calculated Income Tax rental value of houses in 1842 (RENTPROP), then the estimated relationship is
RENTCHAR = 1.596 + 0.921RENTPROP
(0.69) (0.055) R2=0.89,n=36
where the standard errors are shown in parentheses. In counties where aver- age house rental values were low, charities owned low-rent dwellings. Where rental values were high, they owned high-rent dwellings.
Nor is there any reason to believe that charities managed their properties differently from private owners. Elsewhere I have shown that charity land yielded a rate of return similar to that on private land.9 When charities in- vested in mortgages, they earned a rate of return comparable to returns on private mortgages.10
The distribution of the data across England and Wales before 1800, and from 1800 to 1839, is portrayed in Table 2. For comparison the share of houses listed in the 1841 census is also shown, as well as the rental value of "housing" in the 1842 Income Tax assessments." Charity properties were found less frequently in the North and in Wales than would be expected, but more frequently in London; moreover, within London the observations were more heavily concentrated in the City of London than other areas. Before 1800 the imbalance in the sample in favor of London was especially great. However, while London contained only about 9 percent of houses in 1842, it accounted for about 30 percent of the total rental value of England and Wales (including commercial properties). Thus the oversampling of London is actu- ally helpful in estimating national rent trends. To correct for this oversampling in forming a national estimate of house rentals, I have calculated indices separately for the City of London (within the walls), the rest of London, and the rest of the country, and then combined them as a weighted average.'2
Since England was urbanizing after 1770, it seems plausible that house rents were rising more rapidly in towns than in the countryside. Fortunately,
8 Feinstein, "Annex," p. 419. 'Clark, "Charity Commissioners" and "Farmland." 10 Clark, "Debt." " The Income Tax includes with housing other commercial buildings such as shops, pubs, hotels,
and offices. 12 In the regressions I also calculated separate time trends for Wales, the North, the Midlands, and
the South-West. The rent movements in these individual regions, however, were not statistically different from the general trend outside London.
This content downloaded from 91.229.229.111 on Wed, 25 Jun 2014 02:18:54 AMAll use subject to JSTOR Terms and Conditions
Worcester. Sources: Stamp, British Incomes, pp. 54-55; and Parliamentary Papers, Number of Inhabitants.
the sample of houses outside London has a representative mix of urban and rural properties. In 1841, 50 percent of houses outside London were in par- ishes with less than one person per acre. In the sample the corresponding share is 48 percent. But we will see below that after 1770 rural rents rose as rapidly as urban rents (excluding London).
A CONSTANT-QUALITY RENT INDEX
To estimate housing rental values while controlling for quality, I have used the subset (about one-sixth) of the observations where there are multi- ple observations on the same property at different times, and no indications of change in size or quality of the structure, or of change in lot size. Thus for example a house in Bray, Berkshire, was let first on a 2 1 -year lease in 1 8 14 for ?25 per year, without any requirement of repairs by the renter, and then at the end of this lease for a further seven years, again at ?25. Presumably the tenant spent little on permanent improvements over the course of the first lease, since he would lose much of any such investment at the end of the lease."3 The subsample of properties with no quality change appears representative of the larger charity sample. For properties outside London, for example, the average population density of the parishes with linked
13 If a tenant at the beginning of a 21-year lease makes ?100 in permanent improvements to a prop- erty, then at a 5 percent discount rate he will enjoy only ?65 of the value of these improvements by the time the lease terminates.
This content downloaded from 91.229.229.111 on Wed, 25 Jun 2014 02:18:54 AMAll use subject to JSTOR Terms and Conditions
observations was 3.5 persons per acre in 1801, and 5.5 in 1841. For the whole sample the corresponding densities were 3.2 in 1801, and 5.2 in 1841.
In practice, unless we have complete records of the owner's capital ex- penditures, it is very difficult to be sure that a property was not modified over time. The mistaken inclusion of some improved properties in the constant-quality index can bias the estimated trends in dwelling quality in only one way, however-against changes over time. Thus one test of whether I have really constructed a quality-controlled rent index will be whether the series shows any periods of change when compared to the aver- age rent index. We shall see below that quality movements are quite evident in some periods, such as 1840-1849 to 1900-1909.
To derive the constant-quality index I estimate the expression
40 40 40
ln(RENTJ) = a aojDREST1 + E aljDLONA + E a2jDCITY j=1 j=16 j=8
+ /3ODPRICEU + IADSHORTy + P2DYEAR. (1)
+ /3DLONG, + u1 +,
where RENT is the rent (in pounds sterling) per dwelling, j indexes the period, and i indexes the dwelling. DCITY,J is a set of 32 indicator (0,1) variables corresponding to each of the periods shown in Table 3, and are set equal to 1 when the observation is within the walls of the City of London.14 DLON, is an equivalent set of indicator variables for places within 10 miles ofthe center of London excluding the City; DREST,J are indicators for places not captured in the other two variables. Overall there were 1,750 properties observed more than once (1,033 outside London, 265 in the City of London, and 452 in the rest of London). DPRICE is an indicator variable for cases where the rental value is estimated from the price of a property. This vari- able allows for any error in the calculation of the relative earnings of build- ings and land. DSHORTis an indicator for cases where the lease was for less than a year. In such cases the landlord generally repaired and also often paid the local rates in later years, so we would expect higher rents to be paid by tenants in these cases. DYEAR is an indicator for cases of a lease for a year. Lastly, DLONG is an indicator for leases 21 years or longer with no fine paid. Often in these cases the long lease was granted in exchange for the tenant performing substantial repairs on the house. Here we would expect lower rents. The ui are fixed effects estimated for each of the properties observed. Effectively the regression includes an indicator variable for each
1 Forthe years before 1700 the few observations for London outside the City were also included in the "rest of England" category. I also tried a specification allowing for different rent trends in the north of England than in the south outside London, but there was no evidence of such a trend.
This content downloaded from 91.229.229.111 on Wed, 25 Jun 2014 02:18:54 AMAll use subject to JSTOR Terms and Conditions
Note: For the years before 1700 the "Outside London" index includes the observations from London outside City. The weights were 1.6 percent for the City of London, 32.7 percent for the rest of London, and 65.7 percent for the rest of England and Wales for the years after 1820. From 1700 to 1820 the weights were 3.4 percent, 28.4 percent and 68.2 percent respectively. These weights were based on the average values of charity properties in each area in 1817-37 and the numbers of houses in each area in the 1801 and 1841 censuses. Before 1700 the rest of England was weighted 90 percent and London 10 percent.
This content downloaded from 91.229.229.111 on Wed, 25 Jun 2014 02:18:54 AMAll use subject to JSTOR Terms and Conditions
FIGURE 1 CONSTANT-QUALITY INDEX OF NOMINAL RENTS, 1770-1909
(decadal averages)
Note: The broken lines indicate the 95-percent confidence interval for each estimate. Source: Table 3.
of the 1 ,750 properties. By including these the regression measures just the average change over time of rents on these properties. The logarithmic form for RENT was used for a number of reasons. First, it allows the lease vari- ables to have the same proportionate influence on all houses. Second, since the level of rent changes by as much as fivefold over time, this allows the ui to have the same proportionate influence on the rent of a house in 1700 as in 1900. I have checked that estimating the expression using RENT as op- posed to ln(RENT) does not make much difference.
Table 3 shows the results of the estimation. Before 1700 the numbers of observations per decade are small, and the estimates are correspondingly imprecise. Separate series have been estimated for London and for the City of London, because even within London the charity data oversamples the City. The estimated constant-quality rental value of all dwellings for each period is given in the column titled Geometric Mean. This index was con- structed as a geometric mean of rents in each of the three areas; this method makes it possible to calculate the confidence intervals for the index caused by sampling error. 15 Figure 1 shows the index and the 95-percent confidence
15 An arithmetic weighting of the London and rest of the country indices produced very similar estimates.
This content downloaded from 91.229.229.111 on Wed, 25 Jun 2014 02:18:54 AMAll use subject to JSTOR Terms and Conditions
100- IC~~~ ~~~~ N outsidde 00 ~~~~~~~~~~~~~~~~~London
*8 80
t; 60-
0) X 0 ~~~~~~~~~~Cityof London
40-
20
0 1760 1780 1800 1820 1840 1860 1880 1900
FIGURE 2 CONSTANT-QUALITY INDEX OF NOMINAL RENTS, BY LOCATION, 1760-1909
(decadal averages)
Source: Table 3.
interval for the years 1770 to 1909. Since the index is measured relative to 1860-1869 there is no confidence interval for this period. The 95-percent confi- dence intervals are all within 10 percent of the estimated level for each period after 1770-1779, where the data is relatively rich. Feinstein's rent series is also shown in Table 3 and in Figure 1 for comparison. The Feinstein series measures housing of constant quality from 1845 on, based on Income Tax records. In the decades after 1850 the two series correspond relatively well: the new series's deviation from Feinstein is never more than might be explained just by sam- pling error. But for the years before 1842, when Feinstein depends crucially on the tax returns of 1803-1814 to set the level of the series, they diverge sharply. Rents on the charity properties rise much more in the Revolutionary and Napo- leonic war period. At the maximum percentage deviation, in 1825-1829, the new index is 72 percent higher than Feinstein's.
Figure 2 shows constant-quality house rents for each of the three geo- graphic categories over the period 1770-1860. Figure 3 shows the constant- quality rental index back to 1550 and the associated confidence intervals. The clear impression of Figure 3 is that in the long period from 1620 to 1769 house rents were roughly constant in nominal terms, before beginning a sharp increase in the years 1780-1810. I have also estimated the linked regression above with a separate time trend for the years after 1770 for
This content downloaded from 91.229.229.111 on Wed, 25 Jun 2014 02:18:54 AMAll use subject to JSTOR Terms and Conditions
CONSTANT-QUALITY INDEX OF NOMINAL RENTS, 1550-1869
(decadal averages)
Note: The broken lines indicate the 95-percent confidence interval for each estimate. Source: Table 3; see the text
houses in rural parishes (defined as parishes with less than one person per acre in 1841). It might be expected that in a period of urbanization rents would rise less in rural areas, which were experiencing emigration, than in the urban areas into which migrants were moving. This term, however, turns out to be quantitatively and statistically insignificant: rents rose as fast in rural areas as in towns other than London.
Figure 4 shows the quality-controlled rent index compared to the day wage of building workers-both an important component of house construc- tion costs and a reasonable index of the overall wage level-in England from 1550-1559 to 1860-1869. Over this long time span the two series are generally aligned, but there are two sustained periods of deviation: in the first half of the seventeenth century house rents were high relative to wages, while in the eighteenth century they were relatively low.
AVERAGE HOUSE RENTS AND HOUSING QUALITY
A second rent index estimates just the average rental value of dwellings in England and Wales. This index is based on the movement of rents on all properties in a given parish (including properties that were combined, sub-
This content downloaded from 91.229.229.111 on Wed, 25 Jun 2014 02:18:54 AMAll use subject to JSTOR Terms and Conditions
CONSTANT-QUALITY INDEX OF HOUSE RENTS, COMPARED TO BUILDERS' WAGES, 1550-1869
(decadal averages)
Source: Table 3.
divided, rebuilt, or newly built) over time, controlling for differences in parish rent levels.16 The regression used to estimate the movement of rents on all properties was
where i indexes properties, j indexes 40 time periods, and s indexes par- ishes; thus RENT,S is the rent per dwelling for property i in period j and
16 Therecords show that owners, including charities, did frequently see to the reconstruction of their properties, by various means: letting land on building leases, requiring tenants to reconstruct existing dwellings, or undertaking repairs themselves. Dulwich College, for example, granted a 3 1-year lease of two messuages in Dulwich in 1829, "in consideration of the tenant substantially repairing and improving the old houses" (United Kingdom, Parliamentary Papers, "Reports," vol. 29, p. 913). Charities also acquired properties by gift and purchase, and sold or exchanged properties. Thus their portfolio of properties changed over time.
This content downloaded from 91.229.229.111 on Wed, 25 Jun 2014 02:18:54 AMAll use subject to JSTOR Terms and Conditions
Mean Value Coefficient Standard Variable of Variable Estimate Error t-statistic
Lease RentfromPrice 0.193 0.016 0.022 0.7
Property Public houses per dwelling 0.049 1.096*** 0.032 34.7 Shops per dwelling 0.059 0.575*** 0.030 19.4 Fraction "big" 0.006 1.252*** 0.085 14.7 Fraction "small" 0.021 -0.668*** 0.048 -13.9 Areagreaterthan l,OOOyds2 0.081 0.443*** 0.038 11.5 Area greater than 4,000 yds2 0.032 0.468*** 0.047 9.9 No area given 0.831 0.162*** 0.026 6.2
*** = Significant at the 1 percent level. Source: See the text.
location s. Even though the attempt here is to get a representative estimate of the average rent of all dwellings, I have included in the regression a number of controls. The first is a fixed effect for the rent level in each location, v,. The locations were taken to be towns or parishes. Thus the parishes in the City of London (DCITY) were treated as a single location. For the rest of London (DLON) observations were grouped into 78 parishes or locations. Outside London (DREST) the observations were generally grouped by parish, with two exceptions: in many towns-for instance Bedford, Exeter, and Cam- bridge-the parishes were combined into one location; and rural parishes with a population density of less than 1 0 persons per acre in 1 84 1, and where there were fewer than nine observations, were grouped into four density classes across the five regions of Table 2, each of which was treated as a single loca- tion. The locations contributing the most observations were the City of Lon- don (1,484), Exeter (260), Beverley (237), Barnard Castle (197), Abingdon (189), Coventry (158), Tiverton (124), Saffron Walden (123), and Salisbury (120). Thus the sample was reasonably representative of England as a whole.
The other control variables were for factors other than the quality of the dwelling that would influence its value. First a control was included for cases where the rental was inferred from the price of the property (DPRICE). Variables were also included for the number of public houses per dwelling on a property (NPUB), and for the number of attached shops per dwelling (NSHOP). Particularly in earlier years, many houses had more land attached than would be needed for a garden. Indicator variables were therefore included for houses with more than 1,000 square yards of land (DAREAJ), and more than 4,000 square yards of land (DAREA4).17 I also included an indicator for the case where the land area was not specified
7 Observations included up to 9,680 square yards per dwelling.
This content downloaded from 91.229.229.111 on Wed, 25 Jun 2014 02:18:54 AMAll use subject to JSTOR Terms and Conditions
Note: Occupants per house in the years before 1800 are assumed to be the average number in the years 1801 and 1811 as reported by the census. Source: See the text.
(DNAREA). Finally, controls were added for cases where the relative de- scription "large" or "small" was used to describe dwellings (FBIG and FSMALL). Table 4 shows the estimated magnitudes of these control vari- ables and their standard errors. They all had the expected signs, and most were both quantitatively and statistically significant.
This content downloaded from 91.229.229.111 on Wed, 25 Jun 2014 02:18:54 AMAll use subject to JSTOR Terms and Conditions
FIGURE 5 AVERAGE HOUSING RENTS IN ENGLAND AND WALES, 1550-1869
(decadal averages)
Sources: Tables 3 and 5.
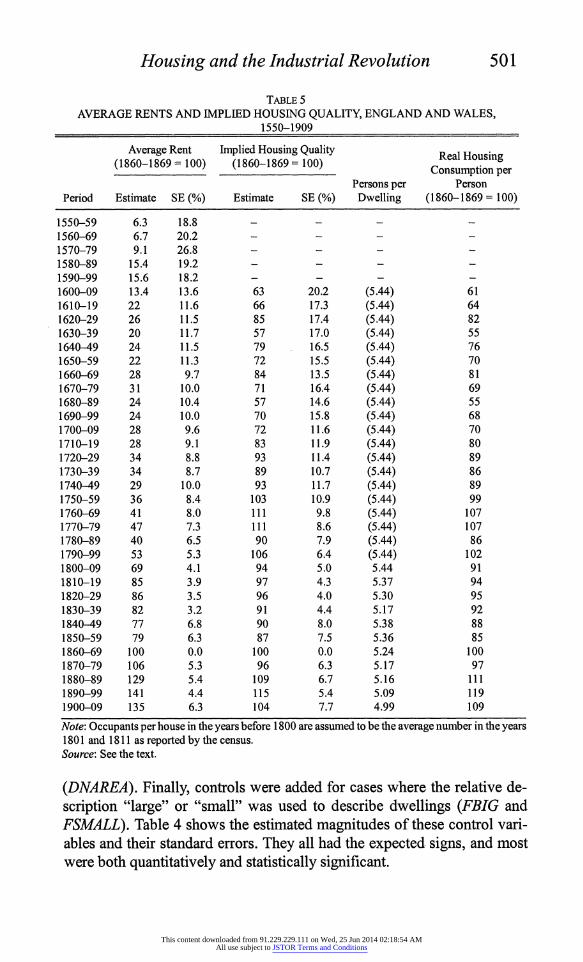
Table 5 shows estimated average dwelling rents constructed from this regression, as well as the approximate standard error in percentage terms. Despite the larger numbers of observations than in the quality-controlled estimate, the standard errors are larger here, and before the 1660s the 95- percent confidence limits are more than 20 percent above and below the estimated values. Figure 5 shows the rent index on all dwellings compared with the quality-controlled rent index.
Table 5 also shows the implied index of housing quality-that is, the ratio of the uncontrolled to the quality-controlled series-and its associated ap- proximate percentage standard error. Since quality is measured as the ratio of two series both measured with error, it will be an even noisier measure. This standard error is calculated by assuming that the standard errors of the uncontrolled and quality-controlled series are independent. Since these series share some observations it is more likely that the errors are correlated, in which case the standard errors reported here will be an upper bound. Figure 6 shows the implied average dwelling quality, as well as its 95- percent confidence interval and a 50-year moving average. The latter indi- cates a rise in housing quality in the seventeenth and early eighteenth centu- ries, followed by a decline from the 1770s to the 1 830s, and then a second rise in the late nineteenth century.
This content downloaded from 91.229.229.111 on Wed, 25 Jun 2014 02:18:54 AMAll use subject to JSTOR Terms and Conditions
We must be careful here about what we mean by the "quality" of the housing stock. My constant-quality rent index controls for such improve- ments as increases in the size of structures or gardens, better windows, better
plumbing, and better sanitary facilities. But aspects of housing qualit that are external to the property in question will not be controlled for. This in- cludes air pollution, water purity, traffic congestion, and such public ameni- ties as parks. What we can say is that with regard to dimensions of housing quality that are under the control of the owner-the square footage, the ceiling heights, the area of windows, the number of toilets, the garden size, and so on-there is no sign of sustained improvement between the 1770s
andthe 1860s. The modest scale of improvement in dwelling quality in the late nine-
teenth century may seem somewhat surprising. But a check on the quality series comes again from the Income Tax data after 1 845 , which allow for the
construction of comparable measures of housing quality. Figure 7 sets
Feinstein' s implied estimates of housing quality alongside the new series, with 1850-1859 benchmarked to the same level as the charity properties. Feinstein too -ids a modest improvement in house quality over these 50
years, with a total gain of about 27 percent (compared to 19 percent on the
This content downloaded from 91.229.229.111 on Wed, 25 Jun 2014 02:18:54 AMAll use subject to JSTOR Terms and Conditions
COMPARISON OF QUALITY ESTIMATES, 1850-1909 (decadal averages)
Note: Average dwelling quality from Feinstein has been adjusted to be the same as the charity index for 1850-59. The average rental value of housing in England and Wales was derived from the Income Tax returns by deducting the shares of rents from industrial and commercial properties as calculated by Feinstein, "Annex," p. 419. Source: Table 5; and Feinstein, "Annex."
charity properties). Given the sampling errors in my estimates, these results are entirely consistent.
Table 5 also shows what the implied amount of real housing consumption per person was in England and Wales from 1600 to 1909. This calculation requires an estimate of the numbers of persons per dwelling. The population census supplies this from 1801 on; for the period before 1800 I assume that the number of persons per dwelling was the average number reported by the census for 1801 and 1811. There is no sign of any increase in housing con- sumption per capita in the years 1760-1860, despite the Industrial Revolution.
IMPLICATIONS FOR GROWTH ACCOUNTING
We may use the estimates of house rental income derived here, together with estimates of farmland rents presented elsewhere, to estimate total
This content downloaded from 91.229.229.111 on Wed, 25 Jun 2014 02:18:54 AMAll use subject to JSTOR Terms and Conditions
Population Land and Houses, Mines, Canals, Rental Income Wage Income Period (millions) Farmhouses Shops, etc. Railways, etc. per Capita (f)a per Capita (?)
1600-09 4.4 12.0 1.6 (0.0) 3.1 4.0 1610-19 4.7 12.9 2.9 (0.0) 3.3 4.3 1620-29 5.0 12.7 3.6 (0.0) 3.3 4.6 1630-39 5.2 13.5 2.8 (0.0) 3.1 4.9 1640-49 5.4 14.5 3.5 (0.0) 3.3 5.6 1650-59 5.6 14.8 3.4 (0.0) 3.3 6.3 1660-69 5.6 16.6 4.3 (0.0) 3.8 6.3 1670-79 5.5 15.3 4.7 (0.0) 3.7 6.6 1680-89 5.4 15.9 3.6 (0.0) 3.7 6.8 1690-99 5.4 15.2 3.5 (0.0) 3.5 6.9 1700-09 5.5 15.1 4.2 0.2 3.6 6.9 1710-19 5.7 16.3 4.4 0.2 3.8 7.1 1720-29 5.8 17.5 5.5 0.2 4.1 7.3 1730-39 5.7 17.1 5.3 0.2 4.1 7.5 1740-49 6.1 15.8 4.9 0.3 3.6 7.6 1750-59 6.3 19.9 6.2 0.4 4.4 7.6 1760-69 6.7 19.9 7.4 0.6 4.4 8.1 1770-79 7.0 23.2 9.1 0.8 5.0 8.6 1780-89 7.6 23.0 8.4 1.1 4.6 9.0 1790-99 8.3 28.2 12.0 1.5 5.5 10.6 1800-09 9.2 39.0 17.5 2.3 7.0 14.0 1810-19 10.4 49.8 24.8 3.2 8.2 17.3 1820-29 12.1 43.5 29.4 3.2 6.9 16.0 1830-39 14.0 41.3 33.0 4.0 6.1 16.2 1840-49 16.7 42.3 37.0 7.1 5.6 16.5 1850-59 18.8 41.9 43.4 11.4 5.5 17.4 1860-69 21.1 46.3 60.2 19.3 6.4 19.6 a Includes local rates. Notes: All rental incomes from 1842 on are from the Income Tax returns. Land and house rents are from the Charity Commission reports. "Houses" here include public houses, shops, and other commercial property. The rents of commercial properties are assumed to be the same relative to houses for the years before 1842. Rental incomes from coal mining, canals and turnpikes was approximated for the years before 1842 from the sources listed. Sources: Population from Wrigley et al., English Population, adjusted to England and Wales. Rents on land and farmhouses before 1842 from Clark, "Farmland Rental Values." Rental incomes after 1842 from Stamp, British Incomes, pp. 49-51, 220-21. Mining rents are estimated from Flinn, History, pp. 26,292-93,303-04,324-25; and Church, History, pp. 3,53-54, 58-59,530-01. Canal rents are estimated from Ginarlis and Pollard, "Roads and Waterways," assuming the same rate of return throughout as for the 1840s. Turnpike bond payments are from Albert, Turnpike Road System, pp. 68, 194; and Pawson, Transport, pp. 155-56, 214, 224-26. Wage incomes per capita in the 1860s were derived from Levi, Wages and Earnings. The series was carried back based on an average of farm and building day wages.
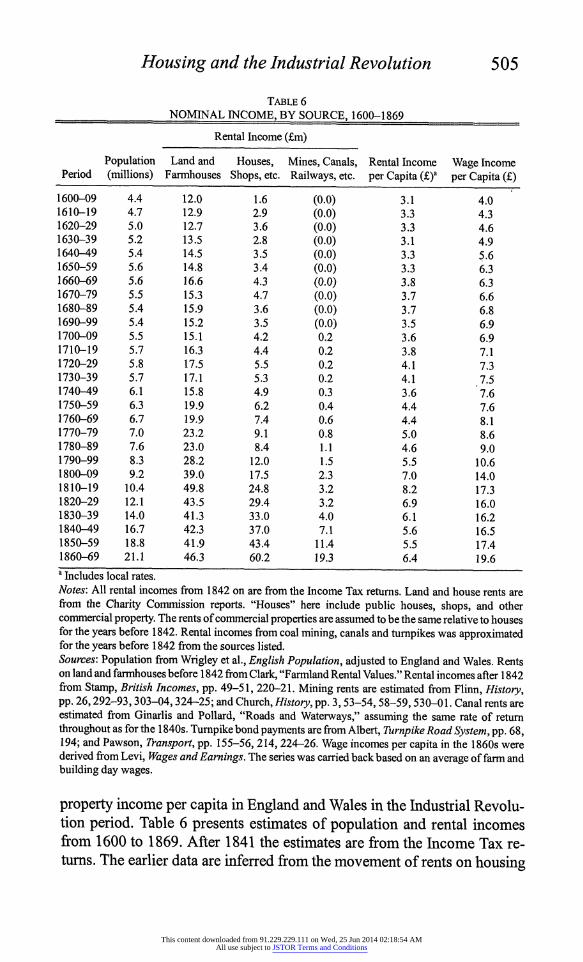
property income per capita in England and Wales in the Industrial Revolu- tion period. Table 6 presents estimates of population and rental incomes from 1600 to 1869. After 1841 the estimates are from the Income Tax re- tuns. The earlier data are inferred from the movement of rents on housing
This content downloaded from 91.229.229.111 on Wed, 25 Jun 2014 02:18:54 AMAll use subject to JSTOR Terms and Conditions
(as derived above) and on charity-owned farmland. These series are adjusted to be at the same level as the Income Tax data. The total rental income of "housing" is inferred as the rental income per dwelling from Table 5 above, multiplied by the estimated stock of nonfarm houses. 18 Land rental incomes circa 1700 were almost four times house rental incomes, but by 1860 they had fallen below parity."9 As land declined as a source of property income, other real assets became much more important, and show up in the accounts of charities. These included mineral rents, tumpike mortgages, and the bonds and shares of canals and railways. Tax data on these rents are avail- able for the years after 1842. For earlier years, I can approximate the rental earnings from the transport and mining sectors using various sources; these sources decline in quality the further back we go, but this matters little since these sources of rental income only became important in the nineteenth century. The fifth column of Table 6 estimates these other rental incomes.20 Even adding these rapidly growing income sources, in the nineteenth century property rental income per capita still rose much more slowly than wage income per capita. Figure 8 shows wage income per capita relative to prop- erty income from 1600 to 1869. In 1600s wage income was only modestly greater than property income, but by the 1840s wage income was three times as great.
The rent series derived above have implications for economic growth in Industrial Revolution England. Feinstein has recently argued that wage gains were about 47 percent from the 1770s to the 1860s-far less than the sub- stantial gains found by Peter Lindert and Jeffrey Williamson.21 I too have found, with completely different sources, that real farm wages increased by only 50 percent from the 1770s to the 1860s.22 The casual assumption for the Industrial Revolution period has been that real wage growth would set the lower bound for real GDP growth per person, since rents and profits were
8 In the early nineteenth century the population censuses suggested a relatively stable average number of occupants per house. From 1801 to 1851 the number varies in a narrow range (5.17-5.44). Since farmhouses were included in the rental value of land throughout I assumed, based on the number of farmers in the 1851 census, that they numbered 160,000.
l The total implied rental of land and houses circa 1700 (E19.1 m.) is nearly double the assessment of land and house rents under the land tax in 1698. But the land tax can be shown to have under- assessed charity farmland rents by 40-50 percent. For houses the degree of underassessment is un- known.
20 Table 6 omits other sources of rental income regarding which it is very difficult to derive informa- tion: farmer's capital and manufacturing and commercial capital, for example. Butbased on Feinstein's estimates of net domestic assets in 1860 the rentals reported in Table 6 represent the retums on 82 percent of private domestic assets in 1850, and 78 percent in 1760 (Feinstein, "Appendix," pp. 437, 439, 464-65). Thus the inclusion of the rents on these other assets would not change the conclusion that rental incomes per capita declined relative to wage income in the Industrial Revolution.
21 Lindert and Williamson, "English Workers' Living Standards" and "English Workers' Real Wages"; and Feinstein "Pessimism."
22 Clark, "Farm Wages."
This content downloaded from 91.229.229.111 on Wed, 25 Jun 2014 02:18:54 AMAll use subject to JSTOR Terms and Conditions
WAGE INCOME IN RATIO TO PROPERTY INCOME, 1600-1869 (decadal averages)
Source: Table 6.
assumed to be increasing more rapidly.23 Instead we see above that real wage increases-modest though they now appear-will overestimate gains in real
24 output per capita.
A second implication of the rent series derived above is that the Income Tax of 1803-1814, the precursor of the 1842 tax, was greatly underassessed.25 My series here shows that the tax assessments of houses were 32 percent below actual values in 1806-1809, and 41 percent below in 1810-1814. A rent series for agricultural land constructed from the charity records shows a similar underassessment of farmland: 36 percent in 1806-1809, and 38 per- cent in 1810-1814.26 This result is surprising, since the two tax regimes were based on the same principles, and the later one was fully assessed.
On examination it is easy to see why the 1803-1814 tax was likely in principle to underestimate property rental values, and there are examples in
23 See, for example, Feinstein, "Wage-Earners," p. 201. 24 The wage deflator will not be the same as the GDP deflator, but since the GDP deflator in the
Industrial Revolution era includes wages as an important component because of the importance of personal services, the GDP deflator would certainly have risen more than the wage deflator.
25 Previous discussions of the Income Tax of 1803-1814, though without stating reasons, assumed a full assessment. See, for example, Hope-Jones, Income Tax; and Deane and Cole, British Economic Growth, pp. 323-28.
26 For land rents see Clark, "Farmland."
This content downloaded from 91.229.229.111 on Wed, 25 Jun 2014 02:18:54 AMAll use subject to JSTOR Terms and Conditions
the charity records ofjust such underassessment. The Income Tax was intro- duced in 1803, and amended in 1805. The 1803 Bill called for property to be assessed on the rack rent if leased within the last three years, or failing such a lease, on the full rental value. The 1805 Bill allowed the annual rent on leases within seven years to be used, as long as the lease stipulated no money payments other than the annual rents. But both bills assumed that properties would not be specifically assessed for the tax. Instead the asses- sors were directed to use the most recent Poor Rate assessments of a parish as the tax assessment, if the Poor Rate assessments were at fair value. Most poor rate assessments, however, lagged well behind market value, since for the Poor Rate all that mattered was the relative value of properties. In such cases the assessors were to raise all the Poor Rate assessments to market value on the basis of some property leased at rack rent in the last three (or seven) years. To ensure compliance tenants were to pay the tax, and were allowed to deduct from the rents paid to landlords "a just Proportion" of the tax paid. Charities were allowed to recover the tax paid from the tax office. Even if these procedures had been followed to the letter, the average as- sessed rent in 1806-1814 would have lagged the actual rent because of the very great increase of rents in the years 1798-1814. If the average lag was 3.5 years between the lease and the assessment, then a 12-percent underval- uation would result, since between 1799 and 1814 the average rate of rent increase for new lettings on charity plots was 4 percent per year. The 1842 tax, in contrast, was imposed at a time when both house rents and land rents, as revealed by the charity properties, had been stable for 20 years or more.
A further provision in the 1805 amendment, that investments by tenants in improving properties were not to be counted towards the rental value, would further bias downwards the assessment for housing. Thus a charity house in London leased in 1808 for 61 years at ?16 a year would have been assessed at only ?16 a year, even though the lease required the tenant to lay out ?300 on repairs, which would have increased the annual rental value of the house to ?31 .5.27 In 1842 and later there was no such concession.
But it not clear that even these generous procedures were followed to the letter. In five cases the Charity Commission reports reveal both the lease value of the property, which ought to have been the assessment under the law, as well as the deductions the tenants made from their rent for Income Tax, which reveal what the tenant purported to be the assessment. On aver- age these tenants claimed deductions for Income Tax assessments that were only 81 percent of their rental payments to the landlords. In no case did the Income Tax assessment claimed equal the actual rent paid by the tenants. Since charities were entitled to claim a full refund of the Income Tax, we also learn in three of the cases the refund amount. In these cases the refunds
27 United Kingdom, Parliamentary Papers, "Reports," vol. 4, p. 129.
This content downloaded from 91.229.229.111 on Wed, 25 Jun 2014 02:18:54 AMAll use subject to JSTOR Terms and Conditions
Average 81 62 a The charity trustees in these cases were criticized by the Charity Commission for allowing the tenants larger deductions for Income Tax than they as landlords were liable to pay. Sources: See the text.
imply that the assessments averaged 38 percent below the leased rents. Thus there is ample evidence that the early experiment with Property and Income taxes did not lead to full assessment of incomes. Table 7 summarizes the results in these five cases.
The 1803-1814 tax returns have played a surprisingly important role in calculations of British income in the years before 1842, for Phyllis Deane and W. A. Cole used them to estimate property incomes and their compo- nents in the years 1801 and 1811. Consequently they estimated too much nominal income growth in the years 1801-1842. Nick Crafts subsequently revised Deane and Cole's growth rates for 1801 to 1831, but he still esti- mated agricultural income in 1801-when agriculture was one third of employment-from these tax reports. And Crafts adopted the 1831 Deane- Cole estimate as the benchmark to which he linked his 1700-1831 estimates. But Deane and Cole's estimates for 1831, because of the lack of tax data for the years 1815-1841, relied on interpolating between 1811 and 1841, and so still relied to some extent on the 1803-1814 tax reports. All these esti- mates clearly need revision.
CONCLUSIONS
This article has covered much ground. Using mainly charity-owned hous- ing I have derived indices of rents on constant-quality dwellings and on all dwellings, of average dwelling quality, and of housing consumption per person. The possible sampling errors in these indices were also shown. The new indices are consistent with the Income Tax evidence on housing for the years after 1842. There is no sign of gains in housing consumption to go along with the reported higher real incomes ofthe later Industrial Revolution period. But since housing costs were rising even relative to wages, this may well be explained by substitution away from expensive housing towards
This content downloaded from 91.229.229.111 on Wed, 25 Jun 2014 02:18:54 AMAll use subject to JSTOR Terms and Conditions
cheaper manufactured goods and foodstuffs. There is a somewhat unex- pected improvement in housing quality preceding the Industrial Revolution in the years 1650-1750. This may betoken more economic growth in this era than has been assumed.
Finally I have calculated the rental income derived from houses, shops, public houses, and other properties in England and Wales from 1600 to 1869, and compared this to estimated wage income. The lack of any increase in housing consumption in the Industrial Revolution era-a time when real wages rose by 50 percent or more-coupled with slowly rising agricultural rents, implies that property incomes as a whole declined substantially rela- tive to wages in Industrial Revolution England. Thus real income growth in England must have been slower than the growth of real wages, not faster as has been casually assumed. In this case output growth per capita in England in the Industrial Revolution must have been slower even than such "pessi- mists" as Crafts and Harley have estimated.
REFERENCES
Archival
Durham Record Office. Miscellaneous deeds. Essex Record Office. Miscellaneous deeds. Guildhall Library, London. Carpenters' Company, 4326/10-15,4329/6-8,4332, Grocers'
Company, 11608/1-3. Hull University Library. Miscellaneous deeds. Surrey Record Services. Miscellaneous deeds.
Printed
Albert, William. The Turnpike Road System in England, 1663-1840. Cambridge: Cam- bridge University Press, 1972.
Burnett, John. A Social History of Housing, 1815-1985. 2nd ed. London: Methuen, 1986. Chalklin, C. W. The Provincial Towns of Georgian England: A Study of the Building
Process, 1740-1820. Montreal: McGill-Queen's University Press, 1974. Church, Roy. The History of the British Coal Industry. Vol. 3. Oxford: Clarendon Press,
1986. Clark, Gregory. "The Charity Commissioners as a Source in English Economic History."
Research in Economic History 18 (1998): 1-52. . "Land Hunger: Land as a Commodity and as a Status Good in England,
1500-1910." Explorations in Economic History 35, no. 1 (1998): 59-82. . "Farm Wages and Living Standards in the Industrial Revolution: England,
1670-1860." Economic History Review 54, no. 3 (2001): 477-505. . "Debt, Deficits and Crowding Out: England, 1727-1840." European Review of
Economic History 5, no. 3 (2001): 403-36. . "Farmland Rental Values and Agrarian History: England and Wales, 1500-1912."
Forthcoming, European Review of Economic History. Deane, Phyllis, and W. A. Cole. British Economic Growth, 1688-1959. 2nd ed. Cam-
This content downloaded from 91.229.229.111 on Wed, 25 Jun 2014 02:18:54 AMAll use subject to JSTOR Terms and Conditions
bridge: Cambridge University Press, 1967. Feinstein, Charles. "Annex A: Indices of Rent" and "Annex B: Gross Annual Value of
Dwellings." In Studies in Capital Formation in the United Kingdom, 1750-1920, edited by Charles Feinstein and Sidney Pollard, 405-19. Oxford: Clarendon Press, 1988.
. "Appendix." In Studies in Capital Formation in the United Kingdom, 1 750-1920, edited by Charles Feinstein and Sidney Pollard, 427-71. Oxford: Clarendon Press, 1988.
. "Changes in Nominal Wages, the Cost of Living and Real Wages in the United Kingdom over Two Centuries." In Labour's Reward: Real Wages and Economic Change in 19th- and 20th-Century Europe, edited by P. Scholliers and V. Zamagni, 3-36. Aldershot: Edward Elgar, 1995.
. "Wage Earners in Great Britain during the Industrial Revolution." In Applied Economics and Public Policy, edited by lain Begg and S. G. B. Henry, 181-208. Cambridge: Cambridge University Press, 1998.
. "Pessimism Perpetuated: Real Wages and the Standard of Living in Britain During and After the Industrial Revolution." This JOURNAL 58, no. 3 (1998): 625-58.
Flinn, Michael W. The History of the British Coal Industry. Vol. 2. Oxford: Clarendon Press, 1984.
Ginarlis, John, and Sidney Pollard. "Roads and Waterways, 1750-1850." In Studies in Capital Formation in the United Kingdom, 1750-1920, edited by Charles Feinstein and Sidney Pollard, 182-224. Oxford: Clarendon Press, 1988.
Hope-Jones, Arthur. Income Tax in the Napoleonic Wars. Cambridge: Cambridge Univer- sity Press, 1939.
Levi, Leone. Wages and Earnings of the Working Classes. London: John Murray, 1885. Lindert, Peter, and J. G. Williamson. "English Workers' Living Standards during the
Industrial Revolution: A New Look." Economic History Review 36, no. 1 (1983): 1-25.
. "English Workers' Real Wages: A Reply to Crafts." This JOURNAL 45, no. 1 (1985): 145-53.
Pawson, Eric. Transport and the Economy: The Turnpike Roads of Eighteenth Century England. London: Academic Press, 1977.
Singer, H. W. "An Index of Urban Land Rents and House Rents in England and Wales, 1845-1913." Econometrica 9, nos. 3/4 (1941): 221-30.
Stamp, Josiah. British Incomes and Property. London: King and Son, 1920. United Kingdom. Parliamentary Papers. Reports of the Charity Commissioners, Vol. 4.
Vol. V, 1820. United Kingdom. Parliamentary Papers. Reports of the Charity Commissioners, Vol. 29.
Vol. XXI, 1835. United Kingdom. Parliamentary Papers. Number of Inhabitants, 1801-51. Volume 1 with
Census Report. Vol. LXXXV, 1852-53. Wrigley, E. A., R. S. Davies, J. E. Oeppen, and R. S. Schofield. English Population His-
tory From Family Reconstitution, 1580-1837. Cambridge: Cambridge University Press, 1997.
This content downloaded from 91.229.229.111 on Wed, 25 Jun 2014 02:18:54 AMAll use subject to JSTOR Terms and Conditions