120
Energy Consumption of Major Household Appliances Shipped in Canada Trends for 1990–2006 December 2008

Energy Consumption ofMajor Household AppliancesShipped in Canada
Trends for 1990–2006December 2008

The digital mosaic of Canada that appears on the cover of this publication is produced by Natural Resources Canada (Canada Centre for Remote Sensing) and is a composite of individual satellite
images. The differences in the density of vegetation are illustrated through shading.
Natural Resources Canada’s Office of Energy EfficiencyLeading Canadians to Energy Efficiency at Home, at Work and on the Road
Energy Consumption of Major Household Appliances Shipped in CanadaCat. No. M141-16/2006ISBN 978-0-662-06325-4
Cat. No. M141-16/2006E-PDF (Online)ISBN 978-1-100-11226-8
© Her Majesty the Queen in Right of Canada, 2009
To obtain additional copies of this or other free publications on energy efficiency, please contact
Energy PublicationsOffice of Energy EfficiencyNatural Resources Canadac/o St. Joseph CommunicationsOrder Processing Unit1165 Kenaston StreetPO Box 9809, Station TOttawa ON K1G 6S1Tel.: 1-800-387-2000 (toll-free)Fax: 613-740-3114TTY: 613-996-4397 (teletype for the hearing-impaired)
You can also view or order most Office of Energy Efficiency publications on-line.Visit our Virtual Library at oee.nrcan.gc.ca/publications.The Office of Energy Efficiency’s Web site is at oee.nrcan.gc.ca.
Recycled paper

Trends for 1990–2006 / i
Foreword
1 Information about market share for freezers is not available.
2 The shipment-weighted average annual UEC of an appliance by category is calculated as total energy consumption of all theappliances sold in Canada in that category divided by total number of shipments in that category.
Since 1996, as part of the National Energy UseDatabase initiative, Natural Resources Canada’s(NRCan’s) Office of Energy Efficiency (OEE) hasbeen receiving from members of the CanadianAppliance Manufacturers Association (CAMA) their annual Canadian appliance shipment data, by model, for the six major household appliancecategories – refrigerators, freezers, dishwashers,electric ranges, clothes washers and electric clothes dryers.
According to CAMA, the manufacturers representmore than 90 percent of the Canadian market forfive of the appliance groups.1 To keep each appliancemanufacturer’s data confidential, appliancemanufacturers suggested that a third party receiveand prepare the database in a format in which noone (other than the third party) could determinethe shipment data for an individual model ormanufacturer. NRCan retained the services ofElectro-Federation Canada, chosen by CAMA, as the third party to receive the data.
Each model’s shipments, provided by CAMA, were matched to their associated unit energyconsumption (UEC) ratings found in the EnerGuideAppliance Directory database (oee.nrcan.gc.ca/publications/infosource/pub/appliances/2007). The shipment-weighted2 average annual UEC wasthen calculated for each appliance category.
This report details the results of the analysis of the estimated shipment-weighted average UEC, inkilowatt hours per year, of the six major householdappliance categories shipped in Canada between1990 and 2006. It also provides data on the annualdistribution of shipments by UEC range for the six types of appliances during the same period.
This is the seventh report of this type published bythe OEE. Since 2004, participating manufacturershave provided their shipment data broken down by region/province and by channel (retail versusbuilder), allowing regional analysis, thereby assistingin monitoring the success of regional programs.
To further improve the quality and representationof new appliance energy efficiency data in Canada,the OEE is exploring options to improve thecoverage of the Canadian market through ongoingdiscussions with CAMA and other appliancemanufacturers.
The OEE would like to thank the participatingmanufacturers and CAMA for their co-operation in this project.
The data gathered through this report will increaseyour knowledge of the various aspects of energyconsumption with respect to appliances. The datawill also enable NRCan to develop and fine-tune its ecoENERGY programs, designed to supportCanadians as they seek to achieve greater energyefficiency and reduce their greenhouse gas emissions.
This report was prepared by Diane Friendly of theDemand Policy and Analysis Division of the OEE.Glen Ewaschuk provided assistance and AndrewKormylo provided project leadership.
If you would like to learn more about the OEE’sservices and programs, contact it by e-mail [email protected].

ii / Energy Consumption of Major Household Appliances Shipped in Canada
For more information about this report, contact
Diane FriendlyDemand Policy and Analysis DivisionOffice of Energy Efficiency Natural Resources Canada580 Booth StreetOttawa ON K1A 0E4
E-mail: [email protected]
To obtain additional copies of this report or otherreports published by the Demand Policy andAnalysis Division of the OEE, visit our Web site atoee.nrcan.gc.ca/statistics/publications.
You may also contact
Energy PublicationsOffice of Energy EfficiencyNatural Resources Canadac/o St. Joseph CommunicationsOrder Processing Unit1165 Kenaston StreetPO Box 9809, Station TOttawa ON K1G 6S1Tel.: 1-800-387-2000 (toll-free)Fax: 613-740-3114TTY: 613-996-4397 (teletype for the hearing-impaired)In the National Capital Region, call 613-995-2943.
When ordering, quote the catalogue number andISBN associated with each title.
Foreword

Trends for 1990–2006 / iii
Highlights
3 Large, durable consumer goods usually finished in white, such as refrigerators, clothes washers and clothes dryers.
4 Source: Natural Resources Canada, Canada’s Energy Outlook: The Reference Case 2006, p. 20. Available: www.nrcan-rncan.gc.ca/com/resoress/publications/peo/peo-eng.php.
5 One petajoule (PJ) (1 PJ = 1 × 10¹⁵ joules) is equivalent to the amount of energy consumed by approximately 9500 householdsin 1 year – assuming each household uses 105.6 gigajoules (GJ) (1 GJ = 1 × 10⁹ joules) annually (according to the Energy UseData Handbook Tables (Canada), which can be found on the OEE Web site at oee.nrcan.gc.ca/corporate/statistics/neud/dpa/tableshandbook2/res_00_1_e_3.cfm.) A joule is the international unit of measure of energy – the energy produced by thepower of one watt flowing for one second. There are 3.6 million joules in one kilowatt hour (kWh).
Appliances have become an increasinglyfundamental part of modern lifestyles. The averageCanadian household contains most of the sixmajor appliances, which include a refrigerator,freezer, dishwasher, range, clothes washer andclothes dryer. The percentage of ownership of mostappliances in Canada has steadily increased duringthe past 20 years.
Future energy demand of appliances is driven by theefficiency of the equipment, market penetrations,population growth, and changes in individualbehaviour and usage patterns. Although thepenetration of most “white goods’’3 is alreadyrelatively high in Canada, population growth andthe shift to smaller, more numerous householdswill likely increase the appliance energy use overthe coming decade.4
The energy efficiency of major householdappliances on the market improved significantlybetween 1990 and 2006. Largely responsible for theimprovement were the significant research anddevelopment activities carried out by appliancemanufacturers and three initiatives authorizedunder the 1992 Energy Efficiency Act: the minimumenergy performance standards (and amendmentsthereto) contained in the Energy EfficiencyRegulations, the EnerGuide for Equipment programand the ENERGY STAR® Initiative in Canada. Alsoresponsible for the improvement were an increasein consumer awareness and various incentives andrebates offered by the federal, provincial andmunicipal governments and utilities. Details of
the latter can be found in the Directory of EnergyEfficiency and Alternative Energy Programs inCanada (oee.nrcan.gc.ca/programs-directory) or on the ENERGY STAR Web site (oee.nrcan.gc.ca/energystar/english/consumers/rebate.cfm).
Figure 1 depicts the cumulative energy savings dueto the above factors, measured in petajoules (PJ),5
of the six major household appliances from 1992to 2006.
Figure 1 Cumulative Energy Savings for All Major Household Appliances, 1992–2006
2006
2005
2004
2003
2002
2001
2000
1999
1998
1997
1996
1995
1994
1993
1992
Model Year
Refrigerators Freezers Dishwashers
ElectricRanges
ClothesWashers
ElectricClothes Dryers
0
10
20
30
40
Peta
joul
es

iv / Energy Consumption of Major Household Appliances Shipped in Canada
6 1 petajoule (PJ) equals 277 777 777.78 kWh.
7 The commercial unit of electricity energy equivalent to 1000 watt hours. A kilowatt hour is the amount of electricityconsumed by ten 100-watt bulbs burning for 1 hour.
8 Source: Energy Use Data Handbook table, which can be found on the OEE Web site atoee.nrcan.gc.ca/corporate/statistics/neud/dpa/tableshandbook2/res_00_18_e_3.cfm. Note that this is a national average.
9 Be sure to choose an environmentally friendly option when disposing of an appliance. Appliance recycling programs areavailable in many Canadian communities. Consult your Yellow Pages or call your municipality to find out what programsexist and how appliances are collected in your area. Or consult the Metals and Minerals Recycling Database atwww.recycle.nrcan.gc.ca to find Canadian companies involved in the recycling of appliances or “white goods.”
10 Natural Resources Canada, 2003 Survey of Household Energy Use (SHEU), Detailed Statistical Report (Ottawa: 2006), p. 59.Available: oee.nrcan.gc.ca/Publications/statistics/sheu03/pdf/sheu03.pdf.
The following are some interesting findings as aresult of the analysis of the shipment data:
• In 1990, a new set of the six major appliancesfor the home used an average of 5789 kilowatthours (kWh) of energy. In 2006, that numberdropped to an average of 3065 kWh – a47 percent reduction.
• Total energy savings for the six major appliancesshipped in 2006 were calculated at 5.61 PJ6
(or 1.56 billion kWh7). Consumers saved anestimated $147 million in energy costs in 2006,based on an approximate national average of 9.4 cents/kWh.8
• The cumulative energy savings for all majorhousehold appliances between 1992 and 2006were 35.67 PJ (or 9.91 billion kWh) – theequivalent of one year’s energy for approximately336 500 households.
• Among major appliances, refrigerators producedthe largest cumulative energy savings, 12.48 PJ(or 3.47 billion kWh) from 1992 to 2006.
• This is the third year for which data wereavailable to perform an analysis for retail versusbuilder shipments by region/province. From2004 to 2006, it was found that, for all majorhousehold appliances, shipments to builders inBritish Columbia and the Territories were higherand shipments to builders in Quebec were lowerthan shipments to other regions.
Energy-efficient products will have a significantimpact on consumers’ energy bills and energysavings only upon the disposal of older appliances,such as the “old” second refrigerator in thebasement.9 According to the 2003 Survey of HouseholdEnergy Use,10 approximately 765 000 Canadianhouseholds did not dispose of their previousrefrigerator when they acquired a new one in 2003.If consumers continue using the older models as a second appliance in the home, the maximumamount of energy savings and greenhouse gasemission reductions will not be realized.
Highlights

Trends for 1990–2006 / v
Contents
Foreword. . . . . . . . . . . . . . . . . . . . . . . . . . . . . . . . . . . . . . . . . . . . . . . . . . . . . . . . . . . . . . . . . . . . . . i
Highlights . . . . . . . . . . . . . . . . . . . . . . . . . . . . . . . . . . . . . . . . . . . . . . . . . . . . . . . . . . . . . . . . . . . . iii
List of Tables . . . . . . . . . . . . . . . . . . . . . . . . . . . . . . . . . . . . . . . . . . . . . . . . . . . . . . . . . . . . . . . . . . ix
List of Figures . . . . . . . . . . . . . . . . . . . . . . . . . . . . . . . . . . . . . . . . . . . . . . . . . . . . . . . . . . . . . . . . . xi
Introduction . . . . . . . . . . . . . . . . . . . . . . . . . . . . . . . . . . . . . . . . . . . . . . . . . . . . . . . . . . . . . . . . . . . 1
How Appliances Work . . . . . . . . . . . . . . . . . . . . . . . . . . . . . . . . . . . . . . . . . . . . . . . . . . . . . . . . . . . . . . . . 3
Energy Efficiency Regulations and Minimum Energy Performance Standards . . . . . . . . . . . . . . . . . . . . . . . 6
The ENERGY STAR® Initiative . . . . . . . . . . . . . . . . . . . . . . . . . . . . . . . . . . . . . . . . . . . . . . . . . . . . 7
The Role of the Members of the Canadian Appliance Manufacturers Association . . . . . . . . 10
Chapter 1 / Refrigerators . . . . . . . . . . . . . . . . . . . . . . . . . . . . . . . . . . . . . . . . . . . . . . . . . . . . . . . 11
1.1 2006 Market Snapshot. . . . . . . . . . . . . . . . . . . . . . . . . . . . . . . . . . . . . . . . . . . . . . . . . . . . . . . . . . . . 12
1.2 Distribution of Shipments . . . . . . . . . . . . . . . . . . . . . . . . . . . . . . . . . . . . . . . . . . . . . . . . . . . . . . . . 13
1.2.1 Distribution by Type . . . . . . . . . . . . . . . . . . . . . . . . . . . . . . . . . . . . . . . . . . . . . . . . . . . . . . . . 13
1.2.2 Distribution by Type, by Region/Province . . . . . . . . . . . . . . . . . . . . . . . . . . . . . . . . . . . . . . . 15
1.2.3 Distribution by Channel, by Region/Province . . . . . . . . . . . . . . . . . . . . . . . . . . . . . . . . . . . . 16
1.2.4 Distribution by Volume . . . . . . . . . . . . . . . . . . . . . . . . . . . . . . . . . . . . . . . . . . . . . . . . . . . . . 16
1.2.5 Distribution by Volume, by Region/Province. . . . . . . . . . . . . . . . . . . . . . . . . . . . . . . . . . . . . 18
1.2.6 Distribution by Average Annual Unit Energy Consumption per Cubic Foot . . . . . . . . . . . . 20
1.2.7 Distribution by Average Annual Unit Energy Consumption per Cubic Foot, by Region/Province. . . . . . . . . . . . . . . . . . . . . . . . . . . . . . . . . . . . . . . . . . . . . . . . . . . . . . . . . 22
1.3 Energy Consumption . . . . . . . . . . . . . . . . . . . . . . . . . . . . . . . . . . . . . . . . . . . . . . . . . . . . . . . . . . . . 23
1.3.1 Average Annual Unit Energy Consumption by Model Year . . . . . . . . . . . . . . . . . . . . . . . . . . 23
1.3.2 Average Annual Unit Energy Consumption by Volume. . . . . . . . . . . . . . . . . . . . . . . . . . . . . 24
1.3.3 Average Annual Unit Energy Consumption by Channel, by Region/Province . . . . . . . . . . . . . 25
1.4 Energy Savings. . . . . . . . . . . . . . . . . . . . . . . . . . . . . . . . . . . . . . . . . . . . . . . . . . . . . . . . . . . . . . . . . . 27
1.5 Refrigerators Summary . . . . . . . . . . . . . . . . . . . . . . . . . . . . . . . . . . . . . . . . . . . . . . . . . . . . . . . . . . . 28

vi / Energy Consumption of Major Household Appliances Shipped in Canada
Chapter 2 / Freezers . . . . . . . . . . . . . . . . . . . . . . . . . . . . . . . . . . . . . . . . . . . . . . . . . . . . . . . . . . . 29
2.1 2006 Market Snapshot. . . . . . . . . . . . . . . . . . . . . . . . . . . . . . . . . . . . . . . . . . . . . . . . . . . . . . . . . . . . 29
2.2 Distribution of Shipments. . . . . . . . . . . . . . . . . . . . . . . . . . . . . . . . . . . . . . . . . . . . . . . . . . . . . . . . . 30
2.2.1 Distribution by Type . . . . . . . . . . . . . . . . . . . . . . . . . . . . . . . . . . . . . . . . . . . . . . . . . . . . . . . 30
2.2.2 Distribution by Type, by Region/Province . . . . . . . . . . . . . . . . . . . . . . . . . . . . . . . . . . . . . . . 32
2.2.3 Distribution by Average Annual Unit Energy Consumption per Cubic Foot . . . . . . . . . . . . 33
2.2.4 Distribution by Average Annual Unit Energy Consumption per Cubic Foot, by Region/Province. . . . . . . . . . . . . . . . . . . . . . . . . . . . . . . . . . . . . . . . . . . . . . . . . . . . . . . . . 35
2.2.5 Distribution by Channel, by Region/Province . . . . . . . . . . . . . . . . . . . . . . . . . . . . . . . . . . . . 36
2.3 Energy Consumption . . . . . . . . . . . . . . . . . . . . . . . . . . . . . . . . . . . . . . . . . . . . . . . . . . . . . . . . . . . . 37
2.3.1 Average Annual Unit Energy Consumption by Model Year . . . . . . . . . . . . . . . . . . . . . . . . . . 37
2.4 Energy Savings. . . . . . . . . . . . . . . . . . . . . . . . . . . . . . . . . . . . . . . . . . . . . . . . . . . . . . . . . . . . . . . . . . 37
2.5 Freezers Summary . . . . . . . . . . . . . . . . . . . . . . . . . . . . . . . . . . . . . . . . . . . . . . . . . . . . . . . . . . . . . . . 38
Chapter 3 / Dishwashers. . . . . . . . . . . . . . . . . . . . . . . . . . . . . . . . . . . . . . . . . . . . . . . . . . . . . . . . 39
3.1 2006 Market Snapshot. . . . . . . . . . . . . . . . . . . . . . . . . . . . . . . . . . . . . . . . . . . . . . . . . . . . . . . . . . . . 39
3.2 Distribution of Shipments. . . . . . . . . . . . . . . . . . . . . . . . . . . . . . . . . . . . . . . . . . . . . . . . . . . . . . . . . 39
3.2.1 Distribution by Average Annual Unit Energy Consumption . . . . . . . . . . . . . . . . . . . . . . . . . 39
3.2.2 Distribution by Average Annual Unit Energy Consumption, by Region/Province . . . . . . . . 41
3.2.3 Distribution by Channel, by Region/Province . . . . . . . . . . . . . . . . . . . . . . . . . . . . . . . . . . . . 42
3.3 Energy Consumption . . . . . . . . . . . . . . . . . . . . . . . . . . . . . . . . . . . . . . . . . . . . . . . . . . . . . . . . . . . . 42
3.3.1 Average Annual Unit Energy Consumption by Model Year . . . . . . . . . . . . . . . . . . . . . . . . . . 42
3.3.2 Average Annual Unit Energy Consumption by Channel, by Region/Province . . . . . . . . . . . . . 43
3.4 Energy Savings. . . . . . . . . . . . . . . . . . . . . . . . . . . . . . . . . . . . . . . . . . . . . . . . . . . . . . . . . . . . . . . . . . 44
3.5 Dishwashers Summary . . . . . . . . . . . . . . . . . . . . . . . . . . . . . . . . . . . . . . . . . . . . . . . . . . . . . . . . . . . 45
Contents

Trends for 1990–2006 / vii
Chapter 4 / Electric Ranges. . . . . . . . . . . . . . . . . . . . . . . . . . . . . . . . . . . . . . . . . . . . . . . . . . . . . . 46
4.1 2006 Market Snapshot. . . . . . . . . . . . . . . . . . . . . . . . . . . . . . . . . . . . . . . . . . . . . . . . . . . . . . . . . . . . 46
4.2 Distribution of Shipments. . . . . . . . . . . . . . . . . . . . . . . . . . . . . . . . . . . . . . . . . . . . . . . . . . . . . . . . . 47
4.2.1 Distribution by Type . . . . . . . . . . . . . . . . . . . . . . . . . . . . . . . . . . . . . . . . . . . . . . . . . . . . . . . . 47
4.2.2 Distribution by Type, by Region/Province . . . . . . . . . . . . . . . . . . . . . . . . . . . . . . . . . . . . . . . 48
4.2.3 Distribution by Average Annual Unit Energy Consumption . . . . . . . . . . . . . . . . . . . . . . . . . 48
4.2.4 Distribution by Average Annual Unit Energy Consumption, by Region/Province . . . . . . . . 50
4.2.5 Distribution by Channel, by Region/Province . . . . . . . . . . . . . . . . . . . . . . . . . . . . . . . . . . . . 51
4.3 Energy Consumption . . . . . . . . . . . . . . . . . . . . . . . . . . . . . . . . . . . . . . . . . . . . . . . . . . . . . . . . . . . . 52
4.3.1 Average Annual Unit Energy Consumption by Model Year . . . . . . . . . . . . . . . . . . . . . . . . . . 52
4.3.2 Average Annual Unit Energy Consumption by Channel, by Region/Province . . . . . . . . . . . . . 53
4.4 Energy Savings. . . . . . . . . . . . . . . . . . . . . . . . . . . . . . . . . . . . . . . . . . . . . . . . . . . . . . . . . . . . . . . . . . 54
4.5 Electric Ranges Summary . . . . . . . . . . . . . . . . . . . . . . . . . . . . . . . . . . . . . . . . . . . . . . . . . . . . . . . . . 55
Chapter 5 / Clothes Washers . . . . . . . . . . . . . . . . . . . . . . . . . . . . . . . . . . . . . . . . . . . . . . . . . . . . 56
5.1 2006 Market Snapshot. . . . . . . . . . . . . . . . . . . . . . . . . . . . . . . . . . . . . . . . . . . . . . . . . . . . . . . . . . . . 56
5.2 Distribution of Shipments. . . . . . . . . . . . . . . . . . . . . . . . . . . . . . . . . . . . . . . . . . . . . . . . . . . . . . . . . 56
5.2.1 Distribution by Type . . . . . . . . . . . . . . . . . . . . . . . . . . . . . . . . . . . . . . . . . . . . . . . . . . . . . . . . 56
5.2.2 Distribution by Type, by Region/Province . . . . . . . . . . . . . . . . . . . . . . . . . . . . . . . . . . . . . . . 57
5.2.3 Distribution by Average Annual Unit Energy Consumption . . . . . . . . . . . . . . . . . . . . . . . . . 58
5.2.4 Distribution by Average Annual Unit Energy Consumption, by Region/Province . . . . . . . . 59
5.2.5 Distribution by Channel, by Region/Province . . . . . . . . . . . . . . . . . . . . . . . . . . . . . . . . . . . . 60
5.3 Energy Consumption . . . . . . . . . . . . . . . . . . . . . . . . . . . . . . . . . . . . . . . . . . . . . . . . . . . . . . . . . . . . 60
5.3.1 Average Annual Unit Energy Consumption by Model Year . . . . . . . . . . . . . . . . . . . . . . . . . . 60
5.3.2 Average Annual Unit Energy Consumption by Channel, by Region/Province . . . . . . . . . . . . . 61
5.4 Energy Savings. . . . . . . . . . . . . . . . . . . . . . . . . . . . . . . . . . . . . . . . . . . . . . . . . . . . . . . . . . . . . . . . . . 62
5.5 Clothes Washers Summary . . . . . . . . . . . . . . . . . . . . . . . . . . . . . . . . . . . . . . . . . . . . . . . . . . . . . . . . 63
Contents

viii / Energy Consumption of Major Household Appliances Shipped in Canada
Chapter 6 / Electric Clothes Dryers . . . . . . . . . . . . . . . . . . . . . . . . . . . . . . . . . . . . . . . . . . . . . . . 64
6.1 2006 Market Snapshot. . . . . . . . . . . . . . . . . . . . . . . . . . . . . . . . . . . . . . . . . . . . . . . . . . . . . . . . . . . . 64
6.2 Distribution of Shipments. . . . . . . . . . . . . . . . . . . . . . . . . . . . . . . . . . . . . . . . . . . . . . . . . . . . . . . . . 64
6.2.1 Distribution by Average Annual Unit Energy Consumption . . . . . . . . . . . . . . . . . . . . . . . . . 64
6.2.2 Distribution by Average Annual Unit Energy Consumption, by Region/Province . . . . . . . . 66
6.2.3 Distribution by Channel, by Region/Province . . . . . . . . . . . . . . . . . . . . . . . . . . . . . . . . . . . . 66
6.3 Energy Consumption . . . . . . . . . . . . . . . . . . . . . . . . . . . . . . . . . . . . . . . . . . . . . . . . . . . . . . . . . . . . 67
6.3.1 Average Annual Unit Energy Consumption by Model Year . . . . . . . . . . . . . . . . . . . . . . . . . . 67
6.3.2 Average Annual Unit Energy Consumption by Channel, by Region/Province . . . . . . . . . . . . . 68
6.4 Energy Savings. . . . . . . . . . . . . . . . . . . . . . . . . . . . . . . . . . . . . . . . . . . . . . . . . . . . . . . . . . . . . . . . . . 69
6.5 Electric Clothes Dryers Summary . . . . . . . . . . . . . . . . . . . . . . . . . . . . . . . . . . . . . . . . . . . . . . . . . . . 70
Chapter 7 / Summary of Major Household Appliances . . . . . . . . . . . . . . . . . . . . . . . . . . . . . . . 71
7.1 Total Energy Savings . . . . . . . . . . . . . . . . . . . . . . . . . . . . . . . . . . . . . . . . . . . . . . . . . . . . . . . . . . . . . 71
7.2 Average Annual Unit Energy Consumption of All Major Household Appliances . . . . . . . . . . . . . . 73
Appendix A / Methodology . . . . . . . . . . . . . . . . . . . . . . . . . . . . . . . . . . . . . . . . . . . . . . . . . . . . . 74
Appendix B / Definitions. . . . . . . . . . . . . . . . . . . . . . . . . . . . . . . . . . . . . . . . . . . . . . . . . . . . . . . . 79
Appendix C / Questions and Answers About Changes to ENERGY STAR® . . . . . . . . . . . . . . . 82
Appendix D / Detailed Tables . . . . . . . . . . . . . . . . . . . . . . . . . . . . . . . . . . . . . . . . . . . . . . . . . . . . 85
Contents

Trends for 1990–2006 / ix
Table 1.1 Refrigerator Market, 2006. . . . . . . . . . . . . . . . . . . . . . . . . . . . . . . . . . . . . . . . . . . . . . . . . . . . . . . 11
Table 1.2 Distribution of Refrigerators by Type . . . . . . . . . . . . . . . . . . . . . . . . . . . . . . . . . . . . . . . . . . . . . . 13
Table 1.3 Distribution of Refrigerators by Volume . . . . . . . . . . . . . . . . . . . . . . . . . . . . . . . . . . . . . . . . . . . 17
Table 1.4 Distribution of Refrigerators by Average Annual Unit Energy Consumption per Cubic Foot . . 20
Table 2.1 Distribution of Freezers by Type. . . . . . . . . . . . . . . . . . . . . . . . . . . . . . . . . . . . . . . . . . . . . . . . . . 30
Table 2.2 Distribution of Freezers by Average Annual Unit Energy Consumption per Cubic Foot . . . . . . 33
Table 3.1 Distribution of Dishwashers by Average Annual Unit Energy Consumption . . . . . . . . . . . . . . . 40
Table 4.1 Distribution of Electric Ranges by Type . . . . . . . . . . . . . . . . . . . . . . . . . . . . . . . . . . . . . . . . . . . . 47
Table 4.2 Distribution of Electric Ranges by Average Annual Unit Energy Consumption . . . . . . . . . . . . 49
Table 5.1 Distribution of Clothes Washers by Type. . . . . . . . . . . . . . . . . . . . . . . . . . . . . . . . . . . . . . . . . . . 56
Table 5.2 Distribution of Clothes Washers by Average Annual Unit Energy Consumption. . . . . . . . . . . . 58
Table 6.1 Distribution of Electric Clothes Dryers by Average Annual Unit Energy Consumption. . . . . . . 65
Table 7.1 Dates of the Minimum Energy Performance Standards and ENERGY STAR Initiative . . . . . . . . 71
Table 7.2 Average Annual Unit Energy Consumption of All Major Household Appliances, Selected Years . . . . . . . . . . . . . . . . . . . . . . . . . . . . . . . . . . . . . . . . . . . . . . . . . . . . . . . . . . . . . . . . 73
Table D.A.1 ENERGY STAR® Qualified Appliances as a Percentage of Total Shipments in Canada, 1999–2006 . . . . . . . . . . . . . . . . . . . . . . . . . . . . . . . . . . . . . . . . . . . . . . . . . . . . . . . . . . . . . . . . . . 85
Table D.A.2 ENERGY STAR Qualified Appliances as a Percentage of Total Shipments by Region/Province, 2004−2006 . . . . . . . . . . . . . . . . . . . . . . . . . . . . . . . . . . . . . . . . . . . . . . . . . . . . 85
Table D.1 Average Annual Unit Energy Consumption of Refrigerators by Model Year . . . . . . . . . . . . . . . . 86
Table D.2 Distribution of Refrigerators by Type, by Region/Province, 2004–2006 . . . . . . . . . . . . . . . . . . . 86
Table D.3 Distribution of Refrigerators by Channel, by Region/Province, 2004−2006 . . . . . . . . . . . . . . . . 87
Table D.4 Distribution of Refrigerators by Volume, by Region/Province, 2004−2006. . . . . . . . . . . . . . . . . 87
Table D.5 Distribution of Refrigerators for Retail Shipments by Volume, by Region/Province, 2004−2006 . . . . . . . . . . . . . . . . . . . . . . . . . . . . . . . . . . . . . . . . . . . . . . . . . . . . . . . . . . . . . . . . . . 88
Table D.6 Distribution of Refrigerators for Builder Shipments by Volume, by Region/Province, 2004−2006 . . . . . . . . . . . . . . . . . . . . . . . . . . . . . . . . . . . . . . . . . . . . . . . . . . . . . . . . . . . . . . . . . . 89
Table D.7 Distribution of Refrigerators by Average Annual Unit Energy Consumption per Cubic Foot, by Region/Province, 2004−2006 . . . . . . . . . . . . . . . . . . . . . . . . . . . . . . . . . . . . 90
Table D.8 Average Annual Unit Energy Consumption of Refrigerators by Volume . . . . . . . . . . . . . . . . . . 90
Table D.9 Average Annual Unit Energy Consumption per Cubic Foot of Refrigerators by Volume . . . . . . 91
Table D.10 Average Annual Unit Energy Consumption of Refrigerators by Channel, by Region/Province, 2004−2006 . . . . . . . . . . . . . . . . . . . . . . . . . . . . . . . . . . . . . . . . . . . . . . . . . 91
Table D.11 Distribution of Refrigerators Consuming Less Than 30 kWh/cu. ft. per Year, 2004–2006 . . . . . 92
Table D.12 Annual Energy Savings for Refrigerators, 1992–2006 . . . . . . . . . . . . . . . . . . . . . . . . . . . . . . . . . 92
Table D.13 Distribution of Freezers by Type, by Region/Province, 2004−2006 . . . . . . . . . . . . . . . . . . . . . . . 93
List of Tables

x / Energy Consumption of Major Household Appliances Shipped in Canada
Table D.14 Distribution of Freezers by Average Annual Unit Energy Consumption per Cubic Foot, by Region/Province, 2004−2006 . . . . . . . . . . . . . . . . . . . . . . . . . . . . . . . . . . . . . . . . . . . . . . . . . 93
Table D.15 Distribution of Freezers by Channel, by Region/Province, 2004−2006. . . . . . . . . . . . . . . . . . . . 94
Table D.16 Average Annual Unit Energy Consumption of Freezers by Model Year. . . . . . . . . . . . . . . . . . . . 94
Table D.17 Annual Energy Savings for Freezers, 1992–2006 . . . . . . . . . . . . . . . . . . . . . . . . . . . . . . . . . . . . . 95
Table D.18 Distribution of Dishwashers by Average Annual Unit Energy Consumption, by Region/Province, 2004−2006 . . . . . . . . . . . . . . . . . . . . . . . . . . . . . . . . . . . . . . . . . . . . . . . . . 95
Table D.19 Distribution of Dishwashers by Channel, by Region/Province, 2004−2006 . . . . . . . . . . . . . . . 96
Table D.20 Average Annual Unit Energy Consumption of Dishwashers by Model Year . . . . . . . . . . . . . . . . 96
Table D.21 Average Annual Unit Energy Consumption of Dishwashers by Channel, by Region/Province, 2004−2006 . . . . . . . . . . . . . . . . . . . . . . . . . . . . . . . . . . . . . . . . . . . . . . . . . 97
Table D.22 Annual Energy Savings for Dishwashers, 1992–2006 . . . . . . . . . . . . . . . . . . . . . . . . . . . . . . . . . 97
Table D.23 Distribution of Electric Ranges by Type, by Region/Province, 2004−2006 . . . . . . . . . . . . . . . . . 98
Table D.24 Distribution of Electric Ranges by Average Annual Unit Energy Consumption, by Region/Province, 2004−2006 . . . . . . . . . . . . . . . . . . . . . . . . . . . . . . . . . . . . . . . . . . . . . . . . . 98
Table D.25 Distribution of Electric Ranges by Channel, by Region/Province, 2004−2006 . . . . . . . . . . . . . 99
Table D.26 Average Annual Unit Energy Consumption of Electric Ranges by Model Year . . . . . . . . . . . . . . 99
Table D.27 Average Annual Unit Energy Consumption of Electric Ranges by Channel, by Region/Province, 2004−2006 . . . . . . . . . . . . . . . . . . . . . . . . . . . . . . . . . . . . . . . . . . . . . . . . 100
Table D.28 Annual Energy Savings for Electric Ranges, 1992–2006 . . . . . . . . . . . . . . . . . . . . . . . . . . . . . . 100
Table D.29 Distribution of Clothes Washers by Type, by Region/Province, 2004−2006 . . . . . . . . . . . . . . . 101
Table D.30 Distribution of Clothes Washers by Average Annual Unit Energy Consumption, by Region/Province, 2004−2006 . . . . . . . . . . . . . . . . . . . . . . . . . . . . . . . . . . . . . . . . . . . . . . . . 101
Table D.31 Distribution of Clothes Washers by Channel, by Region/Province, 2004−2006 . . . . . . . . . . . 102
Table D.32 Average Annual Unit Energy Consumption of Clothes Washers by Model Year. . . . . . . . . . . . 102
Table D.33 Average Annual Unit Energy Consumption of Clothes Washers by Channel,by Region/Province, 2004−2006 . . . . . . . . . . . . . . . . . . . . . . . . . . . . . . . . . . . . . . . . . . . . . . . . 103
Table D.34 Annual Energy Savings for Clothes Washers, 1992–2006 . . . . . . . . . . . . . . . . . . . . . . . . . . . . . 103
Table D.35 Distribution of Electric Clothes Dryers by Average Annual Unit Energy Consumption, by Region/Province, 2004−2006 . . . . . . . . . . . . . . . . . . . . . . . . . . . . . . . . . . . . . . . . . . . . . . . . 104
Table D.36 Distribution of Electric Clothes Dryers by Channel, by Region/Province, 2004−2006. . . . . . . 104
Table D.37 Average Annual Unit Energy Consumption of Electric Clothes Dryers by Model Year. . . . . . . 105
Table D.38 Average Annual Unit Energy Consumption of Electric Clothes Dryers by Channel, byRegion/Province, 2004−2006 . . . . . . . . . . . . . . . . . . . . . . . . . . . . . . . . . . . . . . . . . . . . . . . . . . . 105
Table D.39 Annual Energy Savings for Electric Clothes Dryers, 1992–2006 . . . . . . . . . . . . . . . . . . . . . . . . 106
Table D.40 Annual Energy Savings for All Major Household Appliances, 1992–2006 . . . . . . . . . . . . . . . . 106
List of Tables
Trends for 1990–2006 / xi
Figure 1 Cumulative Energy Savings for All Major Household Appliances, 1992–2006. . . . . . . . . . . . . . . iii
Figure 2 ENERGY STAR Qualified Appliances as a Percentage of Total Shipments in Canada, 1999−2006. . . . . . . . . . . . . . . . . . . . . . . . . . . . . . . . . . . . . . . . . . . . . . . . . . . . . . . . . . . . . . . . . . . . 8
Figure 3 ENERGY STAR Qualified Appliances as a Percentage of Total Shipments, by Region/Province, 2004−2006 . . . . . . . . . . . . . . . . . . . . . . . . . . . . . . . . . . . . . . . . . . . . . . . . . . . 9
Figure 1.1 Distribution of Standard-Size Refrigerators by Type, 1990 and 2006 . . . . . . . . . . . . . . . . . . . . . . 14
Figure 1.2 Average Annual Unit Energy Consumption of Refrigerators by Type, by Model Year . . . . . . . . . 14
Figure 1.3 Distribution of Refrigerators by Type, by Region/Province, 2004−2006. . . . . . . . . . . . . . . . . . . . 15
Figure 1.4 Distribution of Refrigerators by Channel, by Region/Province, 2004−2006 . . . . . . . . . . . . . . . . 16
Figure 1.5 Distribution of Refrigerators by Volume, 1990 and 2006 . . . . . . . . . . . . . . . . . . . . . . . . . . . . . . . 17
Figure 1.6 Distribution of Refrigerators by Volume, by Region/Province, 2004−2006 . . . . . . . . . . . . . . . . . 18
Figure 1.7 Distribution of Refrigerators by Volume, by Channel, 2004−2006 . . . . . . . . . . . . . . . . . . . . . . . 19
Figure 1.8 Distribution of Refrigerators by Average Annual Unit Energy Consumption per Cubic Foot, 1990 and 2006. . . . . . . . . . . . . . . . . . . . . . . . . . . . . . . . . . . . . . . . . . . . . . . . . . . 21
Figure 1.9 Distribution of Refrigerators by Average Annual Unit Energy Consumption per Cubic Foot, by Region/Province, 2004−2006 . . . . . . . . . . . . . . . . . . . . . . . . . . . . . . . . . . . . . 22
Figure 1.10 Average Annual Unit Energy Consumption of Refrigerators by Model Year . . . . . . . . . . . . . . . . 23
Figure 1.11 Average Annual Unit Energy Consumption of Refrigerators by Volume . . . . . . . . . . . . . . . . . . . 24
Figure 1.12 Average Annual Unit Energy Consumption per Cubic Foot of Refrigerators by Volume. . . . . . . 24
Figure 1.13 Average Annual Unit Energy Consumption of Refrigerators by Channel, by Region/Province, 2004−2006 . . . . . . . . . . . . . . . . . . . . . . . . . . . . . . . . . . . . . . . . . . . . . . . . . . 25
Figure 1.14 Distribution of Refrigerators Consuming Less Than 30 kWh/cu. ft. per Year, by Region/Province, 2004−2006 . . . . . . . . . . . . . . . . . . . . . . . . . . . . . . . . . . . . . . . . . . . . . . . . . . 26
Figure 1.15 Annual Energy Savings for Refrigerators, 1992–2006 . . . . . . . . . . . . . . . . . . . . . . . . . . . . . . . . . . 27
Figure 1.16 Cumulative Energy Savings for Refrigerators, 1992–2006 . . . . . . . . . . . . . . . . . . . . . . . . . . . . . . 27
Figure 2.1 Distribution of Freezers by Type, 1990 and 2006 . . . . . . . . . . . . . . . . . . . . . . . . . . . . . . . . . . . . . 31
Figure 2.2 Average Annual Unit Energy Consumption of Freezers by Type, by Model Year . . . . . . . . . . . . . 31
Figure 2.3 Distribution of Freezers by Type, by Region/Province, 2004−2006 . . . . . . . . . . . . . . . . . . . . . . . 32
Figure 2.4 Distribution of Freezers by Average Annual Unit Energy Consumption per Cubic Foot, 1990 and 2006. . . . . . . . . . . . . . . . . . . . . . . . . . . . . . . . . . . . . . . . . . . . . . . . . . . 34
Figure 2.5 Distribution of Freezers by Average Annual Unit Energy Consumption per Cubic Foot, by Region/Province, 2004−2006 . . . . . . . . . . . . . . . . . . . . . . . . . . . . . . . . . . . . . 35
Figure 2.6 Distribution of Freezers by Channel, by Region/Province, 2004−2006 . . . . . . . . . . . . . . . . . . . . 36
Figure 2.7 Average Annual Unit Energy Consumption of Freezers by Model Year . . . . . . . . . . . . . . . . . . . . 37
Figure 2.8 Annual Energy Savings for Freezers, 1992–2006. . . . . . . . . . . . . . . . . . . . . . . . . . . . . . . . . . . . . . 37
Figure 2.9 Cumulative Energy Savings for Freezers, 1992–2006 . . . . . . . . . . . . . . . . . . . . . . . . . . . . . . . . . . 38
Figure 3.1 Distribution of Dishwashers by Average Annual Unit Energy Consumption, 1990 and 2006 . . 40
List of Figures

xii / Energy Consumption of Major Household Appliances Shipped in Canada
Figure 3.2 Distribution of Dishwashers by Average Annual Unit Energy Consumption, by Region/Province, 2004−2006 . . . . . . . . . . . . . . . . . . . . . . . . . . . . . . . . . . . . . . . . . . . . . . . . . . 41
Figure 3.3 Distribution of Dishwashers by Channel, by Region/Province, 2004−2006 . . . . . . . . . . . . . . . . 42
Figure 3.4 Average Annual Unit Energy Consumption of Dishwashers by Model Year . . . . . . . . . . . . . . . . 43
Figure 3.5 Average Annual Unit Energy Consumption of Dishwashers by Channel, by Region/Province, 2004−2006 . . . . . . . . . . . . . . . . . . . . . . . . . . . . . . . . . . . . . . . . . . . . . . . . . . 43
Figure 3.6 Annual Energy Savings for Dishwashers, 1992–2006 . . . . . . . . . . . . . . . . . . . . . . . . . . . . . . . . . . 44
Figure 3.7 Cumulative Energy Savings for Dishwashers, 1992–2006 . . . . . . . . . . . . . . . . . . . . . . . . . . . . . . 44
Figure 4.1 Distribution of Electric Ranges by Type, 1990 and 2006 . . . . . . . . . . . . . . . . . . . . . . . . . . . . . . . 47
Figure 4.2 Distribution of Electric Ranges by Type, by Region/Province, 2004−2006. . . . . . . . . . . . . . . . . . 48
Figure 4.3 Distribution of Electric Ranges by Average Annual Unit Energy Consumption, 1990 and 2006 . . 49
Figure 4.4 Distribution of Electric Ranges by Average Annual Unit Energy Consumption, by Region/Province, 2004−2006 . . . . . . . . . . . . . . . . . . . . . . . . . . . . . . . . . . . . . . . . . . . . . . . . . . 50
Figure 4.5 Distribution of Electric Ranges by Channel, by Region/Province, 2004−2006 . . . . . . . . . . . . . . 51
Figure 4.6 Average Annual Unit Energy Consumption of Electric Ranges by Model Year . . . . . . . . . . . . . . 52
Figure 4.7 Average Annual Unit Energy Consumption of Electric Ranges by Channel, by Region/Province, 2004−2006 . . . . . . . . . . . . . . . . . . . . . . . . . . . . . . . . . . . . . . . . . . . . . . . . . . 53
Figure 4.8 Annual Energy Savings for Electric Ranges, 1992–2006 . . . . . . . . . . . . . . . . . . . . . . . . . . . . . . . . 54
Figure 4.9 Cumulative Energy Savings for Electric Ranges, 1992–2006 . . . . . . . . . . . . . . . . . . . . . . . . . . . . 54
Figure 5.1 Distribution of Clothes Washers by Type, by Region/Province, 2004−2006 . . . . . . . . . . . . . . . . 57
Figure 5.2 Distribution of Clothes Washers by Average Annual Unit Energy Consumption, 1990 and 2006. . . . . . . . . . . . . . . . . . . . . . . . . . . . . . . . . . . . . . . . . . . . . . . . . . . . . . . . . . . . . . . . 58
Figure 5.3 Distribution of Clothes Washers by Average Annual Unit Energy Consumption, by Region/Province, 2004−2006 . . . . . . . . . . . . . . . . . . . . . . . . . . . . . . . . . . . . . . . . . . . . . . . . . . 59
Figure 5.4 Distribution of Clothes Washers by Channel, by Region/Province, 2004−2006 . . . . . . . . . . . . . 60
Figure 5.5 Average Annual Unit Energy Consumption of Clothes Washers by Model Year . . . . . . . . . . . . . 61
Figure 5.6 Average Annual Unit Energy Consumption of Clothes Washers by Channel, by Region/Province, 2004−2006 . . . . . . . . . . . . . . . . . . . . . . . . . . . . . . . . . . . . . . . . . . . . . . . . . . 61
Figure 5.7 Annual Energy Savings for Clothes Washers, 1992–2006. . . . . . . . . . . . . . . . . . . . . . . . . . . . . . . 62
Figure 5.8 Cumulative Energy Savings for Clothes Washers, 1992–2006 . . . . . . . . . . . . . . . . . . . . . . . . . . . 62
Figure 6.1 Distribution of Electric Clothes Dryers by Average Annual Unit Energy Consumption, 1990 and 2006. . . . . . . . . . . . . . . . . . . . . . . . . . . . . . . . . . . . . . . . . . . . . . . . . . . . . . . . . . . . . . . . 65
Figure 6.2 Distribution of Electric Clothes Dryers by Average Annual Unit Energy Consumption, by Region/Province, 2004−2006 . . . . . . . . . . . . . . . . . . . . . . . . . . . . . . . . . . . . . . . . . . . . . . . . . . 66
Figure 6.3 Distribution of Electric Clothes Dryers by Channel, by Region/Province, 2004−2006 . . . . . . . . 67
Figure 6.4 Average Annual Unit Energy Consumption of Electric Clothes Dryers by Model Year . . . . . . . . 67
Figure 6.5 Average Annual Unit Energy Consumption of Electric Clothes Dryers by Channel, by Region/Province, 2004−2006 . . . . . . . . . . . . . . . . . . . . . . . . . . . . . . . . . . . . . . . . . . . . . . . . . . 68
Figure 6.6 Annual Energy Savings for Electric Clothes Dryers, 1992–2006. . . . . . . . . . . . . . . . . . . . . . . . . . 69
Figure 6.7 Cumulative Energy Savings for Electric Clothes Dryers, 1992–2006 . . . . . . . . . . . . . . . . . . . . . . 69
Figure 7.1 Annual Energy Savings for All Major Household Appliances, 1992–2006. . . . . . . . . . . . . . . . . . 72
Figure 7.2 Cumulative Energy Savings for All Major Household Appliances, 1992–2006 . . . . . . . . . . . . . . 72
Figure A.1 Retirement Function for Aging Appliances. . . . . . . . . . . . . . . . . . . . . . . . . . . . . . . . . . . . . . . . . . 78
Figure A.2 Cumulative Energy Savings for All Major Household Appliances With and Without Retirement Factor, 1992–2006 . . . . . . . . . . . . . . . . . . . . . . . . . . . . . . . . . . . . . . . . . . . . 78
List of Figures

Trends for 1990–2006 / 1
Introduction
This report outlines changes in the energy use anddistribution of major household appliances from1990 to 2006. It is based on the shipments for that period of the six major household appliancecategories in Canada: refrigerators, freezers,dishwashers, electric ranges, clothes washers andelectric clothes dryers. The data are collected throughthe co-operation of the Canadian ApplianceManufacturers Association (CAMA).
Note that the quantity and profile of applianceshipments closely reflect Canadian purchases. Most retailers rely on a distribution strategy calledjust-in-time inventory, which responds quickly toconsumer demand. In fact, retailers keep inventoryas low as possible. For this reason, the Office ofEnergy Efficiency (OEE) believes that the shipmentdata in this report closely reflect the purchasingbehaviour of consumers.
While this report deals exclusively with shipmentdata, the OEE also has reports that provideadditional information about appliances, such as the Survey of Household Energy Use (SHEU). This national survey collected data on energyconsumption and factors affecting energyconsumption, such as the age of householdappliances and their use. Some of the findings ofSHEU are related to the analysis and discussions in this report.
Each of the following chapters in this report coversa specific type of appliance:
• refrigerators (Chapter 1)
• freezers (Chapter 2)
• dishwashers (Chapter 3)
• electric ranges (Chapter 4)
• clothes washers (Chapter 5)
• electric clothes dryers (Chapter 6)
Chapter 1, “Refrigerators,” contains moreinformation than the other chapters.Although there is much diversity in the typesand sizes of refrigerators, they have beengrouped to calculate the average annual unitenergy consumption (UEC) for all refrigeratorsby model year. However, because both sizeand energy consumption are so important in such analysis, further investigation of theanalysis of refrigerators by UEC per cubic footin Sections 1.2.4 and 1.2.6 is recommended.
Because of restrictions in the marketinformation available, the freezer shipmentdata are not as comprehensive as data for the other appliances and should be used with caution.
Chapter 7, “Summary of Major HouseholdAppliances,” discusses the overall energy savingsachieved from improvements to these appliances.
Appendix A, “Methodology,” describes the databasepreparation process conducted by Electro-FederationCanada and the methodology used by the analyststo summarize the data.
Appendix B, “Definitions,” contains definitions of the types of appliances in this report.
Appendix C, “Questions and Answers AboutChanges to ENERGY STAR®,” provides informationabout changes to the ENERGY STAR Initiative in Canada.
Appendix D, “Detailed Tables,” provides detaileddata supporting the various charts and figures inthis report.

Note that the baseline year used for all estimates of energy savings was 1992 even though the MEPSdid not come into effect until 1995. This practice isfollowed because energy efficiency began to improvealmost immediately after the Energy Efficiency Actcame into force in 1992.
Because 1992 was the baseline year used in thisreport’s calculations, and to ensure that cumulativeenergy savings were not over-estimated, a retirementfactor was included in the past three years’ analysis.This factor takes into account the aging of appliancesbased on their life expectancies, as set out in theEnerGuide Appliance Directory.11 See Appendix A,“Methodology,” for more information about thisretirement factor.
As previously mentioned, the improvement in theenergy efficiency of the major household appliancescan be attributed to
• the significant research and development carriedout by the members of CAMA
• the MEPS contained in the Energy EfficiencyRegulations and amendments to the MEPS
• the initiatives authorized under the 1992 Energy Efficiency Act, namely, the EnerGuide forEquipment program
• the ENERGY STAR Initiative in Canada
2 / Energy Consumption of Major Household Appliances Shipped in Canada
11 Natural Resources Canada, EnerGuide Appliance Directory 2006 (Ottawa: March 2006), p. 13.
This report also provides regional/provincialshipment data, as well as “channel” data, whichcompares retail shipments and builder shipmentsdescribed as follows:
• Retail shipments include shipments fromCanadian manufacturers to Canadian retailersand other consumers.
• Builder shipments include shipments toCanadian home builders, motels, governments,trailer manufacturers and property management.
Note that these data show the region/province to which the appliances were originally shipped. It is possible that some appliances were eventuallysold in a different province. The extent of thisredistribution is unknown but believed to be small.
This trend analysis is associated with theimplementation of the Energy Efficiency Regulations(the Regulations) authorized under the 1992 EnergyEfficiency Act. The Regulations ensure that newappliances imported into Canada, or manufacturedin Canada and shipped from one province orterritory to another, comply with federal minimumenergy performance standards (MEPS). For moreinformation about the Energy Efficiency Regulations,consult the Guide to Canada’s Energy EfficiencyRegulations found on the Web site atoee.nrcan.gc.ca/regulations.
Additionally, this trend analysis is also associatedwith the ENERGY STAR Initiative in Canada, whichwas officially introduced in 2001. The internationalENERGY STAR symbol is a simple way for consumersto identify products that are among the mostenergy efficient on the market. Only manufacturersand retailers whose products meet the ENERGYSTAR criteria can label their products with thissymbol. For more information about ENERGY STARqualified products, visit energystar.gc.ca.
Introduction
“Market transformation” programs weredesigned to cause lasting change in themarket by increasing the availability of and demand for high-efficiency appliances.The goal of these activities is to developsustainable markets for more efficientproducts. For more information about theecoENERGY Efficiency initiatives of the OEE,visit the Web site at oee.nrcan.gc.ca.

Trends for 1990–2006 / 3
12 Source: Taken directly from E Source Residential Appliances Atlas, (E Source TA-RA-01: November 2001).
How Appliances Work12
Refrigerators and Freezers
Refrigerators and freezers keep food cold byremoving heat from the air in the refrigerator orfreezer cabinet. This is accomplished by using afluid – called the refrigerant – that absorbs heat asit circulates through coils in cabinet walls. The heatis pumped away and rejected outside the cabinet.
The cooling system in a refrigerator or freezer relieson the vapour compression cycle, in which therefrigerant changes from liquid to vapour and backto liquid again while circulating in a closed system,absorbing or discharging heat as it changes phase.In a typical refrigerator, the compressor circulatesthe refrigerant through two sets of coils in onecontinuous loop. One set, the evaporator coils,cools the refrigerator as the working fluid absorbsheat and vaporizes. The other set, the condensercoils, is typically located under or in back of theunit and gives off absorbed heat as the workingfluid condenses.
An insulated cabinet with well-sealed doors is criticalto maintaining the temperature difference betweenthe cool refrigerator interior and ambient air.
Increases in energy efficiency mean less energyrequired per unit volume, but total energy use willalso depend on other factors, particularly the sizeof the unit. All other things being equal, the biggerthe refrigerator, the more energy it will use. Eachcubic foot of additional refrigerated space addsapproximately 20 to 30 kilowatt hours to annualenergy use. Configuration of the refrigerator andthe ratio of freezer to fresh food storage space arealso important. For example, models with side-by-side refrigerator and freezer compartments generallyuse more energy than units with top freezers.
Other features or uses can also impact energy use.Making ice, either in trays in the freezer or withautomatic ice makers, can increase energy use by15 to 20 percent. Through-the-door ice and waterdispensers can increase energy consumption byapproximately 10 percent.
Antisweat heaters that prevent condensation onthe outside of the refrigerator cabinet in humidweather boost consumption as well. However, inmany models, a power-saver switch is available.This switch controls the warming coils that preventcondensation.
Installation can also play a role in energy use. Anolder refrigerator that is surrounded by cabinets or has little clearance will use more energy becausethere is less air flow to carry heat away from thecondenser coils. Most newer models employ fan-cooled condensers, which are less affected by aircirculation around the product. Installation next to a heat source may also cause the unit to usemore energy.
The great strides in the energy efficiency ofrefrigerators have been accomplished by acombination of fairly straightforward technicalimprovements – primarily more efficient compressors,thicker insulation, better door seals, and improvedcondensers and evaporators – and more sophisticatedtechnologies, including microprocessor controlsand sensors. There are, however, many promisingoptions for improving efficiency even further.
Several advanced insulation concepts are pushingthe envelope beyond conventional levels. Anadditional benefit to these insulation materials isthat they allow appliance manufacturers to reduceenergy consumption without reducing internalvolume or changing the outer dimensions of theappliance. In some cases, usable volume in therefrigerator or freezer compartments can be increased.
The use of separate compressors to cool the freshfood and freezer compartments may reduce overallcompressor energy use because each compressor canbe optimized to the conditions of the compartmentit serves. While the compressor is the heart of a refrigeration system, it must be linked to otherimprovements in performance. The use of betterinsulation and door gaskets, for example, reducesthe cooling load of the compressor.
Introduction

4 / Energy Consumption of Major Household Appliances Shipped in Canada
With respect to stand-alone freezers, smaller unitsuse less energy, and chest freezers are more energyefficient than uprights because little cold airescapes when you open the top-mounted door.While chest freezers take up more floor space thanuprights, experts say they are 10 to 25 percentmore efficient because they are better insulated and air does not spill out when the door is opened.Also, the weight of the door helps seal the unit.Upright freezers are available in two types: manual-defrost and self-defrost. Manual-defrost freezers are slightly cheaper to buy and operate. However,self-defrost freezers eliminate the need for you todefrost them. Also, they contain interior shelvesand shelves on the door.
Dishwashers
There are several design and technology optionsavailable to increase the efficiency of conventionaldishwashers, including hot water conservation,motor efficiency improvements and dryingefficiency improvements.
Close to 60 percent of all energy used by dishwashersis used to heat the water. Dishwashers require thehighest temperature of any household appliance –an average recommended operating temperature of60°C (140°F). For most dishwashers sold in NorthAmerica, hot water supplied from the householdwater heater is heated an additional 15°C to 20°Cby an electric booster heater of 500 to 1000 watts.Booster heaters help ensure wash quality andfacilitate heated drying.
Dishwashers with advanced sensors and fuzzy-logiccontrol can automatically select the type of cycleneeded, the water level and the time required toget dishes clean, potentially reducing energy use.
Designing a dishwasher with a lower recommendedwater temperature is one way to reduce energyconsumption. Another way is to reduce the amountof hot water used, which can be accomplished byreducing the level of fill and decreasing wash andrinse times.
Approximately 8 percent of the energy consumedby a typical dishwasher is used to run the motor in the pump. Typically, split-phase motors are used,which have an efficiency of approximately 50 percent.The heated drying mode in dishwashers uses anelectric heating element and sometimes a fan toaccelerate the drying of the load. This functionconsumes approximately 9 percent of the totalenergy used by an average dishwasher.
Much of the energy-conservation potential relatedto dishwashers relies on the user. No matter howefficiently a dishwasher is designed to function, itsperformance depends on proper installation andoperation. For example, a dishwasher uses the sameamount of water and energy whether it is empty or full. Using alternate wash cycles, such as energy-saving, low-temperature or shorter cycles,whenever appropriate, helps conserve energy.
Electric Ranges
Consumer behaviour has more impact on energyuse in cooking than in most other areas of applianceuse. Efficiency options are limited in most cookingtechnologies. Educating the consumer to choosewisely holds more potential for cooking efficiencyimprovements than do most technologicaladvancements.
Consumer cooking habits can dramatically improvecooking efficiency – more than most technologicaladvances can. Cooking energy can be reduced byusing smaller appliances, by choosing cookwarewisely and by heating the minimum amountnecessary for the minimum time necessary. Fromthe users’ preferences for appliances to how oftenthey peek in the oven, the users’ actions do impactcooking energy.
Cookware choice also impacts energy use.Choosing flat-bottom cookware instead of warped-bottom cookware saves a significant amount ofenergy on electric elements. Further energy can besaved by using insulated cookware, while the mostefficient choice is a pressure cooker.
Introduction

Trends for 1990–2006 / 5
Most of the trends in electric ranges are not beingdriven by energy efficiency. Instead, manufacturersare seeking to make their appliances easier to clean,more elegantly styled, and simpler and quicker to use.
Ovens are inherently inefficient because the heattakes a circuitous path from the heating element tothe food. The coil or burner radiates energy, whichis absorbed partly by the cooking vessel but mostlyby the oven walls. The walls then conduct heat tothe air, which finally cooks the food. Self-cleaningovens generally have extra insulation built into the walls to resist the 450°C (850°F) temperaturesgenerated during self cleaning.
Clothes Washers
Clothes washers clean clothes by using mechanical,chemical and thermal energy. When placed inwater, soil is dislodged from fibres by motion andfriction and is carried away by the water. Laundrydetergent chemicals, many of which are activatedby heat, help emulsify oil and grease and the dirt they bind. In some products, enzymes breakdown proteins and other materials so they can beremoved by water.
The most significant improvement in the energyefficiency of clothes washers is occurring through a shift to horizontal-axis washers and advancedvertical-axis machines. Many of the advancedhorizontal- and vertical-axis machines now use ahigh spin speed to reduce the remaining moisturecontent of laundry, thereby reducing the amountof dryer energy needed.
In horizontal-axis machines, clothes are tumbledin a rotating tub so that the clothes are plungedinto a shallow pool of water and then pulled outagain. Some machines recirculate water throughthe washer by pumping water to the top of thewasher tub and spraying it over the clothes, thusreducing water consumption by 20 percent.
Washing-machine motors and controls account foronly a small portion of the overall energy requiredto launder clothes. A larger portion of energy goesinto heating the water used in the wash and rinsecycles and drying the washed clothes. Efficiencygains come from reducing the water needed to cleanclothes effectively and increasing the speed of thespin cycle so that less energy is needed for drying.
Increasingly, clothes washers are equipped withautomatic controls that determine water level andtemperature based on electronic sensors locatedwithin the machine. Additional research will beneeded to determine how these controls affectconsumer behaviour and, as a result, water andenergy consumption.
Electric Clothes Dryers
Most residential electric clothes dryers in NorthAmerica are evaporative dryers. These dryers operateby circulating air, drawn from the household livingspace and heated by electricity, through a rotatingdrum containing wet clothes, then venting themoist exhaust air, usually to the outdoors. The levelof heat is regulated by a thermostat – all dryershave a temperature sensor in the exhaust thatcycles the heat off and on to prevent overheating.Dryer shut-off at the end of a cycle is controlled by a timer, temperature sensor or moisture sensor.
In conventional dryers, the most direct way to saveenergy is through shorter drying cycles – the lesstime the dryer is on, the less energy it uses.
How a dryer is operated and maintained makes adifference in how much energy it uses. For example,a dryer filled to one third of its capacity requiresapproximately 25 percent more energy than whenfully loaded to dry each pound of clothes. Withsmall loads, heated air can bypass the clothes andleave the drum without contributing to the dryingprocess. Also, drying several loads consecutivelyprevents losing the heat. Most complaints concerningpoor drying performance can be traced to cloggedlint filters and exhaust systems.
Introduction

6 / Energy Consumption of Major Household Appliances Shipped in Canada
13 Source: Natural Resources Canada, Improving Energy Performance in Canada, Report to Parliament Under the Energy Efficiency Actfor the Fiscal Year 2006–2007 (Ottawa: 2008), p. 11. Available: oee.nrcan.gc.ca/Publications/statistics/parliament06-07/pdf/parliament06-07.pdf.
Energy Efficiency Regulations andMinimum Energy PerformanceStandardsNatural Resources Canada’s (NRCan’s) wide rangeof energy efficiency initiatives includes standards,labelling programs and Canada’s Energy EfficiencyRegulations.13
The Energy Efficiency Act (the Act) of 1992 gives theGovernment of Canada the authority to make andenforce regulations on performance and labellingrequirements for energy-using products, includingmajor household appliances, imported into Canadaor shipped across provincial or territorial borders.
The Regulations came into effect in February 1995,following extensive consultations with provincial/territorial governments, affected industries, utilities,environmental groups and others. The Regulationsrefer to national consensus performance standardsdeveloped by accredited standards-writingorganizations, such as the Canadian StandardsAssociation. Such standards include testingprocedures that must be used to determine aproduct’s energy performance. Regulated productsthat fail to meet the MEPS identified by theRegulations cannot be imported into Canada or traded interprovincially.
NRCan works with stakeholders to improvestandards development and approval processes and to accelerate the market penetration of high-efficiency equipment.
Amendments to the Regulations also includelabelling improvements so consumers have thelatest information about the most energy-efficientproducts on the market. This way, Canadians cantap into huge potential savings in energy andmoney, and they will benefit from the improved air quality that results when emissions are reduced.In preparing amendments to the Regulations,
NRCan analyses the impact of the proposedamendment on society, the economy and theenvironment. Table 7.1 in Chapter 7 lists theamendments made to the MEPS for the variousappliances since they were introduced. For moreinformation about the Energy Efficiency Regulations,visit the Web site at oee.nrcan.gc.ca/regulations.
Canada’s Energy Efficiency Act and Energy EfficiencyRegulations support several labelling initiatives.These initiatives require that an EnerGuide label bedisplayed on major electrical household appliances,showing the consumer the estimated annual unitenergy consumption of the product in kilowatthours and comparing it with the most efficient andleast efficient models of the same class and size.
EnerGuide directories with energy ratings for majorappliances are published each year and distributedto consumers, retailers and appliance salespeople.Up-to-date searchable lists of models are alsoavailable on the NRCan Web site at oee.nrcan.gc.ca/publications/infosource/pub/appliances/2007/.
As well, the Regulations are consistent with, andbuild on, the ENERGY STAR Initiative in Canada.The internationally recognized ENERGY STARsymbol is a simple way for consumers to identifyproducts that are among the most energy efficienton the market. The ENERGY STAR program began in the United States (U.S.), through theEnvironmental Protection Agency (EPA), and hasexpanded internationally. NRCan’s OEE signed an administrative arrangement with the U.S. EPAand the U.S. Department of Energy to become the official custodian of the program for Canada.Canada became the fifth country to join theENERGY STAR program, with Australia, NewZealand, Japan and Taiwan. The European Union is now also a signatory of ENERGY STAR.
Introduction

Trends for 1990–2006 / 7
The ENERGY STAR® Initiative
Natural Resources Canada’sOffice of Energy Efficiencypromotes the internationalENERGY STAR symbol acrossCanada. Manufacturers andretailers of energy-efficientproducts; utilities and energy
retailers; all levels of government; and industrygroups recognize the benefits of ENERGY STAR to consumers and have joined in promoting thesymbol. Only manufacturers and retailers whoseproducts meet the ENERGY STAR criteria can labeltheir products with this symbol. Choosing anENERGY STAR-labelled product over a conventionalmodel could save you hundreds of dollars inenergy costs.
ENERGY STAR does not label electric ranges orelectric clothes dryers because most of them usesimilar amounts of energy, which means there islittle difference in energy consumption betweenmodels, and little potential to attain higher energy savings.
Refrigerators
To be ENERGY STAR qualified, standard-sizerefrigerators must exceed Government of Canadaminimum energy efficiency levels by at least 15 percent. Compact refrigerators must achieveenergy efficiency levels that are at least 20 percenthigher than the minimum regulated standard inCanada. These eligibility criteria became morestringent on April 28, 2007.
ENERGY STAR qualified refrigerators typically havea more energy-efficient compressor and betterinsulation than conventional models. They mayalso have an “Energy Saver” switch that allowsconsumers to adjust how much energy the refrigeratoruses to keep food fresh.
Freezers
To qualify, standard-size freezers must achieveenergy efficiency levels that are at least 10 percenthigher than the minimum regulated standard inCanada. Compact freezers must exceed the minimumregulated standard by 20 percent to qualify forENERGY STAR.
Dishwashers
The best energy performers are ENERGY STARqualified dishwashers, which must achieve energyefficiency levels that are at least 25 percent higherthan the minimum regulated standard in Canada.This eligibility criterion became more stringent onJanuary 1, 2007.
Many ENERGY STAR dishwashers use “smart”sensors that adjust the wash cycle and the amountof water used to match the load. They may alsohave an internal heater to boost the temperature of incoming water.
Clothes Washers
The best energy performers are ENERGY STARqualified clothes washers, which use 35 to 50 percentless water and 20 to 50 percent less energy per loadthan other washers. Only standard-size clotheswashers with minimum tub capacities of 45 litres (L)(1.6 cubic feet) qualify for the ENERGY STAR symbol.ENERGY STAR qualified clothes washers areavailable in both top- and front-loading models.
To be ENERGY STAR qualified, clothes washersmust meet or exceed a modified energy factor(MEF) of 40.21 L per kilowatt hour per cycle. TheMEF means that the calculation takes into accountthe amount of energy used by the dryer to removemoisture content. These eligibility criteria becamemore stringent on January 1, 2007.

8 / Energy Consumption of Major Household Appliances Shipped in Canada
14 For each appliance, the penetration rate is the total number of ENERGY STAR qualified appliances shipped divided by the totalnumber of appliances shipped of that particular appliance.
15 These percentages are based on figures reported by the Canadian Appliance Manufacturers Association members to the third-party contractor referred to in Appendix A, “Methodology.” They differ slightly from those reported in the 2007 MajorAppliance Industry Trends & Forecast statistical reference tool published by Electro-Federation Canada. Refer to the sectionentitled “Reporting Methodology – Expansion Factors” (page 11) in that publication for more details.
The ENERGY STAR symbol is becoming increasinglyrecognized by the Canadian appliance purchaser.The next section analyses trends in ENERGY STARshipments.
Penetration Rate of ENERGY STARQualified Appliances
Figure 2 illustrates the penetration rate14 ofENERGY STAR qualified appliances since theybegan appearing on the market in early 1999(influenced by their popularity in the United States).In 2001, Canada officially adopted the ENERGYSTAR registered mark to designate the most energy-efficient appliances. By 2006, 80 percent of alldishwashers, 51 percent of all clothes washers and37 percent of all refrigerators shipped in Canadawere ENERGY STAR qualified products.15
Possible reasons for the higher penetration rate ofENERGY STAR qualified dishwashers – comparedwith those for clothes washers and refrigerators –are that many of them were made available to the consumer and they were being offered ataffordable prices. Dishwasher manufacturers metthe specifications quickly, and the incremental cost to meet ENERGY STAR qualifying levels waseventually eliminated.
Also, the dishwasher specifications had notchanged in some time, whereas specifications forrefrigerators and clothes washers had. A revision to increase the stringency of the ENERGY STARspecification for dishwashers came into effect in January 2007. Shipments of ENERGY STARdishwashers decreased slightly in 2006, possiblybecause the manufacturers were preparingthemselves for these upcoming, more stringentspecifications.
Figure 2 also shows that shipments of ENERGYSTAR refrigerators decreased slightly between 2003 and 2004. This decrease coincides with the2004 amendment to the ENERGY STAR refrigeratorspecifications. Table 7.1 in Chapter 7 lists theamendments made to the ENERGY STARspecifications for the various appliances since they were introduced in Canada.
Because the ENERGY STAR Initiative includedfreezers only recently, they have not been includedin the analysis at this time.
The ENERGY STAR® Initiative
Model Year
Dishwashers ClothesWashers
Refrigerators
Ship
men
ts (
%)
0
20
40
60
80
100
20062005200420032002200120001999
Figure 2 ENERGY STAR Qualified Appliancesas a Percentage of Total Shipments in Canada,1999−2006*
* For more information, see Table D.A.1 in Appendix D,“Detailed Tables.”

Trends for 1990–2006 / 9
Penetration Rate by Region/Province,2004−2006
Figure 3 shows the breakdown by region/provincefor each appliance category covered by theENERGY STAR Initiative from 2004 to 2006(excluding freezers). The tendencies remainedsomewhat constant throughout the country, withthe penetration rate of ENERGY STAR clotheswashers increasing slightly in all regions.
The figure also shows that shipments of ENERGYSTAR dishwashers decreased slightly in all regionsin 2006. Note that, for confidentiality reasons, thepenetration rate for clothes washers in the Atlanticprovinces is not shown.
The ENERGY STAR® Initiative
Figure 3 ENERGY STAR Qualified Appliances as a Percentage of Total Shipments, by Region/Province, 2004−2006*
* For more information, see Table D.A.2 in Appendix D, “Detailed Tables.”
Region/Province
Dishwashers Clothes Washers Refrigerators
Ship
men
ts (
%)
0
20
40
60
80
100
BritishColumbia
andTerritories
PrairiesOntarioQuebecAtlanticCanada2004 2005 2006 2004 2005 2006 2004 2005 2006 2004 2005 2006 2004 2005 2006 2004 2005 2006

10 / Energy Consumption of Major Household Appliances Shipped in Canada
The Role of the Members of the Canadian Appliance Manufacturers Association
16 Source: Canadian Appliance Manufacturers Association, a division of Electro-Federation Canada, 5800 Explorer Drive, Suite 200, Mississauga, Ontario L4W 5K9 (www.electrofed.com).
17 Natural Resources Canada, 2003 Survey of Household Energy Use (SHEU), Detailed Statistical Report (Ottawa: 2006), p. 59.Available: oee.nrcan.gc.ca/Publications/statistics/sheu03/pdf/sheu03.pdf.
Canadian Appliance Manufacturers Association(CAMA) members understand the important rolesthey must play in minimizing the effects thathousehold appliances have on the environment.16
Developing, producing and marketing moreenergy-efficient products to aid in reducingconsumer energy use and harmful greenhouse gas emissions is one of these roles.
Energy-efficient, ENERGY STAR® qualifiedrefrigerators, clothes washers, dishwashers andfreezers are major drivers of reductions in Canadianenergy use. CAMA members also acknowledge theimportance of recycling and properly disposing ofwhite goods and their packaging.
The recycling rate for end-of-life appliances inCanada is considered to be high due to the numberof municipal recycling initiatives and the significantlevel of valuable materials that comprise mosthousehold appliances, such as steel, aluminum,copper, zinc and plastics. However, it is difficult to put a number on overall national or regionalrecovery rates because there is no nationalmechanism for tracking the recovery and recyclingof white goods.
As previously noted, according to the 2003 Surveyof Household Energy Use,17 in 2003, approximately765 000 Canadians did not dispose of their previousrefrigerator when they acquired a new one. As theissue is truly a North American concern, CAMA has formed a joint working group with the UnitedStates Association of Home Appliance Manufacturersto develop new solutions to a growing issue.
The significant reduction in appliance energyconsumption over the years has resulted from the combined efforts of the appliance industry,governments, retailers and consumers. Theminimum efficiency standards have contributedto a decrease in peak electricity demand and anincrease in cost savings to consumers. The benefit tosociety of more efficient appliances will increase asthe existing stock of major appliances in Canadianhomes is replaced.
CAMA and its member companies takeenvironmental issues seriously. They have takensignificant steps to minimize the impact householdappliances have on the environment while meetingconsumer needs. Examples of improvements by theappliance manufacturers, in conjunction with theirmaterial and component suppliers, are as follows:
• Refrigerators and freezers – improvedcondensers, compressors, evaporators, fanmotors, door seals and foam insulation
• Dishwashers – better insulation, spray arms and filtering systems; and the availability of anair-dry cycle
• Electric ranges – improvements in insulationand venting
• Clothes washers – upgraded sensors, motorsand mixing valves; the promotion of a coldwater wash; and the addition of front-loadingclothes washers to manufacturers’ product lines
• Electric clothes dryers – automatic terminationcontrols eliminating excessive drying and moreeffective water extraction in the washing machine,resulting in a shorter drying time

Trends for 1990–2006 / 11
Chapter 1 / Refrigerators
18 The term “all-refrigerators” refers to models that have no freezer compartment.
19 Type 5A is a new refrigerator type in 2006.
Refrigerators are available in various sizes and witha variety of features, all of which affect energyconsumption. Consequently, EnerGuide groupsrefrigerators according to type and size, therebyenabling you to compare the energy consumptionof similar models. Table 1.1 compares the marketshare of the various types of refrigerators in 2006.
The following are the definitions of the varioustypes of refrigerators:
Refrigerators without automatic defrost
Type 1 Refrigerators and refrigerator-freezerswith manual defrost
Type 2 Refrigerator-freezers with partialautomatic defrost
Refrigerators with automatic defrost
Type 3 Refrigerator-freezers with automaticdefrost and top-mounted freezer, butwithout through-the-door ice service;also all-refrigerators18 with automaticdefrost
Type 4 Refrigerator-freezers with automaticdefrost and side-mounted freezer, butwithout through-the-door ice service
Type 5 Refrigerator-freezers with automaticdefrost and bottom-mounted freezer,but without through-the-door iceservice
Type 5A19 Refrigerator-freezers with automaticdefrost, with bottom-mounted freezer,with through-the-door ice service
Type 6 Refrigerator-freezers with automaticdefrost, top-mounted freezer andthrough-the-door ice service
Type 7 Refrigerator-freezers with automaticdefrost, side-mounted freezer andthrough-the-door ice service
Table 1.1 Refrigerator Market, 2006
Type of Refrigerator Market Share (%)
1 0.1
2 0.0
3 64.5
4 1.9
5 21.2
5A 0.6
6 0.0
7 10.1
11 1.5
12 0.0
13 0.0
14 0.0
15 0.0
100.0
Through-the-Door Ice Service 10.7
Type of Freezer*
Top-mounted 64.5
Side-mounted 12.0
Bottom-mounted 21.8
Without freezer 1.7
100.0
*Due to rounding, the numbers may not add up.

12 / Energy Consumption of Major Household Appliances Shipped in Canada
20 Appliances with total refrigerated volumes of less than 7.75 cubic feet and overall heights of less than 36 inches.
Refrigerators – compact20
Type 11 Compact refrigerators and refrigerator-freezers with manual defrost
Type 12 Compact refrigerators and refrigerator-freezers with partial automatic defrost
Type 13 Compact refrigerator-freezers withautomatic defrost and top-mountedfreezer; also compact all-refrigeratorswith automatic defrost
Type 14 Compact refrigerator-freezers withautomatic defrost and side-mountedfreezer
Type 15 Compact refrigerator-freezers withautomatic defrost and bottom-mounted freezer
1.1 2006 Market SnapshotThe shipment-weighted average annual unit energyconsumption (UEC) of all refrigerators shipped in2006 was 481 kilowatt hours (kWh). In 2006, as inall years studied since 1990, Type 3 refrigerators(those with a top-mounted freezer and automaticdefrost) were the most popular type in Canada,accounting for 64.5 percent of all refrigeratorsshipped on the Canadian market.
The shipment-weighted average annual UEC ofType 3, and all other refrigerator types, is outlinedin Table D.1 in Appendix D, “Detailed Tables.”
The most popular size category, 16.5 to 18.4 cubicfeet (cu. ft.), accounted for 40.1 percent of themarket in 2006.
Chapter 1 / Refrigerators
There has been a substantial improvement in the energy efficiency of refrigerators since1990. By 2006, 88.6 percent of refrigeratorsconsumed less than 30 kWh/cu. ft. per year,even though a trend toward largerrefrigerators had emerged.
� In 2006, refrigerators with a volumebetween 16.5 and 18.4 cu. ft. remained the most popular, on average accountingfor 40.1 percent of the market.
� From 1990 to 2006, the largest refrigerators(those with a volume of at least 20.5 cu. ft.)more than quadrupled in market share –rising from 5.1 to 23.9 percent.
� In 1990, refrigerators larger than 16.4 cu. ft.consumed on average more than 1000 kWhof electricity per year. By 2006, refrigeratorsthat size consumed less than half as muchenergy, and some of the largest units (28.5 to 30.4 cu. ft.) consumed, on average,only 630 kWh of electricity per year.
In 2006, 37.3 percent of the refrigerator models onthe market qualified as ENERGY STAR® products,exceeding the minimum energy performancestandards (MEPS) by at least 15 percent (see Table D.A.1 in Appendix D, “Detailed Tables”).

Trends for 1990–2006 / 13
1.2 Distribution of Shipments
1.2.1 Distribution by Type
Although Type 3 refrigerators were consistently themost shipped model between 1990 and 2006, theirmarket share declined from 84.9 to 64.5 percent ofall refrigerators shipped, as illustrated in Table 1.2and Figure 1.1.
There seems to be an increasing trend towardrefrigerators with a bottom-mounted freezer (Types 5 and 5A). These refrigerators did not have a significant market share in 1990; but with asteady increase in popularity, they accounted for
Chapter 1 / Refrigerators
Table 1.2 Distribution of Refrigerators by Type
Model Year Standard-Size Compact
Type 1 Type 2 Type 3 Type 4 Type 5 Type 5A Type 6 Type 7 Type 11 Type 13(%) (%) (%) (%) (%) (%) (%) (%) (%) (%)
1990 3.5 2.0 84.9 7.6 0.6 0.0 0.0 0.0 0.1 1.2
1991 3.1 0.3 84.3 9.0 0.8 0.0 0.0 0.3 0.3 2.0
1992 2.1 0.4 85.4 7.5 0.3 0.0 0.0 3.5 0.1 0.6
1993 1.1 0.6 85.5 6.8 0.7 0.0 0.0 4.2 0.1 0.9
1994 0.6 0.7 85.1 4.9 2.0 0.0 0.1 4.3 1.3 1.0
1995 0.2 0.6 84.8 4.6 1.6 0.0 0.1 5.2 1.9 1.0
1996 0.2 0.5 84.8 4.4 2.2 0.0 0.1 6.6 0.8 0.4
1997 0.4 0.1 83.8 3.8 3.2 0.0 0.0 8.3 0.4 0.0
1998 0.4 0.0 76.5 3.3 8.5 0.0 0.3 7.3 3.6 0.0
1999 0.1 0.0 76.6 2.4 8.4 0.0 0.4 7.5 4.6 0.0
2000 0.0 0.0 72.9 2.2 11.1 0.0 0.5 7.9 5.3 0.0
2001 0.0 0.0 71.1 2.1 11.1 0.0 0.4 9.1 6.1 0.1
2002 0.0 0.0 70.2 2.2 10.6 0.0 0.2 11.0 5.8 0.1
2003 0.0 0.0 68.2 2.4 13.9 0.0 0.1 11.2 2.0 2.2
2004 0.0 0.0 66.4 1.9 15.5 0.0 0.1 11.0 4.5 0.5
2005 0.0 0.0 64.8 1.1 17.9 0.0 0.0 9.6 6.3 0.1
2006 0.1 0.0 64.5 1.9 21.2 0.6 0.0 10.1 1.5 0.0
Total Change 3.4 2.0 20.4 5.7 20.6 0.6 0.0 10.1 1.4 1.2
21.8 percent of the market in 2006. Also, refrigeratorswith a side-mounted freezer, automatic defrost andthrough-the-door ice service (Type 7) remainedpopular, accounting for 10.1 percent of the marketin 2006.
Out of these three increasingly popular refrigeratortypes (5, 5A and 7), Type 5 is generally more energyefficient (see Figure 1.2 and Table D.1 in Appendix D,“Detailed Tables”). Types 1, 2, 4, 6, 11 and 13 hadalmost disappeared from the market by 2006. Dataon Types 12, 14 and 15 refrigerators are available,but because the values are so low, they were notincluded in the analysis.

14 / Energy Consumption of Major Household Appliances Shipped in Canada
Figure 1.2 illustrates the average annual UEC of thethree most popular refrigerator types during thestudy period. Type 3 refrigerators remained themost energy efficient, followed by Types 5 and 7.
Chapter 1 / Refrigerators
Figure 1.2 Average Annual Unit EnergyConsumption of Refrigerators by Type, by Model Year*
*For more information, see Table D.1 in Appendix D,“Detailed Tables.”
Model Year
kWh
/yr
400
600
800
1000
1200
Type 7Type 5Type 3
200620042002200019981996199419921990
Figure 1.1 Distribution of Standard-Size Refrigerators by Type, 1990 and 2006
1990
Type 13.5%
Type 22.0%
Type 384.9%
Type 47.6%
Type 50.6%
Type 5A0.0%
Type 60.0% Type 7
0.0%
2006
Type 10.1% Type 2
0.0%
Type 364.5%
Type 41.9%
Type 521.2%
Type 5A0.6%
Type 60.0%
Type 710.1%

Trends for 1990–2006 / 15
In 2006, Type 3 refrigerators remained the mostpopular in the Atlantic provinces, whereas Type 5(those with a bottom-mounted freezer and automaticdefrost) remained more popular in Quebec. Type 7(those with a side-mounted freezer, automaticdefrost and through-the-door ice service) weremore popular in Ontario and the Western provinces.
Chapter 1 / Refrigerators
Figure 1.3 Distribution of Refrigerators by Type, by Region/Province, 2004−2006*
*For more information, see Table D.2 in Appendix D, “Detailed Tables.”
Region/Province
Type 3 Type 5 Type 5A Type 7 Others (Types 1, 2, 4, 6, 11, 13)
Ship
men
ts (
%)
BritishColumbia
andTerritories
PrairiesOntarioQuebecAtlanticCanada
0
20
40
60
80
100
200620052004200620052004200620052004200620052004200620052004200620052004
1.2.2 Distribution by Type, by Region/Province
As previously mentioned, Type 3 refrigerators(those with a top-mounted freezer and automaticdefrost) remained the most shipped model in 2006,with a national average of 64.5 percent. Figure 1.3illustrates the distribution of the various types ofrefrigerators throughout the regions/provinces,from 2004 to 2006.

16 / Energy Consumption of Major Household Appliances Shipped in Canada
21 Builder sales include those to home, row house or apartment builders; motels; governments; trailer manufacturers; andproperty management.
22 Retail sales include those by Canadian manufacturers and importers and/or their branches and distributors to Canadianretailers and other consumers, but do not include sales to branches or to other Canadian Appliance Manufacturers Associationmember companies.
23 Natural Resources Canada, 2003 Survey of Household Energy Use (SHEU), Detailed Statistical Report (Ottawa: 2006), Table 5.1, p. 57.Available: oee.nrcan.gc.ca/Publications/statistics/sheu03/pdf/sheu03.pdf.
1.2.3 Distribution by Channel, by Region/Province
Figure 1.4 illustrates the proportion of refrigeratorsshipped for builder sales21 versus those shipped forretail sales,22 from 2004 to 2006. It shows minorfluctuations in builder/retail shipments for allregions of the country. Once agin, British Columbiaand the Territories had a substantially larger builderrepresentation than the other regions; shipmentsof refrigerators to builders in Quebec were againrelatively low.
1.2.4 Distribution by Volume
Refrigerators with a volume between 16.5 and18.4 cu. ft. remained the most popular, on averageaccounting for 40.1 percent of the market in 2006,as illustrated in Table 1.3 and Figure 1.5.
However, a trend toward larger refrigerators hademerged. This trend is also evidenced in thefindings of the 2003 Survey of Household Energy Use23
where, in 2003, more than 61 percent of householdssurveyed possessed a main refrigerator larger than16.5 cu. ft. The market share of refrigerators with acapacity greater than 18.5 cu. ft. increased steadilyfrom 1990 to 2006 – rising from 7.7 percent to 41.2 percent.
Chapter 1 / Refrigerators
Figure 1.4 Distribution of Refrigerators by Channel, by Region/Province, 2004−2006*
*For more information, see Table D.3 in Appendix D, “Detailed Tables.”
Region/Province
Builder Retail
Ship
men
ts (
%)
BritishColumbia
andTerritories
PrairiesOntarioQuebecAtlanticCanada
0
20
40
60
80
100
200620052004200620052004200620052004200620052004200620052004200620052004

Table 1.3 Distribution of Refrigerators by Volume
Model Year Volume (cu. ft.)
<10.5 10.5–12.4 12.5–14.4 14.5–16.4 16.5–18.4 18.5–20.4 ≥20.5(%) (%) (%) (%) (%) (%) (%)
1990 3.8 13.2 17.8 14.1 43.3 2.6 5.1
1991 2.6 14.2 11.0 14.2 47.9 5.4 4.7
1992 1.6 10.9 10.0 19.6 42.0 8.3 7.6
1993 2.2 8.0 7.1 16.6 45.3 12.2 8.7
1994 3.4 9.5 6.9 16.5 45.8 8.7 9.3
1995 3.7 14.1 6.7 15.0 39.5 10.8 10.2
1996 1.9 13.5 6.7 13.4 38.6 12.5 13.4
1997 0.9 11.1 6.9 12.2 39.2 12.7 16.9
1998 4.0 9.3 7.0 10.6 42.7 11.1 15.2
1999 5.3 7.6 6.9 9.9 43.5 10.0 16.8
2000 6.5 6.6 7.7 9.0 41.2 9.3 19.7
2001 8.1 5.6 6.7 8.7 36.4 11.4 23.2
2002 6.3 5.5 7.4 6.8 34.6 15.3 24.2
2003 4.9 3.9 6.1 8.6 37.0 15.7 23.9
2004 5.6 3.0 3.3 11.0 39.2 14.3 23.5
2005 7.0 2.5 2.3 9.7 41.6 15.2 21.7
2006 2.9 3.6 2.5 9.7 40.1 17.3 23.9
Total Change 0.9 9.6 15.3 4.4 3.2 14.7 18.8
Trends for 1990–2006 / 17
Chapter 1 / Refrigerators
Figure 1.5 Distribution of Refrigerators by Volume, 1990 and 2006
10.5–12.43.6% 12.5–14.4
2.5%
18.5–20.417.3%
≥20.523.9%
<10.52.9%
16.5–18.440.1%
14.5–16.49.7%
1990 (cu. ft.)
10.5–12.413.2%
12.5–14.417.8%
18.5–20.42.6%
≥20.55.1%
<10.53.8%
16.5–18.443.3%
14.5–16.414.1%
2006 (cu. ft.)

1.2.5 Distribution by Volume, by Region/Province
Figure 1.6 illustrates that refrigerators between 16.5 and 18.4 cu. ft. were the most popularnationally from 2004 to 2006. This chart showsthat consumers in the Atlantic provinces continued
18 / Energy Consumption of Major Household Appliances Shipped in Canada
Chapter 1 / Refrigerators
Figure 1.6 Distribution of Refrigerators by Volume, by Region/Province, 2004−2006*
*For more information, see Table D.4 in Appendix D, “Detailed Tables.”
Region/Province
<10.5 cu. ft. 10.5–12.4 cu. ft. 12.5–14.4 cu. ft.
16.5–18.4 cu. ft. 18.5–20.4 cu. ft. ≥20.5 cu. ft.
14.5–16.4 cu. ft.
Ship
men
ts (
%)
BritishColumbia
andTerritories
PrairiesOntarioQuebecAtlanticCanada
0
20
40
60
80
100
200620052004200620052004200620052004200620052004200620052004200620052004
to purchase smaller refrigerators in 2006, comparedto the national average. This chart also shows that,in 2006, the Prairies received more shipments oflarger refrigerators (over 18.5 cu. ft.) than the restof the country.

Trends for 1990–2006 / 19
Chapter 1 / Refrigerators
Figure 1.7 compares the national breakdown of thedistribution of refrigerators for builder sales andretail sales from 2004 to 2006. Although the mostpopular size of refrigerator in both cases for allyears was between 16.5 and 18.4 cu. ft., retailshipments of refrigerators larger than 18.5 cu. ft.remained higher in 2006 than those shipped for the builder trade. This chart also shows thatshipments of refrigerators between 14.5 and 16.4 cu. ft. to builders remained higher in 2006than those shipped for retail sales.
The regional breakdown of builder and retailshipments by volume can be found in Tables D.5and D.6 in Appendix D, “Detailed Tables.” Onetrend that can be noted from these tables is thatbuilder shipments of larger refrigerators (those over16.5 cu. ft.) in British Columbia and the Territoriesremained substantially larger in 2006 than the rest of the country (77.1 percent compared to thenational average of 58.1 percent). Another trendthat can be observed is that retail shipments ofrefrigerators larger than 18.5 cu. ft. in the Atlanticprovinces remained smaller in 2006 than the rest of the country (23.2 percent compared to the national average of 46.7 percent).
Figure 1.7 Distribution of Refrigerators by Volume, by Channel, 2004−2006*
*For more information, see Tables D.5 and D.6 in Appendix D, “Detailed Tables.”
Channel
<10.5 cu. ft. 10.5–12.4 cu. ft. 12.5–14.4 cu. ft.
≥20.5 cu. ft.
14.5–16.4 cu. ft. 16.5–18.4 cu. ft. 18.5–20.4 cu. ft.
Ship
men
ts (
%)
Builder Retail
0
20
40
60
80
100
200620052004200620052004

24 For more information about the 2001 amendment to the MEPS for refrigerators, visit the following Web site:oee.nrcan.gc.ca/regulations/refrigerators.cfm.
1.2.6 Distribution by Average AnnualUnit Energy Consumption per Cubic Foot
Refrigerators are becoming more efficient, thankslargely to the ongoing efforts of manufacturers, the MEPS and the amendment to the MEPS.24
Note in Table 1.4 and Figure 1.8 that, since this2001 amendment to the MEPS, there has been a
20 / Energy Consumption of Major Household Appliances Shipped in Canada
Chapter 1 / Refrigerators
Table 1.4 Distribution of Refrigerators by Average Annual Unit Energy Consumption per Cubic Foot
Model Year kWh/cu. ft. per year
<30 30–39.9 40–49.9 50–59.9 60–69.9 70–79.9 80–89.9 ≥90(%) (%) (%) (%) (%) (%) (%) (%)
1990 0.0 1.5 3.9 15.3 60.2 15.4 3.0 0.7
1991 0.0 2.9 10.7 26.9 41.3 12.2 3.6 2.4
1992 0.0 4.8 26.9 33.2 16.0 10.4 4.0 4.8
1993 0.1 51.0 29.7 9.1 1.4 4.2 1.9 2.6
1994 0.4 70.9 22.4 4.0 0.0 0.0 1.7 0.6
1995 2.8 63.3 29.3 1.6 0.0 0.1 2.5 0.5
1996 6.6 60.0 31.2 0.9 0.1 0.0 0.7 0.4
1997 6.9 60.4 31.4 0.9 0.1 0.0 0.2 0.1
1998 5.9 62.4 27.1 0.8 0.0 0.6 2.9 0.2
1999 8.4 61.2 25.0 0.6 0.2 0.7 3.4 0.6
2000 12.2 57.4 23.6 0.9 0.4 0.7 3.6 1.2
2001 44.5 34.5 12.7 1.3 0.8 4.0 0.7 1.5
2002 64.3 26.6 3.1 0.2 0.0 3.9 0.2 1.7
2003 78.4 15.5 1.6 0.2 0.2 2.8 0.2 1.0
2004 82.6 11.0 1.3 0.2 0.2 1.2 3.0 0.7
2005 86.7 6.5 0.2 0.2 0.6 3.3 1.8 0.7
2006 88.6 8.5 0.9 0.3 0.2 0.9 0.1 0.5
TotalChange 88.6 7.0 3.0 15.0 60.0 14.5 2.9 0.2
substantial improvement in the energy efficiencyof refrigerators. In 1990, no refrigerators consumedless than 30 kWh/cu. ft. per year. By 2006,88.6 percent of refrigerators consumed less than30 kWh per cu. ft. per year and 97.1 percentconsumed less than 40 kWh per cu. ft., eventhough there was a definite trend toward largerones, as illustrated in Table 1.3.

Trends for 1990–2006 / 21
Also responsible for the trend toward the purchaseof more energy-efficient refrigerators are the variousinitiatives and incentives offered by the federal,provincial and municipal governments and utilities.
Chapter 1 / Refrigerators
Figure 1.8 Distribution of Refrigerators by Average Annual Unit Energy Consumption per Cubic Foot, 1990 and 2006
1990 (kWh/cu. ft. per year)
30–39.91.5%
40–49.93.9%
70–79.915.4%
80–89.93.0%
<300.0%
60–69.960.2%
50–59.915.3%
2006 (kWh/cu. ft. per year)
≥900.7%
30–39.98.5%
40–49.90.9%
70–79.90.9% 80–89.9
0.1%
<3088.6%
60–69.90.2%50–59.9
0.3%≥90
0.5%

cubic foot throughout the regions. British Columbiaand the Territories had the largest increase inshipments of refrigerators consuming less than 30 kWh/cu. ft. from 2005 to 2006, compared withthe rest of the country.
22 / Energy Consumption of Major Household Appliances Shipped in Canada
1.2.7 Distribution by Average AnnualUnit Energy Consumption per CubicFoot, by Region/Province
In 2006, 88.6 percent of all refrigerators shipped inCanada consumed less than 30 kWh/cu. ft. Figure 1.9illustrates the trends of energy consumption per
Chapter 1 / Refrigerators
Figure 1.9 Distribution of Refrigerators by Average Annual Unit Energy Consumption per Cubic Foot, by Region/Province, 2004−2006*
*For more information, see Table D.7 in Appendix D, “Detailed Tables.”
Region/Province
<30 kWh/cu. ft. per year 30–39.9 kWh/cu. ft. per year 40–49.9 kWh/cu. ft. per year
50–59.9 kWh/cu. ft. per year ≥60 kWh/cu. ft. per year
Ship
men
ts (
%)
BritishColumbia
andTerritories
PrairiesOntarioQuebecAtlanticCanada
0
20
40
60
80
100
200620052004200620052004200620052004200620052004200620052004200620052004

Trends for 1990–2006 / 23
Chapter 1 / Refrigerators
1.3 Energy Consumption
1.3.1 Average Annual Unit EnergyConsumption by Model Year
As mentioned previously, even though there is diversity in types and sizes of refrigerators, they have been grouped to calculate the average annual UEC for all refrigerators by model year (see Figure 1.10). Overall, the average annual UECdecreased by 475 kWh during the study period. It showed a significant improvement from 2000 to2002, which coincides with the 2001 amendmentto the MEPS. From 2003 to 2005, the averageannual UEC remained relatively stable, and in2006, it increased slightly. We can conclude thatsome of the energy efficiency gains by refrigeratorsare being offset by the use of larger units, whichconsume more energy than smaller units.
For analysis of the distribution of refrigerators by average annual UEC by type, see Table D.1 in Appendix D, “Detailed Tables.” Because thevolume of the refrigerator is so important in suchanalysis, we recommend further examination ofthe distribution of refrigerators by average annualUEC per cubic foot by volume (Table D.9 inAppendix D, “Detailed Tables”).
Figure 1.10 Average Annual Unit Energy Consumption of Refrigerators by Model Year*
*For more information, see Table D.1 in Appendix D,“Detailed Tables.”
0
200
400
600
800
1000
1200
200620042002200019981996199419921990
Model Year
kWh
/yr

Figure 1.12 Average Annual Unit EnergyConsumption per Cubic Foot of Refrigeratorsby Volume*
*For more information, see Table D.9 in Appendix D,“Detailed Tables.”
Volume (cu. ft.)
1990 2006
kWh
/cu.
ft.
per
yea
r
≥20.
5
18.5
–20.
4
16.5
–18.
4
14.5
–16.
4
12.5
–14.
4
10.5
–12.
4<1
0.5
0
20
40
60
80
100
120
The trend in the average annual UEC of refrigerators,on a per-cubic-foot basis, is consistent with theabove findings. Figure 1.12 illustrates that largermodels consumed less energy per cubic foot thansmaller models.
24 / Energy Consumption of Major Household Appliances Shipped in Canada
Chapter 1 / Refrigerators
1.3.2 Average Annual Unit EnergyConsumption by Volume
The energy performance of refrigerators improvedremarkably between 1990 and 2006. As illustratedin Figure 1.11, the larger the volume, the greaterthe decrease in average annual UEC. In 1990,refrigerators larger than 16.5 cu. ft. consumed onaverage more than 1000 kWh of electricity per year.By 2006, refrigerators that size consumed less thanhalf as much energy. The gap between the averageannual UEC of the largest and smallest unitsnarrowed between 1990 and 2006. At the beginningof this period, the difference between the averageannual UEC of the large and small units was545 kWh. By 2006, with manufacturers improvingthe energy efficiency of larger models, the differencehad decreased to approximately 200 kWh. Thistrend illustrates that there is less of a deterrent forpurchasing larger units.
Figure 1.11 Average Annual Unit EnergyConsumption of Refrigerators by Volume*
*For more information, see Table D.8 in Appendix D,“Detailed Tables.”
Volume (cu. ft.)
1990 2006
kWh
/yr
0
200
400
600
800
1000
1200
≥20.
5
18.5
–20.
4
16.5
–18.
4
14.5
–16.
4
12.5
–14.
4
10.5
–12.
4<1
0.5

Trends for 1990–2006 / 25
Chapter 1 / Refrigerators
1.3.3 Average Annual Unit EnergyConsumption by Channel, by Region/Province
Figure 1.13 illustrates the breakdown of the averageannual UEC of refrigerators by shipments for thebuilder trade and for retail purposes by region/province from 2004 to 2006. In most regions, theaverage annual UEC increased slightly in 2006 forbuilder and retail shipments, probably due to the
fact that consumers were purchasing larger, moreenergy-consuming models.
Note also that, in British Columbia and theTerritories, the average annual UEC for retailshipments increased significantly between 2004and 2006. This is probably due to the fact thatretail shipments of models over 16.5 cu. ft. in that region increased from 65.5 percent in 2005 to 83.2 percent in 2006.
Figure 1.13 Average Annual Unit Energy Consumption of Refrigerators by Channel, by Region/Province, 2004−2006*
*For more information, see Table D.10 in Appendix D, “Detailed Tables.”
Region/Province
Builder Retail
kWh
/yr
BritishColumbia
andTerritories
PrairiesOntarioQuebecAtlanticCanada2004 2005 2006 2004 2005 2006 2004 2005 2006 2004 2005 2006 2004 2005 2006 2004 2005 2006
400
420
440
460
480
500

26 / Energy Consumption of Major Household Appliances Shipped in Canada
Chapter 1 / Refrigerators
Figure 1.14 Distribution of Refrigerators Consuming Less Than 30 kWh/cu. ft. per Year, by Region/Province, 2004−2006*
*For more information, see Table D.11 in Appendix D, “Detailed Tables.”
Region/Province
Builder Retail
Ship
men
ts (
%)
BritishColumbia
andTerritories
PrairiesOntarioQuebecAtlanticCanada2004 2005 2006 2004 2005 2006 2004 2005 2006 2004 2005 2006 2004 2005 2006 2004 2005 2006
0
20
40
60
80
100
Figure 1.14 illustrates national trends in shipmentsof refrigerators from 2004 to 2006. For refrigeratorsconsuming less than 30 kWh/cu. ft. per year,builder shipments decreased and retail shipmentsincreased slightly. Minor fluctuations of these
proportions occurred throughout the regions/provinces, except that builder shipments in theAtlantic provinces and Quebec were somewhatmore energy intensive than the national averagefrom 2004 to 2006.

Figure 1.15 Annual Energy Savings for Refrigerators, 1992–2006*
*For more information, see Table D.12 in Appendix D,“Detailed Tables.”
Trends for 1990–2006 / 27
Chapter 1 / Refrigerators
The average annual energy savings for refrigeratorswere estimated to be 0.9 petajoules (PJ) between1993 and 2006. (No savings were expected in 1992.)This indicates that, on average, refrigeratorsconsumed 0.9 PJ less per year than they wouldhave without the factors described above.
Cumulative energy savings for refrigerators areshown in Figure 1.16 and in Table D.12 inAppendix D, “Detailed Tables.” In 2006, refrigeratorsconsumed approximately 1.45 PJ less than theywould have otherwise. They reached a total savingsof 12.48 PJ in 2006 (the equivalent of one year’senergy for approximately 118 000 households),taking into account the life expectancy factor ofrefrigerators. (This calculation is explained furtherin Appendix A, “Methodology.”)
0
1
2
3
4
20062004200220001998199619941992
Model Year
Peta
joul
es
Energy Consumed WITHOUTManufacturers’ Improvements, the MEPSand Improvements to the MEPS (PJ)
Energy Consumed WITHManufacturers’ Improvements, the MEPSand Improvements to the MEPS (PJ)
1.45 PJ
Figure 1.16 Cumulative Energy Savings for Refrigerators, 1992–2006*
*For more information, see Table D.12 in Appendix D,“Detailed Tables.”
Model Year
Peta
joul
es
0
2
4
6
8
10
12
14
2006
2005
2004
2003
2002
2001
2000
1999
1998
1997
1996
1995
1994
1993
1992
0.00 0.320.82
1.331.86
2.393.01
3.744.47
5.47
6.74
8.09
9.58
11.13
12.48
1.4 Energy SavingsFigure 1.15 shows how much energy refrigeratorsmight have consumed annually between 1992 and 2006 without the decrease in average annualUEC (top line) and how much energy refrigeratorsactually consumed during those years (bottom line).
The divergence of the two lines in Figure 1.15represents incremental annual energy savings. Eventhough the MEPS did not come into effect until1995, the calculation of energy savings is based on data from 1992 onward. This is because energyefficiency began to improve almost immediatelyafter the Energy Efficiency Act (the Act) came intoforce in 1992.

1.5 Refrigerators SummaryType 3 refrigerators (refrigerator-freezers with a top-mounted freezer and automatic defrost) remainedthe most popular type in Canada (64.5 percent ofthe market in 2006). However, their market sharehad declined since 1990, when they represented84.9 percent of the market. Refrigerators with abottom-mounted freezer (Types 5 and 5A) continuedto rise in popularity in 2006, and refrigerators witha side-mounted freezer and through-the-door iceservice (Type 7) remained popular.
Of the refrigerators shipped in 2006, 37.3 percentwere ENERGY STAR qualified, as outlined in TableD.A.1 in Appendix D, “Detailed Tables.” In 2004,more stringent specifications for refrigerators toqualify for the ENERGY STAR registered mark wereintroduced.
In 2006, the most popular size category ofrefrigerators was 16.5 to 18.4 cu. ft., although thereremained a continued trend for larger ones (thosemore than 18.5 cu. ft.). The average annual UEC ofrefrigerators increased slightly in 2006, due to thistrend. However, refrigerators were becoming moreefficient. From 2000 to 2006, the market share ofrefrigerators requiring less than 30 kWh per cu. ft.increased from 12.2 percent to 88.6 percent.
In 2006, 20.4 percent of all refrigerators werecategorized as builder shipments, whereas79.6 percent of them were tagged as retailshipments. British Columbia and the Territoriescontinued to have a substantially larger share ofbuilder shipments than the rest of the country,whereas Quebec continued to have a somewhatsmaller builder share.
The average annual energy savings for refrigeratorswere estimated to be 0.9 PJ between 1992 and2006, with total energy savings for that periodreaching 12.48 PJ (3.47 billion kWh). Dollar savingsfor refrigerators for the study period were estimatedto be $326 million (calculated at 9.4 cents/kWh).
28 / Energy Consumption of Major Household Appliances Shipped in Canada
Chapter 1 / Refrigerators

Trends for 1990–2006 / 29
Chapter 2 / Freezers
25 Those with total refrigerated volumes of less than 7.75 cubic feet and overall heights of less than 36 inches.
Freezers are available in various sizes and styles, all of which affect energy consumption. This iswhy EnerGuide groups freezers according to type,enabling you to compare the energy consumptionof similar models. As previously noted, because ofrestrictions in the market information available,the freezer shipment data are not as comprehensiveas for the other appliances and should be used with caution.
Upright freezers
Type 8 Upright freezers with manual defrost
Type 9 Upright freezers with automatic defrost
Chest freezers
Type 10 Chest freezers and all other freezers not defined as Type 8 or Type 9
Compact freezers25
Type 16 Compact upright freezers with manualdefrost
Type 17 Compact upright freezers withautomatic defrost
Type 18 Compact chest freezers and all othercompact freezers
2.1 2006 Market SnapshotType 10 (chest) freezers were again the mostpopular type in 2006, accounting for 45.6 percentof all freezers shipped in Canada. Their shipment-weighted average annual unit energy consumption(UEC) was 336 kilowatt hours (kWh), as outlined in Table D.16 in Appendix D, “Detailed Tables.”
Freezers were included in the ENERGY STAR®
Initiative in 2003. More detailed data on qualifiedfreezers will be included in future analyses, as theybecome available.
The energy efficiency of freezers improvedbetween 1990 and 2006. In 1990, almost allfreezers required more than 50 kWh per yearto freeze each cubic foot of space. By 2006, no freezers required more than 50 kWh peryear to freeze each cubic foot of space and 75.2 percent required less than 40 kWhper year.

30 / Energy Consumption of Major Household Appliances Shipped in Canada
26 Natural Resources Canada, EnerGuide Appliance Directory 2006 (Ottawa: March 2006), p. 121.
2.2 Distribution of Shipments
2.2.1 Distribution by Type
Type 10 freezers dominated the freezer market inCanada throughout the study period. However, asillustrated in Table 2.1 and Figure 2.1, the marketshare of chest freezers (Types 10 and 18) declinedfrom 83.2 percent to 62.8 percent during thoseyears. Conversely, upright freezers (Types 8 and 9)
gained a 20.4 percentage point increase in marketshare between 1990 and 2006. They accounted for 37.2 percent of the market in 2006. (For moreinformation, see Table D.16 in Appendix D,“Detailed Tables”.) Unfortunately, Types 8 and 9freezers are less energy efficient than Type 10freezers. That is because lifting the door on a chestunit releases less cold air than opening the door to an upright freezer, where the cold air flows downand out.26
Chapter 2 / Freezers
Table 2.1 Distribution of Freezers by Type
Model Year Freezer Type
Type 8 Type 9 Type 10 Type 16 Type 18(%) (%) (%) (%) (%)
1990 16.8 0.0 64.9 0.0 18.3
1991 11.8 0.4 81.2 0.0 6.7
1992 12.9 0.3 79.2 0.0 7.6
1993 14.4 0.6 70.3 0.0 14.8
1994 12.9 0.6 71.3 0.0 15.1
1995 16.0 0.7 66.5 0.0 16.7
1996 17.1 1.1 64.0 0.1 17.7
1997 19.1 1.0 60.2 0.3 19.4
1998 21.2 1.8 57.5 0.0 19.5
1999 21.6 2.5 60.3 0.1 15.5
2000 23.9 3.1 56.2 1.2 15.5
2001 19.5 6.7 58.3 1.8 13.8
2002 24.9 9.8 48.9 0.0 16.4
2003 27.8 9.2 47.4 0.0 15.6
2004 29.4 8.3 45.5 0.0 16.8
2005 30.4 10.7 35.7 0.0 23.2
2006 28.5 8.7 45.6 0.0 17.2
TotalChange 11.7 8.7 19.3 0.0 1.1

Trends for 1990–2006 / 31
Figure 2.2 illustrates the average annual UEC of the various freezer types during the study period.Types 10 and 18 freezers remained the most energy-efficient ones on the market, followed by Types 8and 9.
Chapter 2 / Freezers
1990
Type 1064.9%
Type 160.0%
Type 1818.3%
Type 816.8%
Type 90.0%
2006
Type 1045.6%
Type 160.0%
Type 1817.2%
Type 828.5%
Type 98.7%
Figure 2.2 Average Annual Unit EnergyConsumption of Freezers by Type, by Model Year*
*For more information, see Table D.16 in Appendix D,“Detailed Tables.”
Model Year
kWh
/yr
Type 9 Type 10 Type 18
200
400
600
800
1000
1200
200620042002200019981996199419921990
Type 8
Figure 2.1 Distribution of Freezers by Type, 1990 and 2006

32 / Energy Consumption of Major Household Appliances Shipped in Canada
2.2.2 Distribution by Type, by Region/Province
Figure 2.3 compares the shipment trends for variousfreezer types from 2004 to 2006. For example, Type 8freezers continue to be more popular in Quebec
Chapter 2 / Freezers
Figure 2.3 Distribution of Freezers by Type, by Region/Province, 2004−2006*
*For more information, see Table D.13 in Appendix D, “Detailed Tables.”
Region/Province
Type 8 Type 9 Type 10 Type 18
Ship
men
ts (
%)
BritishColumbia
andTerritories
PrairiesOntarioQuebecAtlanticCanada
0
20
40
60
80
100
200620052004200620052004200620052004200620052004200620052004200620052004
than the national average. Note, however, that thefreezer shipment data are not as comprehensive as data for the other appliances. In particular, the regional/provincial breakdown of shipments is not as detailed as the national level of data and,therefore, should be used with caution.

Trends for 1990–2006 / 33
Chapter 2 / Freezers
2.2.3 Distribution by Average AnnualUnit Energy Consumption per Cubic Foot
Table 2.2 and Figure 2.4 illustrate that in 1990,almost all freezers required more than 50 kWhper year to freeze each cubic foot of space.
Table 2.2 Distribution of Freezers by Average Annual Unit Energy Consumption per Cubic Foot
Model Year kWh/cu. ft. per year
20–29.9 30–39.9 40–49.9 50–59.9 60–69.9 70–79.9 ≥80(%) (%) (%) (%) (%) (%) (%)
1990 0.0 0.0 0.9 32.1 19.3 38.3 9.4
1991 0.0 28.3 20.3 31.2 4.1 15.9 0.3
1992 3.1 18.9 58.3 15.0 4.5 0.3 0.0
1993 16.5 57.0 16.5 8.4 1.6 0.0 0.0
1994 15.4 39.0 34.9 9.0 1.9 0.0 0.0
1995 12.7 39.6 41.2 5.4 1.2 0.0 0.0
1996 12.4 40.4 37.0 10.3 0.0 0.0 0.0
1997 11.7 36.7 39.0 12.0 0.0 0.6 0.0
1998 11.0 34.6 43.1 11.3 0.0 0.0 0.0
1999 10.8 42.3 37.0 9.6 0.0 0.3 0.0
2000 10.0 37.6 41.3 8.8 0.0 2.3 0.0
2001 17.5 36.3 38.2 3.9 0.0 4.0 0.0
2002 26.7 47.5 24.9 0.8 0.0 0.0 0.0
2003 28.6 47.4 23.2 0.8 0.0 0.0 0.0
2004 28.9 48.8 22.3 0.1 0.0 0.0 0.0
2005 29.5 45.2 25.3 0.0 0.0 0.0 0.0
2006 34.8 40.4 24.7 0.0 0.0 0.0 0.0
TotalChange 34.8 40.4 23.8 32.1 19.3 38.3 9.4
By 2002 (shortly after the 2001 amendment to the MEPS), almost all freezers consumed less than50 kWh per year, and in 2006, 75.2 percent of all freezers required less than 40 kWh per year tofreeze each cubic foot of space.

34 / Energy Consumption of Major Household Appliances Shipped in Canada
Chapter 2 / Freezers
Figure 2.4 Distribution of Freezers by Average Annual Unit Energy Consumption per Cubic Foot,1990 and 2006
1990 (kWh/cu. ft. per year)
30–39.90.0% 40–49.9
0.9%
70–79.938.3%
20–29.90.0%
60–69.919.3%
50–59.932.1%
2006 (kWh/cu. ft. per year)
>809.4%
30–39.940.4%
40–49.924.7%
70–79.90.0%
20–29.934.8%
60–69.90.0%50–59.9
0.0% >809.4%
At the beginning of the study period, freezers with an average annual UEC between 70.0 and79.9 kWh/cubic foot (cu. ft.) per year dominatedthe market, accounting for 38.3 percent of themarket. By comparison, 40.4 percent of freezers in2006 consumed between 30 and 39.9 kWh/cu. ft.per year and another 34.8 percent consumedbetween 20 and 29.9 kWh/cu. ft. per year.

Trends for 1990–2006 / 35
2.2.4 Distribution by Average AnnualUnit Energy Consumption per Cubic Foot,by Region/Province
Figure 2.5 illustrates a national improvement inenergy efficiency in freezers from 2004 to 2006,
with a 5.9 percentage point increase in thoseconsuming between 20 and 29.9 kWh per cu. ft.This improvement is evidenced in most regions,except the Atlantic provinces.
Chapter 2 / Freezers
Figure 2.5 Distribution of Freezers by Average Annual Unit Energy Consumption per Cubic Foot,by Region/Province, 2004−2006*
*For more information, see Table D.14 in Appendix D, “Detailed Tables.”
Region/Province
20–29.9 kWh/cu. ft. per year 30–39.9 kWh/cu. ft. per year ≥40 kWh/cu. ft. per year
Ship
men
ts (
%)
BritishColumbia
andTerritories
PrairiesOntarioQuebecAtlanticCanada
0
20
40
60
80
100
200620052004200620052004200620052004200620052004200620052004200620052004

36 / Energy Consumption of Major Household Appliances Shipped in Canada
2.2.5 Distribution by Channel, by Region/Province
Figure 2.6 illustrates the proportion of freezersshipped for the building trade versus those shipped
for retail sales from 2004 to 2006. There were nomajor differences in this proportion in 2006 and,once again, builder shipments were higher thanaverage in the western provinces.
Chapter 2 / Freezers
Figure 2.6 Distribution of Freezers by Channel, by Region/Province, 2004−2006*
*For more information, see Table D.15 in Appendix D, “Detailed Tables.”
Region/Province
Builder Retail
Ship
men
ts (
%)
BritishColumbia
andTerritories
PrairiesOntarioQuebecAtlanticCanada
0
20
40
60
80
100
200620052004200620052004200620052004200620052004200620052004200620052004

Figure 2.7 Average Annual Unit EnergyConsumption of Freezers by Model Year*
*For more information, see Table D.16 in Appendix D,“Detailed Tables.”
Trends for 1990–2006 / 37
27 For more information about the 2001 amendment to the MEPS for freezers, visit the following Web site:oee.nrcan.gc.ca/regulations/refrigerators.cfm.
2.3 Energy Consumption
2.3.1 Average Annual Unit EnergyConsumption by Model Year
Freezers became more energy efficient between1990 and 2006. As Figure 2.7 shows, the averageannual UEC decreased significantly in 1991 andthen decreased gradually until 1997. After 1997,the average annual UEC fluctuated only slightly.
2.4 Energy SavingsIt is estimated that annual freezer energyconsumption was slightly lower between 1993 and 2006 than it would have been without theminimum energy performance standards (MEPS),the 2001 amendment to the MEPS and the generalimprovements in energy efficiency.27
As with Figure 1.15 in Chapter 1, “Refrigerators,”the difference between the two lines in Figure 2.8represents the incremental annual energy savings.
Chapter 2 / Freezers
0
100
200
300
400
500
600
700
800
200620042002200019981996199419921990
Model Year
kWh
/yr
Figure 2.8 Annual Energy Savings forFreezers, 1992–2006*
*For more information, see Table D.17 in Appendix D,“Detailed Tables.”
0.0
0.1
0.2
0.3
0.4
0.5
20062004200220001998199619941992
Model Year
Peta
joul
es
Energy Consumed WITHOUTManufacturers’ Improvements, the MEPSand Improvements to the MEPS (PJ)
Energy Consumed WITHManufacturers’ Improvements, the MEPSand Improvements to the MEPS (PJ)
0.06 PJ

38 / Energy Consumption of Major Household Appliances Shipped in Canada
The average annual energy savings for freezers wereestimated to be 0.06 petajoules (PJ) from 1993 to2006. (No savings were expected for 1992.)
Cumulative energy savings grew steadily between1992 and 2006 to reach 0.80 PJ in 2006 (theequivalent of one year’s energy for approximately7600 households), taking into account the lifeexpectancy factor of freezers. (This calculation isexplained in Appendix A, “Methodology.”) Theseenergy savings are shown in Figure 2.9.
2.5 Freezers SummaryType 10 (chest freezers) continued to be the mostpopular type in 2006 (45.6 percent of the market).However, Types 8 and 9 (upright freezers withmanual and automatic defrost) grew in popularity,accounting for 37.2 percent of the market (up from16.8 percent in 1990).
The energy efficiency of freezers improved between1990 and 2006. By 2006, all freezers required lessthan 50 kWh per year to freeze each cubic foot of space, whereas in 1990, almost all freezers (99.1 percent) required more than 50 kWh per year. The average annual energy savings for freezers wereestimated to be 0.06 PJ between 1993 and 2006,with total energy savings for that period reaching0.80 PJ (222.22 million kWh). Dollar savings forfreezers for the study period were estimated to be$21 million (calculated at 9.4 cents/kWh).
Chapter 2 / Freezers
Figure 2.9 Cumulative Energy Savings forFreezers, 1992–2006*
*For more information, see Table D.17 in Appendix D,“Detailed Tables.”
Model Year
Peta
joul
es
2006
2005
2004
2003
2002
2001
2000
1999
1998
1997
1996
1995
1994
1993
1992
0.000.04
0.090.14
0.180.23
0.29
0.35
0.40
0.45
0.53
0.60
0.68
0.74
0.80
0.0
0.2
0.4
0.6
0.8
1.0

Trends for 1990–2006 / 39
Chapter 3 / Dishwashers
28 Natural Resources Canada, EnerGuide Appliance Directory 2006 (Ottawa: March 2006), p. 173.
3.1 2006 Market SnapshotThe shipment-weighted average annual unit energyconsumption (UEC) of dishwashers in 2006 was373 kilowatt hours (kWh). Nearly 80 percent of the standard models on the market that year – that is, those with an exterior width of more than56 centimetres – qualified as ENERGY STAR® products,exceeding the minimum energy performancestandards (MEPS) by at least 25 percent. A revisionto increase the stringency of the ENERGY STARspecification for dishwashers came into effect in January 2007. Shipments of ENERGY STARdishwashers decreased slightly in 2006, whichcould be a result of manufacturers preparingthemselves for these upcoming, more stringentspecifications.
3.2 Distribution of Shipments
3.2.1 Distribution by Average AnnualUnit Energy Consumption
Table 3.1 and Figure 3.1 illustrate that in 1990,dishwashers consuming more than 700 kWhannually represented 99.8 percent of the market.The majority (68.7 percent) of these dishwashersconsumed at least 1000 kWh.
By 1999, these inefficient models were no longer produced and by 2006, 90.3 percent of all dishwashers consumed less than 400 kWh.Improvement in efficiency from 2003 to 2006 is probably attributable to the 2004 amendment to the MEPS.
Dishwashers are now rated to a new energy-consumption standard, reducing the annual energy consumption for all models. However, this decrease may not accurately reflect animprovement in the energy efficiency of thosemodels. Instead, this standard reduces the amountof energy these appliances might consume eachyear. Dishwashers are also subject to new energy-consumption testing procedures, also introduced in 2004. Previously, these appliances were ratedaccording to an average of 264 loads per year.However, new data indicate that Canadians havereduced dishwasher use, so the test average is now215 loads per year. The new ratings take intoaccount standby power consumption (the energyused while the appliance is idle) and continue to include the energy required to heat the water.Soil-sensing dishwashers are also subject to a newtest procedure that reflects the average energy usedwhen they are tested under light, medium andheavy soil loads.28
Between 1990 and 2006, the energyperformance of dishwashers improvedremarkably. The average annual UECdecreased by approximately 64 percent, or 653 kWh, during the period.

40 / Energy Consumption of Major Household Appliances Shipped in Canada
Chapter 3 / Dishwashers
Table 3.1 Distribution of Dishwashers by Average Annual Unit Energy Consumption
Model Year kWh/yr
<300 300–349.9 350–399.9 400–499.9 500–599.9 600–699.9 ≥700(%) (%) (%) (%) (%) (%) (%)
1990 0.0 0.0 0.0 0.0 0.0 0.2 99.8
1991 0.0 0.0 0.0 0.0 0.0 5.8 94.2
1992 0.0 0.0 0.0 0.0 0.0 8.5 91.5
1993 0.0 0.0 0.0 0.0 0.4 7.7 91.9
1994 0.0 0.0 0.0 0.5 0.5 32.9 66.1
1995 0.0 0.0 0.2 0.9 0.9 63.7 34.2
1996 0.0 0.0 0.2 0.9 3.9 63.0 32.0
1997 0.0 0.0 0.4 1.1 20.5 56.9 21.2
1998 0.0 0.0 0.2 1.2 23.4 71.6 3.7
1999 0.0 0.0 0.2 1.4 24.9 73.6 0.0
2000 0.0 0.0 0.1 3.9 19.3 76.7 0.0
2001 0.0 0.0 0.0 5.5 23.9 70.6 0.0
2002 0.0 0.0 3.2 13.6 37.8 45.5 0.0
2003 0.0 0.0 9.1 33.6 36.5 20.7 0.0
2004 0.0 4.0 24.3 46.4 16.5 8.8 0.0
2005 0.0 19.6 55.5 15.5 6.4 3.0 0.0
2006 0.3 28.2 61.8 5.7 2.7 1.3 0.0
TotalChange 0.3 28.2 61.8 5.7 2.7 1.1 99.8
Figure 3.1 Distribution of Dishwashers by Average Annual Unit Energy Consumption, 1990 and 2006
1990 (kWh/yr)
300–349.90.0%
350–399.90.0% 600–699.9
0.2%
<3000.0%
500–599.90.0%
400–499.90.0%
2006 (kWh/yr)
≥70099.8%
300–349.928.2%
350–399.961.8%
600–699.91.3%
<3000.3%
500–599.92.7%
400–499.95.7%
≥7000.0%

Trends for 1990–2006 / 41
3.2.2 Distribution by Average AnnualUnit Energy Consumption, by Region/Province
Figure 3.2 shows that there were significantimprovements in the average annual UEC ofdishwashers throughout the country from 2004 to 2006.
Chapter 3 / Dishwashers
Figure 3.2 Distribution of Dishwashers by Average Annual Unit Energy Consumption, by Region/Province, 2004−2006*
*For more information, see Table D.18 in Appendix D, “Detailed Tables.”
Region/Province
<300 kWh/yr 300–349.9 kWh/yr 350–399.9 kWh/yr
400–499.9 kWh/yr 500–599.9 kWh/yr 600–699.9 kWh/yr
Ship
men
ts (
%)
BritishColumbia
andTerritories
PrairiesOntarioQuebecAtlanticCanada200620052004200620052004200620052004200620052004200620052004200620052004
0
20
40
60
80
100

42 / Energy Consumption of Major Household Appliances Shipped in Canada
3.2.3 Distribution by Channel, by Region/Province
Figure 3.3 illustrates the proportion of dishwashersshipped for the building trade versus those shipped
for retail sales, between 2004 and 2006. There wereonly slight changes in the trends throughout thecountry. Builder shipments remained higher thanaverage in British Columbia and the Territories.
Chapter 3 / Dishwashers
Figure 3.3 Distribution of Dishwashers by Channel, by Region/Province, 2004−2006*
*For more information, see Table D.19 in Appendix D, “Detailed Tables.”
Region/Province
Builder Retail
Ship
men
ts (
%)
BritishColumbia
andTerritories
PrairiesOntarioQuebecAtlanticCanada
0
20
40
60
80
100
200620052004200620052004200620052004200620052004200620052004200620052004
3.3 Energy Consumption
3.3.1 Average Annual Unit EnergyConsumption by Model Year
Between 1990 and 2006, the energy performance ofdishwashers improved substantially. As Figure 3.4shows, the average annual UEC decreased byapproximately 64 percent, or 653 kWh, during theperiod. A good part of the improvement occurredbefore 1995, when the average annual UECdecreased from 1026 to 671 kWh – a decrease of355 kWh, or 35 percent.
After 1995, the decrease in the average annual UECtapered off, but in 2001, a noticeable decreasebegan to re-emerge, probably partly due to theincrease in availability of ENERGY STAR dishwashersand partly due to the announcement of theupcoming 2004 amendment to the MEPS. In 2006, the average annual UEC for dishwashers was373 kWh, a decrease of 298 kWh, or 44 percent,from the 1995 level.

Figure 3.4 Average Annual Unit EnergyConsumption of Dishwashers by Model Year*
*For more information, see Table D.20 in Appendix D,“Detailed Tables.”
Trends for 1990–2006 / 43
Chapter 3 / Dishwashers
0
200
400
600
800
1000
1200
200620042002200019981996199419921990
Model Year
kWh
/yr
3.3.2 Average Annual Unit EnergyConsumption by Channel, by Region/Province
Figure 3.5 illustrates the breakdown of the average annual UEC of dishwashers by shipmentsfor the builder trade and for retail purposes byregion/province, for 2004 to 2006. It shows thatthroughout the country, in 2006, the gap betweenthe average annual UEC for builder and retailshipments narrowed and reversed, compared with2004 figures.
Figure 3.5 Average Annual Unit Energy Consumption of Dishwashers by Channel, by Region/Province, 2004−2006
*For more information, see Table D.21 in Appendix D, “Detailed Tables.”
Region/Province
Builder Retail
kWh
/yr
BritishColumbia
andTerritories
PrairiesOntarioQuebecAtlanticCanada
0
100
200
300
400
500
200620052004200620052004200620052004200620052004200620052004200620052004

Figure 3.6 Annual Energy Savings forDishwashers, 1992–2006*
*For more information, see Table D.22 in Appendix D,“Detailed Tables.”
44 / Energy Consumption of Major Household Appliances Shipped in Canada
3.4 Energy SavingsFigure 3.6 shows how much energy dishwashersmight have consumed annually between 1992 and2006 without the factors previously outlined (topline) and how much energy actually was consumedby refrigerators during those years (bottom line).
The average annual energy savings for dishwasherswere estimated to be 0.53 petajoules (PJ) from 1993to 2006. (No energy savings were expected for 1992.)The largest annual energy savings occurred in2006, when dishwashers consumed 1.20 PJ lessthan they might have otherwise. The substantialincrease in energy savings beginning in 2003 isprobably attributable to the upcoming 2004amendment to the MEPS. Dishwashers are nowrated to a new energy-consumption standard,reducing the annual energy consumption for all models.
The cumulative energy savings for dishwashers areshown in Figure 3.7. Cumulative energy savings for the study period reached 7.09 PJ in 2006 (theequivalent of one year’s energy for approximately67 000 households), taking into account the lifeexpectancy factor of dishwashers (this calculation isexplained further in Appendix A, “Methodology”).
Chapter 3 / Dishwashers
0.0
0.5
1.0
1.5
2.0
2.5
20062004200220001998199619941992
Model Year
Peta
joul
es
Energy Consumed WITHOUTManufacturers’ Improvements and the MEPS
Energy Consumed WITHManufacturers’ Improvements and the MEPS
1.20 PJ
Figure 3.7 Cumulative Energy Savings forDishwashers, 1992–2006*
*For more information, see Table D.22 in Appendix D,“Detailed Tables.”
Model Year
Peta
joul
es
2006
2005
2004
2003
2002
2001
2000
1999
1998
1997
1996
1995
1994
1993
1992
0.00 -0.01 0.150.42
0.72 1.061.41
1.842.27
2.713.31
4.05
4.96
6.03
7.09
-1
0
1
2
3
4
5
6
7
8

Trends for 1990–2006 / 45
3.5 Dishwashers SummaryThe energy efficiency of dishwashers improvedsignificantly between 1990 and 2006. In 1990,almost all dishwashers (99.8 percent) consumedmore than 700 kWh per year; whereas by 1999, alldishwashers consumed less than 700 kWh per yearand in 2006, 90.3 percent of them consumed lessthan 400 kWh.
This improvement is probably attributable to the2004 amendment to the MEPS. Dishwashers arenow rated to a new energy-consumption standard,reducing the annual energy consumption for all models.
Dishwashers are also subject to new energy-consumption testing procedures, also introduced in 2004. Previously, these appliances were ratedaccording to an average of 264 loads per year.However, new data indicate that Canadians havereduced dishwasher use, so the test average is now215 loads per year. The new ratings take intoaccount standby power consumption (the energyused while the appliance is idle) and continue toinclude the energy required to heat the water.
Of the dishwashers available in 2006, 79.7 percentwere ENERGY STAR qualified. A revision to increasethe stringency of the ENERGY STAR specificationfor dishwashers was introduced in January 2007 toaddress the high percentage of shipments meetingthe standard.
Approximately 15.5 percent of all dishwashers weretagged for builder shipments, whereas 84.5 percentwere shipped for retail sales. British Columbia andthe Territories had a substantially larger share ofbuilder shipments (33.9 percent) than the rest ofthe country, whereas Quebec had a substantiallylower share (3.3 percent).
The average annual energy savings for dishwasherswere estimated to be 0.53 PJ between 1993 and2006, with total energy savings for that periodreaching 7.09 PJ (1.97 billion kWh). Dollar savingsfor dishwashers for the study period were estimatedto be $185 million (calculated at 9.4 cents/kWh).
Chapter 3 / Dishwashers

46 / Energy Consumption of Major Household Appliances Shipped in Canada
Chapter 4 / Electric Ranges
29 Natural Resources Canada, EnerGuide Appliance Directory 2006 (Ottawa: March 2006), p. 139.
4.1 2006 Market SnapshotIn 2006, 59.9 percent of the electric ranges shippedin Canada were self-cleaning units. The shipment-weighted average annual unit energy consumption(UEC) for self-cleaning ranges was 523 kilowatthours (kWh), compared with 559 kWh for non-self-cleaning electric ranges.
Even though the energy consumption rating takes into account the energy used during the self-cleaning cycles (based originally on 11 cleaningsper year but recently reduced to 4), these ranges use less energy than the non-self-cleaning electricranges. That is because self-cleaning ovens areusually better insulated than standard ovens. As a result, every time you cook, you lose less heat,use less energy, save money and help protect theenvironment.29
Electric ranges typically made up 91 percent of themarket; gas ranges constituted the remainder.
In 1990, the electric ranges that dominatedthe market (73.2 percent) consumed between750 and 850 kWh per year. In 2006, the marketshare of electric ranges in this category fell to8.1 percent.

Trends for 1990–2006 / 47
Chapter 4 / Electric Ranges
Table 4.1 Distribution of Electric Ranges by Type
Model Year Electric Range Type
Non-Self-Cleaning Self-Cleaning(%) (%)
1990 77.1 22.9
1991 71.3 28.7
1992 71.6 28.4
1993 70.1 29.9
1994 69.4 30.6
1995 68.3 31.7
1996 66.6 33.4
1997 64.1 35.9
1998 59.2 40.8
1999 59.4 40.6
2000 55.6 44.4
2001 47.8 52.2
2002 42.7 57.3
2003 44.9 55.1
2004 42.3 57.7
2005 41.2 58.8
2006 40.1 59.9
TotalChange 37.0 37.0
Figure 4.1 Distribution of Electric Ranges by Type, 1990 and 2006
1990
Non-Self-Cleaning77.1%
Self-Cleaning22.9%
2006
Non-Self-Cleaning40.1%
Self-Cleaning59.9%
4.2 Distribution of Shipments
4.2.1 Distribution by Type
As illustrated in Table 4.1 and Figure 4.1, in 1990,self-cleaning electric ranges accounted for less than one quarter (22.9 percent) of all electricranges available on the market. By 2006, self-cleaning ranges had increased in popularity, withmarket share increasing to 59.9 percent. Thisrepresents a 37 percentage point increase since1990, or an annual growth rate of 2.3 percent.
In contrast, the market share of electric ranges thatwere not self-cleaning decreased by 37 percentagepoints, dropping from 77.1 percent in 1990 to 40.1 percent in 2006.
As noted above, self-cleaning ovens are usuallybetter insulated than non-self-cleaning ones,resulting in less heat loss and less energyconsumption.

4.2.3 Distribution by Average AnnualUnit Energy Consumption
Table 4.2 and Figure 4.3 illustrate that in 1990, the electric ranges that dominated the market (73.2 percent) consumed between 750 and850 kWh per year. In 2006, the market share of
48 / Energy Consumption of Major Household Appliances Shipped in Canada
30 Natural Resources Canada, EnerGuide Appliance Directory, 2006 (Ottawa: March 2006), p. 139.
4.2.2 Distribution by Type, by Region/Province
The market share of self-cleaning ranges increasedsubstantially during the study period, with anational average of 59.9 percent in 2006. Figure 4.2illustrates the proportion of self-cleaning versus
non-self-cleaning ranges throughout the countryfrom 2004 to 2006. It shows a slight increase inself-cleaning ranges between 2004 and 2006throughout the regions, with the exception ofOntario, where shipments of self-cleaning rangesdecreased slightly.
Chapter 4 / Electric Ranges
Figure 4.2 Distribution of Electric Ranges by Type, by Region/Province, 2004−2006*
*For more information, see Table D.23 in Appendix D, “Detailed Tables.”
Region/Province
Self-Cleaning Non-Self-Cleaning
Ship
men
ts (
%)
BritishColumbia
andTerritories
PrairiesOntarioQuebecAtlanticCanada
0
20
40
60
80
100
200620052004200620052004200620052004200620052004200620052004200620052004
electric ranges in this category fell to 8.1 percent.By 2003, there was a considerable increase in themarket share of electric ranges that consumed less than 600 kWh, reaching 84.5 percent in 2006.This is due to an energy-consumption standardintroduced in October 2003.30

Trends for 1990–2006 / 49
Chapter 4 / Electric Ranges
Figure 4.3 Distribution of Electric Ranges by Average Annual Unit Energy Consumption, 1990 and 2006
1990 (kWh/yr)
500–5990.0%
600–6490.0%
750–79930.8%
800–84942.4%
<5003.8%
700–74913.8%
650–6990.5%
2006 (kWh/yr)
≥8508.7%
500–59936.6%
600–6493.3%
750–7996.9%
800–8491.2%
<50047.9%700–749
1.9%650–699
2.2%
≥8500.0%
Table 4.2 Distribution of Electric Ranges by Average Annual Unit Energy Consumption
Model Year kWh/yr
<500 500–599.9 600–649.9 650–699.9 700–749.9 750–799.9 800–849.9 ≥850(%) (%) (%) (%) (%) (%) (%) (%)
1990 3.8 0.0 0.0 0.5 13.8 30.8 42.4 8.7
1991 0.0 0.0 0.0 0.8 15.9 27.6 54.0 1.8
1992 0.0 0.0 0.0 0.0 15.0 58.1 26.5 0.3
1993 0.0 0.0 0.0 0.1 18.4 42.8 38.5 0.2
1994 0.0 0.0 0.1 1.7 32.2 28.5 37.4 0.1
1995 0.0 0.0 0.1 3.3 35.0 22.5 39.2 0.0
1996 0.0 0.0 0.0 3.2 27.6 26.4 42.8 0.0
1997 0.0 0.0 0.0 3.6 27.6 29.0 39.8 0.0
1998 0.0 0.0 0.0 8.6 23.3 30.6 37.4 0.0
1999 0.0 0.0 0.0 15.3 28.2 31.6 24.9 0.0
2000 0.0 0.0 0.0 14.3 30.9 29.5 25.3 0.0
2001 0.0 0.0 0.0 15.0 27.3 29.2 28.5 0.0
2002 0.0 0.0 0.0 15.9 30.4 33.5 20.2 0.0
2003 12.5 5.4 0.4 7.9 30.0 27.3 16.5 0.0
2004 27.8 13.3 4.8 3.8 18.8 19.5 12.0 0.0
2005 44.9 26.2 4.6 2.6 8.1 7.8 5.9 0.0
2006 47.9 36.6 3.3 2.2 1.9 6.9 1.2 0.0
TotalChange 44.1 36.6 3.3 1.7 11.9 23.9 41.2 8.7

50 / Energy Consumption of Major Household Appliances Shipped in Canada
Testing to the new standard provided a new methodfor calculating energy consumption and resulted in a lower EnerGuide rating in kilowatt hours peryear. Several important changes were made to thecalculation for the rating, including the number oftimes the self-cleaning cycle is used. The frequencywas lowered from 11 times per year to 4 becauseconsumers were not using this feature as much asthey did in the past. Because of these changes intesting procedures, data prior to 2003 are notdirectly comparable.
Even with the new testing procedures in place, there have been significant improvements in theenergy efficiency of electric ranges. For example, in2003, only 12.5 percent of electric ranges shippedconsumed less than 500 kWh/yr, whereas onlythree years later, this figure increased to 47.9 percent.Conversely, in 2003, nearly three-quarters(73.8 percent) of electric ranges consumed morethan 700 kWh/yr. In 2006, this percentage droppedto only 10 percent.
4.2.4 Distribution by Average AnnualUnit Energy Consumption, byRegion/Province
In 2006, 84.5 percent of all electric ranges shippedin Canada consumed less than 600 kWh per year,compared with 41.1 percent in 2004. Figure 4.4shows that this was the trend throughout theregions. As mentioned previously, a new testingmethod and energy-consumption standard wereintroduced in October 2003. Many more of theelectric ranges shipped in 2005 and 2006 weremodels newly listed in the EnerGuide appliancedirectories. Therefore, the proportion of modelsrated using this new testing standard wasconsiderably higher than in 2004.
Chapter 4 / Electric Ranges
Figure 4.4 Distribution of Electric Ranges by Average Annual Unit Energy Consumption, by Region/Province, 2004−2006*
*For more information, see Table D.24 in Appendix D, “Detailed Tables.”
Region/Province
<500 kWh/yr 500–549.9 kWh/yr 550–599.9 kWh/yr
650–699.9 kWh/yr 700–749.9 kWh/yr 750–799.9 kWh/yr
600–649.9 kWh/yr
800–849.9 kWh/yr
Ship
men
ts (
%)
BritishColumbia
andTerritories
PrairiesOntarioQuebecAtlanticCanada
0
20
40
60
80
100
200620052004200620052004200620052004200620052004200620052004200620052004

Trends for 1990–2006 / 51
4.2.5 Distribution by Channel, byRegion/Province
Figure 4.5 illustrates the proportion of electricranges shipped for the building trade versus thoseshipped for retail sales, from 2004 to 2006. There
was a slight increase in builder share across thecountry in 2006. Once again, British Columbia and the Territories had a substantially larger buildershipment representation (43.9 percent) than therest of the country, and Quebec had a significantlylower share (8.7 percent).
Chapter 4 / Electric Ranges
Figure 4.5 Distribution of Electric Ranges by Channel, by Region/Province, 2004−2006*
*For more information, see Table D.25 in Appendix D, “Detailed Tables.”
Region/Province
Builder Retail
Ship
men
ts (
%)
BritishColumbia
andTerritories
PrairiesOntarioQuebecAtlanticCanada
0
20
40
60
80
100
200620052004200620052004200620052004200620052004200620052004200620052004

52 / Energy Consumption of Major Household Appliances Shipped in Canada
4.3 Energy Consumption
4.3.1 Average Annual Unit EnergyConsumption by Model Year
Between 1990 and 2002, the energy consumptionof electric ranges remained relatively unchanged.The decrease in average annual UEC, as illustratedin Figure 4.6, was approximately 2 percent, or16 kWh. However, from 2003 to 2006, the averageannual UEC decreased substantially, from 756 to 537 kWh, due to a 2003 amendment to theminimum energy performance standards (MEPS).The change to the MEPS is a change in thecalculation rather than a change to the regulation.The change to the calculation is attributable to newtesting procedures and a new reference standard forelectric ranges having been put into place in 2003.
These changes resulted in the reduction of theaverage annual UEC for all models. However, thisreduction may not reflect any improvement in theenergy efficiency of those models.
Chapter 4 / Electric Ranges
Figure 4.6 Average Annual Unit EnergyConsumption of Electric Ranges by Model Year*
*For more information, see Table D.26 in Appendix D,“Detailed Tables.”
500
600
700
800
900
200620042002200019981996199419921990
Model Year
kWh
/yr

Trends for 1990–2006 / 53
4.3.2 Average Annual Unit Energy Consumption by Channel, by Region/Province
Figure 4.7 illustrates the breakdown of the averageannual UEC of electric ranges for retail shipmentsversus builder shipments, by region/province for2004 to 2006.
The chart shows that, throughout the regions, notonly did the average annual UEC of builder andretail models decrease once again in 2006, but thegap between the average annual UEC of the two
channels also decreased. And in certain regions (i.e.the western provinces), the average annual UEC ofmodels shipped to builders was lower than modelsshipped to retailers.
This change to the UEC levels can be attributedpartly to the fact that, in 2006, although nationally,builder shipments of more energy efficient, self-cleaning ranges increased (38.4 percent), buildershipments of self-cleaning ranges were notablyhigher in the Prairies and British Columbia and the Territories (54.2 percent and 61.6 percent,respectively).
Chapter 4 / Electric Ranges
Figure 4.7 Average Annual Unit Energy Consumption of Electric Ranges by Channel, by Region/Province, 2004−2006*
*For more information, see Table D.27 in Appendix D, “Detailed Tables.”
Region/Province
Builder Retail
kWh
/yr
BritishColumbia
andTerritories
PrairiesOntarioQuebecAtlanticCanada
450
500
550
600
650
700
750
200620052004200620052004200620052004200620052004200620052004200620052004

Figure 4.8 Annual Energy Savings forElectric Ranges, 1992–2006*
*For more information, see Table D.28 in Appendix D,“Detailed Tables.”
54 / Energy Consumption of Major Household Appliances Shipped in Canada
4.4 Energy SavingsFigure 4.8 shows how much energy might havebeen consumed by electric ranges without theMEPS or general improvements in energy efficiency(top line) and how much energy they actuallyconsumed (bottom line). The gap between the twolines represents annual energy savings – on average,0.02 petajoules (PJ) per year for 1992 to 2002 and0.32 PJ per year for 2003 to 2006.
The cumulative energy savings for electric rangesare shown in Figure 4.9. Cumulative energy savingsgrew slowly but steadily between 1994 and 2002,while annual energy savings began to accrue. The savings increased substantially from 2003 to2006, due to a new testing method and energyconsumption standard introduced in October 2003.Savings reached 1.72 PJ in 2006 (the equivalent of one year’s energy for approximately 16 000households), taking into account the life expectancyfactor of electric ranges. (This calculation isexplained further in Appendix A, “Methodology”.)
Chapter 4 / Electric Ranges
0.0
0.5
1.0
1.5
2.0
2.5
20062004200220001998199619941992
Model Year
Peta
joul
es
Energy Consumed WITHOUTManufacturers’ Improvements and the MEPS
Energy Consumed WITHManufacturers’ Improvements and the MEPS
0.55 PJ
Figure 4.9 Cumulative Energy Savings forElectric Ranges, 1992–2006*
*For more information, see Table D.28 in Appendix D,“Detailed Tables.”
Model Year
Peta
joul
es
2006
2005
2004
2003
2002
2001
2000
1999
1998
1997
1996
1995
1994
1993
1992
0.00 -0.01 0.00 0.01 0.02 0.03 0.04 0.08 0.11 0.14 0.18
0.35
0.66
1.17
1.72
0.0
0.3
0.6
0.9
1.2
1.5
1.8

Trends for 1990–2006 / 55
4.5 Electric Ranges SummaryBy 2006, self-cleaning ranges increased inpopularity by 37 percentage points since 1990, and the market share increased to 59.9 percent. In 2006, the shipment-weighted average annualUEC for self-cleaning ranges was 522.7 kWh,compared with 558.9 kWh for non-self-cleaningelectric ranges.
In 1990, the majority (42.4 percent) of electricranges consumed between 800 and 849 kWh per year, whereas by 2006, 84.5 percent of themconsumed less than 600 kWh per year. Thisdecrease in average annual UEC in recent years isprobably attributable to new testing proceduresand a new reference standard for electric rangeshaving been put into place in 2003.
Approximately 26.9 percent of all electric rangeswere tagged for builder shipments, whereas73.1 percent were shipped for retail sales. BritishColumbia and the Territories had a substantiallylarger builder shipment representation (43.9 percent)than the rest of the country, whereas Quebec had a substantially lower share (8.7 percent).
Cumulative energy savings grew slowly but steadilybetween 1994 and 2002, as annual energy savingsbegan to accrue. The savings increased substantiallybetween 2003 and 2006 due to a new testing methodand energy-consumption standard introduced inOctober 2003. Total energy savings for the studyperiod reached 1.72 PJ (477.78 million kWh).Dollar savings for electric ranges for the studyperiod were estimated to be $45 million (calculatedat 9.4 cents/kWh).
Chapter 4 / Electric Ranges

56 / Energy Consumption of Major Household Appliances Shipped in Canada
Chapter 5 / Clothes Washers
5.1 2006 Market SnapshotIn 2006, 46.9 percent of the clothes washersshipped in Canada were front-loading units. Theshipment-weighted average annual unit energyconsumption (UEC) of front-loading clotheswashers was 203 kilowatt hours (kWh), comparedwith 555 kWh for top-loading ones.
The ENERGY STAR® qualifying level for clotheswashers increased in stringency in 2004. In 2006,50.8 percent of clothes washers on the market(97.8 percent of front-loading models and 9.3 percentof top-loading models) qualified for the ENERGYSTAR specification. The specification exceeds theminimum energy performance standards (MEPS)by at least 36 percent and has a modified energyfactor of at least 40.21 litres per kWh per cycle.These criteria increased again in January 2007.
5.2 Distribution of Shipments
5.2.1 Distribution by Type
Although front-loading washers have been used formany years – most often in commercial laundries –appliance manufacturers have more recentlydeveloped new models of front-loading washers for domestic use. Overall, front-loading clotheswashers are more energy efficient.
Table 5.1 illustrates the increase in popularity offront-loading models versus top-loading ones since2001 (the first year that shipment data for front-loading clothes washers were available). The marketshare increased to 46.9 percent in 2006, whichrepresents a 31.2 percentage point increase since2001, or an annual growth rate of 6.3 percent.
In 1990, 98.2 percent of the clothes washersshipped used more than 800 kWh per year. By 2006, 66.1 percent of all clothes washersconsumed less than 500 kWh. This significantimprovement is partly due to the 2004amendment to the MEPS and the increasedpopularity of front-loading models.
Table 5.1 Distribution of Clothes Washers by Type
Model Year Clothes Washer Type
Front-Loading Top-LoadingClothes Washers Clothes Washers
(%) (%)
2001 15.7 84.3
2002 16.8 83.2
2003 21.5 78.5
2004 29.2 70.8
2005 42.3 57.7
2006 46.9 53.1
TotalChange 31.2 31.2

Trends for 1990–2006 / 57
5.2.2 Distribution by Type, by Region/Province
Figure 5.1 illustrates the increase in front-loadingclothes washers both nationally and regionally
between 2004 and 2006. British Columbia and the Territories received more shipments of front-loading models than the rest of the country. Forconfidentiality reasons, the Atlantic provinces andQuebec were grouped for this analysis.
Chapter 5 / Clothes Washers
Figure 5.1 Distribution of Clothes Washers by Type, by Region/Province, 2004−2006*
*For more information, see Table D.29 in Appendix D, “Detailed Tables.”
Region/Province
Front-Loading Clothes Washers Top-Loading Clothes Washers
Ship
men
ts (
%)
BritishColumbia
and Territories
PrairiesOntarioAtlanticand Quebec
Canada
0
20
40
60
80
100
200620052004200620052004200620052004200620052004200620052004

58 / Energy Consumption of Major Household Appliances Shipped in Canada
5.2.3 Distribution by Average Annual Unit Energy Consumption
Chapter 5 / Clothes Washers
Table 5.2 Distribution of Clothes Washers by Average Annual Unit Energy Consumption
Model Year kWh/yr
<400 400–499.9 500–599.9 600–699.9 700–799.9 800–899.9 900–999.9 ≥1000(%) (%) (%) (%) (%) (%) (%) (%)
1990 0.0 0.0 0.0 1.8 0.0 10.9 23.0 64.3
1991 0.0 0.0 0.0 0.4 0.0 21.8 12.2 65.7
1992 0.0 0.0 0.0 0.1 0.0 10.4 12.2 77.3
1993 0.0 0.0 0.0 0.1 0.3 15.6 13.4 70.6
1994 0.0 0.0 0.0 0.2 0.5 23.5 25.5 50.3
1995 0.0 0.0 0.0 0.4 0.5 26.7 28.0 44.4
1996 0.2 0.0 0.0 1.5 0.6 34.9 17.9 44.9
1997 2.7 0.0 0.0 1.6 0.3 37.1 10.4 47.9
1998 7.7 0.1 0.0 1.1 1.8 28.5 11.1 49.6
1999 10.6 1.3 0.0 1.6 10.3 18.4 31.3 26.4
2000 13.0 0.3 0.0 0.8 12.9 15.7 45.9 11.4
2001 17.0 0.1 0.0 0.3 13.1 14.9 51.6 3.0
2002 22.3 0.0 0.0 0.1 12.5 14.5 45.5 5.0
2003 28.5 0.1 4.2 0.2 10.3 18.2 36.9 1.6
2004 35.7 2.5 16.6 10.0 8.3 10.2 16.7 0.0
2005 48.3 3.4 28.3 7.8 4.4 2.4 5.5 0.0
2006 54.6 11.5 19.8 7.3 3.4 0.8 2.7 0.0
TotalChange 54.6 11.5 19.8 5.5 3.4 10.1 20.3 64.3
Figure 5.2 Distribution of Clothes Washers by Average Annual Unit Energy Consumption, 1990 and 2006
1990 (kWh/yr)
400–499.90.0%
500–599.90.0%
800–899.910.9%
900–999.923.0%
<4000.0%
700–799.90.0%
600–699.91.8%
2006 (kWh/yr)
≥100064.3%
400–499.911.5%
500–599.919.8%
800–899.90.8%
900–999.92.7%
<40054.6%
700–799.93.4%
600–699.97.3%
≥10000.0%

Trends for 1990–2006 / 59
Chapter 5 / Clothes Washers
As shown in Table 5.2 and Figure 5.2, the energyconsumption of clothes washers decreasedsignificantly during the study period. In 1990, 98.2 percent of the clothes washers shipped used800 kWh or more per year. By 2006, 66.1 percentall clothes washers shipped consumed less than500 kWh per year.
The significant improvement in energy efficiencybetween 2003 and 2006, outlined in Table 5.2, is due partly to the 2004 amendment to the MEPSand the increased popularity of ENERGY STARqualified clothes washers and front-loadingmodels. This improvement will probably continuebecause, on January 1, 2007, the MEPS and theENERGY STAR qualifying level for clothes washerswere made more stringent, leading to increases inthe efficiency of clothes washers.
Figure 5.3 Distribution of Clothes Washers by Average Annual Unit Energy Consumption, by Region/Province, 2004−2006*
*For more information, see Table D.30 in Appendix D, “Detailed Tables.”
Region/Province
<400 kWh/yr 400–499.9 kWh/yr 500–599.9 kWh/yr
700–799.9 kWh/yr 800–899.9 kWh/yr 900–999.9 kWh/yr
600–699.9 kWh/yr
Ship
men
ts (
%)
BritishColumbia
and Territories
PrairiesOntarioAtlanticand Quebec
Canada
0
20
40
60
80
100
200620052004200620052004200620052004200620052004200620052004
5.2.4 Distribution by Average Annual Unit Energy Consumption, by Region/Province
In 2006, 54.6 percent of all clothes washersshipped in Canada consumed less than 400 kWhper year, compared with 35.7 percent in 2004. This improvement is probably due to themanufacturers preparing for the 2007 amendmentto the MEPS. Figure 5.3 shows the distributiontrends throughout the regions/provinces, from2004 to 2006. This increase in shipments of clotheswashers consuming less than 400 kWh is alsoevident throughout the regions.

5.2.5 Distribution by Channel, by Region/Province
Figure 5.4 illustrates the breakdown of clotheswashers shipped for the building trade versus thoseshipped for retail sales, from 2004 to 2006. Onceagain, the majority of clothes washers were shippedfor retail sales. British Columbia and the Territoriesagain had a slightly larger share of builder shipmentsthan the rest of the country.
The data also show that, on average, 34.1 percentof builder shipments were front-loading clotheswashers, which are more energy efficient than top-loading ones. In British Columbia and theTerritories, however, this proportion was 59.1 percent.
60 / Energy Consumption of Major Household Appliances Shipped in Canada
Chapter 5 / Clothes Washers
Figure 5.4 Distribution of Clothes Washers by Channel, by Region/Province, 2004−2006*
*For more information, see Table D.31 in Appendix D, “Detailed Tables.”
Region/Province
Builder Retail
Ship
men
ts (
%)
BritishColumbia
and Territories
PrairiesOntarioAtlanticand Quebec
Canada
0
20
40
60
80
100
200620052004200620052004200620052004200620052004200620052004
5.3 Energy Consumption
5.3.1 Average Annual Unit EnergyConsumption by Model Year
Between 1990 and 2006, the average annual UEC ofclothes washers improved remarkably. As Figure 5.5shows, the average annual UEC decreased by828.4 kWh, or 68.0 percent. The significantdecrease in average annual UEC from 2002 to 2006(more than 389 kWh) coincided with the 2004amendment to the MEPS. This trend is likely tocontinue because, on January 1, 2007, the MEPSand the ENERGY STAR qualifying level for clotheswashers were strengthened, leading to greaterincreases in the efficiency of clothes washers.

Figure 5.5 Average Annual Unit EnergyConsumption of Clothes Washers by Model Year*
*For more information, see Table D.32 in Appendix D,“Detailed Tables.”
Trends for 1990–2006 / 61
Chapter 5 / Clothes Washers
5.3.2 Average Annual Unit EnergyConsumption by Channel, by Region/Province
Figure 5.6 illustrates the breakdown of the averageannual UEC of clothes washers by shipments for the builder trade and for retail purposes, byregion/province, from 2004 to 2006. In all regions,the average annual UEC was once again lower forbuilder and retail shipments in 2006, except in theAtlantic provinces and Quebec, where the averageannual UEC for builder shipments was slightlyhigher in 2006.
Builders in British Columbia and the Territoriessupplied their customers with significantly moreenergy-efficient clothes washers than did the rest ofthe country. As previously mentioned, builders inBritish Columbia and the Territories provided thelargest percentage of front-loading clothes washers,which are more energy efficient than top-loadingmodels. Retail shipments in the Atlantic provincesand Quebec were once again slightly less energyefficient than the national average.
0
200
400
600
800
1000
1200
1400
200620042002200019981996199419921990
Model Year
kWh
/yr
Figure 5.6 Average Annual Unit Energy Consumption of Clothes Washers by Channel, by Region/Province, 2004−2006*
*For more information, see Table D.33 in Appendix D, “Detailed Tables.”
Region/Province
Builder Retail
kWh
/yr
BritishColumbia
and Territories
PrairiesOntarioAtlanticand Quebec
Canada
250
350
450
550
650
750
200620052004200620052004200620052004200620052004200620052004

5.4 Energy SavingsIt is estimated that the annual energy consumptionfor clothes washers was significantly less from 1993to 2006 than it would have been without thecontributing factors referred to in previous chapters.The annual savings have been increasing steadilysince 1993.
Figure 5.7 illustrates the expected annual energyconsumption for clothes washers if manufacturershad not met the MEPS and general improvementsin energy efficiency (top line) and shows how muchenergy actually was consumed (bottom line).
The gap between the two lines in the figurerepresents incremental annual energy savings. On average, clothes washers would have consumed0.87 petajoules (PJ) more per year. The largestannual energy savings occurred in 2006, whenclothes washers consumed approximately 2.16 PJless than they might have otherwise.
Figure 5.7 Annual Energy Savings for Clothes Washers, 1992–2006*
*For more information, see Table D.34 in Appendix D,“Detailed Tables.”
62 / Energy Consumption of Major Household Appliances Shipped in Canada
Chapter 5 / Clothes Washers
The cumulative energy savings for clothes washersare shown in Figure 5.8. Accrued energy savingsreached 11.80 PJ in 2006 (the equivalent of one year’senergy for approximately 112 000 households),taking into account the life expectancy factor of clothes washers (this calculation is explainedfurther in Appendix A, “Methodology”). Themajority of savings occurred between 2000 and2006. Energy savings amounted to 8.35 PJ, or 2.32 billion kWh.
0.0
0.5
1.0
1.5
2.0
2.5
3.0
3.5
20062004200220001998199619941992
Model Year
Peta
joul
es
Energy Consumed WITHOUTManufacturers’ Improvements and the MEPS
Energy Consumed WITHManufacturers’ Improvements and the MEPS
2.16 PJ
Figure 5.8 Cumulative Energy Savings for Clothes Washers, 1992–2006*
*For more information, see Table D.34 in Appendix D,“Detailed Tables.”
0
2
4
6
8
10
12
14
Model Year
Peta
joul
es
2006
2005
2004
2003
2002
2001
2000
1999
1998
1997
1996
1995
1994
1993
1992
0.00 0.120.43 0.76
1.131.58 2.08
2.73
3.45 4.26
5.20
6.32
7.84
9.79
11.80

Trends for 1990–2006 / 63
5.5 Clothes Washers SummaryThe energy efficiency of clothes washers improvedsteadily between 1990 and 2006. By 2006, 66.1 percent of all clothes washers consumed lessthan 500 kWh per year, whereas in 1990, almosttwo thirds (64.3 percent) consumed 1000 kWh or more per year. Since 2001 – the first year thatshipment data for front-loading clothes washerswere available – there has been a substantialincrease in popularity of the more energy-efficientfront-loading models versus top-loading ones.Market share increased from 15.7 percent to46.9 percent between 2001 and 2006.
Of the clothes washer models available in 2006,50.8 percent were ENERGY STAR qualified.
Approximately 5.7 percent of all clothes washerswere tagged for builder shipments, whereas94.3 percent were shipped for retail sales. BritishColumbia and the Territories continued to have asubstantially larger builder shipment representation(15.6 percent). The Atlantic provinces and Quebec had a somewhat smaller builder shipmentrepresentation (1.6 percent) than the rest of the country.
The average annual energy savings for clotheswashers were estimated to be 0.87 PJ between 1993and 2006, with total energy savings for that periodreaching 11.80 PJ (3.28 billion kWh). Dollar savingsfor clothes washers for the study period wereestimated to be $308 million (calculated at 9.4 cents/kWh).
Chapter 5 / Clothes Washers

64 / Energy Consumption of Major Household Appliances Shipped in Canada
Chapter 6 / Electric Clothes Dryers
6.1 2006 Market SnapshotIn 2006, the shipment-weighted average annualunit energy consumption (UEC) of all electric clothesdryers was 905 kilowatt hours (kWh) per year.
Electric clothes dryers typically make up 97 percentof the market; gas clothes dryers constitute theremainder.
6.2 Distribution of Shipments
6.2.1 Distribution by Average AnnualUnit Energy Consumption
Table 6.1 and Figure 6.1 illustrate that between1990 and 2006, electric clothes dryers exhibitedrelatively minor improvements in energyefficiency. A consumption level of more than1050 kWh per year had dominated the market(66.5 percent) in 1990. That consumption levelhad disappeared by 1996. In 2006, 69.8 percent of electric clothes dryers consumed between900 and 949 kWh per year.
There was a significant improvement in theenergy efficiency of electric clothes dryersfrom 1991 to 1993, when the average annualUEC decreased from 1109 kWh to 929 kWh.After 1993, the average annual UEC remainedrelatively constant.

Trends for 1990–2006 / 65
Chapter 6 / Electric Clothes Dryers
Table 6.1 Distribution of Electric Clothes Dryers by Average Annual Unit Energy Consumption
Model Year kWh/yr
<800 800–899.9 900–949.9 950–999.9 1000–1049.9 ≥1050 (%) (%) (%) (%) (%) (%)
1990 4.7 7.8 14.4 0.0 6.6 66.5
1991 5.3 0.2 30.0 22.6 15.4 26.5
1992 4.4 28.9 37.5 13.6 4.6 11.0
1993 4.1 28.9 53.6 0.1 7.1 6.1
1994 4.3 24.0 54.6 0.0 14.9 2.2
1995 3.2 16.2 68.5 0.8 10.0 1.3
1996 4.2 11.8 82.8 1.1 0.2 0.0
1997 4.9 12.9 80.7 1.4 0.0 0.0
1998 3.2 8.8 87.0 1.0 0.0 0.0
1999 2.7 7.2 88.3 1.8 0.0 0.0
2000 2.7 7.7 84.6 5.0 0.0 0.0
2001 2.3 4.3 87.1 6.3 0.0 0.0
2002 2.5 5.2 85.5 6.7 0.0 0.0
2003 2.7 10.0 77.0 10.3 0.0 0.0
2004 4.0 4.4 75.3 16.3 0.0 0.0
2005 6.1 3.2 74.1 16.6 0.0 0.0
2006 6.1 2.8 69.8 21.2 0.0 0.0
TotalChange 1.4 5.0 55.4 21.2 6.6 66.5
Figure 6.1 Distribution of Electric Clothes Dryers by Average Annual Unit Energy Consumption, 1990 and 2006
1990 (kWh/yr)
950–999.90.0%
1000–1049.96.6%
<8004.7%
900–949.914.4%
800–899.97.8%
2006 (kWh/yr)
≥105066.5%
950–999.921.2%
1000–1049.90.0%
<8006.1%
900–949.969.8%
800–899.92.8%≥1050
0.0%

66 / Energy Consumption of Major Household Appliances Shipped in Canada
6.2.2 Distribution by Average Annual Unit Energy Consumption, by Region/Province
Figure 6.2 shows an increase in shipments ofclothes dryers consuming between 950 and999.9 kWh per year between 2004 and 2006,throughout the country. It also shows that BritishColumbia and the Territories had a slight tendencytoward lower-energy-consuming dryers (less than800 kWh per year), and the Prairies had a slighttendency toward higher-energy-consuming dryers(950–999.9 kWh/yr).
6.2.3 Distribution by Channel, by Region/Province
Figure 6.3 illustrates the proportion of electricclothes dryers shipped for the building trade versusthose shipped for retail sales from 2004 to 2006.There was little change in the proportion of builderversus retail shipments throughout the country.British Columbia and the Territories still had asubstantially larger builder shipment representation(15.4 percent) than the rest of the country, andAtlantic and Quebec had a somewhat lower share(1.5 percent).
Chapter 6 / Electric Clothes Dryers
Figure 6.2 Distribution of Electric Clothes Dryers by Average Annual Unit Energy Consumption, by Region/Province, 2004−2006*
*For more information, see Table D.35 in Appendix D, “Detailed Tables.”
Region/Province
<800 kWh/yr 800–899.9 kWh/yr 900–949.9 kWh/yr 950–999.9 kWh/yr
Ship
men
ts (
%)
BritishColumbia
and Territories
PrairiesOntarioAtlanticand Quebec
Canada
0
20
40
60
80
100
200620052004200620052004200620052004200620052004200620052004

Trends for 1990–2006 / 67
6.3 Energy Consumption
6.3.1 Average Annual Unit EnergyConsumption by Model Year
The improvement in energy efficiency for electricclothes dryers between 1990 and 2006 is illustrated inFigure 6.4. It shows a decrease in the average annualUEC of 198 kWh, or approximately 18 percent.Figure 6.4 and Table D.37 (in Appendix D,“Detailed Tables”) show a significant improvementfrom 1991 to 1993, when the average annual UECdecreased from 1109 to 929 kWh (180 kWh or16 percent). After 1993, the average annual UECremained relatively constant.
Chapter 6 / Electric Clothes Dryers
Region/Province
Builder Retail
Ship
men
ts (
%)
BritishColumbia
and Territories
PrairiesOntarioAtlanticand Quebec
Canada
0
20
40
60
80
100
200620052004200620052004200620052004200620052004200620052004
Figure 6.4 Average Annual Unit EnergyConsumption of Electric Clothes Dryers byModel Year*
*For more information, see Table D.37 in Appendix D,“Detailed Tables.”
0
200
400
600
800
1000
1200
1400
200620042002200019981996199419921990
Model Year
kWh
/yr
Figure 6.3 Distribution of Electric Clothes Dryers by Channel, by Region/Province, 2004−2006*
*For more information, see Table D.36 in Appendix D, “Detailed Tables.”

68 / Energy Consumption of Major Household Appliances Shipped in Canada
6.3.2 Average Annual Unit Energy Consumption by Channel, by Region/Province
Figure 6.5 illustrates the breakdown of the averageannual UEC of electric clothes dryers by shipmentsfor the builder trade and for retail purposes, by
Chapter 6 / Electric Clothes Dryers
Figure 6.5 Average Annual Unit Energy Consumption of Electric Clothes Dryers by Channel, by Region/Province, 2004−2006*
*For more information, see Table D.38 in Appendix D, “Detailed Tables.”
Region/Province
Builder Retail
kWh
/yr
BritishColumbia
and Territories
PrairiesOntarioAtlanticand Quebec
Canada
700
750
800
850
900
950
200620052004200620052004200620052004200620052004200620052004
region/province, from 2004 to 2006. In all regions,the average annual UEC remained higher for retail shipments than for builder ones. In 2006, the average annual UEC for builder shipmentsdecreased the most in British Columbia and theTerritories and increased the most in the Atlanticprovinces and Quebec.

Figure 6.6 Annual Energy Savings for Electric Clothes Dryers, 1992–2006*
*For more information, see Table D.39 in Appendix D,“Detailed Tables.”
Trends for 1990–2006 / 69
6.4 Energy SavingsIt is estimated that from 1993 to 2006, the annualenergy consumption of electric clothes dryers waslower than it would have been had manufacturersnot met the minimum energy performance standards(MEPS) or improved energy efficiency. Figure 6.6shows how much energy might have been consumedannually by electric clothes dryers without thecontributing factors (top line) and how muchenergy they actually consumed (bottom line).
The gap between the two lines representsincremental annual energy savings – on average,0.13 petajoules (PJ) per year. The largest annualenergy savings occurred in 2005 and 2006. In bothyears, electric clothes dryers consumed 0.19 PJ lessthan they might have otherwise.
The cumulative energy savings for electric clothesdryers are shown in Figure 6.7. Savings grewsteadily between 1992 and 2006, as annual energysavings began to accrue. They reached 1.81 PJ in 2006 (the equivalent of one year’s energy forapproximately 17 000 households), taking intoaccount the life expectancy factor of electricclothes dryers. (This calculation is explainedfurther in Appendix A, “Methodology”.)
Chapter 6 / Electric Clothes Dryers
0.0
0.5
1.0
1.5
2.0
2.5
3.0
20062004200220001998199619941992
Model Year
Peta
joul
es
Energy Consumed WITHOUTManufacturers’ Improvements and the MEPS
Energy Consumed WITHManufacturers’ Improvements and the MEPS
0.19 PJ
Figure 6.7 Cumulative Energy Savings for Electric Clothes Dryers, 1992–2006*
*For more information, see Table D.39 in Appendix D,“Detailed Tables.”
0.0
0.5
1.0
1.5
2.0
Model Year
Peta
joul
es
2006
2005
2004
2003
2002
2001
2000
1999
1998
1997
1996
1995
1994
1993
1992
0.000.07
0.170.25
0.38
0.51
0.63
0.76
0.88
1.00
1.13
1.27
1.43
1.62
1.81

70 / Energy Consumption of Major Household Appliances Shipped in Canada
6.5 Electric Clothes DryersSummaryThe energy efficiency of clothes dryers improvedbetween 1990 and 2006. By 2006, 69.8 percent of all clothes dryers consumed between 900 and949.9 kWh per year, whereas in 1990, almost two thirds (66.5 percent) consumed more than1050 kWh per year.
Approximately 5.9 percent of all electric clothesdryers were tagged for builder shipments, whereas94.1 percent were shipped for retail sales. Onceagain, British Columbia and the Territories had asubstantially larger builder shipment representation(15.4 percent) and the Atlantic provinces andQuebec had a somewhat smaller builder shipmentrepresentation (1.5 percent) than the rest of the country.
The average annual energy savings for clothesdryers were estimated to be 0.13 PJ between 1993and 2006, with total energy savings for that periodreaching 1.81 PJ (503 million kWh).
Dollar savings for electric clothes dryers for thestudy period were estimated to be $47 million(calculated at 9.4 cents/kWh).
Chapter 6 / Electric Clothes Dryers

Trends for 1990–2006 / 71
Chapter 7 / Summary of Major Household Appliances
7.1 Total Energy SavingsAnnual energy consumption for all majorhousehold appliances during the study period was significantly reduced, probably due to thefollowing factors:
• the significant research and developmentactivities carried out by appliance manufacturers
• improvements to the minimum energyperformance standards (MEPS)
• the EnerGuide for Equipment program
• the ENERGY STAR® Initiative
• the various incentives and rebates offered by thefederal, provincial and municipal governmentsand utilities
Table 7.1 lists the dates that the MEPS and ENERGYSTAR Initiative came into effect, including theiramendments.
Table 7.1 Dates of the Minimum Energy Performance Standards and ENERGY STAR Initiative
MEPS MEPS ENERGY STAR ENERGY STARAppliance Introduced Amendments Initiative Amendments
Refrigerators Feb. 1995 Jul. 2001 Jan. 2001 Jan. 2004 and Apr. 2008
Freezers Feb. 1995 Jul. 2001 Jan. 2003 Jan. 2004
Dishwashers Feb. 1995 Jan. 2004 and Jan. 2010 Jan. 2001 Jan. 2007
Electric Ranges Feb. 1995 Oct. 2003 n/a n/a
Clothes Washers May 1995 Jan. 2004 and Jan. 2007 Jan. 2001 Jan. 2007
Electric Clothes Dryers May 1995 n/a n/a n/a

Figure 7.1 Annual Energy Savings for All Major Household Appliances, 1992–2006*
*For more information, see Table D.40 in Appendix D,“Detailed Tables.”
72 / Energy Consumption of Major Household Appliances Shipped in Canada
31 Source: Natural Resources Canada, Energy Use Data Handbook, 1990 to 2006.Available: oee.nrcan.gc.ca/Publications/statistics/handbook08/chapter2.cfm
Figure 7.1 shows the estimated annual energyconsumption of major appliances between 1992and 2006 without these factors as well as howmuch energy was actually consumed by majorappliances during this period.
The gap between the two lines in Figure 7.1represents incremental annual energy savings.Energy efficiency began to improve almostimmediately after the Energy Efficiency Act (the Act)came into force in 1992.
The average annual energy savings for majorappliances were estimated to be 2.61 petajoules (PJ)between 1993 and 2006. (No energy savings hadbeen expected in 1992.) This indicates that, onaverage, major appliances consumed approximately2.61 PJ less per year than they would have withoutthe contributing factors.
The largest annual energy savings occurred in 2006,when major appliances consumed approximately5.61 PJ less than they would have otherwise.Cumulative energy savings for major appliances areshown in Figure 7.2 and Table D.40 (in Appendix D,“Detailed Tables”). Because the energy saved in anygiven year accrues over time, cumulative energysavings grew steadily between 1992 and 2006. Theyreached a total savings of 35.67 PJ (9.91 billionkilowatt hours [kWh]) in 2006 (taking into accountthe life expectancy factor of the various appliances).That is the equivalent of one year’s energy forapproximately 336 500 households. It is estimatedthat these energy savings resulted in consumerssaving approximately $932 million (or $70 to $80 2006 dollars per household), calculated at9.4 cents/kWh, over the 1992 to 2006 period.31
Chapter 7 / Summary of Major Household Appliances
0.0
2.5
5.0
7.5
10.0
12.5
15.0
20062004200220001998199619941992
Model Year
Peta
joul
es
Energy Consumed WITHOUTManufacturers’ Improvements and the MEPS
Energy Consumed WITHManufacturers’ Improvements and the MEPS
5.61 PJ
Model Year
Peta
joul
es
2006
2005
2004
2003
2002
2001
2000
1999
1998
1997
1996
1995
1994
1993
1992
0.00 0.551.66
2.924.29
5.807.46
9.4911.57
14.02
17.09
20.68
25.16
30.48
35.67
0
10
20
30
40
Figure 7.2 Cumulative Energy Savings for All Major Household Appliances, 1992–2006*
*For more information, see Table D.40 in Appendix D,“Detailed Tables.”

Trends for 1990–2006 / 73
7.2 Average Annual Unit Energy Consumption of All Major Household AppliancesTable 7.2 provides an overview of the averageannual unit energy consumption for the six majorhousehold appliances for seven years during thestudy period. It illustrates the significantimprovement in energy efficiency as evidencedthroughout this report.
Chapter 7 / Summary of Major Household Appliances
Table 7.2 Average Annual Unit Energy Consumption of All Major Household Appliances, Selected Years
Appliance kWh/yr
1990 1997 1999 2001 2003 2005 2006
Refrigerators
Type 3 (16.5–18.4 cu. ft.) Refrigerators 947 635 636 544 461 454 455
Total Refrigerators 956 657 646 559 487 469 481
Freezers
Total Freezers 714 377 383 384 369 386 380
Dishwashers
Total Dishwashers 1026 649 640 634 524 396 373
Electric Ranges
Self-Cleaning Electric Ranges 727 759 742 741 691 558 523
Non-Self-Cleaning Electric Ranges 786 780 770 786 732 593 559
Total Electric Ranges 772 772 759 763 709 573 537
Clothes Washers
Total Front-Loading Clothes Washers – – – 287 275 219 203
Total Top-Loading Clothes Washers – – – 905 827 609 555
Total Clothes Washers 1218 930 860 810 708 444 390
Electric Clothes Dryers
Total Electric Clothes Dryers 1103 887 908 916 914 904 905

74 / Energy Consumption of Major Household Appliances Shipped in Canada
Appendix A / Methodology
A.1 Data Preparation
A.1.1 Introduction
To improve the monitoring of trends in Canadianenergy use, Natural Resources Canada’s (NRCan’s)Office of Energy Efficiency proposed an annualdata collection arrangement with the CanadianAppliance Manufacturers Association (CAMA) in1996, as part of the National Energy Use Database(NEUD) initiative.
Under this agreement, CAMA members contributedfor analysis their annual shipment data for six appliance categories – refrigerators, freezers,dishwashers, electric ranges, clothes washers andelectric clothes dryers. To keep their data confidential,these appliance manufacturers suggested that athird party receive and prepare the database in aformat in which no one (other than the third party)could determine the shipment data for an individualmodel or manufacturer. NRCan retained the servicesof Electro-Federation Canada (EFC), chosen by CAMA, as the third party to receive the data.
For 2006 (and for the previous two years), themanufacturers agreed to provide data on theirshipments by region/province and by distributionchannel (builder versus retailer), where possible.These additional shipment data have allowed amore detailed analysis of the distribution andenergy efficiency of the appliances.
A.1.2 Database Preparation Process
The data presented in this report combine shipmentfigures from the major appliance manufacturers inCanada with the energy use information in NRCan’sannual EnerGuide Appliance Directory. Analysts from EFC matched the model number from themanufacturer with the corresponding model in the EnerGuide Appliance Directory. Thus they arrivedat the energy consumption represented by all
shipments of that model within each year. Theanalysts then aggregated these figures by region/province, by channel and for Canada to providethe data presented in this report. They producedseparate aggregated data for ENERGY STAR® models,where appropriate.
The analysts assembled the data using standarddatabase and spreadsheet software and submitted it to NRCan for analysis and report generation. For the reporting stages, any information thatcould identify the manufacturer or model numberwas removed.
A.1.3 Manufacturers’ Data
NRCan sent a letter to each appliance manufacturer,requesting annual shipment data for each model of refrigerator, freezer, dishwasher, electric range,clothes washer and electric clothes dryer on theCanadian market from 1990 to 2006. When theproject began in 1996, only three manufacturersprovided shipment data. The number of datacontributors has since increased to eight, coveringthe majority of appliance models sold in Canada.NRCan is approaching additional manufacturers to improve the coverage for future data collection.
Manufacturers submitted the data in variouselectronic and printed formats. EFC converted theelectronic data to a common database format. Theanalysts entered the data into the database fromthe printed reports.
The data included the appliance type, model numberand number of shipments (by region/province andchannel, where possible, for 2004 data onwards)for each year. Because each manufacturer provideddata in a different format, the analysts amalgamatedthe files to produce a single file for all modelssubdivided by appliance type, region/province,channel and model year.

Trends for 1990–2006 / 75
The nature of the freezer market prevented EFCfrom obtaining a model-by-model breakdown ofshipments. Instead, the analysts received totalshipments and average energy use by freezer type.NRCan used this information to generate thefreezer reports.
A.1.4 EnerGuide Data
The analysts used the size, type and unit energyinformation from NRCan’s EnerGuide ratings foreach appliance to calculate the shipment-weightedenergy use of each appliance type. Also, theEnerGuide Appliance Directory was used to identifywhich models were listed as ENERGY STAR.
A.1.5 Data Matching
Analysts from EFC matched the manufacturer’sdata for each model with the corresponding energyconsumption data from the EnerGuide ApplianceDirectory for that model. They then multiplied themanufacturer’s shipments for each model by thecorresponding EnerGuide model’s energy rating.This result is the shipment-weighted total energyconsumption for that model. Each appliancecategory (such as refrigerator, dishwasher) and typeand size category (as defined in the EnerGuidedirectories, such as Type 7 refrigerators, self-cleaningranges, front-loading clothes washers) was thensubtotalled so that the average unit energyconsumption could be calculated.
The EnerGuide Appliance Directory shows the basicmodel numbers for appliances available on theCanadian market. Many slight model variants havethe same energy rating; therefore, the listings usesymbols (such as * and #) to indicate model families.Because some model numbers have additionalprefixes or suffixes to indicate features that do notaffect energy use (such as colour and door-swing),there were relatively few one-to-one matches.
Analysts needed to manipulate the data to performpattern matching. They wrote programs to comparethe model numbers supplied by the manufacturerswith those in the EnerGuide Appliance Directory.
When a match was found, the correspondingenergy consumption figure and the informationabout the type from the EnerGuide ApplianceDirectory were added to the record for the annualshipments of the model.
Because there were many combinations of charactersubstitution, the analysts adopted a method towork from the closest matches to the least likelymatches. Matches in which only one characterdiffered were flagged and removed. Attempts werethen made with a difference of two characters, and so on.
The analysts developed reasonability tests to ensurethe integrity of the data-matching process. Forexample, if the manufacturer’s model numbercontained many characters but was matched by a model in the EnerGuide Appliance Directory thathad considerably fewer characters, the model wasflagged for manual checking. They also realizedthat manufacturers might re-use the same numbersfor different models after several years. For example,128 models of refrigerators in the file containing1980 to 1993 data from the EnerGuide ApplianceDirectory have the same model number as those in the 1997 file, but with different energy ratings.They flagged these models for special treatment.During the matching process, analysts applied“reasonability” criteria. For example, a modelwould be checked manually if its shipments werereported more than three years after the last timethe corresponding model appeared in the EnerGuidelist or if the EnerGuide model number containedconsiderably fewer characters than that of themanufacturer.
Some difficulties occurred when the model numberin NRCan’s EnerGuide Appliance Directory differedfrom the actual model numbers used by themanufacturers in their internal shipment recordingsystems. In some cases, for example, manufacturersused special codes to denote models that werebranded for other companies, such as departmentstores. The manufacturers helped resolve most ofthese cases.
Appendix A / Methodology

76 / Energy Consumption of Major Household Appliances Shipped in Canada
Some models remained unmatched even after theautomated processes were performed. Whenever oneof these models represented a substantial numberof shipments for that appliance type, analystshandled it on an exceptional basis. Manufacturerswere again helpful in identifying these models andverifying energy ratings and types.
The process continued until all but a few minormodels were matched.
A.1.6 Data Summary and Transfer
After the matching process, analysts summarizedthe data. To calculate the total annual energyconsumption for each model, they multiplied themodel’s energy rating by the number of shipmentsfor the year. This yielded the shipment-weightedtotal energy use of that model for that year. Forexample, model XYZ has annual shipments of5238 and an annual energy consumption of 683 kilowatt hours (kWh); its shipment-weightedtotal energy use for the year is 5238 × 683 kWh= 3 577 554 kWh. This aggregate figure and theshipment figures were added as necessary toprovide totals for each appliance type and sizecategory as appropriate. Separate aggregated datawere provided for ENERGY STAR models. All theseaggregate figures were given for region/province,channel and country.
For refrigerators, the actual volume of each modelwas available from the EnerGuide ApplianceDirectory. Therefore, it was possible to monitor thetrend of changes in the size of refrigerators over the years. Furthermore, it was possible to determinethe amount of energy used by each size category.Analysts summarized this information and added it to the database for NRCan.
The final database prepared by EFC consisted ofsuch information as the appliance type, model year,total energy consumption and average unit energyconsumption (UEC). Refrigerators were furthercategorized by type and size. The aggregated datawere broken down by ENERGY STAR versus non-ENERGY STAR (as of 1999) and region/provinceand channel (as of 2004). All the information wastransferred to spreadsheets and sent to NRCan foranalysis and reporting.
A.2 AnalysisThe shipment-weighted average annual UEC bycategory was calculated as total energyconsumption of all the refrigerators sold in Canadain that category divided by total number ofshipments in that category. The following gives anexample of the shipment-weighted average UEC forrefrigerators:
where
= Number of Shipments of Type irefrigerators and
= Average Unit EnergyConsumption of Type irefrigerators
As mentioned in section A.1, “Data Preparation,”data were obtained for some appliances by sizecategory. Therefore, the UEC per cubic foot wascalculated by dividing the UEC of a given sizecategory by the midpoint of the category.
A.2.1 Incremental Energy Savings
Calculating the incremental energy savings foreach appliance type was a three-step process, as follows:
1. Baseline levels of energy consumption wereestimated for each appliance type for each yearbetween 1990 and 2006. For all appliances,baseline levels of energy consumption reflectedNRCan’s assumptions about how much energyeach appliance type would have consumedwithout the energy efficiency improvementsmade by manufacturers and the minimumenergy performance standards (MEPS). Toestimate baseline levels of energy consumption,the following was assumed:
Appendix A / Methodology

Trends for 1990–2006 / 77
32 Natural Resources Canada EnerGuide Appliance Directory 2006 (Ottawa: March 2006), p. 13.
• Without the implementation of Canada’sEnergy Efficiency Regulations and general energy efficiency improvements made bymanufacturers, the UEC for all appliance types would have remained constant at the1992 levels.
• The number of units shipped would haveremained the same between 1990 and 2006even in the absence of the general efficiencyimprovements made by manufacturers andthe implementation of the Energy EfficiencyRegulations.
2. “Actual” or current levels of consumption for all appliances were calculated in an identicalfashion. The average annual UEC for eachappliance type for each model year was used,instead of holding it constant at 1992 levels, to determine the actual levels of energyconsumption.
3. Incremental energy savings for all applianceswere then calculated as the difference betweenbaseline and actual levels of energy consumption.
Because 1992 was the baseline year used in thecalculations, a retirement function was includedto take into account the aging of appliances,based on the life expectancies set out in the2006 EnerGuide Appliance Directory.32 Applyingthis retirement function was done to avoidoverestimating the actual energy savings fromappliance stock that has been retired (or is nolonger in use). The calculation involved usingthe average life expectancy, annual shipmentdata and annual incremental energy savings foreach appliance type. Average life expectancy andannual shipment data for each appliance typewere used to estimate the annual stock of eachappliance type in use. This estimate was thenapplied to the annual incremental unit energysavings for each appliance type (shipment-weighted UEC for 1992 less the shipment-weightedUEC for each year) to calculate the cumulativeenergy savings.
A.2.2 Cumulative Energy Savings
This calculation was a four-step process, as follows:
1. The average life expectancy of each appliancetype was assumed to be the industry averagereported in the 2006 EnerGuide ApplianceDirectory:
a. refrigerators – 17 years
b. freezers – 21 years
c. dishwashers – 13 years
d. electric ranges – 18 years
e. clothes washers – 14 years
f. electric clothes dryers – 18 years
2. A retirement function was used to estimate theretirement rate of each appliance type. In thislinear function, no appliances retire in the firsttwo thirds (0.67) of their average life expectancy,and all units are retired by four thirds (1.33) oftheir average life expectancy. The ranges for theretirement function are as follows:
a. if age < {2/3 * (average life expectancy)},100 percent survive
b. if age > {4/3 * (average life expectancy)}, 0 percent survive
c. otherwise, {2 – age * 1.5/(average lifeexpectancy)} survive
Appendix A / Methodology
Even though the MEPS were not introduceduntil 1995, the baseline year used for allestimates of energy savings was 1992. This isbecause energy efficiency began to improvealmost immediately after the Energy EfficiencyAct came into force in 1992.
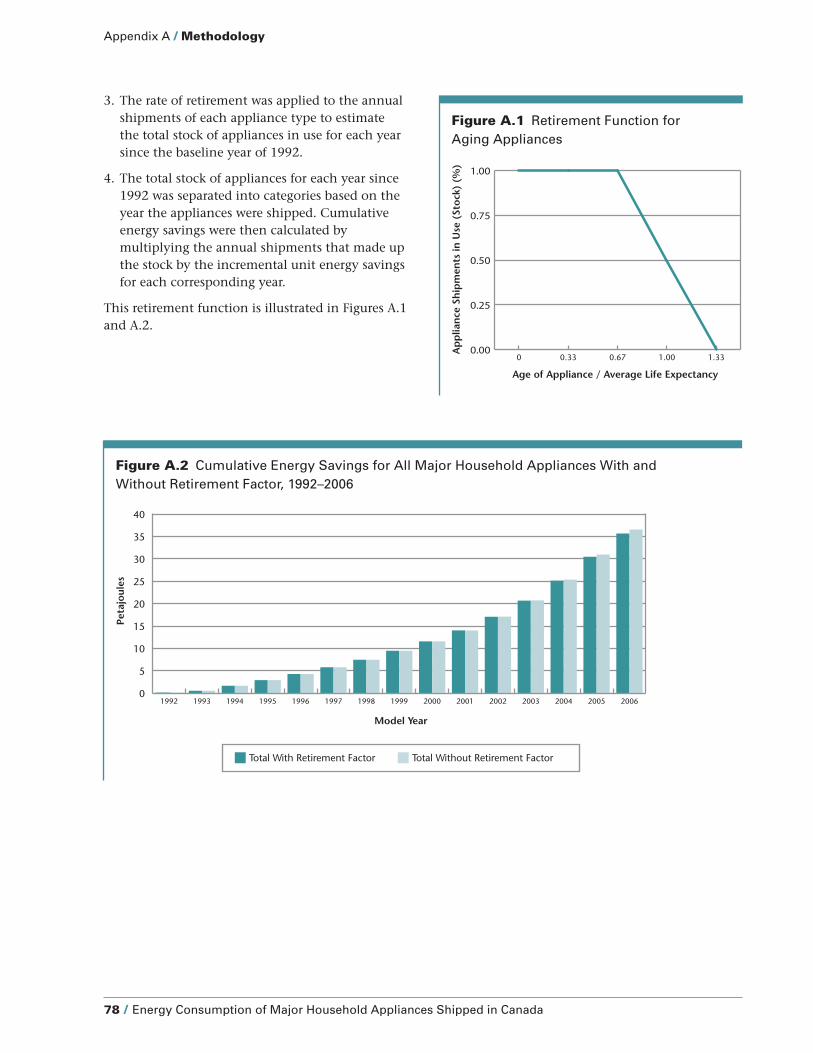
Figure A.2 Cumulative Energy Savings for All Major Household Appliances With and Without Retirement Factor, 1992–2006
78 / Energy Consumption of Major Household Appliances Shipped in Canada
3. The rate of retirement was applied to the annualshipments of each appliance type to estimatethe total stock of appliances in use for each yearsince the baseline year of 1992.
4. The total stock of appliances for each year since1992 was separated into categories based on theyear the appliances were shipped. Cumulativeenergy savings were then calculated bymultiplying the annual shipments that made upthe stock by the incremental unit energy savingsfor each corresponding year.
This retirement function is illustrated in Figures A.1and A.2.
Appendix A / Methodology
0.00
0.25
0.50
0.75
1.00
1.331.000.670.330
Age of Appliance / Average Life Expectancy
Ap
plia
nce
Sh
ipm
ents
in U
se (
Sto
ck)
(%)
0
5
10
15
20
25
30
35
40
200620052004200320022001200019991998199719961995199419931992
Model Year
Peta
joul
es
Total With Retirement Factor Total Without Retirement Factor
Figure A.1 Retirement Function for Aging Appliances

Trends for 1990–2006 / 79
Appendix B / Definitions
Clothes Washer
An appliance that is designed to clean clothesusing a water solution of soap or detergent or bothand mechanical agitation or other movement.
Canada’s Energy Efficiency Regulations (the Regulations)apply to standard or compact electrically operatedhousehold clothes washers that are top- or front-loading and that have an internal control systemthat regulates the water temperature without theneed for user intervention after the machine starts.
Dishwasher
A cabinet-like appliance, either built-in or portable,that, with the aid of water and detergent, washes,rinses and dries (when a drying process is included)dishware, glassware, eating utensils and mostcooking utensils by chemical, mechanical andelectrical means and then discharges the water intothe plumbing drainage system.
The Regulations apply to electrically operatedautomatic household dishwashers that are notcommercial, industrial or institutional machines.
Electric Clothes Dryer
A cabinet-like appliance designed to dry fabrics in atumble-type drum with forced-air circulation. Theheat source is electricity, and the drum and theblower(s) are driven by electric motor(s).
The EnerGuide Appliance Directory groups electricclothes dryers into two categories:
• Compact Size – a clothes dryer with drumvolume of less than 125 litres
• Standard Size – a clothes dryer with drumvolume of 125 litres
The Regulations apply to standard and compactelectrically operated and electrically heatedhousehold tumble-type clothes dryers.
Electric Range
A consumer product using electric resistanceheating and used as the major household cookingappliance. The product may consist of a cook top,one or more ovens, or a combination of the two,and may be built-in or free-standing.
The Regulations apply to household ranges that areany of the following:
• free-standing appliances equipped with one ormore surface elements and one or more ovens
• built-in appliances equipped with one or moresurface elements and one or more ovens
• built-in appliances equipped with one or moreovens and no surface elements
• wall-mounted appliances equipped with one ormore ovens and no surface elements
• counter-mounted appliances equipped with oneor more surface elements and no ovens
but do not include the following:
• microwave cooking appliances
• portable appliances designed for an electricalsupply of 120 volts
• household appliances with one or moretungsten-halogen heating elements

33 The term “all-refrigerators” refers to models that have no freezer compartment.
80 / Energy Consumption of Major Household Appliances Shipped in Canada
Freezer
An appliance designed
• for the extended storage of food frozen at anaverage temperature of –17.8°C (0°F) or lower
• with the inherent capability for freezing food
• with a minimum freezing capability of 2 kilograms /100 litres in 24 hours
The process of freezing involves removing heatfrom products to lower their temperatures to apoint where most of the water contained therein issolidified.
In 2006, freezers were typically built as eithervertical models or chest models and grouped intothe following types:
Type 8Upright freezers with manual defrost
Type 9Upright freezers with automatic defrost
Type 10Chest freezers and all other freezers not defined asType 8 or Type 9
Type 16Compact upright freezers with manual defrost
Type 17Compact upright freezers with automatic defrost
Type 18Compact chest freezers and all other compactfreezers
The Regulations apply to household freezers that have a capacity of not more than 850 litres (30 cubic feet).
Refrigerator
An appliance that consists of one or morecompartments, with at least one of the compartmentsdesigned for the refrigerated storage of foods attemperatures above 0°C (32°F) and, if the model is a refrigerator-freezer, with at least one of thecompartments designed for the freezing and storageof frozen foods at or below an average temperatureof –15°C (5°F) and typically capable of beingadjusted by the user to a temperature of ≤ –17.8°C(0°F). The refrigerator with a freezer compartmentis capable of maintaining simultaneously anaverage freezer temperature of ≤ –15°C (5°F) and an average fresh food compartment temperature of ≥ 0°C ≤ 5°C (≥ 32°F ≤ 41°F).
In 2006, refrigerators as per in the EnerGuideAppliance Directory were grouped under thefollowing main categories:
Type 1Refrigerators and refrigerator-freezers with manualdefrost
Type 2Refrigerator-freezers with partial automatic defrost
Type 3Refrigerator-freezers with automatic defrost andtop-mounted freezer, but without through-the-doorice service; also all-refrigerators33 with automaticdefrost
Type 4Refrigerator-freezers with automatic defrost andside-mounted freezer but without through-the-doorice service
Type 5Refrigerator-freezers with automatic defrost andbottom-mounted freezer, but without through-the-door ice service
Appendix B / Definitions

Trends for 1990–2006 / 81
Type 5ARefrigerator-freezers with automatic defrost,bottom-mounted freezer and through-the-door ice service
Type 6Refrigerator-freezers with automatic defrost, top-mounted freezer and through-the-door ice service
Type 7Refrigerator-freezers with automatic defrost, side-mounted freezer and through-the-door ice service
Type 11Compact refrigerators and refrigerator-freezers withmanual defrost
Type 12Compact refrigerators and refrigerator-freezers withpartial automatic defrost
Type 13Compact refrigerator-freezers with automaticdefrost and top mounted freezer; also compact all-refrigerators33 with automatic defrost
Type 14Compact refrigerator-freezers with automaticdefrost and side-mounted freezer
Type 15Compact refrigerator-freezers with automaticdefrost and bottom-mounted freezer
The Regulations apply to household refrigerators or combination refrigerator-freezers that have acapacity of not more than 1100 litres (39 cubicfeet), with the exception of refrigerators thatemploy an absorption refrigeration system.
Appendix B / Definitions

82 / Energy Consumption of Major Household Appliances Shipped in Canada
Appendix C / Questions and Answers About Changes to ENERGY STAR®
Why does ENERGY STAR qualificationmatter to me?
Qualification matters in several ways. ENERGYSTAR qualified products
• are the most energy-efficient products available –they cost less to run. As energy prices increase,consumers can count on appliances that aremore efficient to provide ongoing savings.
• help protect the environment by reducing theamount of fossil fuels that utilities consume to provide energy. This reduction decreasesgreenhouse gas emissions and urban airpollution that contribute to climate change.
• help Canadian businesses and institutions bylowering operating costs
Why have the ENERGY STAR criteriachanged for refrigerators, clothes washersand dishwashers?
To be ENERGY STAR qualified, a product must be 10 to 50 percent more energy efficient thanproducts that meet the minimum standard.
For residential refrigerators, the last ENERGY STARspecification came into effect in 2004. Since then,new technologies have greatly increased theavailability of energy-efficient refrigerators andtransformed the market. As a result, approximatelyhalf the refrigerators for sale in North America in2007 met the 2004 specification. The specificationis changing to ensure that the ENERGY STARsymbol identifies only the top performers.
Note: The new specification applies only tostandard-size refrigerators that have a volume of at least 219.5 litres (L) (7.75 cubic feet [cu. ft.]). Itdoes not apply to commercial models, to modelslarger than 1104.4 L (39 cu. ft.) or to freezers largerthan 849.5 L (30 cu. ft.). There is no change forcompact refrigerators and compact and standard-size freezers.
For clothes washers, Canada and the United Statesintroduced a minimum energy efficiency standardeffective January 1, 2007. This standard keeps up-to-date with technology developments that enablemanufacturers to design and build products thatachieve higher levels of energy efficiency than inthe past. The new standard will eliminate the leastefficient models from the market. Consequently,the ENERGY STAR criteria must be strengthened so that only those products that are in the top 25 percent of energy performers can use thisinternational symbol of energy efficiency.
For dishwashers, the ENERGY STAR criteria had not been updated for several years. Consequently,almost all products currently on the market canmeet those criteria. The ENERGY STAR specificationfor dishwashers was strengthened on January 1, 2007to achieve the ENERGY STAR objective to representthe top 25 percent of the market.
Why does Canada regulate energyefficiency standards?
Canada regulates energy efficiency standards for a wide range of energy-using products, with theobjective of eliminating the least energy-efficientproducts from the Canadian market. Energyefficiency is an important way that all sectors ofthe economy and individual consumers can reduceemissions of greenhouse gases that contribute toclimate change and other pollutants that contributeto urban smog. Energy efficiency is also good forthe economy because it saves consumers money,reduces business operating costs and contributes to Canada’s competitiveness in domestic andinternational markets.

Trends for 1990–2006 / 83
What is the difference between aregulated energy performance standardand the ENERGY STAR criteria?
The standards referenced in Canada’s EnergyEfficiency Regulations define test procedures for determining a product’s energy performanceand establish minimum energy performancerequirements that a product must meet to be soldin Canada. ENERGY STAR is a separate, voluntary,labelling initiative that uses an internationallyrecognized symbol to help consumers identifyproducts that not only exceed the minimumenergy performance requirements but also areamong the most energy efficient on the market.
Will the new ENERGY STAR criteria affectproduct performance?
No. ENERGY STAR identifies products that meet a specified level of energy performance based onverified testing results. To qualify for ENERGYSTAR, product features must not be compromised.ENERGY STAR qualified products deliver the sameor better performance as comparable models whileusing less energy. Only those products whoseenergy performance under normal operatingconditions puts them in the top 25 percent ofproducts on the market are eligible to use theENERGY STAR symbol.
How can I determine whether a productqualifies under the new criteria or the old criteria?
Natural Resources Canada (NRCan) maintains up-to-date lists of all products that qualify for ENERGYSTAR in Canada. If you have a specific appliancemodel in mind, you can check these lists on theENERGY STAR Web site to determine if it meets thenew criteria.
NRCan has also posted lists of dishwashers andclothes washers that qualified under the pre-January 1, 2007, criteria – and may still be usingthe ENERGY STAR symbol – but do not meet thenew requirements.
If the dishwasher or clothes washer you areconsidering purchasing was manufactured afterJanuary 1, 2007, and bears the ENERGY STARsymbol, you can be assured that it meets the newcriteria. If it is an older model, it may still qualifyfor ENERGY STAR, but you should check the list onthe ENERGY STAR Web site.
Similarly, NRCan has updated the refrigerator lists onits ENERGY STAR Web site at www.energystar.gc.ca.The updated list identifies models that meet thenew specification. Units manufactured afterApril 28, 2008, must meet the new specification tobe allowed to display the ENERGY STAR symbol.
If a product qualifies under the old criteriabut does not meet the new requirements,does this mean the product is nowconsidered a poor energy performer?
No – it could, for example, still be in the mid-rangeof products on the market. The best way to determinethis is to check the scale on the EnerGuide label,which has an indicator arrow that shows how theproduct compares with similar models in terms ofenergy consumption. One thing is certain, however:if a product does not meet the new ENERGY STARcriteria, it is no longer considered to be among the most energy-efficient models available on themarket. More energy-efficient models are availablethat will deliver lower operating costs and long-term savings.
Will rebate offers be honoured, regardlessof whether the product qualifies underthe new or old criteria?
Some provinces and utilities may pay rebates forproducts that qualify under the old ENERGY STARcriteria and were purchased after January 1, 2007,but others may not. The best strategy is to checkdirectly with the organization offering the rebate tomake sure a specific model is eligible for the rebatebefore you buy it.
Appendix C / Questions and Answers About Changes to ENERGY STAR®

84 / Energy Consumption of Major Household Appliances Shipped in Canada
Are the ENERGY STAR criteria for theseproducts the same in Canada as in theUnited States?
Yes. The ENERGY STAR criteria are the same inCanada and the United States for these products.The ENERGY STAR name and the ENERGY STARsymbol are registered trademarks of the UnitedStates Environmental Protection Agency (EPA),which establishes the criteria for different products.ENERGY STAR in Canada is administered by NRCanthrough an agreement with the EPA. Due to thehigh level of integration in the North Americanequipment market, Canada and the United Statesalso strive to harmonize their regulated minimumenergy efficiency standards, which facilitateshaving the same ENERGY STAR criteria in bothcountries.
Can we expect more changes in the future?
Canada and the United States are continuallyupdating their minimum energy efficiency standardsfor major household appliances to help transformthe market to increased energy efficiency. As newstandards are implemented from time to time, the criteria for ENERGY STAR qualification will alsobe updated.
For more information about ENERGY STARqualified appliances, visit the Web site atenergystar.gc.ca.
Appendix C / Questions and Answers About Changes to ENERGY STAR®

Trends for 1990–2006 / 85
Appendix D / Detailed Tables
Table D.A.2 ENERGY STAR Qualified Appliances as a Percentage of Total Shipments byRegion/Province, 2004−2006
* For confidentiality reasons, the Atlantic provinces and Quebec have been grouped for this analysis.
Appliance1999 2000 2001 2002 2003 2004 2005 2006(%) (%) (%) (%) (%) (%) (%) (%)
Dishwashers 0.6 1.6 9.7 29.8 56.5 81.0 90.8 79.7
Clothes Washers 1.9 2.2 9.2 22.1 30.6 36.2 45.9 50.8
Refrigerators − − 11.4 22.3 40.7 34.2 37.6 37.3
Region/Province
Dishwashers Clothes Washers* Refrigerators
2004 2005 2006 2004 2005 2006 2004 2005 2006(%) (%) (%)
Canada 81.0 90.8 79.7 36.2 45.9 50.8 34.2 37.6 37.3
Atlantic 75.4 88.4 79.6 − − − 23.3 21.3 20.6
Quebec 81.3 92.9 82.1 29.9 41.7 43.3 36.9 37.2 38.6
Ontario 83.3 90.8 80.4 37.6 50.1 54.6 38.6 39.9 38.5
Prairies 78.4 90.3 75.3 36.2 48.2 53.1 33.0 40.6 39.8
British Columbiaand Territories 79.5 87.9 82.8 36.4 50.3 60.3 29.3 30.4 31.3
Table D.A.1 ENERGY STAR® Qualified Appliances as a Percentage of Total Shipments in Canada,1999–2006

86 / Energy Consumption of Major Household Appliances Shipped in Canada
Appendix D / Detailed Tables
Table D.2 Distribution of Refrigerators by Type, by Region/Province, 2004–2006
Region/Province
Type 3 Type 5 Type 5A Type 7 Types 1, 2, 4, 6,11,132004 2005 2006 2004 2005 2006 2004 2005 2006 2004 2005 2006 2004 2005 2006
(%) (%) (%) (%) (%)
Canada 66.4 64.9 64.2 15.5 17.9 21.2 – – 0.6 11.0 9.6 10.1 7.0 7.6 3.8
Atlantic 83.2 81.3 80.9 6.4 8.0 8.2 – – 0.1 8.0 7.6 7.4 2.4 3.1 3.3
Quebec 69.5 68.9 65.8 18.8 20.9 25.3 – – 0.3 6.1 4.9 4.7 5.7 5.4 3.9
Ontario 64.5 62.6 64.2 14.6 17.7 19.9 – – 0.7 13.8 11.2 10.9 7.2 8.5 4.3
Prairies 69.2 65.5 59.5 13.6 17.6 22.5 – – 1.0 14.4 12.3 13.9 2.8 4.5 3.1
British Columbiaand Territories
59.6 56.5 63.4 13.6 15.6 19.0 – – 0.6 13.2 11.3 13.5 13.7 16.6 3.5
Table D.1 Average Annual Unit Energy Consumption of Refrigerators by Model Year
ModelYear
Standard-Size CompactType 1 Type 2 Type 3 Type 4 Type 5 Type 5A Type 6 Type 7 Type 11 Type 12 Type 13 Type 14 Type 15 Total
(kWh/yr) (kWh/yr) (kWh/yr)
1990 706.2 720.0 947.4 1321.4 1128.4 – – – 337.0 – 370.0 – – 956.2
1991 685.0 636.0 923.2 1218.8 1140.0 – – 1162.9 337.0 – 370.0 – – 931.2
1992 696.5 464.8 873.5 1215.1 1160.4 – – 1175.5 337.0 – 370.0 507.0 – 901.7
1993 512.4 477.4 702.4 889.3 782.5 – 772.2 953.2 337.0 – 370.0 – – 719.6
1994 461.8 465.0 640.5 764.0 741.8 – 763.4 891.5 328.7 – 370.0 – – 650.4
1995 382.7 465.0 630.8 768.6 752.6 – 743.4 865.6 330.6 – 370.0 – – 641.6
1996 378.4 465.0 620.8 767.7 776.9 – 781.2 833.7 318.1 – 370.0 – – 640.4
1997 397.2 465.0 635.0 773.7 631.1 – 818.9 860.6 317.0 – 370.0 – – 656.5
1998 422.3 478.2 640.9 792.3 673.2 – 839.9 870.0 320.8 419.0 432.1 – – 653.5
1999 403.7 – 635.9 798.7 665.1 – 771.6 870.9 322.4 419.0 430.0 – – 645.5
2000 413.2 – 629.3 781.1 660.9 – 742.9 862.8 323.4 419.0 430.0 – – 639.5
2001 403.0 – 544.1 701.2 610.2 – 707.2 725.9 330.6 419.0 430.0 – – 559.4
2002 323.5 – 485.6 646.9 547.0 – 604.1 659.2 331.1 419.0 405.0 – – 506.3
2003 321.0 – 460.8 625.2 522.4 – 553.5 636.7 323.1 419.0 326.7 – 463.0 487.1
2004 – – 458.4 582.6 496.0 – 554.0 619.8 321.3 419.0 356.7 – – 477.7
2005 321.0 – 453.8 566.0 493.2 – 550.8 611.2 327.8 419.0 406.6 – – 469.2
2006 319.1 – 455.4 548.4 497.9 580.1 – 613.1 328.6 – 339.1 – – 481.0

Trends for 1990–2006 / 87
Appendix D / Detailed Tables
Region/Province
Builder Retail
2004 2005 2006 2004 2005 2006(%) (%)
Canada 18.6 17.0 20.4 81.4 83.0 79.6
Atlantic 19.1 15.8 14.6 80.9 84.2 85.4
Quebec 6.3 5.6 6.7 93.7 94.4 93.3
Ontario 22.5 19.9 23.8 77.5 80.1 76.2
Prairies 20.8 19.1 23.4 79.2 80.9 76.6
British Columbia and Territories 36.1 32.3 37.1 63.9 67.7 62.9
Region/Province
Volume (cu. ft.)
<10.5 10.5–12.4 12.5–14.4 14.5–16.4
2004 2005 2006 2004 2005 2006 2004 2005 2006 2004 2005 2006(%) (%) (%) (%)
Canada 4.3 6.9 3.1 2.6 2.5 3.6 3.6 2.3 2.5 11.7 9.7 9.7
Atlantic 1.9 3.8 5.2 6.4 7.4 5.7 7.8 7.9 8.1 21.4 13.9 12.2
Quebec 4.3 4.8 3.3 2.0 1.8 2.1 2.8 2.1 2.0 8.0 6.6 6.6
Ontario 4.4 7.5 3.4 1.3 1.6 3.7 4.7 2.7 2.8 14.8 12.8 13.2
Prairies 0.6 3.7 1.4 2.8 2.4 3.1 3.0 1.6 1.6 10.5 8.7 8.4
British Columbiaand Territories 12.7 17.3 4.0 7.6 6.2 7.1 0.8 0.6 2.1 9.3 6.3 5.9
Region/Province
Volume (cu. ft.)
16.5–18.4 18.5–20.4 ≥20.5
2004 2005 2006 2004 2005 2006 2004 2005 2006(%) (%) (%)
Canada 39.5 41.7 39.9 14.0 15.2 17.3 24.2 21.7 23.9
Atlantic 40.3 47.1 47.9 9.4 8.3 9.2 12.9 11.5 11.7
Quebec 48.9 49.6 45.8 17.3 19.3 22.6 16.7 15.7 17.7
Ontario 34.6 37.9 37.3 12.9 14.1 15.5 27.3 23.3 24.1
Prairies 40.8 42.1 36.6 12.7 13.9 16.6 29.6 27.7 32.3
British Columbiaand Territories 29.1 32.4 38.6 13.8 13.7 15.9 26.7 23.5 26.4
Table D.4 Distribution of Refrigerators by Volume, by Region/Province, 2004−2006
Table D.3 Distribution of Refrigerators by Channel, by Region/Province, 2004−2006

88 / Energy Consumption of Major Household Appliances Shipped in Canada
Appendix D / Detailed Tables
Region/Province
Volume (cu. ft.)
<10.5 10.5–12.4 12.5–14.4 14.5–16.4
2004 2005 2006 2004 2005 2006 2004 2005 2006 2004 2005 2006(%) (%) (%) (%)
Canada 6.7 7.9 3.3 1.5 1.1 1.2 2.2 1.4 2.2 8.2 6.6 6.4
Atlantic 1.2 4.3 4.7 3.1 3.9 3.4 6.5 5.4 6.9 22.0 14.3 11.2
Quebec 4.5 4.7 3.2 0.6 0.7 0.6 2.5 1.9 1.7 7.0 5.7 5.5
Ontario 5.7 9.1 3.6 0.4 1.1 0.9 1.8 0.9 2.0 9.1 6.7 6.5
Prairies 0.7 4.1 1.7 0.9 0.7 1.1 3.1 1.4 1.6 8.9 6.8 6.7
British Columbiaand Territories 19.4 24.7 5.2 2.8 3.0 3.1 0.7 0.9 2.9 10.3 5.9 5.5
Region/Province
Volume (cu. ft.)
16.5–18.4 18.5–20.4 ≥20.5
2004 2005 2006 2004 2005 2006 2004 2005 2006(%) (%) (%)
Canada 39.9 42.3 40.2 16.5 17.5 20.5 25.0 23.0 26.2
Atlantic 41.7 50.4 50.7 10.9 9.2 10.2 14.7 12.5 13.0
Quebec 49.5 50.4 46.2 18.4 20.4 24.1 17.5 16.4 18.6
Ontario 35.7 38.7 39.0 15.3 17.0 18.9 32.0 26.7 29.0
Prairies 39.7 41.4 32.7 15.4 16.6 21.0 31.2 29.0 35.2
British Columbiaand Territories 24.2 28.2 37.1 17.2 15.6 19.6 25.4 21.7 26.5
Table D.5 Distribution of Refrigerators for Retail Shipments by Volume, by Region/Province,2004−2006

Trends for 1990–2006 / 89
Appendix D / Detailed Tables
Region/Province
Volume (cu. ft.)
<10.5 10.5–12.4 12.5–14.4 14.5–16.4
2004 2005 2006 2004 2005 2006 2004 2005 2006 2004 2005 2006(%) (%) (%) (%)
Canada 0.5 2.0 2.3 10.2 9.2 13.1 8.7 6.5 3.9 23.8 24.4 22.6
Atlantic 4.9 2.6 8.6 20.2 26.1 19.7 13.2 21.1 15.2 18.9 11.8 17.7
Quebec 0.3 7.2 4.1 23.4 21.1 21.8 7.6 7.0 6.7 22.2 22.0 21.1
Ontario 0.1 1.3 2.7 4.5 3.7 12.5 14.7 10.1 5.2 34.5 37.5 34.6
Prairies 0.3 1.8 0.4 9.9 9.7 9.8 2.7 2.4 1.6 17.0 16.4 14.1
British Columbiaand Territories 0.8 1.7 2.0 16.2 12.9 13.9 0.9 0.4 0.6 7.6 7.1 6.5
Region/Province
Volume (cu. ft.)
16.5–18.4 18.5–20.4 ≥20.5
2004 2005 2006 2004 2005 2006 2004 2005 2006(%) (%) (%)
Canada 36.3 38.5 38.6 4.1 4.0 4.6 16.4 15.4 14.9
Atlantic 34.6 28.9 31.4 3.2 3.3 3.2 5.1 6.3 4.2
Quebec 40.2 37.1 40.0 0.7 1.1 1.1 5.5 4.7 5.3
Ontario 30.8 35.0 32.0 4.6 2.8 4.6 10.9 9.7 8.5
Prairies 44.8 45.1 49.5 1.9 2.6 2.1 23.4 21.9 22.6
British Columbiaand Territories 37.9 41.2 41.2 7.6 9.7 9.6 29.0 27.1 26.3
Table D.6 Distribution of Refrigerators for Builder Shipments by Volume, by Region/Province,2004−2006

90 / Energy Consumption of Major Household Appliances Shipped in Canada
Appendix D / Detailed Tables
Region/Province
kWh/cu. ft. per year
<30 30–39.9 40–49.9 50–59.9 ≥60
2004 2005 2006 2004 2005 2006 2004 2005 2006 2004 2005 2006 2004 2005 2006(%) (%) (%) (%) (%)
Canada 82.6 86.7 88.6 11.0 6.5 8.5 1.3 0.2 0.9 0.2 0.2 0.3 5.0 6.4 1.7
Atlantic 83.3 80.5 79.4 11.9 16.1 17.6 3.7 0.3 1.6 0.0 0.3 0.2 1.1 2.9 1.3
Quebec 86.1 89.3 91.4 9.2 6.1 6.1 0.9 0.1 0.7 0.0 0.1 0.2 3.7 4.3 1.5
Ontario 84.1 87.1 87.9 10.7 5.4 8.6 0.8 0.1 1.1 0.0 0.2 0.4 4.4 7.2 2.1
Prairies 82.5 90.0 90.5 14.9 6.5 8.1 1.6 0.1 0.4 0.0 0.1 0.2 1.1 3.3 0.8
British Columbia and Territories
72.6 74.4 84.5 13.5 7.8 11.0 1.6 0.6 1.3 0.0 0.8 0.8 12.3 16.4 2.4
Table D.8 Average Annual Unit Energy Consumption of Refrigerators by Volume
Model Year
Volume (cu. ft.)
<10.5 10.5–12.4 12.5–14.4 14.5–16.4 16.5–18.4 18.5–20.4 ≥20.5(kWh/yr)
1990 593 740 850 955 1067 1133 1138
1991 401 727 877 915 1018 978 1080
1992 427 697 750 924 940 998 1124
1993 414 593 600 700 731 799 875
1994 378 563 547 627 665 720 817
1995 366 554 540 626 662 715 794
1996 375 547 570 631 646 680 762
1997 367 548 567 632 664 695 750
1998 329 564 562 629 675 703 755
1999 346 552 575 629 666 667 756
2000 359 550 583 625 667 637 730
2001 376 502 493 562 582 534 630
2002 339 433 428 480 521 489 586
2003 337 429 424 449 475 496 570
2004 335 432 420 455 465 487 551
2005 335 412 425 415 468 477 544
2006 357 417 434 423 467 489 551
Table D.7 Distribution of Refrigerators by Average Annual Unit Energy Consumption per Cubic Foot, by Region/Province, 2004−2006

Trends for 1990–2006 / 91
Appendix D / Detailed Tables
Model Year
Volume (cu. ft.)
<10.5 10.5–12.4 12.5–14.4 14.5–16.4 16.5–18.4 18.5–20.4 ≥20.5(kWh/cu. ft. per year)
1990 113 65 63 62 61 58 43
1991 76 64 65 59 58 50 41
1992 81 61 56 60 54 51 49
1993 79 52 45 45 42 41 40
1994 72 49 41 41 38 37 38
1995 70 48 40 41 38 37 36
1996 71 48 42 41 37 35 34
1997 70 48 42 41 38 36 33
1998 63 49 42 41 39 36 34
1999 66 48 43 41 38 34 34
2000 68 48 43 40 38 33 32
2001 72 44 37 36 33 27 28
2002 65 38 32 31 30 25 25
2003 64 38 32 29 27 26 25
2004 64 38 31 29 27 25 24
2005 64 36 32 27 27 25 24
2006 68 36 32 27 27 25 24
Table D.10 Average Annual Unit Energy Consumption of Refrigerators by Channel, by Region/Province, 2004−2006
Region/Province
Builder Retail
2004 2005 2006 2004 2005 2006(kWh/yr) (kWh/yr)
Canada 464.3 457.2 458.2 480.7 471.7 486.9
Atlantic 463.8 436.8 437.6 477.8 468.4 471.9
Quebec 455.6 437.5 445.7 471.7 468.0 475.6
Ontario 451.9 444.1 442.0 489.0 475.0 490.6
Prairies 477.8 475.1 477.8 497.1 480.8 498.9
British Columbia and Territories 483.3 479.0 480.5 469.2 450.8 489.0
Table D.9 Average Annual Unit Energy Consumption per Cubic Foot of Refrigerators by Volume

92 / Energy Consumption of Major Household Appliances Shipped in Canada
Appendix D / Detailed Tables
Table D.12 Annual Energy Savings for Refrigerators, 1992–2006
Region/Province
Builder Retail
2004 2005 2006 2004 2005 2006(%) (%)
Canada 81.4 83.8 79.9 82.8 87.3 90.8
Atlantic 71.9 61.3 60.5 86.0 84.2 82.6
Quebec 69.3 63.4 66.0 87.2 90.8 93.2
Ontario 84.0 88.9 79.9 84.2 86.6 90.3
Prairies 84.8 85.4 86.9 85.7 91.1 91.6
British Columbia and Territories 78.8 83.7 80.5 69.1 70.0 86.8
ModelYear
Energy Consumed WITHOUT Manufacturers’ Improvements, the MEPS and Improvements
to the MEPS
Energy Consumed WITH Manufacturers’ Improvements, the MEPS and Improvements
to the MEPS
AnnualEnergy Savings
CumulativeEnergy Savings
(with retirementfactor)
(PJ) (PJ) (PJ) (PJ)
1992 1.22 1.22 0.00 0.00
1993 1.59 1.27 0.32 0.32
1994 1.80 1.30 0.50 0.82
1995 1.77 1.26 0.51 1.33
1996 1.80 1.28 0.52 1.86
1997 1.96 1.43 0.53 2.39
1998 2.24 1.63 0.62 3.01
1999 2.58 1.84 0.73 3.74
2000 2.51 1.78 0.73 4.47
2001 2.63 1.63 1.00 5.47
2002 2.88 1.62 1.26 6.74
2003 2.93 1.59 1.35 8.09
2004 3.23 1.72 1.51 9.58
2005 3.36 1.75 1.61 11.13
2006 3.11 1.66 1.45 12.48
Table D.11 Distribution of Refrigerators Consuming Less Than 30 kWh/cu. ft. per Year, 2004–2006

Trends for 1990–2006 / 93
Appendix D / Detailed Tables
Region/Province
Type 8 Type 9 Type 10 Type 182004 2005 2006 2004 2005 2006 2004 2005 2006 2004 2005 2006
(%) (%) (%) (%)
Canada 29.4 30.4 28.5 8.3 10.7 8.7 45.5 35.7 45.6 16.8 23.2 17.2
Atlantic 19.8 20.8 25.7 10.2 8.2 6.9 38.0 37.0 29.0 32.0 34.1 38.4
Quebec 41.3 41.1 44.9 5.6 6.0 3.5 22.7 21.9 25.0 30.4 31.0 26.6
Ontario 28.2 26.7 31.6 17.8 13.4 10.1 18.9 19.9 22.6 35.1 39.8 35.7
Prairies 31.7 27.9 31.9 12.6 12.1 9.6 25.9 23.3 27.5 29.8 36.7 30.9
British Columbiaand Territories 30.0 28.8 30.0 15.0 14.6 14.3 30.8 28.5 26.8 24.1 28.1 28.9
Region/Province
kWh/cu. ft. per year
20–29.9 30–39.9 40–49.9 50–59.9
2004 2005 2006 2004 2005 2006 2004 2005 2006 2004 2005 2006(%) (%) (%) (%)
Canada 28.9 29.5 34.8 48.8 45.2 40.4 22.3 25.3 24.7 0.1 0.0 0.0
Atlantic 34.3 36.4 31.2 46.0 47.6 46.5 19.3 16.0 22.3 0.3 0.0 0.0
Quebec 27.9 29.9 36.6 51.3 48.7 45.7 20.7 21.4 17.6 0.1 0.0 0.0
Ontario 22.2 24.5 30.4 51.1 44.3 41.1 26.6 31.1 28.5 0.1 0.0 0.0
Prairies 33.2 31.9 40.2 47.3 45.6 36.1 19.5 22.5 23.8 0.0 0.0 0.0
British Columbiaand Territories 36.7 37.5 38.0 40.6 35.4 32.6 22.6 27.0 29.4 0.1 0.0 0.0
Table D.14 Distribution of Freezers by Average Annual Unit Energy Consumption per Cubic Foot,by Region/Province, 2004−2006
Table D.13 Distribution of Freezers by Type, by Region/Province, 2004−2006

94 / Energy Consumption of Major Household Appliances Shipped in Canada
Appendix D / Detailed Tables
Region/Province
Builder Retail
2004 2005 2006 2004 2005 2006
(%) (%)
Canada 1.8 2.1 2.0 98.2 97.9 98.0
Atlantic 0.9 1.6 0.5 99.1 98.4 99.5
Quebec 0.9 0.7 0.4 99.1 99.3 99.6
Ontario 0.5 0.4 0.3 99.5 99.6 99.7
Prairies 5.0 4.4 7.2 95.0 95.6 92.8
British Columbia and Territories 15.5 18.6 16.0 84.5 81.4 84.0
Table D.16 Average Annual Unit Energy Consumption of Freezers by Model Year
Model Year
Type 8 Type 9 Type 10 Type 18 Total
(kWh/yr) (kWh/yr)
1990 992.1 – 657.7 519.9 713.8
1991 706.4 1068.0 406.8 339.8 444.7
1992 670.4 1078.0 413.8 337.8 449.3
1993 581.3 863.3 368.2 287.8 401.7
1994 535.9 846.1 363.9 292.4 389.2
1995 508.9 817.1 353.2 282.0 381.6
1996 502.9 820.7 344.0 279.4 376.7
1997 494.8 823.7 341.9 278.7 376.5
1998 496.0 829.6 339.5 278.2 381.5
1999 492.1 838.6 337.5 276.3 383.4
2000 487.8 839.4 337.4 277.1 390.9
2001 447.6 740.5 336.7 275.7 383.9
2002 412.7 674.2 316.7 267.7 367.7
2003 414.8 665.4 317.8 268.3 369.1
2004 412.0 595.9 344.1 271.1 372.7
2005 420.8 650.1 351.8 269.1 385.6
2006 431.8 664.2 335.8 265.0 379.6
Table D.15 Distribution of Freezers by Channel, by Region/Province, 2004−2006

Trends for 1990–2006 / 95
Appendix D / Detailed Tables
ModelYear
Energy Consumed WITHOUT Manufacturers’ Improvements, the MEPS and Improvements
to the MEPS
Energy Consumed WITH Manufacturers’ Improvements, the MEPS and Improvements
to the MEPS
AnnualEnergySavings
CumulativeEnergy Savings
(with retirementfactor)
(PJ) (PJ) (PJ) (PJ)
1992 0.36 0.36 0.00 0.00
1993 0.38 0.34 0.04 0.04
1994 0.37 0.32 0.05 0.09
1995 0.32 0.28 0.05 0.14
1996 0.28 0.24 0.05 0.18
1997 0.31 0.26 0.05 0.23
1998 0.38 0.32 0.06 0.29
1999 0.40 0.34 0.06 0.35
2000 0.37 0.33 0.05 0.40
2001 0.38 0.32 0.06 0.45
2002 0.41 0.34 0.07 0.53
2003 0.40 0.33 0.07 0.60
2004 0.45 0.37 0.08 0.68
2005 0.43 0.37 0.06 0.74
2006 0.39 0.33 0.06 0.80
Table D.18 Distribution of Dishwashers by Average Annual Unit Energy Consumption, by Region/Province, 2004−2006
Region/Province
kWh/yr
<300 300–349.9 350–399.9 400–499.9 500–599.9 600–699.9
2004 2005 2006 2004 2005 2006 2004 2005 2006 2004 2005 2006 2004 2005 2006 2004 2005 2006(%) (%) (%) (%) (%) (%)
Canada 0.0 0.0 0.3 4.0 19.6 28.2 24.3 55.5 61.8 46.4 15.5 5.7 16.5 6.4 2.7 8.8 3.0 1.3
Atlantic 0.0 0.0 1.0 9.0 25.5 33.1 21.3 48.0 49.7 37.6 15.3 9.2 17.6 3.6 2.4 14.5 7.5 4.7
Quebec 0.0 0.0 1.1 4.0 21.9 26.3 28.0 59.7 66.8 43.0 11.9 3.5 17.7 4.7 2.0 7.5 1.8 0.4
Ontario 0.0 0.0 0.1 4.6 20.5 28.5 22.7 54.0 61.7 48.5 15.2 5.1 16.4 8.0 3.1 7.8 2.2 1.4
Prairies 0.0 0.0 0.0 2.7 15.2 25.8 23.5 59.2 64.2 48.5 16.9 6.3 15.5 5.0 2.6 9.8 3.8 1.1
British Columbiaand Territories
0.0 0.0 0.1 3.4 20.0 35.5 24.1 44.7 50.0 45.6 21.6 9.2 16.1 8.7 3.4 10.9 4.9 1.9
Table D.17 Annual Energy Savings for Freezers, 1992–2006

96 / Energy Consumption of Major Household Appliances Shipped in Canada
Appendix D / Detailed Tables
Region/Province
Builder Retail
2004 2005 2006 2004 2005 2006
(%) (%)
Canada 14.3 14.7 15.5 85.7 85.3 84.5
Atlantic 15.3 11.6 11.8 84.7 88.4 88.2
Quebec 3.0 2.9 3.3 97.0 97.1 96.7
Ontario 15.1 15.1 15.5 84.9 84.9 84.5
Prairies 16.7 16.8 18.8 83.3 83.2 81.2
British Columbia and Territories 32.3 35.9 33.9 67.7 64.1 66.1
Model Year kWh/yr
1990 1025.7
1991 959.0
1992 908.0
1993 913.5
1994 776.7
1995 670.9
1996 668.2
1997 649.2
1998 646.7
1999 640.1
2000 637.4
2001 633.7
2002 592.0
2003 523.9
2004 456.8
2005 395.7
2006 372.6
Table D.20 Average Annual Unit EnergyConsumption of Dishwashers by Model Year
Table D.19 Distribution of Dishwashers by Channel, by Region/Province, 2004−2006

Trends for 1990–2006 / 97
Appendix D / Detailed Tables
Region/Province
Builder Retail
2004 2005 2006 2004 2005 2006
(kWh/yr) (kWh/yr)
Canada 443.0 404.0 382.8 459.1 394.2 370.7
Atlantic 454.4 391.2 385.9 469.4 402.9 382.2
Quebec 449.2 417.0 386.8 454.3 386.5 367.3
Ontario 447.0 408.9 388.4 454.7 392.6 371.0
Prairies 442.1 396.4 381.2 465.2 399.3 371.8
British Columbia and Territories 434.6 404.2 376.3 472.6 408.4 372.6
ModelYear
Energy Consumed WITHOUT Manufacturers’ Improvements
and the MEPS
Energy Consumed WITH Manufacturers’ Improvements
and the MEPS
AnnualEnergySavings
CumulativeEnergy Savings (with
retirement factor)(PJ) (PJ) (PJ) (PJ)
1992 0.85 0.85 0.00 0.00
1993 0.89 0.90 -0.01 -0.01
1994 1.06 0.90 0.15 0.15
1995 1.04 0.77 0.27 0.42
1996 1.14 0.84 0.30 0.72
1997 1.18 0.84 0.34 1.06
1998 1.21 0.87 0.35 1.41
1999 1.45 1.02 0.43 1.84
2000 1.45 1.01 0.43 2.27
2001 1.45 1.01 0.44 2.71
2002 1.75 1.14 0.61 3.31
2003 1.81 1.04 0.77 4.05
2004 1.95 0.98 0.97 4.96
2005 2.07 0.90 1.17 6.03
2006 2.03 0.83 1.20 7.09
Table D.22 Annual Energy Savings for Dishwashers, 1992–2006
Table D.21 Average Annual Unit Energy Consumption of Dishwashers by Channel, by Region/Province, 2004−2006

98 / Energy Consumption of Major Household Appliances Shipped in Canada
Appendix D / Detailed Tables
Region/Province
Non-Self-Cleaning Self-Cleaning
2004 2005 2006 2004 2005 2006
(%) (%)
Canada 42.3 41.2 40.1 57.7 58.8 59.9
Atlantic 53.7 51.7 51.6 46.3 48.3 48.4
Quebec 40.4 37.6 31.8 59.6 62.4 68.2
Ontario 44.3 46.1 49.0 55.7 53.9 51.0
Prairies 39.7 36.5 32.7 60.3 63.5 67.3
British Columbia and Territories 40.7 38.6 35.5 59.3 61.4 64.5
Region/Province
kWh/yr
<500 500–549.9 550–599.9 600–649.9
2004 2005 2006 2004 2005 2006 2004 2005 2006 2004 2005 2006(%) (%) (%) (%)
Canada 27.8 44.9 47.9 11.4 20.8 22.4 1.9 5.4 14.2 4.8 4.6 3.3
Atlantic 18.4 36.8 44.6 13.3 20.6 24.7 1.3 9.2 19.5 2.3 2.8 1.0
Quebec 30.9 43.7 47.5 13.0 21.3 19.9 2.0 4.8 15.0 4.1 6.1 5.3
Ontario 25.9 45.6 48.1 10.3 20.4 22.5 2.0 5.7 13.2 5.0 3.9 2.4
Prairies 32.3 48.4 45.7 12.9 21.9 25.9 1.8 5.1 14.9 5.0 3.7 3.0
British Columbiaand Territories 19.3 42.6 53.6 5.8 17.9 20.2 1.4 4.6 12.2 6.8 5.4 3.3
Region/Province
kWh/yr
650–699.9 700–749.9 750–799.9 800–849.9
2004 2005 2006 2004 2005 2006 2004 2005 2006 2004 2005 2006(%) (%) (%) (%)
Canada 3.8 2.6 2.2 18.8 8.1 1.9 19.5 7.8 6.9 12.0 5.9 1.2
Atlantic 3.3 2.5 1.9 14.9 7.2 2.6 24.6 10.8 4.8 22.0 10.1 1.0
Quebec 4.1 3.0 2.6 18.1 8.5 1.6 16.0 4.5 6.8 11.8 8.0 1.3
Ontario 4.6 3.0 2.7 17.8 7.1 1.6 21.7 9.8 8.5 12.7 4.6 1.0
Prairies 2.3 1.4 1.1 18.8 7.3 2.5 17.8 7.6 5.7 9.1 4.6 1.3
British Columbiaand Territories 3.0 2.2 1.9 28.6 13.3 2.6 23.6 9.0 5.2 11.6 5.0 1.1
Table D.24 Distribution of Electric Ranges by Average Annual Unit Energy Consumption, by Region/Province, 2004−2006
Table D.23 Distribution of Electric Ranges by Type, by Region/Province, 2004−2006

Trends for 1990–2006 / 99
Appendix D / Detailed Tables
Region/Province
Builder Retail
2004 2005 2006 2004 2005 2006(%) (%)
Canada 21.5 22.1 26.9 78.5 77.9 73.1
Atlantic 19.5 17.3 17.4 80.5 82.7 82.6
Quebec 6.6 6.5 8.7 93.4 93.5 91.3
Ontario 28.2 29.1 33.2 71.8 70.9 66.8
Prairies 22.6 23.6 31.0 77.4 76.4 69.0
British Columbia and Territories 42.8 43.5 43.9 57.2 56.5 56.1
ModelYear
Non-Self-Cleaning
Self-Cleaning Total
(kWh/yr) (kWh/yr)
1990 785.7 726.8 772.2
1991 787.4 755.1 778.1
1992 788.3 754.1 778.6
1993 795.2 751.5 782.1
1994 785.4 746.6 773.6
1995 778.3 756.4 771.3
1996 780.3 762.5 774.4
1997 780.2 758.5 772.4
1998 778.5 759.6 770.8
1999 770.3 741.8 758.7
2000 770.7 746.3 759.9
2001 785.7 741.2 762.5
2002 783.9 735.2 756.0
2003 732.1 691.0 709.4
2004 694.1 622.4 652.7
2005 593.2 558.0 572.5
2006 558.9 522.7 537.2
Table D.26 Average Annual Unit EnergyConsumption of Electric Ranges by Model Year
Table D.25 Distribution of Electric Ranges by Channel, by Region/Province, 2004−2006

100 / Energy Consumption of Major Household Appliances Shipped in Canada
Appendix D / Detailed Tables
Region/Province
Builder Retail
2004 2005 2006 2004 2005 2006
(kWh/yr) (kWh/yr)
Canada 730.9 604.5 541.3 631.3 563.5 535.7
Atlantic 709.5 595.3 524.5 677.8 590.0 535.1
Quebec 714.3 620.3 562.1 625.9 563.8 537.4
Ontario 739.5 612.4 551.4 634.6 560.5 532.2
Prairies 724.1 586.1 532.7 610.2 553.3 538.2
British Columbia and Territories 728.7 600.3 518.2 684.2 587.8 538.7
ModelYear
Energy Consumed WITHOUTManufacturers’ Improvements
and the MEPS
Energy Consumed WITHManufacturers’ Improvements
and the MEPS
AnnualEnergySavings
Cumulative EnergySavings (with
retirement factor)(PJ) (PJ) (PJ) (PJ)
1992 0.94 0.94 0.00 0.00
1993 1.13 1.14 -0.01 -0.01
1994 1.09 1.08 0.01 0.00
1995 0.96 0.95 0.01 0.01
1996 1.15 1.14 0.01 0.02
1997 1.25 1.24 0.01 0.03
1998 1.35 1.34 0.01 0.04
1999 1.39 1.36 0.04 0.08
2000 1.35 1.31 0.03 0.11
2001 1.34 1.32 0.03 0.14
2002 1.67 1.63 0.05 0.18
2003 1.81 1.65 0.16 0.35
2004 1.97 1.65 0.32 0.66
2005 1.90 1.39 0.50 1.17
2006 1.77 1.22 0.55 1.72
Table D.28 Annual Energy Savings for Electric Ranges, 1992–2006
Table D.27 Average Annual Unit Energy Consumption of Electric Ranges by Channel, by Region/Province, 2004−2006

Trends for 1990–2006 / 101
Appendix D / Detailed Tables
Region/Province
Front-Loading Clothes Washers Top-Loading Clothes Washers
2004 2005 2006 2004 2005 2006
(%) (%)
Canada 29.2 42.3 46.9 70.8 57.7 53.1
Atlantic and Quebec 22.8 36.2 39.0 77.2 63.8 61.0
Ontario 27.7 45.4 50.5 72.3 54.6 49.5
Prairies 28.9 44.9 49.2 71.1 55.1 50.8
British Columbia and Territories 30.2 48.6 59.1 69.8 51.4 40.9
Region/Province
kWh/yr
<400 400–499.9 500–599.9 600–699.9
2004 2005 2006 2004 2005 2006 2004 2005 2006 2004 2005 2006(%) (%) (%) (%)
Canada 35.7 48.3 54.6 2.5 3.4 11.5 16.6 28.3 19.8 10.0 7.8 7.3
Atlantic andQuebec 27.7 41.8 47.2 1.5 3.0 15.0 19.9 35.3 22.3 8.5 6.6 8.4
Ontario 36.9 52.5 58.1 3.9 4.3 10.6 16.5 23.5 17.9 11.6 8.3 6.5
Prairies 35.9 50.0 57.2 2.2 2.9 8.8 16.5 28.1 22.0 10.0 7.4 6.3
British Columbiaand Territories 35.6 53.0 62.9 3.2 2.8 8.2 11.0 17.9 9.9 16.8 12.1 9.2
Region/Province
kWh/yr
700–799.9 800–899.9 900–999.9
2004 2005 2006 2004 2005 2006 2004 2005 2006(%) (%) (%)
Canada 8.3 4.4 3.4 10.2 2.4 0.8 16.7 5.5 2.7
Atlantic andQuebec 8.7 4.9 3.4 11.6 3.1 0.5 22.1 5.3 3.2
Ontario 6.9 4.1 3.7 9.9 1.9 0.4 14.3 5.5 2.8
Prairies 9.1 4.4 2.6 12.0 2.2 1.4 14.3 4.9 1.7
British Columbiaand Territories 7.4 3.9 4.8 5.7 1.7 1.4 20.3 8.6 3.6
Table D.30 Distribution of Clothes Washers by Average Annual Unit Energy Consumption, by Region/Province, 2004−2006
Table D.29 Distribution of Clothes Washers by Type, by Region/Province, 2004−2006

102 / Energy Consumption of Major Household Appliances Shipped in Canada
Appendix D / Detailed Tables
Region/Province
Builder Retail
2004 2005 2006 2004 2005 2006
(%) (%)
Canada 5.8 5.7 5.7 94.2 94.3 94.3
Atlantic and Quebec 2.0 1.9 1.6 98.0 98.1 98.4
Ontario 6.4 5.6 6.0 93.6 94.4 94.0
Prairies 8.5 8.1 7.9 91.5 91.9 92.1
British Columbia and Territories 18.5 16.7 15.6 81.5 83.3 84.4
Table D.32 Average Annual Unit EnergyConsumption of Clothes Washers by Model Year
ModelYear
Front-LoadingClothes Washers
Top-LoadingClothes Washers Total
(kWh/yr) (kWh/yr)
1990 – – 1218.0
1991 – – 1197.4
1992 – – 1175.5
1993 – – 1094.1
1994 – – 989.1
1995 – – 965.9
1996 – – 948.7
1997 – – 930.1
1998 – – 903.3
1999 – – 859.9
2000 274.2 922.7 838.3
2001 287.0 904.7 810.1
2002 300.6 871.1 779.2
2003 274.8 826.9 708.4
2004 258.4 702.3 572.9
2005 218.8 608.8 443.6
2006 202.7 555.0 389.6
Table D.31 Distribution of Clothes Washers by Channel, by Region/Province, 2004−2006

Trends for 1990–2006 / 103
Appendix D / Detailed Tables
Model Year
Energy Consumed WITHOUT Manufacturers’ Improvements
and the MEPS
Energy Consumed WITHManufacturers’ Improvements
and the MEPS
AnnualEnergySavings
Cumulative EnergySavings (with
retirement factor)(PJ) (PJ) (PJ) (PJ)
1992 1.70 1.70 0.00 0.00
1993 1.80 1.67 0.12 0.12
1994 1.94 1.64 0.31 0.43
1995 1.84 1.51 0.33 0.76
1996 1.93 1.56 0.37 1.13
1997 2.14 1.69 0.45 1.58
1998 2.16 1.66 0.50 2.08
1999 2.43 1.78 0.65 2.73
2000 2.50 1.78 0.72 3.45
2001 2.60 1.79 0.81 4.26
2002 2.81 1.87 0.95 5.20
2003 2.92 1.76 1.16 6.32
2004 3.10 1.51 1.59 7.84
2005 3.31 1.25 2.06 9.79
2006 3.23 1.07 2.16 11.80
Table D.34 Annual Energy Savings for Clothes Washers, 1992–2006
Region/Province
Builder Retail
2004 2005 2006 2004 2005 2006
(kWh/yr) (kWh/yr)
Canada 653.0 529.9 499.9 568.0 438.4 382.9
Atlantic and Quebec 651.1 513.7 526.0 629.0 469.8 415.7
Ontario 641.0 510.4 475.6 550.7 420.7 369.1
Prairies 706.3 588.9 550.5 556.0 419.1 362.3
British Columbia and Territories 590.7 475.6 449.8 585.3 428.3 352.4
Table D.33 Average Annual Unit Energy Consumption of Clothes Washers by Channel,by Region/Province, 2004−2006

104 / Energy Consumption of Major Household Appliances Shipped in Canada
Appendix D / Detailed Tables
Region/Province
kWh/yr
<800 800–899.9 900–949.9 950–999.9
2004 2005 2006 2004 2005 2006 2004 2005 2006 2004 2005 2006(%) (%) (%) (%)
Canada 4.0 6.1 6.1 4.4 3.2 2.8 75.3 74.1 69.8 16.3 16.6 21.2
Atlantic andQuebec 1.8 3.7 3.9 3.6 2.6 2.0 82.1 81.0 79.4 12.4 12.7 14.7
Ontario 5.9 7.9 7.2 6.3 4.7 4.2 69.7 69.9 66.4 18.1 17.5 22.1
Prairies 2.8 4.6 4.9 3.4 2.1 1.9 74.8 72.9 63.2 19.0 20.4 29.9
British Columbiaand Territories 9.4 14.8 14.7 5.5 3.3 3.0 65.1 64.6 62.9 19.9 17.4 19.5
Region/Province
Builder Retail
2004 2005 2006 2004 2005 2006
(%) (%)
Canada 6.3 6.1 5.9 93.7 93.9 94.1
Atlantic and Quebec 2.0 1.9 1.5 98.0 98.1 98.5
Ontario 7.2 6.4 6.4 92.8 93.6 93.6
Prairies 8.9 8.5 8.1 91.1 91.5 91.9
British Columbia and Territories 18.9 17.3 15.4 81.1 82.7 84.6
Table D.36 Distribution of Electric Clothes Dryers by Channel, by Region/Province, 2004−2006
Table D.35 Distribution of Electric Clothes Dryers by Average Annual Unit Energy Consumption,by Region/Province, 2004−2006

Trends for 1990–2006 / 105
Appendix D / Detailed Tables
Model Year kWh/yr
1990 1102.6
1991 1108.7
1992 983.3
1993 928.5
1994 910.4
1995 909.1
1996 887.4
1997 887.3
1998 900.2
1999 907.5
2000 909.8
2001 916.3
2002 915.6
2003 914.2
2004 911.9
2005 903.8
2006 904.6
Region/Province
Builder Retail
2004 2005 2006 2004 2005 2006
kWh/yr kWh/yr
Canada 843.1 832.2 821.4 916.5 908.5 909.7
Atlantic and Quebec 836.2 827.3 868.6 924.1 917.0 915.6
Ontario 817.1 796.4 803.1 907.7 900.5 904.9
Prairies 870.1 865.3 853.7 923.6 918.0 918.7
British Columbia and Territories 851.3 838.9 783.7 892.1 865.2 877.2
Table D.38 Average Annual Unit Energy Consumption of Electric Clothes Dryers by Channel, by Region/Province, 2004−2006
Table D.37 Average Annual Unit EnergyConsumption of Electric Clothes Dryers byModel Year

106 / Energy Consumption of Major Household Appliances Shipped in Canada
Appendix D / Detailed Tables
Model Year
Energy Consumed WITHOUTManufacturers’ Improvements
and the MEPS
Energy Consumed WITHManufacturers’ Improvements
and the MEPS
AnnualEnergySavings
Cumulative EnergySavings (with
retirement factor)(PJ) (PJ) (PJ) (PJ)
1992 1.23 1.23 0.00 0.00
1993 1.27 1.20 0.07 0.07
1994 1.31 1.21 0.10 0.17
1995 1.15 1.07 0.09 0.25
1996 1.27 1.15 0.12 0.38
1997 1.39 1.26 0.14 0.51
1998 1.41 1.29 0.12 0.63
1999 1.59 1.47 0.12 0.76
2000 1.64 1.52 0.12 0.88
2001 1.73 1.62 0.12 1.00
2002 1.96 1.82 0.13 1.13
2003 2.02 1.88 0.14 1.27
2004 2.18 2.02 0.16 1.43
2005 2.36 2.17 0.19 1.62
2006 2.40 2.21 0.19 1.81
Model Year
Energy Consumed WITHOUTManufacturers’ Improvements
and the MEPS
Energy Consumed WITHManufacturers’ Improvements
and the MEPS
AnnualEnergySavings
Cumulative EnergySavings (with
retirement factor)(PJ) (PJ) (PJ) (PJ)
1992 6.30 6.30 0.00 0.00
1993 7.05 6.51 0.55 0.55
1994 7.57 6.45 1.12 1.66
1995 7.09 5.84 1.26 2.92
1996 7.58 6.21 1.37 4.29
1997 8.23 6.72 1.51 5.80
1998 8.75 7.10 1.66 7.46
1999 9.84 7.81 2.03 9.49
2000 9.81 7.73 2.08 11.57
2001 10.15 7.70 2.45 14.02
2002 11.49 8.41 3.08 17.09
2003 11.90 8.25 3.65 20.68
2004 12.88 8.25 4.63 25.16
2005 13.43 7.83 5.60 30.48
2006 12.93 7.32 5.61 35.67
Table D.40 Annual Energy Savings for All Major Household Appliances, 1992–2006
Table D.39 Annual Energy Savings for Electric Clothes Dryers, 1992–2006


