58
Shock, Ballistic and Blast Properties of Granular Materials. W.G. Proud [email protected] Coimbra June 2016 – Invited Talk

Shock, Ballistic and Blast Properties of
Granular Materials.
W.G. Proud
Coimbra June 2016 – Invited Talk
Acknowledgements
Dr. David Chapman – ISP
Dr. Daniel Eakins - ISP
Dr. William Neal – Imperial – AWE
Dr. Chris Braithwaite – Cavendish Laboratory
Dr. David Williamson – Cavendish Laboratory
Dr. John Addiss – Cavendish Laboratory – Mewburn Ellis
Dr. Adam Collins – Cavendish Laboratory – UCLA
Dr. Gareth Collins – Imperial (ESE – AMCG)
Dr. Stephen Grantham – Cavendish Laboratory – Granta
Dr. Tim Goldrein – Cavendish Laboratory - Innovia
Prof. John Borg – Marquette
Prof. Vitali Nesterenko – UCSD
Dr / Prof. Rafi Blumenfeld – Imperial – NUDT, Changsha, China
Technicians – Cavendish Laboratory and Imperial College London, Dave
Johnson, Daniel Cross, Ray Flaxman, Steve Johnson
AWE / NSWC / QinetiQ / dstl / EOARD / MoD / Imperial College London
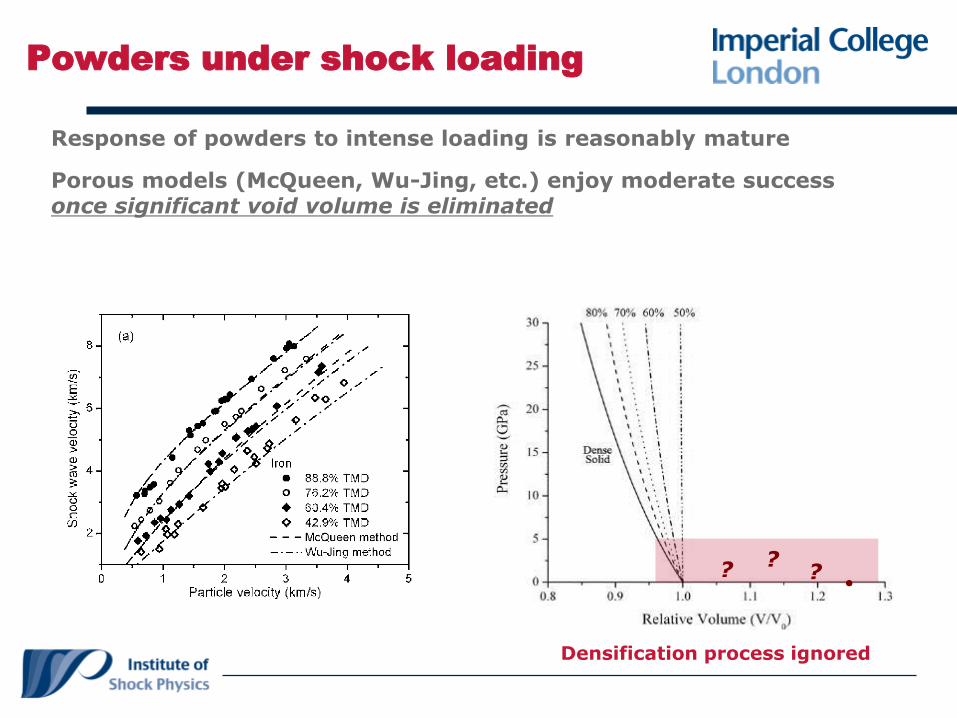
Powders under shock loading
Response of powders to intense loading is reasonably mature
??
?
Porous models (McQueen, Wu-Jing, etc.) enjoy moderate success once significant void volume is eliminated
Densification process ignored

Densification at low stresses
Several regions associated with the densification of granular materials
under shock compression: rigid / compaction / bulk plastic
Models for compaction are generally exercises in curve-fitting,
insensitive to microstructure
Borg and Vogler, MSMSE 2009
V.D. Linse, Metallurgical application of shock-wave and high-strain-rate phenomena

Compaction
ENERGY DISSIPATION
• Compaction energy associated with porosity removal.
• Quasi-static or dynamic – Benson et al. JAP 1997
• Processes present in quasi-static compaction.
• Processes ONLY in dynamic compaction.Meyers. Benson & Olevsky. Shock Consolidation:Microstructurally-Based Analysis and ComputationalModeling. Acta matter 1999,
COMPACTION
• States with porosity.
• Significant energy absorption.
• Dominated by meso-structure of granular
material.
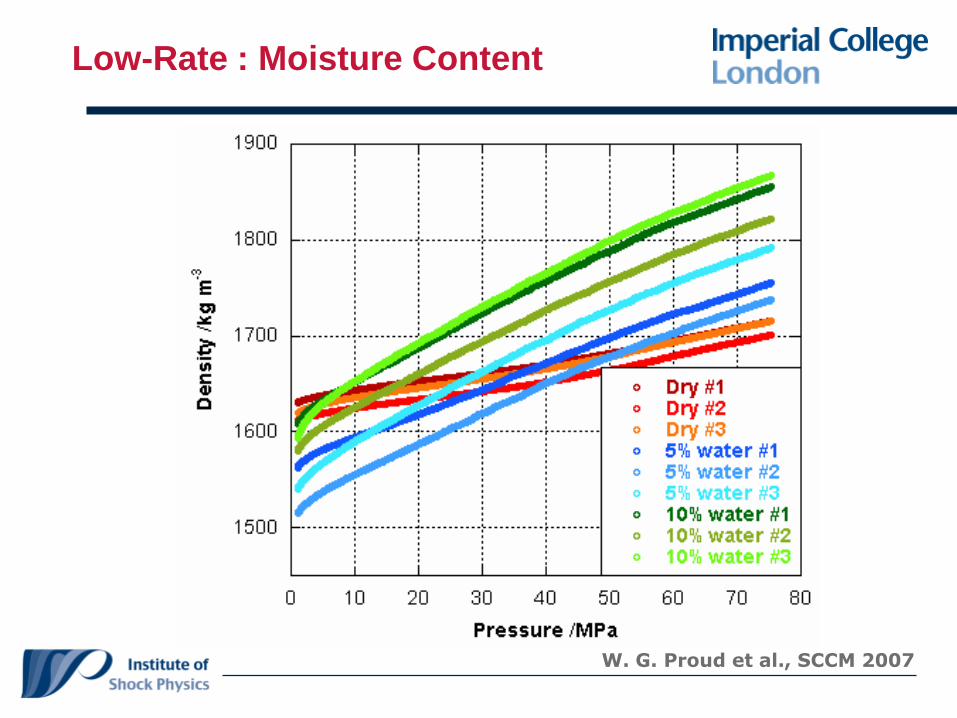
Low-Rate : Moisture Content
W. G. Proud et al., SCCM 2007
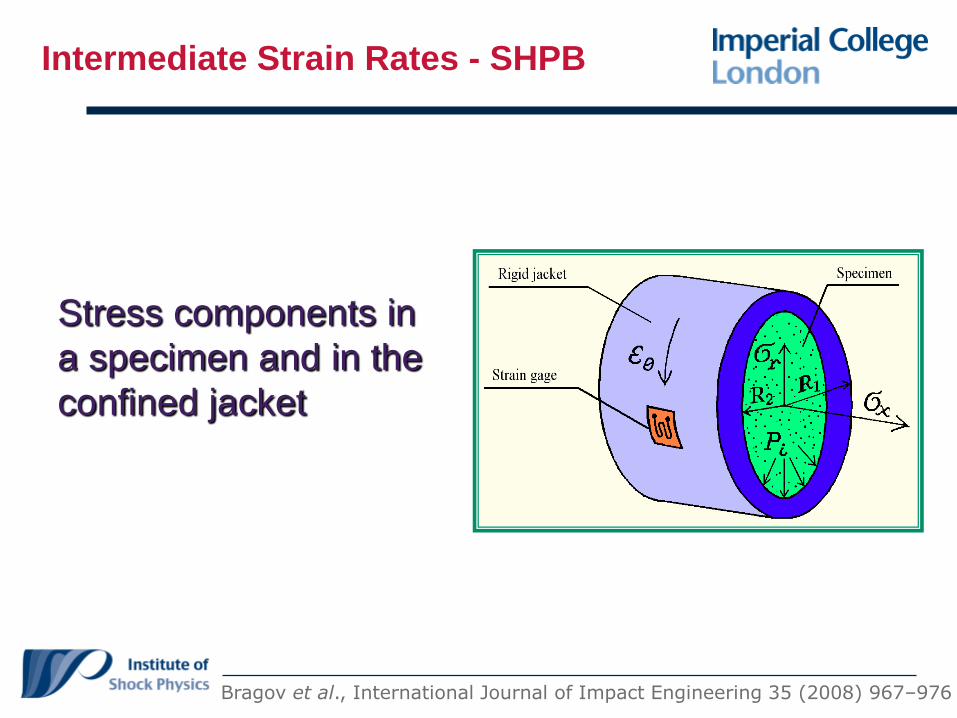
Intermediate Strain Rates - SHPB
Stress components in
a specimen and in the
confined jacket
Bragov et al., International Journal of Impact Engineering 35 (2008) 967–976
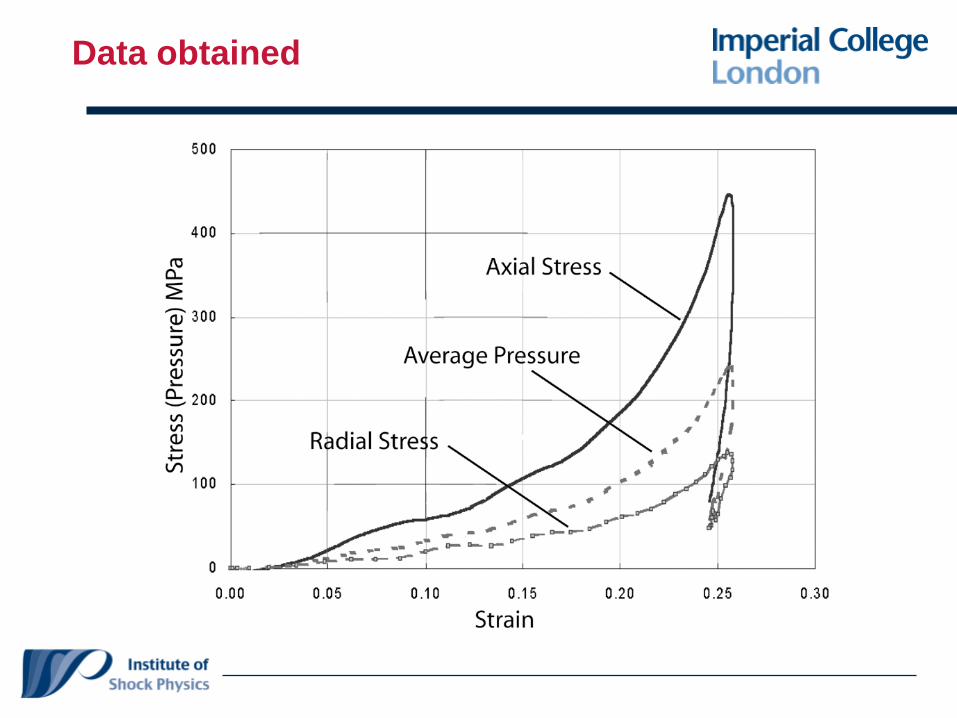
Data obtained
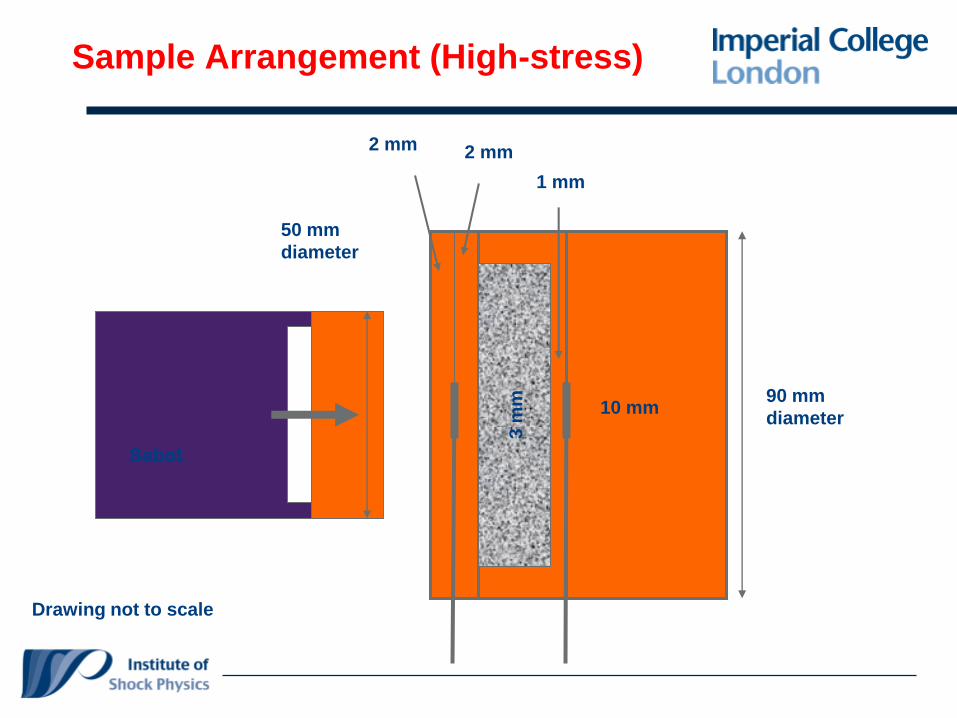
Sample Arrangement (High-stress)
2 mm
1 mm
3 m
m 10 mm90 mm
diameter
50 mm
diameter
Drawing not to scale
2 mm
Sabot

Plate-impact experiments
Multiple powder targets subjected to identical loading
8 HetV channels and two pins to measure sabot velocity, impact and breakout tilt, and target particle velocity
D. Eakins et al. SCCM 2011
Measured tilt < 2 mrad
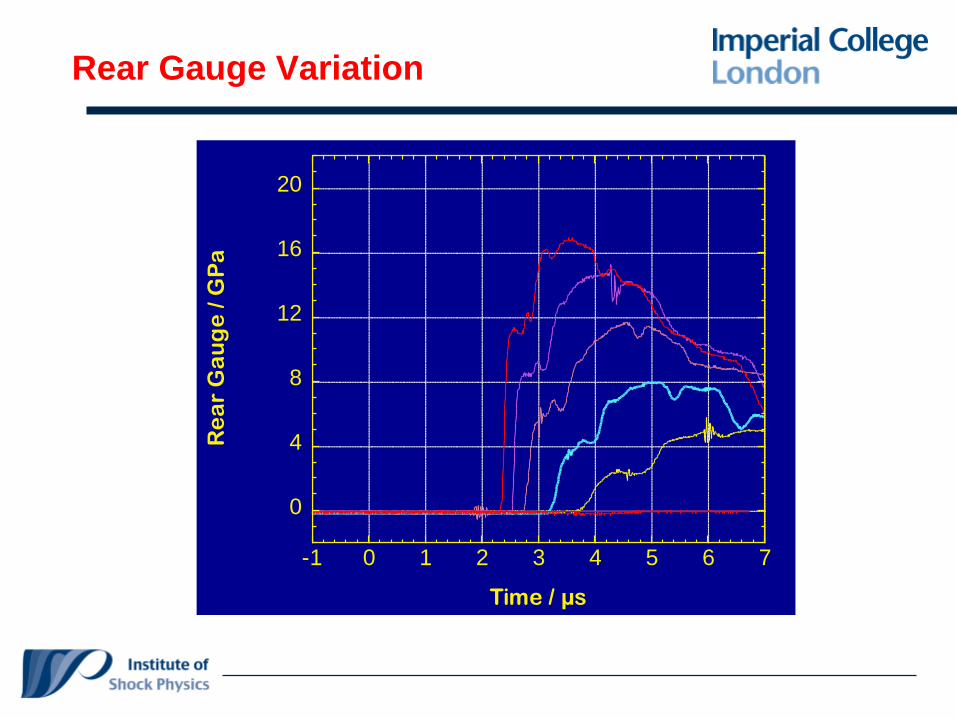
Rear Gauge Variation
0
4
8
12
16
20
-1 0 1 2 3 4 5 6 7
Re
ar
Ga
ug
e /
GP
a
Time / µs
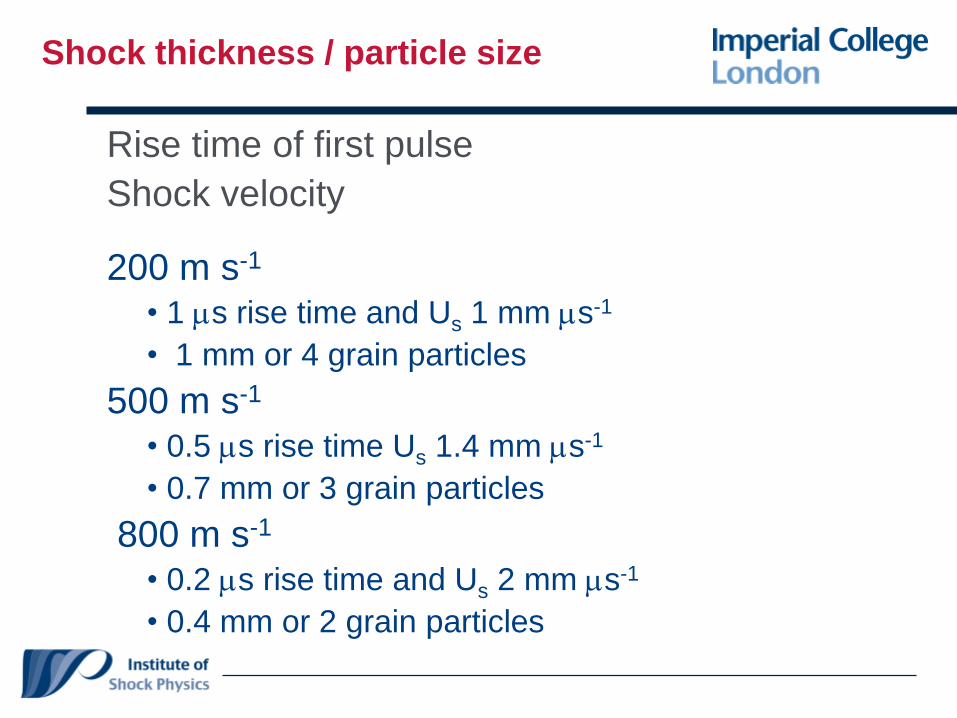
Shock thickness / particle size
Rise time of first pulse
Shock velocity
200 m s-1
• 1 ms rise time and Us 1 mm ms-1
• 1 mm or 4 grain particles
500 m s-1
• 0.5 ms rise time Us 1.4 mm ms-1
• 0.7 mm or 3 grain particles
800 m s-1
• 0.2 ms rise time and Us 2 mm ms-1
• 0.4 mm or 2 grain particles

Results Combined Stress + Pressure

Initial Conclusions
• A given granular material compaction behaviour is
self-consistent across the range of strain rates
• Probably due to the system being able to move from
one compaction process to another in a ‘smooth’
fashion.
• Quantitative prediction of the compaction process is
difficult and often a case of post-experiment curve
fitting.
• However – this is very much a first-order
approximation!
• So can we look at some aspects in more detail?
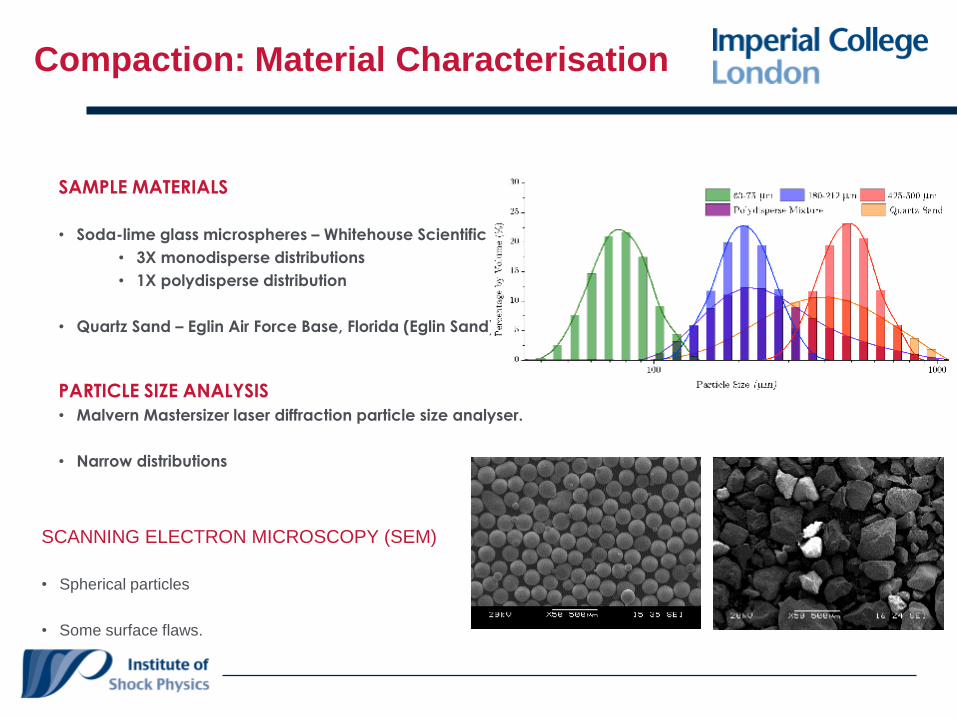
Compaction: Material Characterisation
SCANNING ELECTRON MICROSCOPY (SEM)
• Spherical particles
• Some surface flaws.
PARTICLE SIZE ANALYSIS
• Malvern Mastersizer laser diffraction particle size analyser.
• Narrow distributions
SAMPLE MATERIALS
• Soda-lime glass microspheres – Whitehouse Scientific Ltd.
• 3X monodisperse distributions
• 1X polydisperse distribution
• Quartz Sand – Eglin Air Force Base, Florida (Eglin Sand)
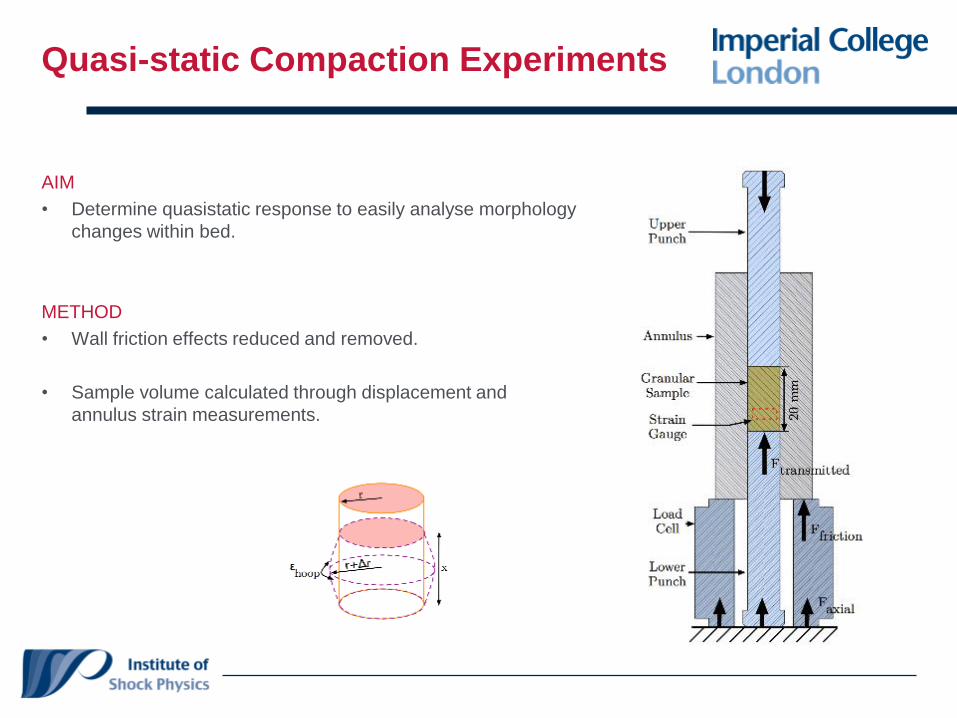
Quasi-static Compaction Experiments
AIM
• Determine quasistatic response to easily analyse morphology
changes within bed.
METHOD
• Wall friction effects reduced and removed.
• Sample volume calculated through displacement and
annulus strain measurements.
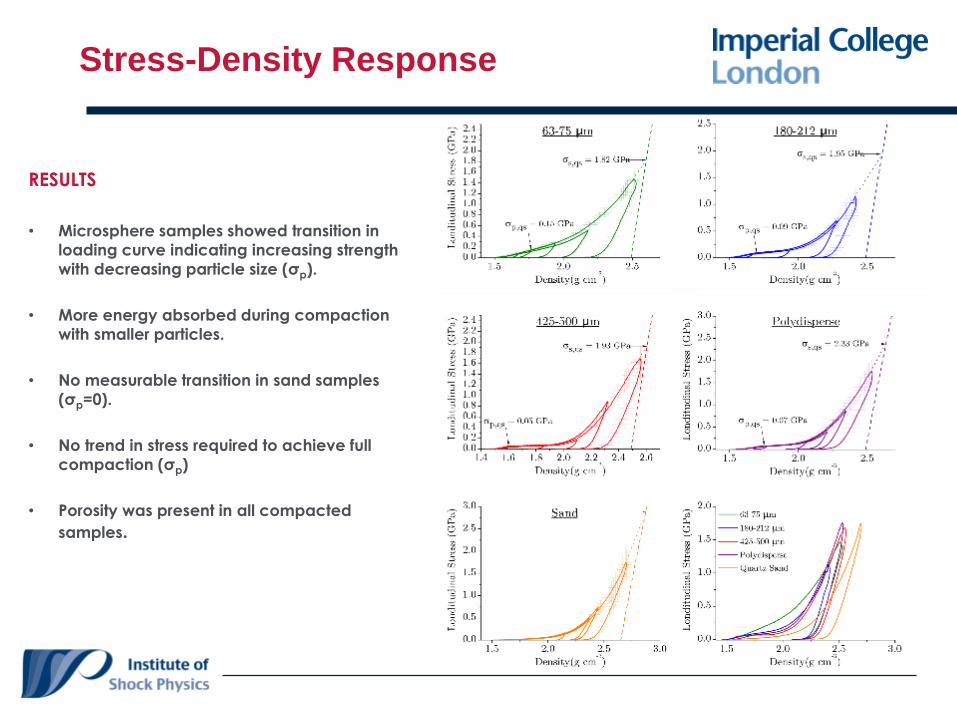
Stress-Density Response
RESULTS
• Microsphere samples showed transition in
loading curve indicating increasing strength
with decreasing particle size (σp).
• More energy absorbed during compaction
with smaller particles.
• No measurable transition in sand samples
(σp=0).
• No trend in stress required to achieve full
compaction (σp)
• Porosity was present in all compacted
samples.

Post Loading Analysis
SPHERES
• No fracture seen in stresses below σp.
• Fracture initiates at σp
• Large amount of whole spheres beyond σp.
SAND PARTICLES
• Constant fracture even at minute loads.
• Difficult to determine which particles fractured
σp

Particle Fracture Modes
W. Cooper and B. Breaux. Grain fracture in rapid particulate media deformation and a particulate media research roadmap from the PMEE workshops. Int J Fract. 2010
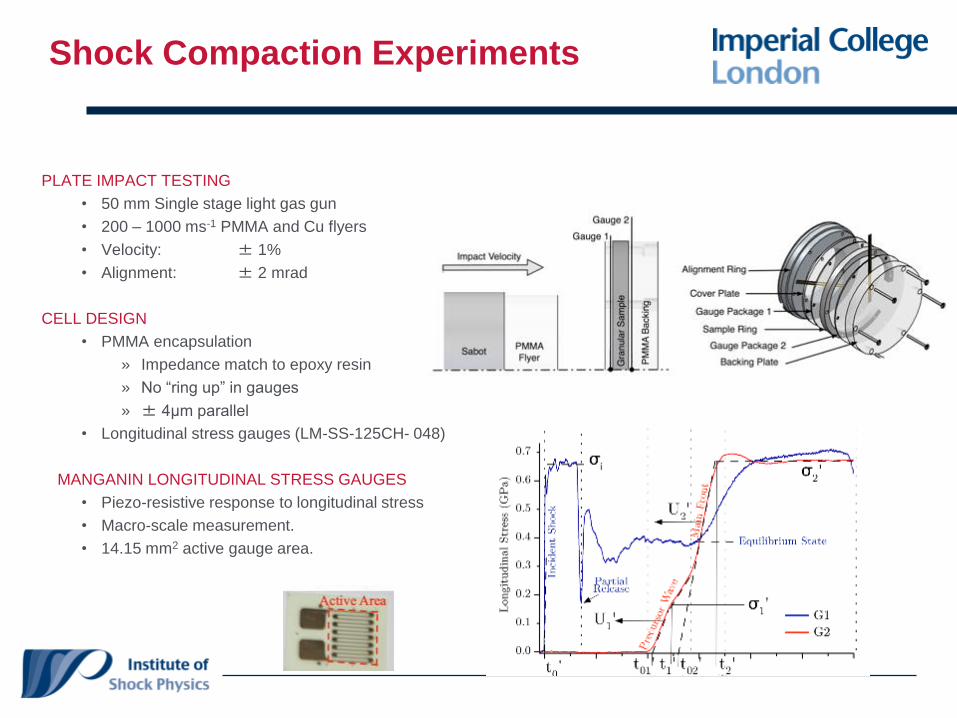
Shock Compaction Experiments
PLATE IMPACT TESTING
• 50 mm Single stage light gas gun
• 200 – 1000 ms-1 PMMA and Cu flyers
• Velocity: ± 1%
• Alignment: ± 2 mrad
CELL DESIGN
• PMMA encapsulation
» Impedance match to epoxy resin
» No “ring up” in gauges
» ± 4μm parallel
• Longitudinal stress gauges (LM-SS-125CH- 048)
MANGANIN LONGITUDINAL STRESS GAUGES
• Piezo-resistive response to longitudinal stress
• Macro-scale measurement.
• 14.15 mm2 active gauge area.
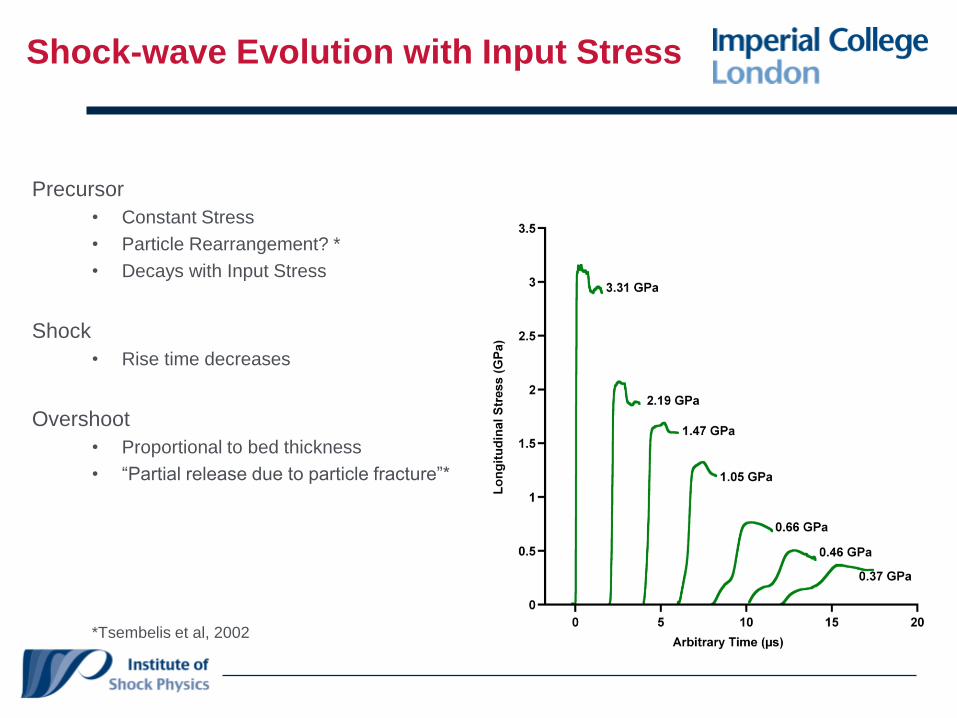
Shock-wave Evolution with Input Stress
Precursor
• Constant Stress
• Particle Rearrangement? *
• Decays with Input Stress
Shock
• Rise time decreases
Overshoot
• Proportional to bed thickness
• “Partial release due to particle fracture”*
*Tsembelis et al, 2002

Precursor Evolution – Bed Thickness
σ i= 0.66
GPa
σ i= 1.47
GPa
σ i= 0.46
GPa

Particle Size Effects
Prior Understanding
• Hugoniot is not affected by particle size (metal
powders*)
• Shock-wave thickness is proportional to
particle size (metal powders*)
Current Conclusions
• Shock thickness is affected by particle size
(mono-disperse) or some length scale
• Clear difference in shock TOA (Us)
Ongoing Investigation
• Bi-dispersity
• Reduced porosity
• Particle size or pore size dependent
*Nesterenko, 2001

Shock Compaction Curves
ANALYSIS PROCESS
• Linear fits to transmitted wave profiles.
• Wave velocity measured and jumps applied to infer
densification.
• Relatively insensitive to wave magnitude
COMPACTION CURVES
• Precursor wave inferred initial jump.
• Magnitude increased with decreasing particle size.
• Microsphere curves intersected porous Hugoniots.
• No measureable precursor wave in sand.
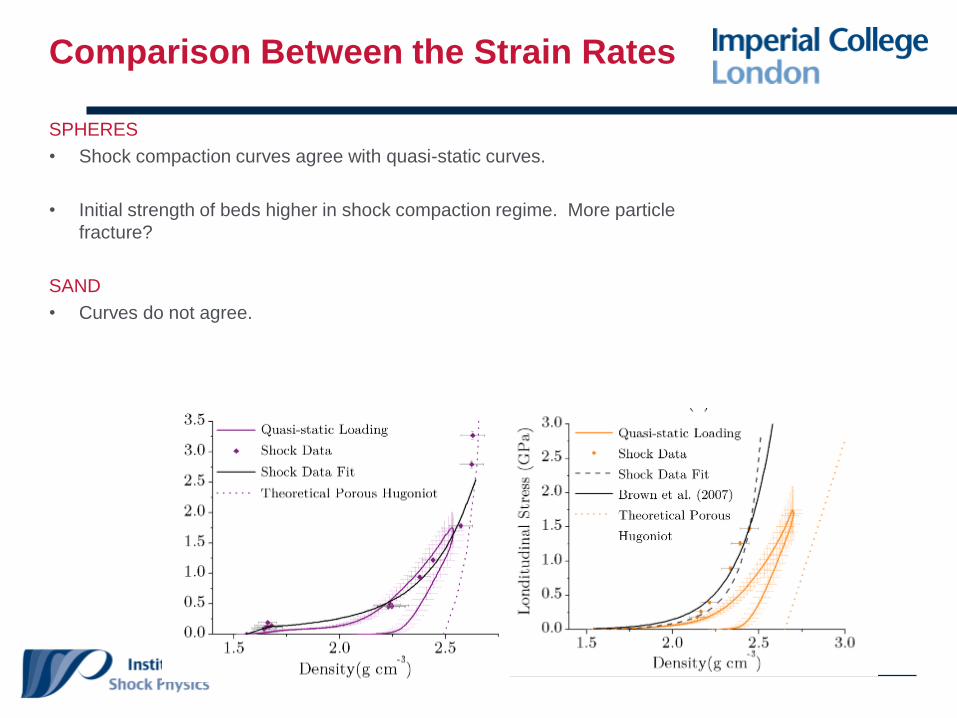
Comparison Between the Strain Rates
SPHERES
• Shock compaction curves agree with quasi-static curves.
• Initial strength of beds higher in shock compaction regime. More particle
fracture?
SAND
• Curves do not agree.
Conclusions (Compaction)
The compaction response is affected by particle size.
Beds of smaller particles have an increased macro-scale strength due to a likely increase in load carrying contacts at a boundary despite a reduced particle strength.
The compaction wave profile affected by particle size
The wave duration and features are dominated by particle size. The particle-elastic-limit of a bed produces a precursor feature.
Compaction of Brittle granular materials
There are fracture dominated processes that are controlled by particle morphology. Beds of regularly shaped particles favoured an energy expensive total-fracture mechanism while irregular shaped particles abraded and rearranged thus consuming far less energy.
Quasi-static versus Dynamic processes
There was agreement with the low and high strain-rate loading data for spherical glass particles. The quartz sand data indicates there was a significant contribution from dynamic-only processes.

Ballistic Experiments
(2001 onwards)
The use of digital speckle radiography to investigate the internal flow fields during the ballistic penetration of sandJ.W. Addiss , A.L. Collins , S.M. Walley*, W.G. Proud (2015)

Sand Experiments
Digital Speckle Radiography
Digital Image Correlation
Flash X-rays
Embedded Particles
300 mm to 600 mm sand grains
60 70 30 mm3 PMMA container
30 mm depth of sand
Copper rods 50 mm 5.0 mm , mass 8 g, v100 ms-1

Experimental Setup
• Cylindrical sample of sand, 150 mm long and 100 mm diameter.
• Horizontal layer of randomly scattered lead pieces running along the length of the cylinder (in the central plane)
• Projectiles launched at 200 m/s using a light gas gun
• 10 mm diameter, 100 mm length, 55g and flat ended

Experimental Setup
• Flash x-ray head mounted above sample used to take x-rays before and during penetration
• Series of experiments carried out to build up a sequence of images showing the penetration
• X-ray images analysed with a DICC algorithm to calculate displacements

Measured Displacements
250us after impact 450us after impact
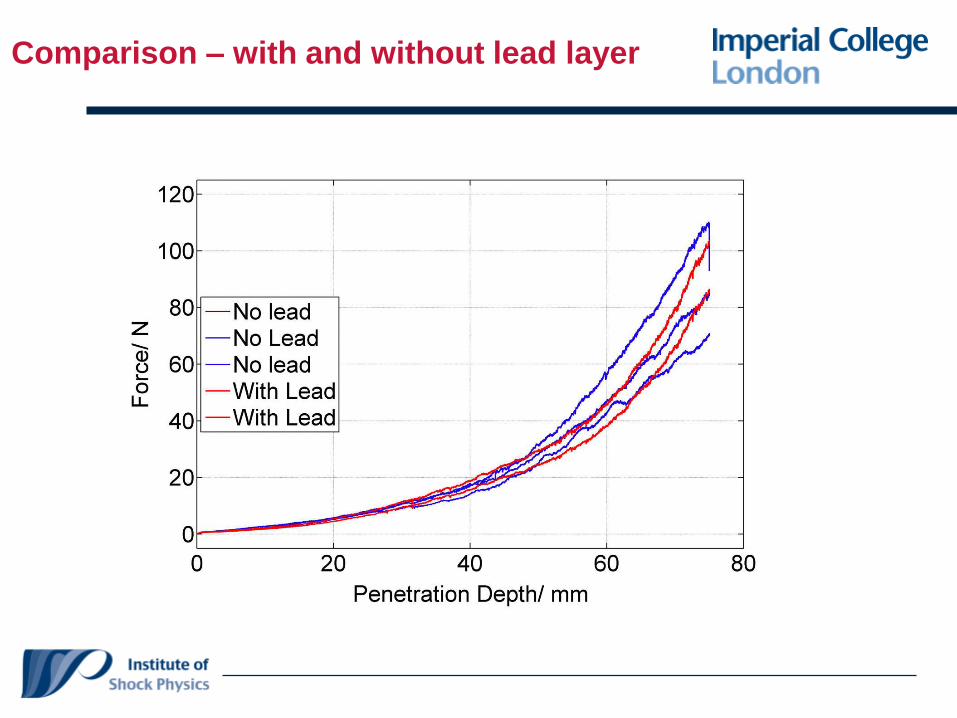
Comparison – with and without lead layer
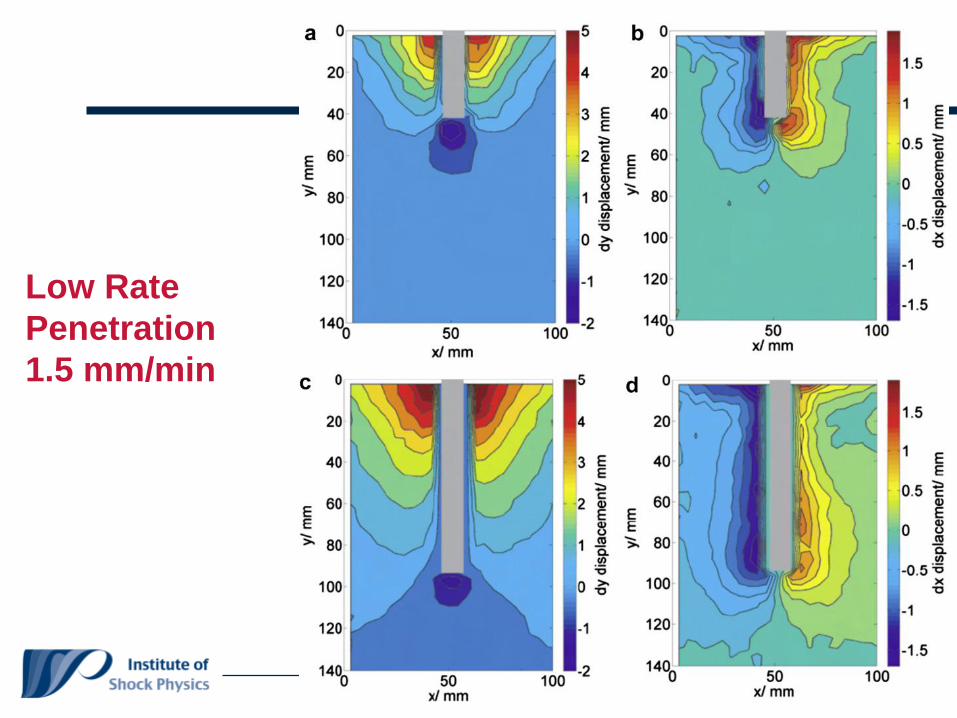
Low Rate
Penetration
1.5 mm/min

Dynamic Penetration (200 m s-1)

Comparison – Quasi-Static to Dynamic
• In the quasi-static case most of the material down to the rod tip is moving upwards
• There is no travelling compaction wave in the material
Conclusions (Ballistic)
• The higher the impact velocity (strain rate) – the
smaller the volume of the granular material involved.
• There is a definite compaction wave in the higher
rate systems
• Particle motion dominates at lower rates
• Particle rotation – occurs but is not measured in
these experiments

Blast Response (SCCM 2013)
Sand Column6mm diameter210 mm long
Acknowledgement: David Johnson/Ray Flaxman/Bob Marrah/Matthew Leal & Ian Hewitt

Sand Size Type Size - Manufacturers Specification (μm)
A 1180-2360
B 600-1180
C 300-600
D 150-300
E 90-150
Sands used
Quartz Sand dry = 43% porous (all sizes)
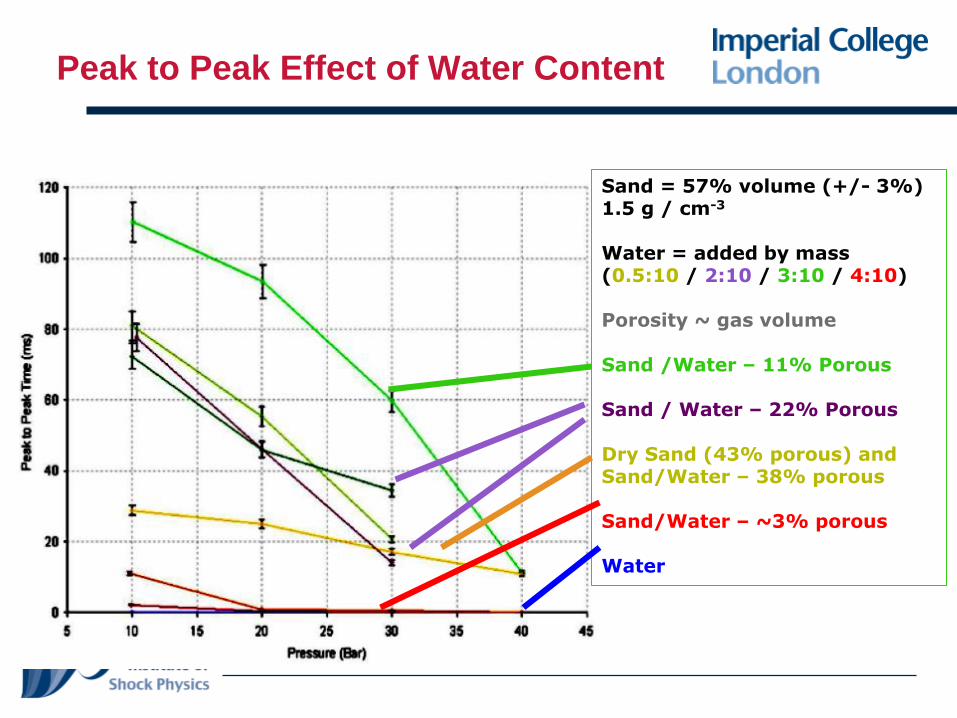
Peak to Peak Effect of Water Content
Sand = 57% volume (+/- 3%)1.5 g / cm-3
Water = added by mass (0.5:10 / 2:10 / 3:10 / 4:10)
Porosity ~ gas volume
Sand /Water – 11% Porous
Sand / Water – 22% Porous
Dry Sand (43% porous) and Sand/Water – 38% porous
Sand/Water – ~3% porous
Water
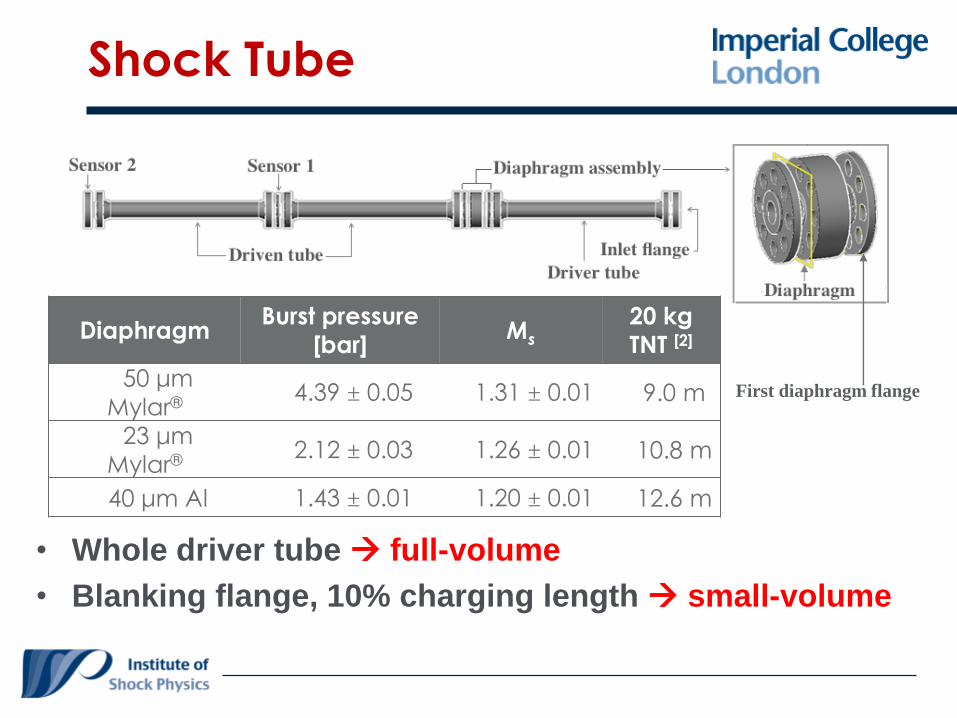
Shock Tube
DiaphragmBurst pressure
[bar]Ms
20 kg
TNT [2]
50 μm
Mylar® 4.39 ± 0.05 1.31 ± 0.01 9.0 m
23 μm
Mylar® 2.12 ± 0.03 1.26 ± 0.01 10.8 m
40 μm Al 1.43 ± 0.01 1.20 ± 0.01 12.6 m
First diaphragm flange
• Whole driver tube full-volume
• Blanking flange, 10% charging length small-volume

Bed Length : 2 mm Spheres: Pulse Shape
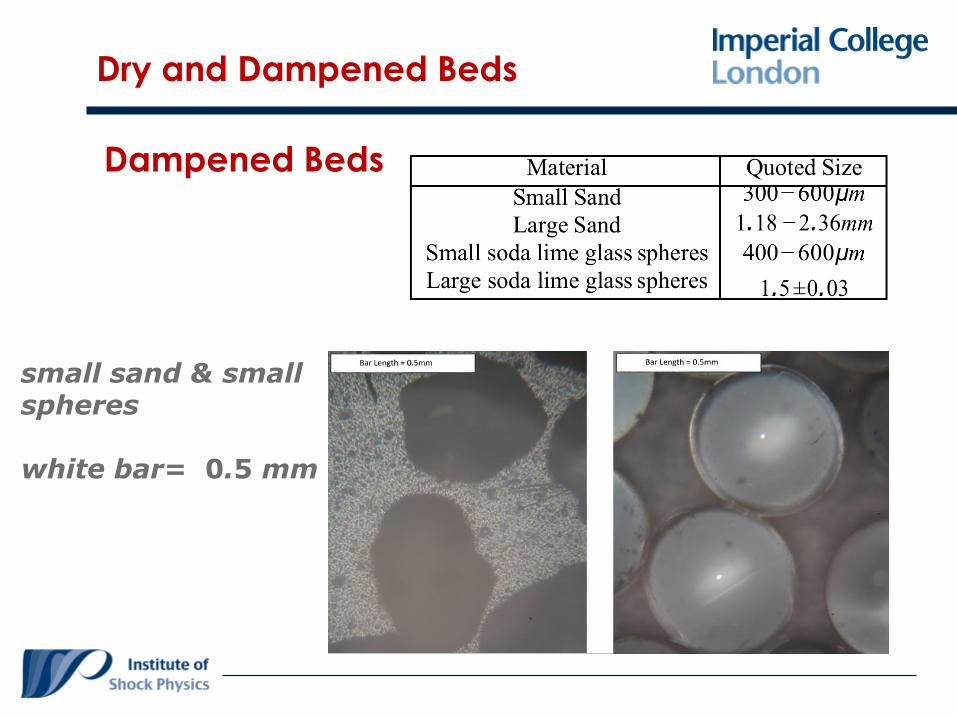
Dry and Dampened Beds
Dampened Beds
small sand & small spheres
white bar= 0.5 mm
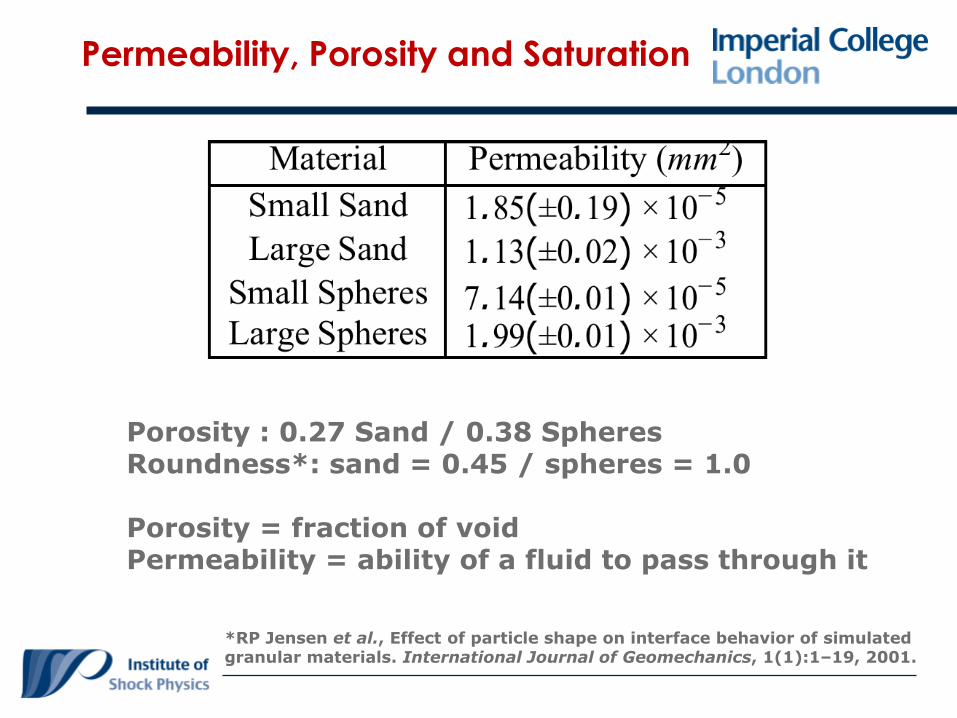
Permeability, Porosity and Saturation
Porosity : 0.27 Sand / 0.38 SpheresRoundness*: sand = 0.45 / spheres = 1.0
Porosity = fraction of voidPermeability = ability of a fluid to pass through it
*RP Jensen et al., Effect of particle shape on interface behavior of simulated granular materials. International Journal of Geomechanics, 1(1):1–19, 2001.

Input and Output Pulses
10 cm BedSmall Sand

Propagation Time / Pressure (Dry)

Propagation Time v Saturation
10 cm long granular bed
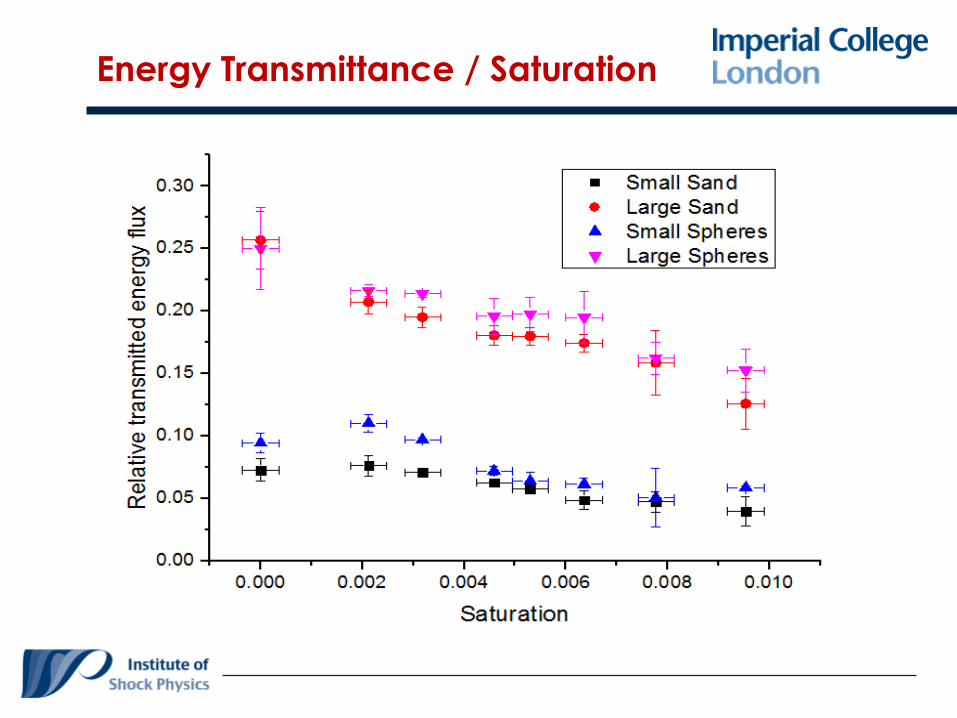
Energy Transmittance / Saturation

Conclusions (Blast)
• Grain size has an effect, more marled at low
pressures
• Porosity has an effect
• Grain morphology seems to dominate at high
pressures
• Small additions of water / oil etc has a marked
effect on the system.

Other Effects ….
Does the shock wave obey ‘simple’ Rankine-Hugoniot relationships?
What is the sound speed in sand (it is well known it is frequency
dependant)

Low-rate
Extreme 5% TMD Low Density Silica Dust
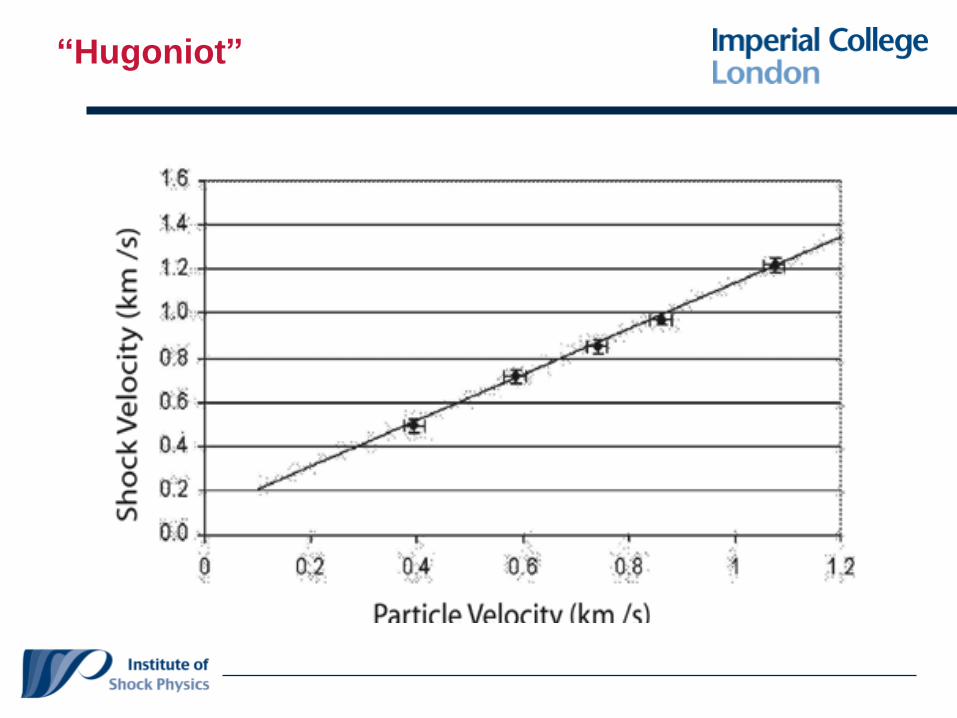
“Hugoniot”

Hugoniot v. Compaction Line

Sound Speed - 2 mm Glass Spheres

Simple Property – Sand - Sound Speed

Need to define the starting conditions
What is the required output?
Physical Understanding (science-engineering driven)
Approximate Behaviour (application driven)
Natural Material
Constructed Material
Many ways of doing this, optimally - something simple to apply/ define
Particle Size Distribution
Material Type
Morphology
Contact Points
Before fracture / compaction etc.

A Modelling Framework
Parameters to determine
ConnectivityParticle SizeStability v Instability‘Rattlers’Grain Rotation
1. RB & SFE, Phys. Rev. Lett. 90, 114303-114306 (2003);
2. 2. RCB & RB, Phys. Rev. Lett., 88, 115505-115508 (2002))
3. 3. RB & SFE, Eur. Phys. J. E 19 , 23-30 (2006)
4. 4. RB, SFE & SMW, Chapter on: Granular systems, in The Oxford Handbook of Soft Condensed Matter, Eds.
E.M. Terentjev and D.A. Weitz, (Oxford University Press, Oxford, UK, 2015)

Quadron Tessalation

Conclusion
• Many phenomena are partially understood (many models)
• Strain rate dependence is complex across the strain rates
• Properties within a material class are reproducible• Start Conditions are important
• Use of Synchotron-based studies to look in depth at high-rate compaction


