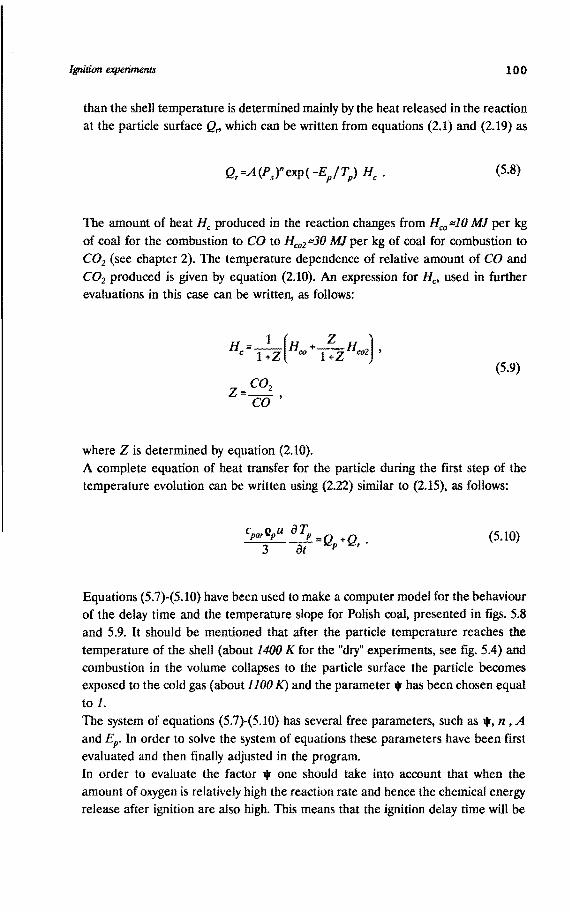
Shock tube research on kinetics of pulverised coal particles combustion and ignition tares"' tonat10n As l: . 11 ...... ·· . . .. '"mbus. e .t'rocess, for exampt'"' ,uiOiseu egrate Jal Gasification Combined<..) insta· .erm<>' damical reasons, for example in h. 'ria. b ; a desirable direction. Laboratory resec. is per. press1• . The shock tube technique gives a poss1 \ty to , ltavic under high pressures. Generally speaking shoe' .al a· n-atus with variable and well controlled i itia 'lts a: methods are an important part of any experil · sh ·k tube conditions require some special aract\ such 1s a high rate of receiving and stor ; of <. 1easurt •ents themselves. Fast visible and infrar . optical · t-- :'ltro ·ce as less distortion in the system 'ssible. ·un. <:ystem on the basis of known ;a· ;wly de• )a} Ct. The control of gas r of ( -t. A ... ' ...... das been pel This study h... .•• purposes " compact measuring s.i '1-,ly gas ·•ion) can b • V.E. Banin
Transcript
Shock tube research on kinetics of pulverised coal particles
combustion and ignition
tares"' tonat10n proc~. As l :
. 11 sy~"'~'" ...... ·· . . .. '"mbus. e comou~: .t'rocess, for exampt'"' ,uiOiseu egrate Jal Gasification Combined<..) insta· .erm<>' damical reasons, for example in h. 'ria. b
~1etics ; a desirable direction. Laboratory resec. is per. press1• . The shock tube technique gives a poss1 \ty to , ltavic under high pressures. Generally speaking shoe' .al a· n-atus with variable and well controlled i itia 'lts a: methods are an important part of any experil ~nta1
· sh ·k tube conditions require some special aract\ such 1s a high rate of receiving and stor ; of <.
1easurt •ents themselves. Fast visible and infrar . optical · t-- :'ltro ·ce as less distortion in the system a~ 'ssible.
·un. <:ystem on the basis of known ;a· ;wly de• )a} Ct. ~co:. The control of gas r ..~ns of (
-t. A ... ' ...... 1 ,.~-- das been pel ~. This study h... . •• purposes
" <~ compact measuring s.i '1-,ly gas ·•ion) can b
•
V.E. Banin
Shock tube research on kinetics of pulverised coal particles
combustion and ignition
CIP-DATA KONINKLUKE BIBLIOTHEEK, DEN HAAG
Banin, Vadim Evgenievich
Shock tube research on kinetics of pulverised coal particles combustion and ignition I Vadim Evgenievich Banin.Eindhoven : Eindhoven University of Technology. - Ill., fig., tab. Thesis Eindhoven. - With ref. - With summary in Dutch. ISBN 90-386-0020-8 NUGI 832 Subject headings: pulverised coal combustion I optical measurement I shock tube.
These investigations have been supported by the Netherlands Technology Foundation (STW).
Shock tube research on kinetics of pulverised coal particles
combustion and ignition
PROEFSCHRIFf
ter verkrijging van de graad van doctor aan de
Technische Universiteit Eindhoven, op gezag van
de Rector Magnificus, prof. dr. J.H. van Lint,
voor een commissie aangewezen door het College
van Dekanen in het openbaar te verdedigen op
vrijdag 18 november 1994 om 16.00 uur
door
Vadim Evgenievich Banin
geboren te Moskou
druk: wtbro disscrtatiodrukkoril, hclrnond.
Dit proefschrift is goedgekeurd door de promotoren:
prof.dr. L.H.Th. Rietjens en prof.dr. W.R. Rutgers
"Rabbit'S clever, " said Pooh thoughtfully. ''Yes," said Piglet, ''Rabbit's clever." ''And he has Brain. " ''Yes," said Piglet, "Rabbit has Brain." There was a long silence. "/suppose," said Pooh, "that that's why he never understands anything. "
A.A. Milne The Hause at Pooh Comer
To my motheJ; my fiancee,
and my friends
IV
Contents page:
Summary vii
Samenvatting X
Chapter 1 Introduction 1
Chapter 2 General remarks and evaluations of coal combustion and ignition behaviour 4
2.1 Combustion at the particle surface 4 2.1.1 Zone III 6 2.1.2 Zone II 7 2.1.3 Zone I 7 2.1.4 "Rough sphere" kinetics 9 2.1.5 Apparent behaviour of the coal particle 9 2.1.6 CO and C02 production at the particle surface 10
2.2 Combustion in the gas volume 11 2.2.1 Devolatilisation kinetics 11 2.2.2 Regimes of volatile combustion 12 2.2.3 Volatile composition 13
2.3 Ignition 14 2.3.1 TET analysis of a single particle and
heterogeneous ignition 14 2.3.2 Prediction of ignition temperature
from TET analysis 20 2.3.3 Homogeneous ignition: adiabatic condition 21 2.3.4 Homogeneous ignition: ignition position 22 2.3.5 Chain ignition 24 2.3.6 Clouds of particles 25
2.4 The fundamental basis for current research 26
Literature 26
Chapter 3 Experimental 29
3.1 Shock tube technique 29
v
3.1.1 Shock tube arrangement 29 3.1.2 Particle behaviour in the shock tube 35
3.2 Experimental techniques 36 3.2.1 IR two wavelength pyrometry 36 3.2.2 Arrangement of the extinction measurements 38 3.2.3 Arrangement of the IR emission spectroscopy 38
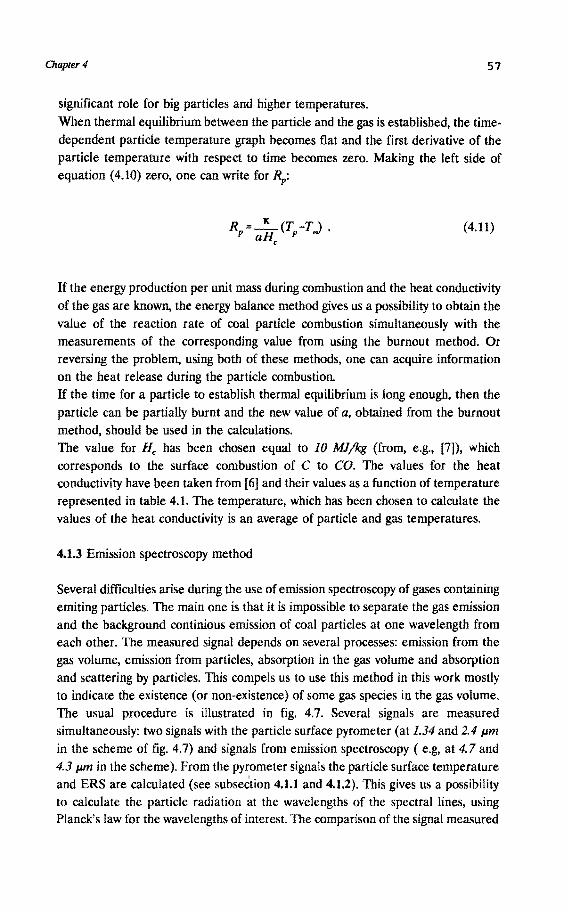
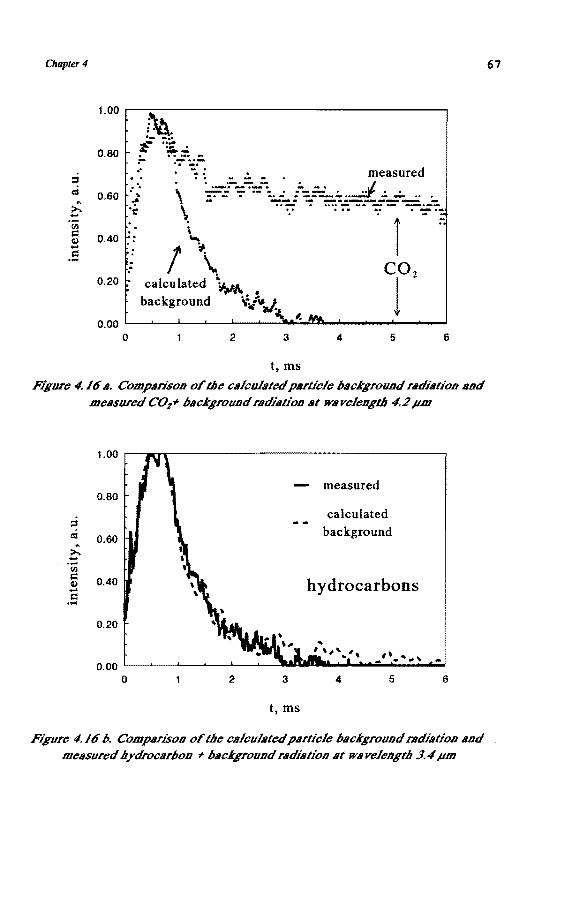
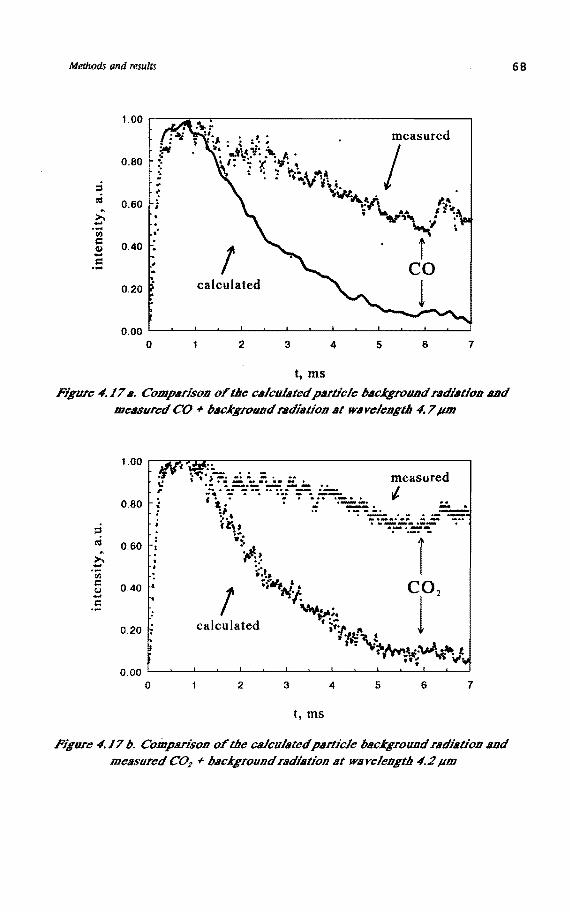
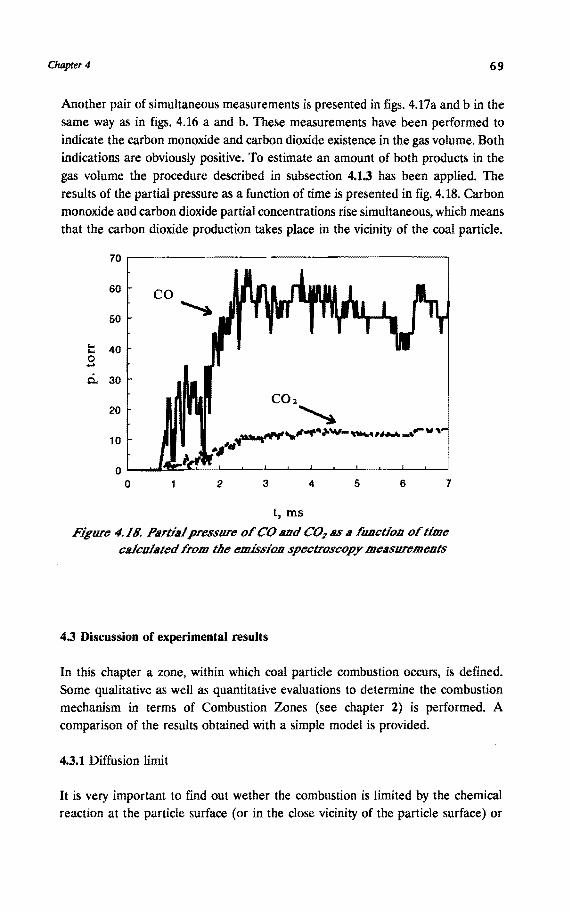
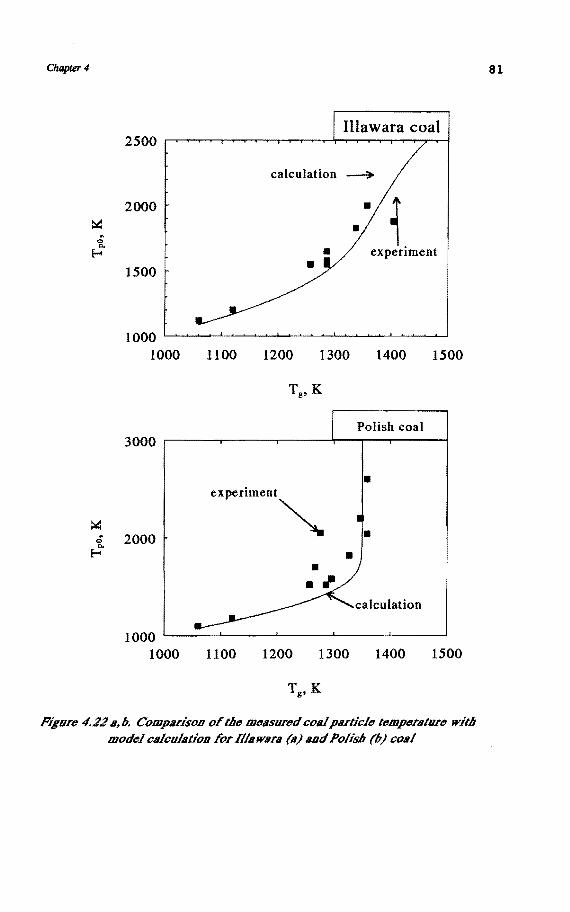
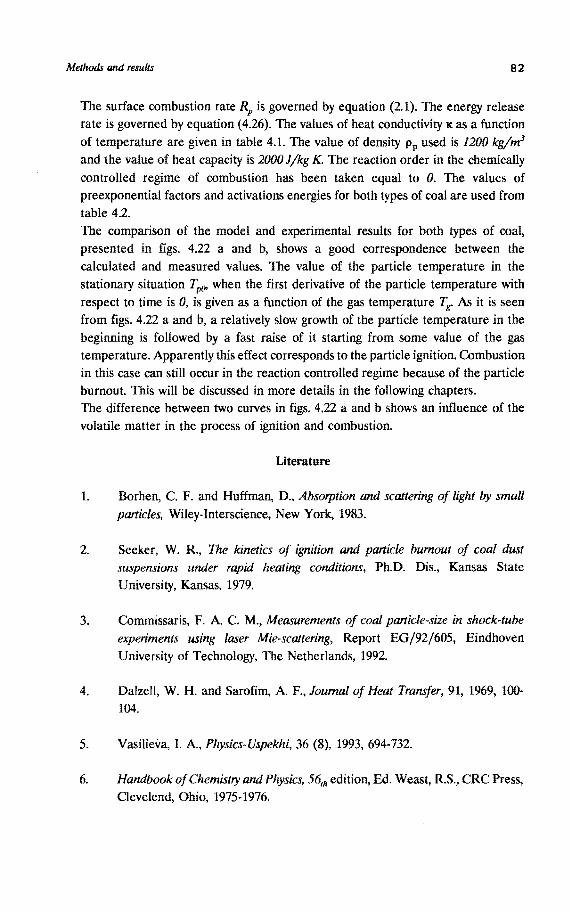
production in pulverised coal combustion experiments 66 4.3 Discussion of experimental results 69
4.3.1 Diffusion limit 69 4.3.2 Chemical control of combustion 73 4.3.3 Influence of volatile matter 75 4.3.4 Comparison of experimental results with a model 80
Literature 82
Chapter S. Results and discussion of ignition experiments 85
5.1 Introduction 85
vi
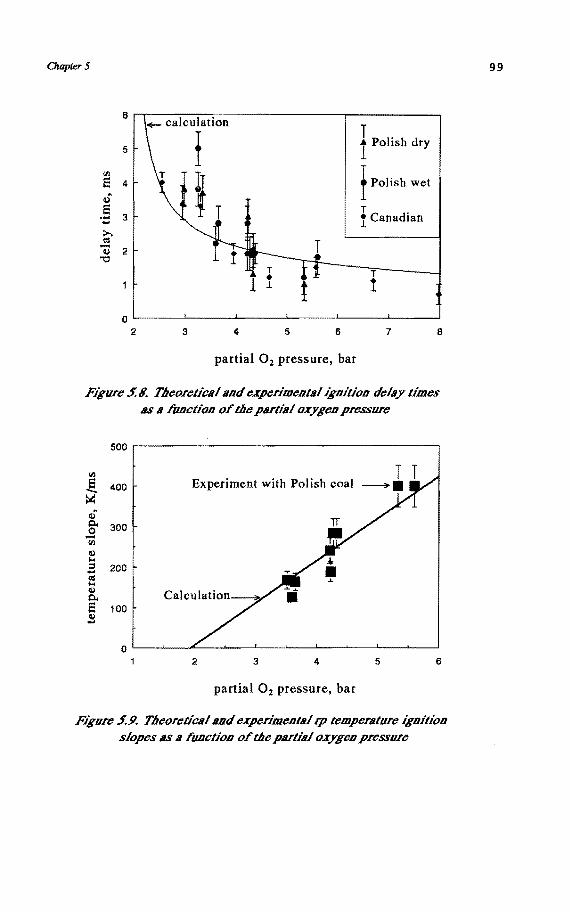
5.2 Ignition of big particles 5.2.1 Particle temperature measurements 5.2.2 Dependence of ignition delay time on
86 86
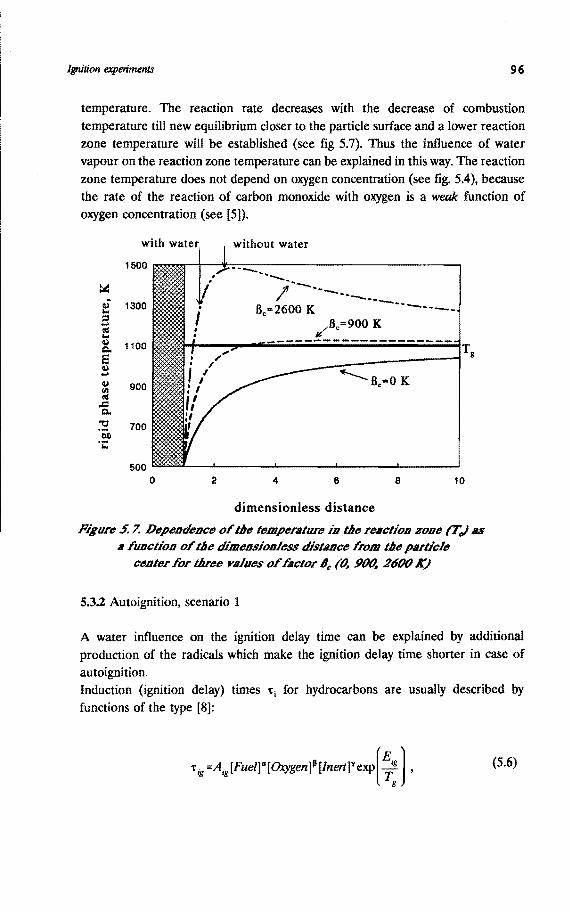
oxygen concentration 88 5.2.3 Influence of water vapour on the ignition process 89 5.2.4 Dependence of ignition delay time on gas temperature 90 5.2.5 Dependence of the ignition rp temperature slope (time
derivative of rp temperature) on the oxygen
partial pressure 92
5.3 Discussion of the ignition experiments with big particles 92 5.3.1 Water vapour effect 92 5.3.2 Autoignition, scenario 1 96 5.3.3 Heterogeneous ignition with heating from the
homogeneous combustion, scenario 2 97 5.4 Ignition of small particles 102
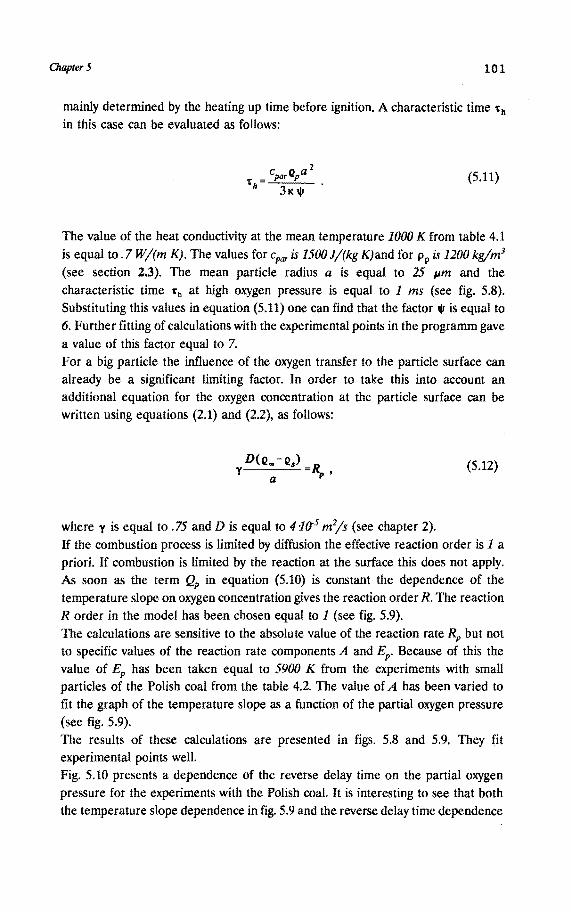
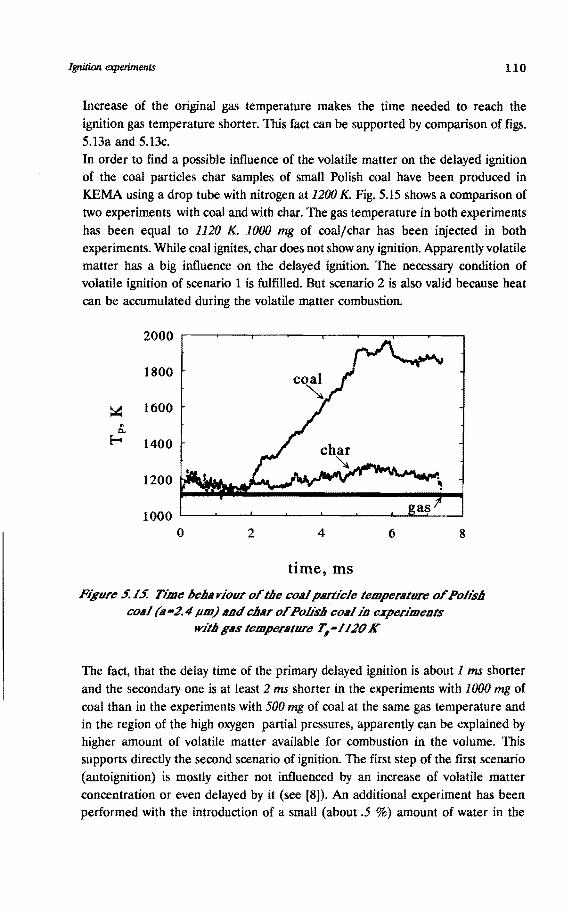
5.4.1 Ignition in combustion experiments 103 5.4.2 Delayed ignition 105
Literature 112
Chapter 6 Conclusions 113
6.1 Methods 113
6.2 Combustion 113
6.3 Ignition 114
6.4 General conclusion 114
List of symbols 115
Acknowledgements 118
Curriculum Vitae 119
vii
Summary
The wide spread use of coal as an energy source gave rise to an increase of research activity in the area of pulverised coal combustion and gasification. Many studies have been performed in order to improve the efficiency of the coal use in industrial facilities.
In accordance with three main purposes of this study the investigations are described in three parts:
The first part (see chapter 3 and partially chapter 4) describes the characteristics of the measuring system, with which important parameters of coal combustion (and possibly gasification) can be determined, together with the methods to interpret the output data of the measuring system. This system has an independent value and can be applied in other research as well. A description of the main features of a shock tube technique, rarely used in coal research, is included in this part.
The second part (see chapter 4) describes the theoretical and experimental investigation of the particle combustion of real coals with a particle size around 6 IJm. There it is also demonstrated that a shock tube can be used as a tool for coal characterisation. The strong influence of volatiles on the process of coal combustion has been demonstrated.
The third part (see chapter 5) describes the theoretical and experimental investigation of the particle ignition of real coals with particle sizes around 6 and 70 IJm. Attention has been paid to the phase of ignition (homogeneous, heterogeneous or mixed) and the specific role of volatiles in coal particle ignition. In order to introduce a general approach to the problem of ignition an attempt has been made to connect ignition properties of coal with its combustion behaviour.
A shock tube is used as a tool for a fast (within 100 JJS) creation of hot gas conditions with gas temperatures from 600 to 2500 K and gas pressure about 8-10
bar.
Non-interactive diagnostic methods based on infrared (IR) emission have been worked out to measure the particle surface temperature, relative number concentration of coal particles and the detection of the gaseous combustion products. A simple methode to measure the relative particle size is based on the IR two
viii
wavelength pyrometry (the author did not find an application of this method in earlier literature) showed complete agreement with laser extinction measurements. Emission spectroscopy measurements using the background radiation from hot particles as a reference source demonstrated a good applicability of this method for diagnostics of the combustion products. It has been shown that simultaneous use of the method based on the IR measurements of the particle size decrease, "burnout method" and the method based on the IR measurements of the particle temperature, "energy balance method", together with the emission spectroscopy method form a useful compact diagnostic system for pulverised coal combustion investigation.
It has been found that for small particles (about 6 p.m) and a partial oxygen pressure higher than 1 bar heterogeneous combustion occurs in the regime of"rough sphere" kinetics. The true reaction order measured under these conditions is very close to 0. When the partial oxygen pressure is lower than 1 bar the combustion is limited by diffusion. A good agreement between the evaluated diffusion limit and the experimentally measured combustion rate confirms the validity of the methods used. A comparison of the combustion rate measured by the "burn out method" with the energy release during combustion measured by the "energy balance method" as well as the measured lack of volatile matter in the gas volume demonstrates a strong influence of the homogeneous combustion in a thin layer near a coal particle on the energy balance of the combustion. In the heat balance a value of the combustion heat should be used higher than the one which corresponds to heterogeneous combustion with carbon monoxide production. Polish coal, which has a volatile content higher than in Illawara coal reveals a higher rate of heat release. For modelling of the combustion process kinetic values of both the burn out and the heat release rate have been used. A model based on this approach shows a good agreement with the experiments. As is measured in the experiment and confirmed by the model a decrease of the particle size due to combustion prevents a particle temperature run-away after ignition. Thus combustion after ignition occurs in the reaction controlled regime rather than in the diffusion controlled one. If the particle temperature reaches a plateau this plateau occurs not due to the fact that combustion becomes limited by diffusion but due to the dynamical equilibrium of a burning particle.
As has been found in the experiments, ignition of small coal particles (about 6 p.m) occurs in two different ways. The "usual'' ignition, with a constantly rising temperature, is predictable by the combustion model based on the data of combustion experiments performed in this work. Another kind of ignition is called "delayed" because it occurs with some delay after the creation of the hot gas conditions and when the particle temperature plateau is already reached. This
ix
ignition is influenced by the amount of coal injected into the system. As is shown in the study the "delayed" ignition occurs due to the accumulation of heat in the gas due to the volatile matter combustion in the gas volume. The gas temperature interval where the transition from the "usual" to the "delayed" ignition occurs is between 1200 and 1300 K. The experiments demonstrate that the particle interactions give rise to a decrease of the gas temperature limit for ignition while the ignition particle temperature remains the same (within accuracy of the experiments). Both types of ignitions can not be classified as a pure heterogeneous or pure homogeneous ignition. Ignition is of the mixed type where volatile matter combustion has a big influence on the processes at the surface. Another argument for this scenario is the observation that a minor hydrodynamical effect of the shock tube influences the "delayed" ignition strongly. Experiments with big coal particles (about 70 pm) show that the measured particle temperature corresponds to the temperature of the hot shell around the particle. This shell is heated by volatile matter combustion. Combustion of volatile matter in the vicinity of the coal particle give rise to a relatively fast heating of the particle and its heterogeneous ignition. Ignition in this case, as in the case of small particle ignition, is of the mixed type. Thus the hypothesis that ignition of big particles occurs homogeneously and of small particle heterogeneously is not confirmed completely. Processes in the volume as well as at the surface have a big influence on each other.
X
Samenvatting
De veelvuldige toepassing van kolen als energiebron heeft het onderzoek op het gebied van poederkoolverbranding- en vergassing doen toenemen. Veel studies zijn gewijd aan het effectieve gebruik van kolen in industrie.
Dit proefschrift is verdeeld in drie onderwerpen, analoog aan de doelstellingen van het werk :
Het eerste gedeelte, zie hoofdstuk 3 en een gedeelte van hoofdstuk 4, beschrijft de experimentele opstelling waarmee parameters worden bepaald die belangrijk zijn voor poederkoolverbranding en mogelijk -vergassing. Tevens wordt aandacht besteed aan de gebruikte methoden om de meetresultaten te interpreteren. Het gebruikte meetsysteem is ook toepasbaar in ander experimenteel onderzoek. Verder worden de belangrijkste eigenschappen van de schokbuistechniek -een techniek die zelden wordt gebruikt in kolenonderzoek -in dit gedeelte beschreven.
In het tweede gedeelte, zie hoofdstuk 4, wordt de theoretische en experimentele studie van de verbranding van poederkool met een deeltjesgrootte van 6 pm
beschreven. Hier wordt tevens aangetoond dat de schokbuis bruikbaar is voor kolenkarakterisering. De grote invloed van vluchtige bestanddelen op het verbrandingsproces wordt vastgesteld.
Het derde gedeelte, zie hoofdstuk 5, behandelt het theoretische en experimentele onderzoek naar de ontsteking van poederkool met deeltjesgrootten van 6 en 70 p.m. Er wordt met name aandacht besteed aan het type ontsteking (homogeen, heterogeen of een combinatie van beide) en de invloed van vluchtige bestanddelen op de ontsteking. Om een algemene beschriving van het ontstekingsprobleem te introduceren, is gepoogd de ontstekings- en verbrandingseigenschappen van de kool met elkaar in verband te brengen.
In de experimenten is een schokbuis gebruikt om in zeer korte tijd ( <100 p.s) de gewenste gascondities te creeren, met gastemperaturen instelbaar tussen 600 en 2500 Ken gasdrukken van 8 tot 10 bar.
Om de deeltjestemperatuur, de relatieve deeltjesconcentratie en gasvormige verbrandingsproducten te meten zijn diagnostieken ontwikkeld die zijn gebaseerd op infrarood (IR) emissie metingen. Deze meetmethode geeft geen verstoring
xi
van het verbrandingsproces tot gevolg. Ben eenvoudige methode om de relatieve deeltjesgrootte te bepalen met behulp van IR twee golflengten pyrometrie (de auteur heeft geen toepassing van deze methode in de literatuur gevonden) toonde een volledige gelijkenis met laser extinctie metingen. Met spectroscopische emissiemetingen die gebruik maken van achtergrondstraling van hete deeltjes als referentiebron kunnen verbrandingsgassen worden gedetecteerd. Tevens wordt aangetoond dat het gebruik van de meting van de afname van de deeltjesgrootte ("burnout-methode") gecombineerd met de meting van deeltjestemperatuur ("energiebalans-methode") een bruikbaar en compact meetsysteem oplevert om poederkoolverbranding te bestuderen.
Voor kleine deeltjes (ongeveer 6 p.m) en een partiele zuurstofdruk boger dan 1 bar blijkt heterogene verbranding plaats te vinden in het gebied van de zg. "rough sphere"-kinetiek. De werkelijke orde van de reactie die wordt gemeten onder deze condities ligt zeer dicht bij 0. Bij partiele zuurtsofconcentraties lager dan 1 bar wordt de verbranding diffusiebepaald. Ben goede overeenstemming tussen de berekende diffusielimiet en de experimenteel bepaalde verbrandingsreactiviteit bevestigt de juistheid van de gebruikte methoden. Ben vergelijking van de verbrandingsreactiviteiten gevonden met de "burnout-methode" en met de "energiebalans-methode" toont aan dat er een sterke invloed is van homogene verbranding in een dunne schil dichtbij het deeltje op de energiebalans. Deze conclusie wordt versterkt door het feit dat geen vluchtige bestanddelen in het gasvolume gemeten zijn. In de warmtebalans moet voor de verbrandingswarmte een waarde worden ingevuld die boger is dan de waarde die wordt gebruikt voor heterogene koolstofverbranding tot koolmonoxide. Bij verbranding van Poolse poederkool, welke een boger vluchtigheidsgebalte bezit dan de Illawara kool, komt meer warmte vrij t.g.v. homogene verbranding.
De kinetische waarden die worden gevonden met bovengenoemde metboden zijn gebruikt om het verbrandingsproces te modelleren. De modelberekeningen zijn goed in overeenstemming met de experimentele resultaten. Zoals is gemeten in experimenten en is bevestigd in modelberekeningen, voorkomt de afname van de deeltjesgrootte t.g.v. verbranding een run-away van de deeltjestemperatuur na ontsteking. De verbranding na ontsteking vindt dus meer in bet reactie- dan in bet diffusiebepaald gebied plaats. Als de deeltjestemperatuur niet verder meer toeneemt, dan gebeurt dit niet doordat de verbranding diffusiegelimiteerd is, maar door het dynamiscb evenwicbt van bet verbrandende deelije.
De experimenten tonen aan dat de ontsteking van kleine deeltjes ( ongeveer 6
p.m) op twee manieren plaatsvindt. De "gebruikelijke" ontsteking, met een steeds
xii
oplopende temperatuur, is te voorspellen met bet verbrandingsmodel dat is gebaseerd op data van verbrandingsexperimenten. Een ander type ontsteking wordt "vertraagd" genoemd, omdat deze ontsteking plaatsvindt enige tijd nadat de gascondities zijn gecreeerd en op bet moment dat bet plateau in de deeltjestemperatuur reeds is bereikt. Deze ontsteking wordt belnvloed door de boeveelbeid poederkool die in bet systeem is ingebracbt. Zoals wordt aangetoond vindt de ''vertraagde" ontsteking plaats door opboping van warmte in bet gas t.g.v. de verbranding van vlucbtige bestanddelen in bet gasvolume. De overgang van "gebruikelijke" naar ''vertraagde" ontsteking ligt in bet gebied van gastemperaturen tussen de 1200 en 1300 K. De experimenten tonen aan dat de deeltjesinteracties de gastemperatuurlirniet voor ontsteking doet afnemen, terwijl de deeltjestemperatuur bij ontsteking betzelfde blijft (binnen de nauwkeurigbeid van de metingen). Beide typen ontsteking kunnen nocb als zuiver beterogeen, nocb als zuiver bomogeen worden bestempeld. De ontsteking is een combinatie van beide typen, met een grote invloed van de verbranding van vlucbtige bestanddelen op oppervlakteprocessen. Een ander argument voor dit scenario is de observatie dat een klein bydrodynarniscb effect van de scbokbuis de ''vertraagde" ontsteking sterk be!nvloedt. Experimenten met grote kooldeeltjes ( ongeveer 70 p.m) Iaten zien dat de gemeten deeltjestemperatuur correspondeert met de temperatuur van een bete scbil rond bet deeltje, die wordt opgewarmd door verbranding van vlucbtige bestanddelen. Deze verbranding in de buurt van bet deeltje zorgt voor een relatief snelle opwarming van bet deeltje en zijn beterogene ontsteking. Het type ontsteking is in dit geval, zoals bij de ontsteking van kleine deeltjes, een mengeling van bomogene en beterogene processen.
Zo is de verondestelling dat bet type ontsteking van grote deeltjes bomogeen is en van kleine deehjes beterogeen, niet volledig bevestigd. Processen in bet volume en aan bet oppervlak bebben een grote invloed op elkaar.
Chapter 1 1
Chapter l
Introduction
The study of coal goes back to ancient times. In China coal was already used as a fuel thousands years ago. The first coal researcher in Europe was possibly Theophrastus, a pupil of Aristotle, who became head of the Lyceum in Athens in 323 B.C and who wrote a book on minerals including coal: De Lapidus.
The wide spread use of coal in the new time gave rise to an increase of research activity. Many studies have been performed in order to improve the efficient use of coal in industrial facilities. In the sixties though, because of the availability and the low cost of petroleum, the use of coal and the research in this area were reduced. Nowdays, the situation has changed and interest in coal research grows because of limited oil and gas reserves. Coal resources on the other hand are significantly bigger and can help to fill an energy gap until new energy sources are found and developed. The main possibilities to use coal are: liquefaction, gasification and direct combustion. The last two methods usually use powder coal with particle diameters less than 100 p.m. When blown into a furnace, coal particles burn forming flames which resemble flames produced by oil combustion. In case of coal though, it is difficult to predict the combustion behaviour of pulverised coal flames from the chemical and physical coal properties only. Flame characteristics in burners, such as flame front separation distance, directly influenced by the ignition delay time or time of burn out, depend on the operation conditions (heating rate of the injected coal particles, amount of oxygen present and so on) and are different for different coal types. Such uncertainty forces one to use theories manipulating a number of empirical fitting parameters for each particular situation. This makes them inappropriate for use in general practice. In order to base theories on the actual fundamental mechanisms of the combustion of a coal particle it is important to obtain a correct physical description of the processes, which actually occur during the coal particle combustion. The influence of the characteristics of an installation, which is used for study and characterisation, has to be minimal. For example, a very fast creation of the external conditions in the gas can prevent an influence of the heating procedure history on the coal combustion behaviour. This was one of the reasons to use a shock tube for this experimental work (see chapter 3). As mentioned by many researchers (see more in chapter 2), the knowledge of the volatile matter influence on the process of combustion and ignition acquired by
Introduction 2
conventional techniques is limited. Experiments with shock tubes have very often been performed with chars and not with real coals. Volatile yield and subsequent ignition depend very much on the way in which coal particles have been heated up. A long "heating history" of the conventional laboratory installations makes it difficult to find the real influence of the coal particle itself on the mentioned processes. Thus the current study is oriented more to the investigation of real coals rather than chars. The sizes of the particles, which are used in this study, are in the regions of 70 p.m
and 6 p.m. The data on the ignition behaviour of the big coal particles obtained in the experiments are relevant for direct use in existing pulverised coal installations and give fundamental information on the phase of ignition. The data obtained in the experiments with the small coal particles give information on the actual combustion characteristics (see more in chapter 2) of coal. A direct application of the combustion behaviour of the small coal particles can also find a direct application in modern alternative energy production installations like coal fired magnetohydrodynamic (MHO) generators. An investigation of collective behaviour of small coal particles in clouds can introduce significant knowledge concerning mine safety. The propagation of a detonation wave after explosions in mines involves clouds of the coal dust particles from the floor of the mine gallery with the subsequent ignition of them. The Mach numbers of the propagating detonation waves in mines as well as heating rates of coal particles (lOS to 106 K/s) are close to those achieved in the shock tube. Both direct data on collective coal dust behaviour and characteristics of individual coal particles are very important for description of this detonation process. As time passes, more and more attention is paid in industrial combustion systems to pressurised combustion. This takes place either in order to intensify the combustion process, for example in fluidised bed combustors and gasifiers such as the Integrated Coal Gasification Combined Cycle installation in Buggenum The Netherlands, for thermodynamical reasons, for example in industrial gas turbines, or to shift the reaction kinetics in a desirable direction. Laboratory research is performed mostly under atmospheric pressure. The shock tube technique gives a possibility to obtain data on coal combustion behaviour under high pressures. Generally speaking a shock tube is a very flexible experimental apparatus with variable and well controlled initial gas conditions. Diagnostic instruments and methods are an important part of any experimental scientific work. Measurements under shock tube conditions require some special characteristics of the measurement tools such as a high rate of receiving and storage of data and the noninteractivity of measurements themselves. Fast visible and infrared optical methods have been chosen in order to introduce as less distortion in the system as possible. The author tried to develop a compact measuring system on the basis of known and newly developed methods for the diagnostics of the coal
Chapter 1 3
clouds. The control of gas conditions of the chemical shock tubes is very well established. A small development of it has been performed based on modem computational techniques. This study has three main purposes. First (counting in order of performance) is the creation of a compact measuring system with which important parameters of coal combustion (and possibly gasification) can be determined. Such a system should also have an independent value and be applied in another research. " Second is theoretical and experimental investigation of the particle ignition of real coals. Attention bas been paid to the phase of ignition (homogeneous, heterogeneous or mixed) and the specific role of volatiles in coal particle ignition. An attempt has been as well made to connect ignition proprieties of coal with its combustion behaviour in order to introduce a general approach to the problem of ignition. Third is theoretical and experimental investigation of the particle combustion of real coal. It has to be demonstrated that a shock tube can be used as a tool for coal characterisation. Attention should be paid as well to the influence of volatiles on the process of coal combustion.
General remarks and evaluations
Chapter 2
General remarks and evaluations of coal combustion and ignition behaviour
4
The combustion of pulverised coal involves two major processes: devolatilization with the subsequent combustion of volatiles in the gas volume (homogeneous combustion) and combustion at the particle surface (heterogeneous combustion). These two processes can be simultaneous or sequential. The combustion of a single coal particle is determined by many factors as it is outlined by several authors in (1] - [6] and depends on, e.g.:
- Coal particle size - Coal content of volatile matter - Ambient pressure and temperature - Heating rate - Moisture content of the coal and gaseous environment - Pore diffusion - Surface area available for chemical reaction - Reactions with various reactants
In this chapter a review of the combustion and igntion processes, as well as a discussion of factors which are essential for the investigations of the work presented here, is given. Apart from the data known from literature, some simple evaluations in order to illustrate classical results, are presented.
2.1 Combustion at the particle surface
The characteristics of chemical reactions at the coal/ char particle surface are discussed in detail in various works [5]-[10]. For the isothermal particle the reaction rate per unit of external surface RP can be presented in the Arrhenius form as follows:
(2.1)
where A is the reaction coefficient, P5
the partial pressure of gaseous reactant (oxygen) at the surface, n the apparent reaction order, EP the activation energy and TP the particle temperature. Here and below the activation energy is given in
Chapter 2 5
degrees Kelvin, which corresponds to the activation energy given in Joules as EP • RIP where Rg is the universal gas constant. The fact that combustion of coal particles can occur within three regions of limitation is now well established. Under low temperature conditions, combustion is controlled by reaction at the external particle surface as well as inside the particle. At higher temperatures, pore diffusion begins to play a significant role in control of particle combustion. And at even higher temperatures the rate of combustion will be limited by transport of oxygen to the particle surface. Transition regions between these zones also have to be taken into account. The actual temperature regions, within which those conditions are realised, depend very much on the size of coal particles and the type of coal.
rate
Zone III
n=l
Ea=O
L=O
Zone II
n=(m+l)/2
a=Ep Ea=Ep/2
O<L<l l<L<a
Zone I
n=m
Ea=Ep
a<<L
Figure 2. /. R11te cootro//iog regimes for JJeterogeoeous colll/cnn combustion
The classical graphical presentation of these zones can be found in many publications and books [5], [10], [11], [12]. Fig. 2.1 presents a modification of it adapted to the experiments discussed in this work. It shows schematically the reaction rate in logarithmic scale as a function of the reverse particle temperature in different temperature regiones with the changing apparent reaction order n, activation energy E0 , oxygen penetration depth L and the constant true reaction order m and true activation energy Er Keeping the usual classification of zones, it is more convenient to start the analysis from Zone Ill
General remarks and evalut~.tions 6
2.1.1 Zone III
In this zone the reaction rate at the particle surface is so high, that oxygen is burnt completely at the external surface of the coal particle and combustion is limited by oxygen transfer towards the particle surface from the surrounding gas. As is shown
in [2] and [5], if particles are treated as spheres and there is no relative movement
between gas and particle then the resulting flux hm of oxygen, calculated per unit
of mass of carbon, is equal to the reaction rate at the particle surface and is given by:
hm=yD(Q5 -aJ/a ,
D =D0(P0 / P)(Tg/ T0)u5 , (2.2)
where y is the stoichiometric factor, v the mole ratio (for combustion of C to CO
v 1/2 and to C02 v = 1), Me and M02 the molecular weight of C and 0 2, D the diffusion coefficient, D0 the diffusion coefficient at some standard pressure (P0) and temperature (T0), P the pressure, Tg the gas temperature, a the particle radius, p5
and P~ the partial density of the gaseous reactant (oxygen) at the surface and in the gas volume (far away from the particle). If the mass transfer limits the reaction
at the particle surface then the reaction rate in Zone III Rpiii = hm with Ps = 0 reveals linear dependence on the oxygen concentration and the measured activation
energy EP is equal to zero. Combustion in this Zone is determined rather by gas conditions than coal characteristics. Let us consider a small evaluation which presents limits for combustion controlled
by diffusion under conditions used in this work: Example 1. Diffusion controL Using standard conditions for the diffusion coefficient from [1] one can find that at a gas temperature of 1500 K, a pressure of 8 bar and an oxygen density of about 2 kg/m3 in the case of combustion to CO, the values of
the reaction rate limited by diffusion are about 20 kg/m2 s for a particle size (diameter) of 6 11m and about 2 kg/m2 s for a 60 11m particle. Using the data on the particle reaction rate for different coals, reviewed in [8], one can find that a small particle is controlled by diffusion when its temperature is higher than 2500 K for most kinds of coals. The same temperature for a big particle is 1400 K. It shows that small particles are controlled by processes at the particle surface itself, rather than in the gas volume, in a significantly wider region of temperatures than for big ones. Thus the use of small coal particles is preferable, if one wants to
Chapter 2 7
investigate the coal combustion determined by coal itself.
2.1.2 Zone II
Zone II represents the case when the particle combustion is not controlled by
diffusion to the particle surface any more. The process which plays the most
significant role in this case, apart from chemical reaction itself, is pore diffusion
within the particle. The penetration depth of oxygen L in the particle in this case
can be defined as
l<L<a, (2.3)
where 1 is the mean free path of oxygen molecules in the gas phase.
Because of the fact that depth of oxygen penetration into the particle and hence the
total reaction surface in this zone is controlled by reaction itself, the true order of
reaction m and the true activation energy are different from apparent measured
values related to the external surface. As is shown in [11] and [13] the true order of reaction is related to the apparent n one as n = (m + 1)/2 and measured values for the activation energy are twice as low.
The apparent reaction rate (Rp11) in this case can be written according to [11] as
follows:
(2.4)
where NP is the number of pore mouths per unit of external surface, rP the mean
pore radius and DP the diffusion coefficient for oxygen in the pores. The evaluation of the temperature regions, within which the limitations of the Zone
II are valid, will be performed later.
2.1.3 Zone I
The regime denoted as Zone I, is the regime in which diffusion to the particle
surface, as well as within the particle itself, is very fast and does not control the
chemical processes at the external and internal particle surfaces. It means that
penetration length in this case is
General remarks and evaluations 8
L>a . (2.5)
Mechanism of the chemical reaction in Zone I, as summarized in [10] and [11], is
controlled by chemical adsorption and desorption.
Chemical adsorption is proportional to the frequency with which molecules collide
with the particle surface. Not all collisions though, result in the adsorption. The
fraction of these molecules that have enough energy to penetrate the adsorption
barrier with activation energy Ea is characterised by the Arrhenius exponential
factor, exp(-E,/T). And even those molecules can be oriented not in the good
direction, so the steric factor s should be taken into account. Keeping in mind that
only free active sites can be used for the adsorption process and combining all
factors mentioned above one can write the rate of the chemical adsorption (Rpad) as
(2.6)
where P 02 is the partial oxygen pressure and vs is the coverage of the active sites.
From equation (2.6) it is seen that the order of the adsorption reaction with respect
to oxygen concentration is one.
If the diffusion rate of oxygen to the particle surface, as well as adsorption, are very
fast and all active sites are covered by oxygen, then the controlling mechanism of
the combustion is desorption of products from the particle surface. The rate of
desorption Rpaes as given in [10] and [11] is:
(2.7)
where ZP is the number of active sites per unit area of surface, NA Avagadro's
number, hP Planck's constant and ED the desorption activation energy.
From equation (2.7) it is seen that the order of desorption reaction with respect to
oxygen concentration is zero.
Thus if the particle combusts under conditions of Zone I, the true reaction order
is the same as measured and lies between 0 and 1. The apparent activation energy in this case is also equal to the the value of the true activation energy.
Chapter 2 9
2.1.4 "Rough sphere" kinetics
A special case of coal particle combustion is the combustion in a "rough sphere" regime [10], [11). Combustion in this particular subregime takes place when there
is enough oxygen at the particle external surface but the penetration depth within the particle does not exceed one oxygen mean free path,
O<L <l. (2.8)
In this case, the general approach based on Fick's law is not valid any more and
according to (13] and [10] reaction occurs at the outer particle surface and in the
pore "mouths". Pores are "locked" by not high enough value of pore diffusion and combustion occurs in a shrinking regime. The true order of reaction as well as activation energy in this case are equal to the apparent one and the kinetics described in the subsection 2.1.3 for Zone I is also valid here.
2.1.5 Apparent behaviour of the coal particle
Burning in different zones coal particles reveal different apparent behaviour. A
summary of these processes is presented in fig. 2.1:
Combustion in Zone III occurs at the surface with apparent activation energy Ea equal 0 and the apparent order of reaction n equalJ. The particle burns at constant density, and decreasing radius. Combustion in the ~~Rough sphere" subregion takes place at the surface and a very
thin near-surface region with the apparent order of reaction and the activation
energy equal to real values (n =m, Ea =Ep)· The particle burns at a constant density and changing radius. Combustion in Zone II occurs in the particle volume with partial oxygen
penetration through pores. The real value for the activation energy is half of the
apparent (E0 =E/2) and the reaction order is related to real one as n=(m+l)/2. The particle burns at changing density and constant radius. Combustion in Zone I is not limited by diffusion and the place inside of the coal
particle revealing real values of the reaction order and activation energy (n=m, Ea = Ep). The particle burns with changing density and constant radius a.
General remarks and evaluations 10
2.1.6 CO and C02 production at the particle surface
The main aspects of the CO and C02 production are outlined in a number of articles (see e.g., [1], [11}, [141 and [151). If there is enough oxygen at the particle surface the combustion reaction proceeds as follows:
(2.9) 2C+02 -2CO.
The ratio of carbon monoxide to carbon dioxide was measured for granules of graphite and coal char in [15]. The oxidation of CO to C02 in the gas volume was suppressed using the inhibitor phosphoryl chloride. Over the temperature range 700 - 1200 K the mole ratio was given by:
CO =2500exp(-6244/TP). C02
(2.10)
At a temperature of about 1200 K this ratio is about 12 which shows that under even higher temperatures the reaction of oxygen with C02 production can be neglected. Still the oxidation of carbon monoxide in the gas volume can significantly influence the processes at the particle surface, first by additional heating of the particle and second by changing of the particle combustion mechanism completely. As shown in [14] in case of big particles (about 100 11m) and rather high temperatures (2000-2500 K), carbon monoxide produced in the diffusion limited regime of combustion at the surface can completely block the oxygen access to it. In this case combustion proceeds through reduction of carbon dioxide forming carbon monoxide at the particle surface and subsequent oxidation of CO in the gas volume:
surface: C02 +C=2CO, (2.11)
gas: 2C0+02 =2C02 •
As outlined in [14], further increase of temperature from 2500- 3500 K leads to
Chapter2 11
dissociation of oxygen and reaction at the particle surface occurs as follows:
C+O=CO. (2.12)
Further increase of temperature gives rise to carbon sublimation and the same reaction (2.12) occurs in the gas volume.
2.2 Combustion in the gas volume
Combustion in the gas volume occurs due to reaction of oxygen with carbon monoxide which is produced during surface combustion and with volatile matter emitted from the particle during the devolatilisation process. The process of volatile combustion can take place before, simultaneously and after combustion at the particle surface. This depends strongly on particle size, temperature, devolatilisation rate, type of coal and ambient conditions. There are a number of reviews on devolatilisation and its influence on combustion and ignition of coal particles(e. g., [3], (4], (16], (17]). Though, due to the extreme complexity of the process, it is still not well understood.
2.2.1 Devolatilisation kinetics
It is usual to consider devolatilisation as a first order single reaction [16] according
to:
kv=(dV/dt)f(V•-V) , (2.13)
where ky is the reaction rate coefficient, V the amount of volatiles released up to timet and V the limit of V after large t. It is shown in [17] that a change of heating rate changes this coefficient drasticly, e.g. at 1100 K, its value differs for three orders of magnitude when the heating rate changes from 1 to Hf K/s. Furthermore, different amount of volatiles can be emitted from the particle under the different heating rates applied. The amount of volatiles taken from the ultimate analysis, usually performed under low heating rate conditions can be a factor of two lower than one with rapid heating. The reason for this is, that the real process occurs as a combination of a large number of reactions, which can be considered roughly independent (18]. Therefore
General remaiks and evaluaJ.ians 12
(2.14)
where subscript i denotes one particular reaction in which amounts of volatiles Vi is produced in time t. kOi is the pre-exponential factor, Ei the activation energy and ~ • is the limit of ~-During heating the particle passes several different regions where different sets of reactions become more important. The model proposed in [18] succeeds in explaining the difference between experimental data for high and low heating rates. Thus applying single-reaction parameters, using particular sets of reactions for particular cases, one can correctly describe the combustion process. Apart from the uniform devolatilisation volatiles can also be released in jets [19].
2.2.2 Regimes of volatile combustion
Different regimes of combustion of volatiles have been observed in a number of works, e.g., the method of direct observation of a coal particle evolution has been performed on the flat flame burner [19], [20]. The Fourier Transform Infrared method (FT-IR) has been used in an entrained flow reactor (21] and the analysis of .collected char samples after different residence time with simultaneous gas temperature measurements has been performed in a one-dimensional pulverised coal flame [22]. Fig 2.2 illustrates two different regimes of combustion with a displaced and an attached flame for a big and a small particle respectively. The mechanism of displacement of the reaction zone from the particle surface can be found in [22] and [23]. The lack of oxygen at the particle surface, especially during diffusion controlled coal combustion, gives rise to the Faraday combustion regime. Volatiles being evaporated from a particle burn in the gas volume and block access of oxygen to the surface (see fig. 2.2). In this case no heterogeneous reaction occurs. This regime is characteristic for big particles. The combustion zone is supplied by volatiles from the particle surface and with oxygen by diffusion from the gas volume. Position of the reaction zone is determined by the equality of mass fluxes to the reaction zone and stoichiometric conditions in it. In this case there are only volatiles from the left hand side of the reaction zone and oxygen and combustion products from the right side (see fig. 2.2). The smaller the particle size the more oxygen can reach the surface (2.2). If the particle size is smaller than a certain critical value [22] particles experience simultaneous homogeneous and heterogeneous combustion and heterogeneous
Chapter 2 13
combustion is controlled by a chemical reaction rate. The value of the critical size
found in [22] is about 65 11m and for 15 11m particles heterogeneous combustion is significant.
More detailed analysis of this problem will be presented later in this work.
Combustion zone
Big particle
products
products
oxygen
Combustion zone
Figure 2.2. Posilioo of .IJomogMeous combuslioo for bllf lllld small coal particles
2.2.3 Volatile composition
As reported by different authors (10], [19], [24], [25] the volatile composition depends on the coal type as well as on the process of devolatilisation itself.
It has been confirmed experimentally, e.g. in [19] in the flat flame burner
experiments, that bituminous coal volatiles contain large fractions of soot producing heavy hydrocarbons, while lignite volatiles are composed mainly of CO, C02, H2,
HP and light hydrocarbons. While in installations with not extremely high heating
rates (lW - 10" K/s) volatile composition includes carbon oxides, in shock tube experiments [10], [25] with a heating rate of about Hf K/s volatiles are mainly composed of light hydrocarbons. It has been found in (10] that methane, ethene and
ethyne made up between 60 and 90 % of the total low molecular weight volatiles with little observed effect of the particle size on the volatile composition.
General remarks and evaluations 14
2.3 Ignition
Research on ignition started already more than 150 years ago. Since that time the amount of works, which have been written on the subject is innumerous. The
ignition mechanisms are discussed in detail in [4], [8], [13], [22], [26], [27] and [28].
Not so much time has passed though since a new break-through in the
understanding of the ignition process of coal particles was made. It is accepted now
that ignition can occur in several stages depending on the coal nature, particle size, heating rates and ambient conditions. Ignition can be heterogeneous, homogeneous
or of mixed type. Usual analysis of heterogeneous ignition are based on Thermal Explosion Theory (TET) proposed by Semenov and presented, e.g., in [28]. The
case of homogeneous ignition is less settled and represented by several theories, like TET, Chain Explosion [30] and Adiabatic Condition [27] et a!.
2.3.1 TET analysis of a single particle and heterogeneous ignition
TET analysis is valid for heterogeneous as well as homogeneous ignition. Because
the application of TET is relatively easy for heterogeneous ignition, an illustration of TET in this subsection will be performed for ignition at the particle surface. A coal particle of mass mP situated in the gas environment experiences cooling or
heating due to the heat transfer to the gas volume (Q_) and heating due to energy release of the chemical reaction (Q+) [4]. In the simplest case, radiation cooling from the particle is considered to be small. Time-dependent temperature behaviour
of the particle in this case is governed by:
(2.15)
where cpar is the particle specific heat capacity. Usually the ignition period is considered to be rather short, so the change of mass
during it is neglected. Differentiating equation (2.15) with respect to time and applying equation (2.15)
again one can obtain
Chapter 2 15
m,c,. d:,; ·[[ ~~; H ~~; ]] (2.16)
(Q. -Q_) x..:.._ _ _;._
The classical definition of (TE1) ignition in this case is the fulfilment of following two requirements:
(2.17)
and
[dQ.l [dQ_l dTP = dTP •
(2.18)
If the total reaction rate is given by equation (2.1 ), then
T -T Q = K __e___:A - a P,
(2.19)
where He is the heat of combustion, AP the particle surface and K the heat conductivity. To find the partial pressure of oxygen at the surface, the term of mass flux from equation (2.2) should be set equal to the reaction rate from (2.1 ), and the gas law has to be applied:
(2.20)
General remarks and evaluations 16
(2.21)
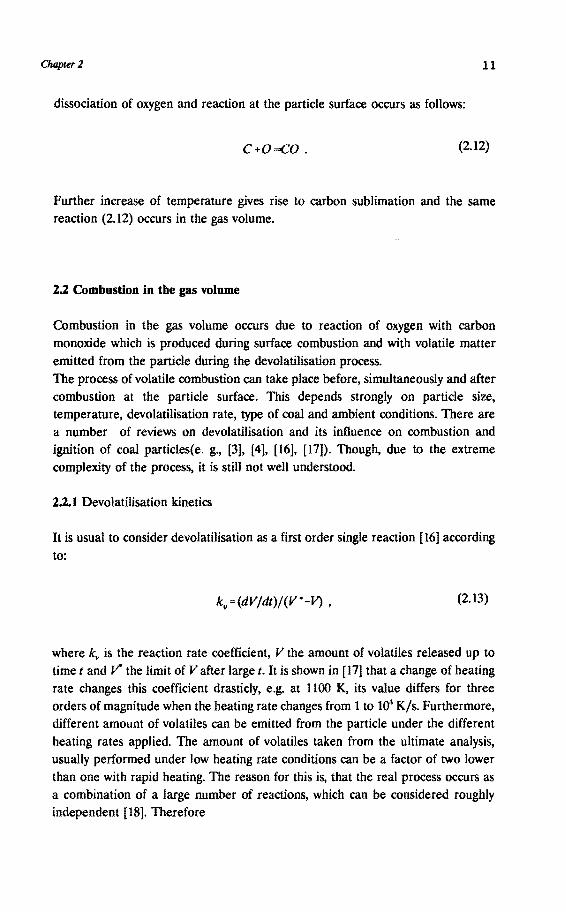
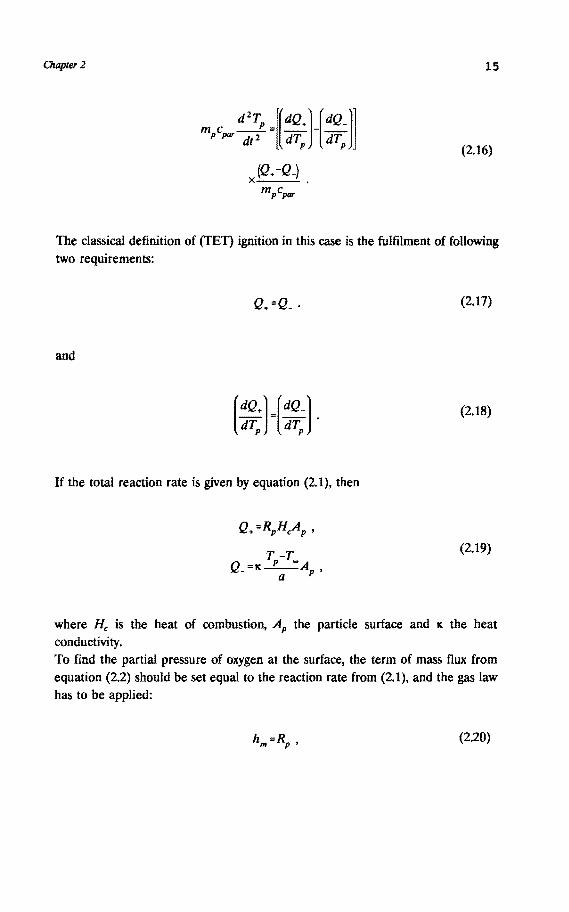
Example 2. Q-T diagram. To understand the process of ignition it is convenient to make a Q-T diagram (Q+ and Q_ as a function of TP). In order to do that we will use real data for reaction rates reviewed in [25]: A = 6.94 kg/(m2 s kPa), n = 1, EP
= 10843 K. For reaction to CO H, has been chosen to be equal to about 10 MJ/kg [7], total pressure P = 800 kPa, partial oxygen pressure P 02 = 300 kPa, " = .09 J /m K [29] and particle size a = 30 IJ.m. The particle is considered to be a perfect sphere. The result of these evaluations is presented in figs. 2.3 and 2.4. The heat generation term from equation (2.19) is presented by Q+ -curve (see fig. 2.3). The corresponding partial oxygen concentration at the particle surface, normalised by the partial oxygen concentration in the bulk of the gas, is presented in fig. 2.4. When the particle temperature is not high (Tp < 1000 K) the reaction rate and heat generation are low (see fig. 2.3) and there is enough oxygen at the particle surface (see fig. 2.4). This is the reaction controlled regime of combustion. A further increase of the particle temperature gives rise to an increase of the reaction rate and heat generation (fig. 2.3) and, hence, more effective oxygen burn-out (fig. 2.4). The regime, in which the oxygen concentration at the particle surface is low, is controlled by diffusion. Usually ignition represents a transition process from the reaction controlled regime to the regime controlled by diffusion. The straight lines I, II and III represent the term Q_ from equation (2.19) with different bulk gas temperatures, T ~ = 600 K, 900 K and 1000 K. The points of intersection between l-line and Q +-curve present the first ignition requirement (2.17). Point A1 is the point of a stable equilibrium. An originally cold particle will be heated not higher than the temperature in this point. Any infinitely small increase of the particle temperature will give rise to the faster increase of the cooling term than the term of the heat generation. Thus a particle will be cooled back to Al. Point B1 is the point of an unstable equilibrium. If the particle has been heated up by any external heat source but the heat conductivity from the bulk gas, the heat generation will prevail and the particle will be heated up to the next point of the stable equilibrium, Cl. Line II (fig. 2.3) with higher gas temperature has only two intersections with Q+curve. Point A2 is the unstable point where both (2.17) and (2.18) conditions are fulfilled. Hence, this is the ignition point. Point C2 is similar to Cl. If the gas temperature is even higher then a classical ignition does not occur at all and the particle leaps directly to point C3 in the diffusion controlled region, which is similar to C1 and C2. Fig. 2.5 presents time-dependent temperature behaviour of a single coal particle
Figure 2.5. Temperature of a single coal particle (.10 pm) as a function of time for different gas temperatures
18
calculated under the same conditions as in fig. 2.4 using equation (2.15) for three values of the bulk gas temperature. The additional data for the specific particle heat
capacity cpar and density Pp have been taken from [30]. Reasonable values for this evaluation are: cpar = 1500 J /kg K and Pp = 1200 kg/m3
. The coal particle mass has been calculated under an assumption of an ideal spherical particle:
(2.22)
Curve I (fig. 2.5) represents the case with reaction controlled combustion and without ignition. Curve II is the classical ignition case and curve III is the transition to the diffusion controlled regime of combustion without classical ignition. It is not always possible to find a point of classical ignition. Fig. 2.6a shows the Q-T diagram similar to fig. 2.3. The conditions, under which this evaluation has been performed, are the same as of fig. 2.3 but for smaller particle size. In this case a =
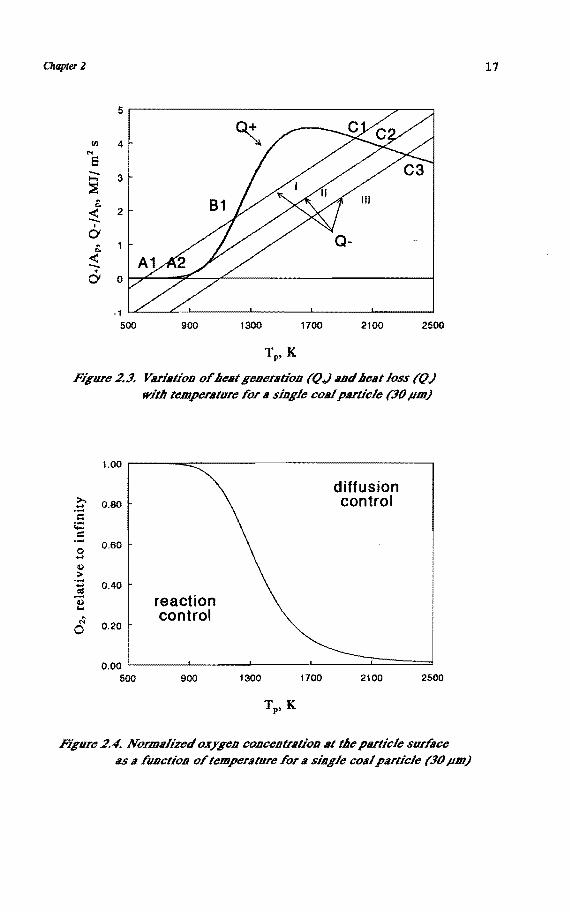
1 11m. There is no possible Q_-line, which is tangential to the Q+ -curve. This can be seen more clearly in fig. 2.6b, which presents first derivatives of heat generation and cooling terms as function of particle temperature. As soon as there is no intersection between those two curves (see fig. 2.6b), there is no tangential point in fig. 2.6a. Fig. 2.7 is similar to fig. 2.4, but for 1 11m particle. As has been mentioned in 2.1.1,
Chapter 2
100
80 fiJ
N
= 60 -..... ~
Q. < 40 -... 0
20
0 1000 1500 2000 2500 3000
TP, K
Figure 2.tf 11. Vui11tion of ile111 genention ((l.) IUld iJCIJI Joss ({JJ wit/J temper111ure for 11 single co11l p11rticle (1 pm)
Figure 2.tf !J. Vui11tion of first deriv11tivcs of iJCIJI gener11tion
(d(l/dTp) IUld ile111 loss (d(l/Tp) wit/J temper11ture for 11 single co11l puticlc (1 pm)
19
General remarks and evaluations 20
the border between reaction and diffusion controlled areas is shifted to high temperature region.
>. 0.80 ..... ·-.5 ,...... .5
0.60 0 ...... Q;l
.:: ...... 0.40 1':1
q) .... .:;
0.20 0
0.00 1000
reaction control
1500 2000
TP, K
diffusion control
2500 3000
Figure 2. 7. Normalized oxygen concentration at tiJe piUficle surface as a function of temperature for a single coal particle (1 pm)
2.3.2 Prediction of ignition temperature from TET analysis
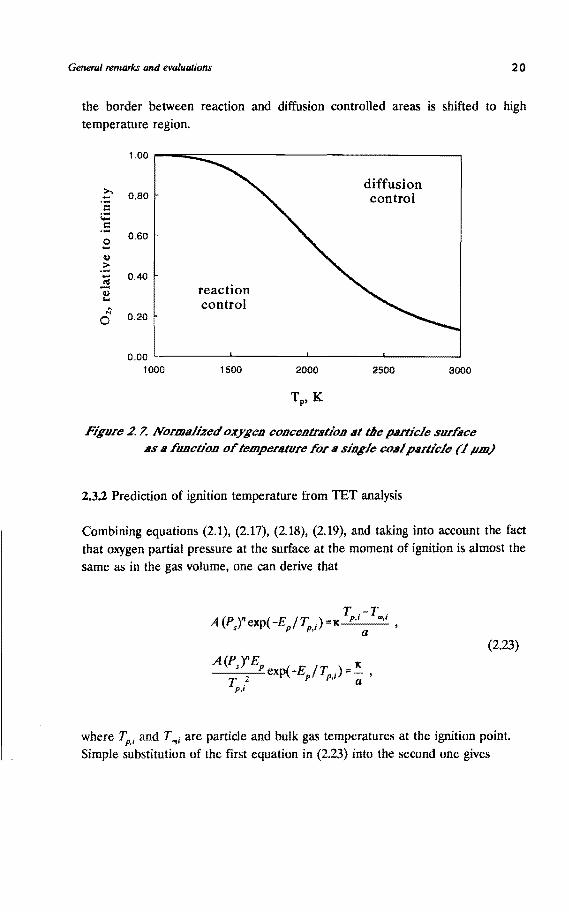
Combining equations (2.1), (2.17), (2.18), (2.19), and taking into account the fact that oxygen partial pressure at the surface at the moment of ignition is almost the same as in the gas volume, one can derive that
A (Psf exp( -E P / Tp,i) a
(2.23)
where Tp,i and T "'; are particle and bulk gas temperatures at the ignition point. Simple substitution of the first equation in (2.23) into the second one gives
Chapter 2 21
(2.24)
and in the case that EP is large comparing with the particle temperature:
(2.25)
Equation (2.24) shows that if the particle and gas temperature at the ignition point
are known, the activation energy can also be determined. This gives the opportunity to derive an activation energy from an ignition experiment.(see, e.g., [25]). To fmd the dependence of the ignition temperature on the particle size one should substitute Tp,i from equation (2.25) into the first equation in (2.23), which gives
Cooling to the gas volume per unit of particle surface is more efficient for small particles than for big ones (see (2.19)). Thus one should expect, that the bulk gas temperature at ignition for small particles will be higher. This can be ·seen from (2.26). Because of the greater influence of the exponent a decrease of the particle size gives rise to the increase of the ignition gas temperature. When decreasing the particle size, one can reach the point where no ignition occurs (see fig. 2.6a). Because of the decrease of the reaction rate with the decrease of the partial oxygen pressure (see equation (2.1)) and from equation (2.19), the influence of the partial oxygen pressure on the ignition gas temperature is similar to the one of the particle size. The exact theoretical analysis of the particle size and partial oxygen pressure influence on the ignition temperature, as well as the experimental evidences of it, are reviewed in [4].
2.3.3 Homogeneous ignition: adiabatic condition
The usual assumption is, that homogeneous ignition occurs in the case of "largeM and "slowly" heated particles [4]. Up to now there are not enough data on the exact
General remarks and evaluations 22
mechanism of homogeneous ignition of small coal particles. It is also not completely understood wether it is overlapping with heterogeneous one. The "adiabatic" criterion has been used in [27] to determine homogeneous ignition
of a pyrolizing coal particle. The criterion of ignition in this model is that the the
spacial temperature gradient is zero at the particle surface. This model is too elaborate to present here in detail.
The influence of oxygen concentration in this case is quite opposite to the case of
heterogeneous ignition. Citing from [27] the explanation for this effect is as follows: "As the oxygen concentration is increased, the stoichiometric surface moves toward
the particle surface ... " "For the same reaction temperature the surface temperature increases which in turn causes the liberation of more volatile and hence involves
more heat transfer to the particle surface. Then the reaction has to liberate more heat. This is achieved through an increase of the reaction temperature which is represented by the ignition temperature according to the adiabatic ignition criterion".
The influence of the particle size on the ignition temperature for homogeneous ignition is similar to the heterogeneous one. Citing further from [27]: "With a decrease in the particle size the gas phase reaction rate as well as the pyrolisate
liberation rate are decreased. This in effect brings the reaction surface closer to the particle surface and consequently the GIT (Gas Ignition Temperature) is increased".
It is also shown in [27] that the ignition mechanism can change from heterogeneous ignition for small particles to homogeneous for big ones.
2.3.4 Homogeneous ignition: ignition position
Experimental results, discussed in [4}, support a model where ignition occurs at a point remote from the surface. To evaluate this position let us consider the
following example:
Example 3. Distribution of volatile and oxygen concentrations around the coal particle. The following assumptions should be taken into account: the flow around the
particle is spherically symmetrical, volatiles are produced at the particle surface and diffuse to the surroundings, oxygen diffuses from the surroundings to the particle and the term Dp, where p is gas density, is constant through the gas volume, which
is the case for not too great variations of temperature (see equation (2.2)). The diffusion of different species without reaction in the volume (before ignition) is
described in, e.g. [14] and [22] as:
Chapter 2
ay I=ovY-Do-1 , J J ar
23
(2.27)
where /i is the flux of a component j of the gas, r the distance from the particle centre, v the radial flow velocity and lj the mass fraction of a gas component j. For
the specific cases of gase nrixtures the subscript j becomes: N2 for nitrogen, 02 for oxygen and V for volatiles.
If the devolatilisation rate at the particle surface is Rd, one can employ the mass continuity equation in the form:
(2.28)
Mass conservation requires:
(2.29)
and for the fluxes at the particle surface s:
(2.30)
The analytical solution in this case is
R a2 1 ~=-d_-.
DQ r
(2.31)
The superscript ( oo) indicates the correspondent values in the bulk gas far from the particle. Fig. 2.8 is a graphical representation of Y02 and Yv distributions calculated from equation (2.31) for a 50 pm coal particle which is similar to what is presented in [4].
General remarks and evaluations 24
It does not represent any particular kind of coal. The values, which have been used for the calculations, are: D=5 ·lrt5 m2js, p=l kgjm3 and Rd=l kgj(m2 s). One can expect that ignition occurs near the point where concentrations of volatiles and oxygen are stoichiometric. Fig. 2.8 in this case presents the ignition zone when this ratio is 1:1 (which can be of course very different in reality). The mechanism, through which ignition occurs at the point remote from the particle surface, can be for example radical chain.
Figure 2. 8. Position of t/Je ignition zone wit/J respect to t/Je particle surface
2.3.5 Chain ignition
Chain ignition is considered in [4] as another possible mechanism of homogeneous coal particle ignition. There are different mechanisms of chain ignition [31]:
- Chain isothermal explosion, when the branching mechanism of the radical production causes a thermal explosion under constant temperature conditions. The usual presentation of this process can be found in [13] and is given by the following kinetic equation:
where n0 is the rate of chain generation, f the rate constant of
(2.32)
Chapter 2
branching, g the rate constant of chain termination and Cc the
concentration of an active product (radicals).
Ignition conditions are reached in this case iff - g > 0 - Chain thermal explosion, when the conditions of isothermal
explosion or usual thermal explosion would not be fulfilled if not for the mutual influence on each other • Degenerate explosion, when the reaction is at once auto-catalytical and branching. Branching in this case occurs due to inter- or intra
molecular reactions.
2.3.6 Clouds of particles
25
A mutual influence of coal particles is practically very well known due to explosions
in mines and grinding-mills. As has been shown in [4] and [32] a cloud of particles
can be treated as a unit in which the effect of heat generation from single particles
accumulate. Thus the total heat generation rate will increase with particle concentration and the heat loss rate decreases with increasing cloud size due to the decrease in surface-to-volume ratio. It has been shown that the drop in ignition temperature can be 100 - 200 K. The expression for ignition temperature in this
case [4] is
(2.33)
where a is an empirical power index, R the cloud radius and De the cloud density. For the case of a dilute cloud ignition characteristics are the same as for a single particle and the ignition temperature for small particles is higher than that for big
ones. In a dense cloud though, the influence of particle size on ignition is exactly reverse. The cloud can be assumed to be dilute if R2D /a2 Pp < < 1. Applying this criterium
for the experiments presented in this work with a reactor volume of about 1 ·Ur2
m3 in case of small ( < 6pm) coal particles, one can estimate that an amount of
introduced into the system should not exceed 1()'8 kg. This is not very realistic value
for the experiments in this study. Thus according to the theory presented an influence of the particle size and the cloud density on the ignition temperature
should be observed in the experiments.
General remarks and evaluaJions 26
2.4 The fundamental basis for current research
The short review presented above introduced a small part of coal research related to coal combustion and igniton problems. The part of this research, which is understood best, is heterogeneous combustion and ignition. The zone theory is very well established and a number of theories, which are valid within a particular Zone is worked out. Problems which occur in research on heterogeneous combustion are more specific and even practical than generaL Most of the experimental works performed with traditional installations (big particles and normal pressures) represent coal particle combustion under conditions of Zone III or II (see fig 2.1). Experiments with coal burning under these conditions either do not give any information on coal characteristics (Zone III, mass transfer limitation) or give information only on apparent characteristics (Zone II, apparent activation energy and reaction order) of coal which are not the same as true ones. Experiments under high pressure and with small particles can occur under conditions in the rough sphere subwne and give us information directly on the true coal combustion characteristics. Extension of experimental data by using an alternative technique such as a shock tube is needed to complete the understanding of the combustion mechanism in different rones. A development of such a technique can be used to build up a laboratory unit for regular coal tests. The understanding of homogeneous combustion and ignition is far less complete. Their mechanisms and influences on heterogeneous combustion and ignition should be questioned in more detail. This concerns such problems as the position of the volatile flame with respect to coal particle, a role of volatile combustion in the heat particle balance, the phase and type of coal ignition. Another problem, which needs further experimental support is the problem of the particle interactions in the cloud.
Literature
1. Field, M. A., et al, Combustion of pulverised coal, The British Coal Utilisation Research Association, Leatherhead, 1967.
2. Smith, I. W., Proceedings of the Ninteenth Symposium (lntemational) on Combustion, The Combustion Institute, Pittsburgh, 1982, 1045-1065.
3. Essenhigh, R. H. and Suuberg, E. M. in: Fundamentals of the PhysicalChemistry of Pulverised Coal Combustion, NATO ASI Series E, 137, Eds. Lahaye, J. and Prado, G., Martinus Nijhoff Publishers, Dordrecht/Boston/ Lancaster, 1987.
Chapter 2 27
4. Essenhigh, R. H., et al, Combust. Flame, 77, 1989, 3-30.
5. Prado, G., et al in: Fundamentals of the Physical-Chemistry of Pulverised Coal
Combustion, NATO ASI Series E, 137, Eds. Lahaye, J. and Prado, G., Martinus Nijhoff Publishers, Dordrecht/Boston/ Lancaster, 1987.
6. Essenhigh, R.H., in: Chemistry of coal utilisation, 2nd Suppl. vol., Ed. Elliot, M.A., John Wiley & Sons, New York, 1981.
7. Smith, I. W., Combust. Flame, 17, 1971, 303-314.
8. Wall, T. F. and Gururajan, V. S., Combust. Flame, 66, 1986, 151-157.
9. Smith, I. W., Combust. Flame, 17, 1971, 421-428.
10. Seeker, W. R., The kinetics of ignition and particle burnout of coal dust
suspensions under rapid heating conditions., Ph.D. Dis., Kansas State University, Kansas, 1979.
11. Mulcahy, M. F. R. and Smith, I. W., Rev. Pure and Appl. Chem, 19, 1969, 81-108.
12. Walker, P. L., et al, in: Advances in Catalysis, vol. XI, Eds. Eley D. D. et al, Academic Press Inc., New York and London, 1959.
13. Frank-Karnenetskii, D. A., Diffusion and heat transfer in chemical kinetics,
Plenum Press, New York-London, 1969.
14. Golovin, A. M. and Pesochin, V. R., Fizika Gorenia i vzriva, (in Russian) AN SSSR, Sib. otd., 6, 1989, 29-36.
16. Carpenter, A. and Skorupska, N., Coal combustion analysis and testing,
IEACR/64, London, UK, 1993.
17. Howard, J. B., et al., in: Fundamentals of the Physical-Chemistry of Pulverised
Coal Combustion, NATO ASI Series E, 137, Eds. Lahaye,J. and Prado, G., Martinus Nijhoff Publishers, Dordrecht/Boston/ Lancaster, 1987.
General remQiks and evaiumions 28
18. Howard, J.B. in: Chemistry of coal utilisation, 2nd Suppl. vol., Ed. Elliot M. A., John Wiley & Sons, New York, 1981.
19. McLean, W. J., et al., Proceedings of the Eighteenth Symposium (International) on Combustion, The Combustion Institute, Pittsburgh, 1981, 1239-1248.
20. Timothy, L D. et al., Proceedings of the Twenty-first Symposium (International) on Combustion, The Combustion Institute, Pittsburgh, 1986, 1141-1148.
21. Midkiff, K. C. et al., Combust. Flame, 64, 1986, 253-266.
22. Howard, J. B. and Essenhigh, R. H., Proceedings of the Eighteenth
Symposium (International) on Combustion, The Combustion Institute, Pittsburgh, 1981, 399-408.
23 Lau, C. W. and Niksa, S., Combust. Flame, 90, 1992, 45-70.
24. Anthony, D. B. and Howard, J. B., A. I. Ch. E Journal, 22, 1976, 625.
25. Woodburn, E. T., et al., Fuel, 53, 1974, 38-46.
26. Gururajan, V. S., et al., Combust. Flame, 81, 1992, 119-132.
27. Annamalai, K. and Durbetaki, P., Combust. Flame, 29, 1992, 193-208.
28. Sel'dovich, J. B., et al., Matematicheskay teoria gorenia i vzriva, (in Russian), Nauka, Leningrad, 1980.
29. Handbook of Chemistry and Physics, 561h edition, Ed. Weast, R. C., CRC Press, Clevelend, Ohio, 1975-1976.
30. Juntgen, H., in: Fundamentals of the Physical-Chemistry of Pulverised Coal Combustion, NATO ASI Series E, 137, Eds. Lahaye, J. and Prado, G., Martinus Nijhoff Publishers, Dordrecht/Boston/ Lancaster, 1987.
31. Mulcahy, M. F. R., Gas kinetics, Thomas Nelson and Sons Ltd, London, 1973.
32. Krishna, C. R. and Berlad, A. L., Combust. Flame, 37, 1980, 207-210.
Chapter 3 29
Chapter 3
Experimental
According with [1] and [2] two main requirements in order to investigate coal particle combustion can be stated as follows: creation of adeqm1.te physical and chemical conditions and development of the measuring technique. The hot gas conditions have to be created in a time much shorter than the characteristic time of interest. For example, if the time for a small (less than 6~J.m) particle to be burnt out completely is about 1-10 ms (usual for these experiments), the time for the creation of hot gas conditions must be at least 10 times shorter,i.e. of the order of 100 IJS. Coal particles have to be suspended homogeneously in the gas. The gas and particle temperatures have to be well defined. All those requirements can be met in the experiments with a shock tube.
3.1 Shock tube technique
The shock tube technique, which has been used here, has advantages and disadvantages in comparison with the usual methods applied to the investigation of coal combustion behaviour. The usual techniques are described, e.g., in [3], [4] and [5]. They make use of thermal gravimetric apparatus, fixed-bed and fluidised-bed reactors, entrained flow reactors, flat flame burners and drop tubes. The shock tube coal research applications are described in many papers. For example, in [6] a shock tube has been used in order to investigate the thermal decomposition and hydrogenation of coal dusts. In [7] a shock tube has been used to produce hot coal combustion gases for an MHD generator. A usual application of a shock tube is to investigate ignition behaviour of coal particles, see, e.g., [2] and [8-10]. Shock tubes also have been used for coal and char combustion experiments in, e.g., [2], [12-14].
3.1.1 Shock tube arrangement
The main advantages of the shock tube technique are an almost instantaneous (dozens of microseconds) creation of the hot gas conditions and a possibility to work in a wide range of the gas temperatures (600- 2500 K) with a wide variety of gases and mixtures with partial pressures from 0 till 10 bar. The main disadvantage is a rather short time available for measurements (about 6 ms),
Experimental 30
which means that if one is interested to cover the complete process of combustion, one is bound to work either with rather small particles ( < 10 pm)
or with particles prepared in advance with other installations with different times of residence under particular conditions. The experiments, presented here, are carried out in a 13 m long shock tube with a diameter of .224 m. The scheme of it with some basic diagnostics is presented in figure 3.1. For the experiments the test section is filled with oxygen, nitrogen or their mixture. The original (filling) pressure in the test section before the experiment can be varied between 25 and 310 mbar. The driver gas is helium or a helium-argon mixture at a pressure of 11 bar for all experiments. The speed of the incident shock is measured by means of the two piezo-electric transducers indicated in figure 3.1. The main measurements are carried out in a shock tube cross section at 0.04 m from the end plate. There the following basic experimental arrangement has been installed: a set of optical windows which are used for infrared diagnostics on different wavelengths and temperature measurements, and a pressure transducer, which indicates the arrival of the shock waves and hence, the moment when the hot gas conditions are created.
-7
front plate
diaphragm section
\ \
I I I I I I
aspiration \
\ \
\ \
pressure transd. _,...,
; I /
' ' ' -.,:- - - - -- - - - - 'i·- - - - end plate
I
driver section /
plastic diaphragm
I I
test section
vacuum chamber
windows IR diagnostics
Figure .J. I. TlJe expcrimentai sclJeme
The procedure to create a shock wave is performed in a following sequence (see fig. 3.1):
-The test section is filled with the test gas under pressures as mentioned above -The driver section is filled with the driver gas under pressures as mentioned above
Chapter3 31
time
-The diaphragm section is filled with the same gas as in the driver section but under a pressure, which is two times lower -The vacuum chamber is evacuated down to a pressure of 1 ·10·4 torr
-Several seconds before the experiment the aspiration system introduces the pulverised coal in the test section of the shock tube -The plastic diaphragm is being ruptured and the gas flows from the diaphragm section to the vacuum chamber -Because of the high pressure difference the two metal diaphragms of the diaphragm section are being ruptured in succession and the incident shock wave, formed by the presure difference in the driver and in the test section, propagates through the test section originates.
diaphragm section
head of / f . /
rare action / wave /
/ /
/
medium
Ficurc .1.2. Distance-time (x-t) tliacrll1ZI
Fig. 3.2 is a distance-time (x-t) diagram of the shock tube, where the position of shock waves, rarefaction waves and medium interface are plotted horizontally and the corresponding time after the rupture of diaphragms is plotted vertically. After rupture of the diaphragm the incident shock wave travels to the right in the direction of the end plate with the velocity C;, forming a supersonic flow of test gas behind it with a velocity u,. The parameters of this gas are as follows: the gas temperature T, is about 500 - 700 K and the pressure p, is about 2 bar.
Experimental 32
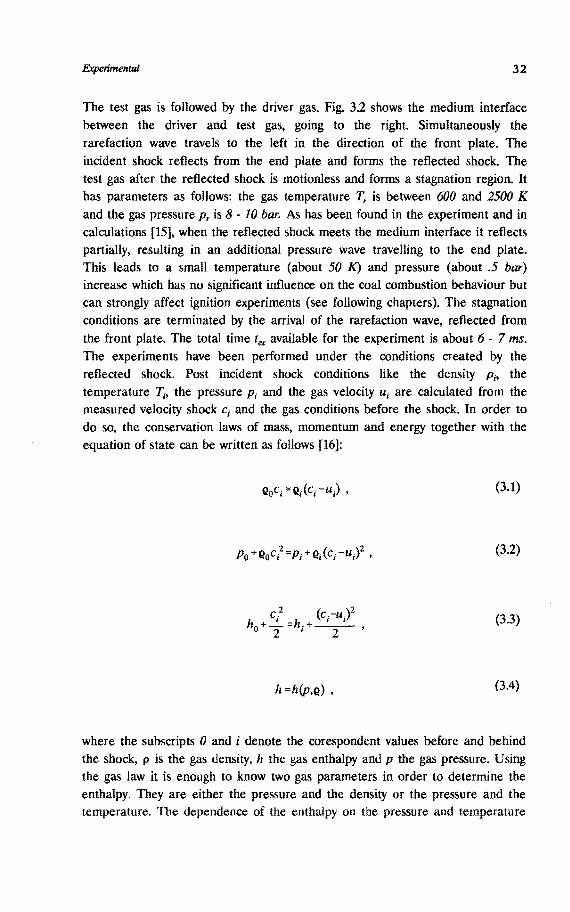
The test gas is followed by the driver gas. Fig. 3.2 shows the medium interface between the driver and test gas, going to the right. Simultaneously the rarefaction wave travels to the left in the direction of the front plate. The incident shock reflects from the end plate and forms the reflected shock. The test gas after the reflected shock is motionless and forms a stagnation region. It has parameters as follows: the gas temperature T, is between 600 and 2500 K
and the gas pressure p, is 8 - 10 bar. As has been found in the experiment and in calculations [15], when the reflected shock meets the medium interface it reflects partially, resulting in an additional pressure wave travelling to the end plate. This leads to a small temperature (about 50 K) and pressure (about .5 bar)
increase which has no significant influence on the coal combustion behaviour but can strongly affect ignition experiments (see following chapters). The stagnation conditions are terminated by the arrival of the rarefaction wave, reflected from the front plate. The total time tex available for the experiment is about 6 - 7 ms. The experiments have been performed under the conditions created by the reflected shock. Post incident shock conditions like the density P;. the temperature T;. the pressure P; and the gas velocity u; are calculated from the measured velocity shock c; and the gas conditions before the shock. In order to do so, the conservation laws of mass, momentum and energy together with the equation of state can be written as follows [16]:
(3.1)
(3.2)
(3.3)
h =h(p,Q) ' {3.4)
where the subscripts 0 and i denote the corespondent values before and behind the shock, p is the gas density, h the gas enthalpy and p the gas pressure. Using the ga<> law it is enough to know two gas parameters in order to determine the enthalpy. They are either the pressure and the density or the pressure and the temperature. The dependence of the enthalpy on the pressure and temperature
Chapter 3 33
has been used from [17). Unfortunately an analytical solution of the equations above is possible only for an ideal gas. Approximate analytical solutions, used, for example in [2], can lead to an error of several hundred degrees K in the determinating of the gas temperature. After reflection of the incident shock from the end plate the shock obtains a velocity <; and, according to the condition on the wall, makes the gas behind it to stop. Post reflected shock conditions like density Pr and temperature Tr are calculated from the conditions behind reflected shock.
(3.5)
(3.6)
(c +u.f c 2 h.+ r 1 =-h + r ' 2 r
(3.7)
where the subscript r denotes the corresponding values behind the reflected shock. To make this system of equations complete one should use equation (1.4). A numerical computer program to calculate the gas conditions of interest has been made.
1.00 --~-~
experiment
0.80
.~ c: :J 0.60 .0 iii !!! :J 0.40 ..
second reflection .. !!! a.
incident calculation
0.20
shock~
0.00 0 2 3 4 5 6
time,ms
Figure 3.3. Gas pressure RJCIJSured in the experiment and calculated from tl.te model
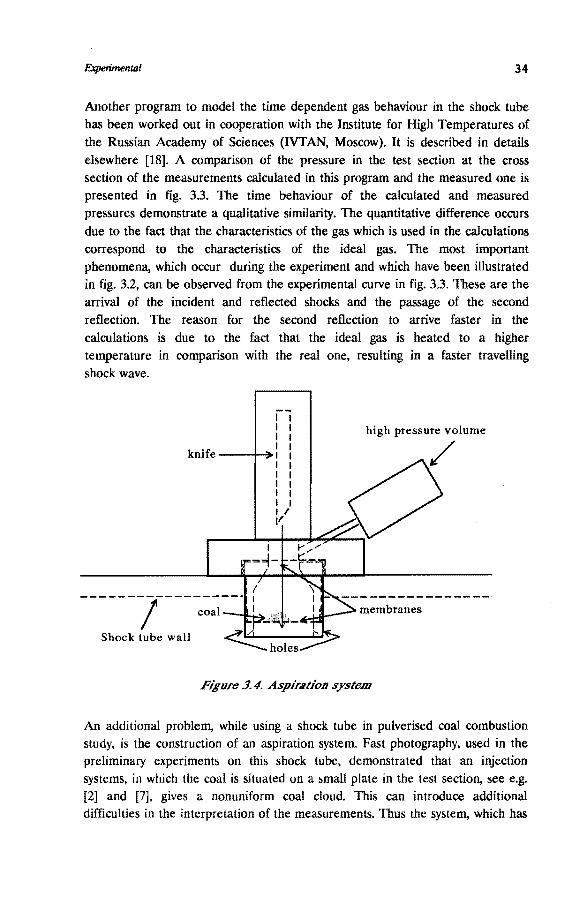
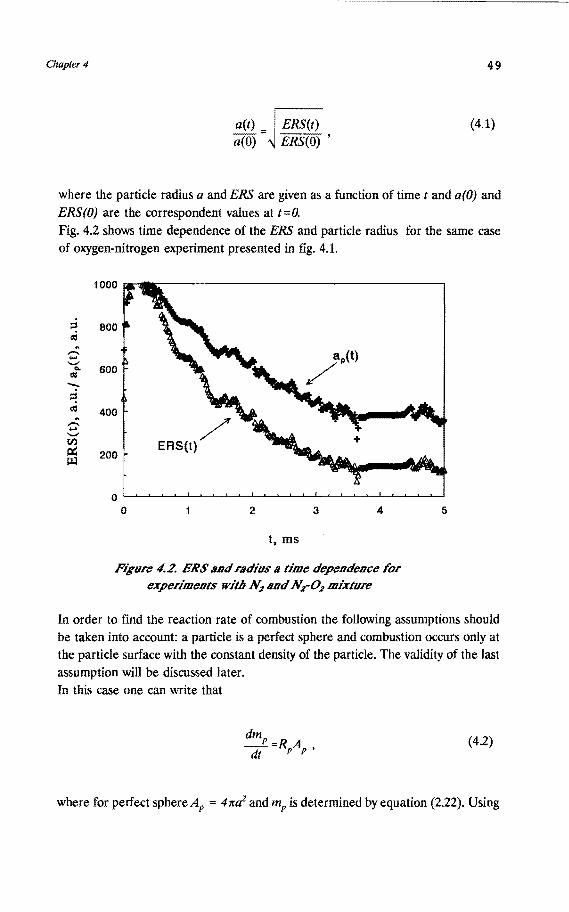
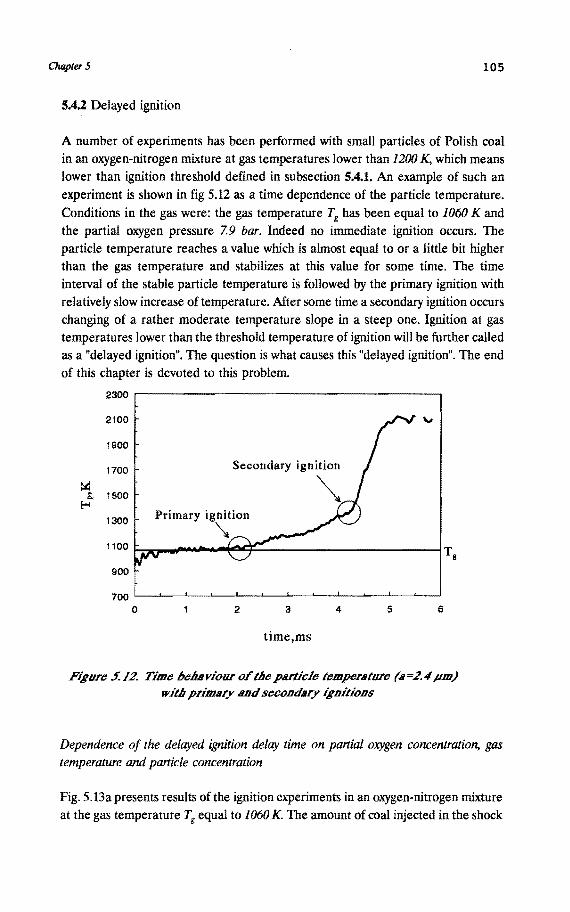
Experimental 34
Another program to model the time dependent gas behaviour in the shock tube has been worked out in cooperation with the Institute for High Temperatures of the Russian Academy of Sciences (IVTAN, Moscow). It is described in details elsewhere [18]. A comparison of the pressure in the test section at the cross section of the measurements calculated in this program and the measured one is presented in fig. 3.3. The time behaviour of the calculated and measured pressures demonstrate a qualitative similarity. The quantitative difference occurs due to the fact that the characteristics of the gas which is used in the calculations correspond to the characteristics of the ideal gas. The most important phenomena, which occur during the experiment and which have been illustrated in fig. 3.2, can be observed from the experimental curve in fig. 3.3. These are the arrival of the incident and reflected shocks and the passage of the second reflection. The reason for the second reflection to arrive faster in the calculations is due to the fact that the ideal gas is heated to a higher temperature in comparison with the real one, resulting in a faster travelling shock wave.
~-1 I I
knife ---i-ii> I I I I I I I I' I'
------------------1
Shock tube wall
high pressure volume
/
Figure 3.4. Aspiration system
An additional problem, while using a shock tube in pulverised coal combustion study, is the construction of an aspiration system. Fast photography, used in the preliminary experiments on this shock tube, demonstrated that an injection systems, in which the coal is situated on a small plate in the test section. see e.g. [2] and [7], gives a nonuniform coal cloud. This can introduce additional difficulties in the interpretation of the measurements. Thus the system, which has
Chapter 3 35
been used in this work is closer to the ones described in [13] and [14]. It is characterised by the introduction of the coal particles as a cloud before the arrival of the incident shock wave. Fig. 3.4 presents the aspiration system, used in this work. The coal is situated between two plastic membranes. Just before the experiment the knife, moved pneumatically, cuts through the membranes. At this moment the pressure in the test section of the shock tube is about 50 - 300
mbar. The static pressure in the high pressure volume of the aspiration system is 4 bar. Due to the pressure difference the coal particles are being blown into the test section of the shock tube and form there a cloud. Several seconds after this the experiment starts.
3.1.2 Particle behaviour in the shock tube
The particles, injected in the shock tube, undergo high acceleration and heating. They are being accelerated by the gas flow behind the incident shock and decelerated by the stagnated gas behind the reflected shock. Taking into account Bernoulli's and Stoke's laws one can write an equation for the acceleration of a spherical particle as follows:
4 3 du -F C - n:a Op-- dr D • 3 dt
(3.8)
where u is the difference between the particle and gas velocities, F dr is the drag force, C0 the drag coefficient (order of magnitude 1), Pg the gas density and 'lv the gas viscosity. A characteristic value for the velocity difference u in this experiment is J{j m/s, for the gas density Pg=J kg/m3 and for the viscosity about 51£t5 kg/m s (see [19]). The first term in the equation for the drag force is at least 5 times bigger than the second one for the particle radius a equal to 3 p.m.
Taking into account only the first term in the equation for the drag force one can write for the characteristic time ta for the particle to accelerate the following equation:
8 Op a t .. ___ .
a 3 Og U (3.9)
The ratio of the particle density Pp to the gas density Pg is usually about Jfi. The
Experimental 36
characteristic time t • calculated for a 3 p.m particle is about 10 p.s and for a 30 p.m one it is 10 times longer. Those times are much smaller than times resolved in the experiment. Thus the relative movement of the particles with respect to the gas can be neglected. The time th for a particle to be heated up can be evaluated from equations (2.15) and (2.19), setting the term Q+ of the reaction heat release equal to 0. The equation for tn can be written as follows:
(3.10)
It needs about 100 p.s for a 3 p.m particle to be heated to the gas temperature. And this time is much smaller than the characteristic time of the experiment. The similar value but for a 30 p.m particle is 100 times higher and is longer than the characteristic time of the experiment. Because of this fact the big particles can hardly be used in· the combustion experiments.
3.2 Experimental techniques
There are three main experimental techniques used in this experiment. They are the two wavelength infrared (IR) pyrometry, the extinction technique and emission spectroscopy. The main features of these experimental techniques together with their direct experimental arrangement are outlined in this section. A more detailed description of them concerning signal evaluation and their application to the experimental methods is given in the next chapters. A schematical representation of the positioning of the experimental tools positioning on the shock tube is given in fig. 3.5.
3.2.1 IR two wavelength pyrometry
The two wavelength pyrometry has been used in various works in order to determine the temperature of solid clouds, dispersed in a gas phase. In [20] and [21], for example, it has been used for the temperature measurements of burning pulverised-fuel particles. Single particle temperature measurements using this technique have been performed in [22] and [23]. The IR pyrometry (1 in fig. 3.5) deals with the light emitted from the cloud of coal particles in the shock tube through the quartz window and converged by the spherical mirror directly on the IR silica beam splitter. After the splitter the light is going through the narrow band IR filters to the IR photocells. It is very important to choose the filters in a way that no gas line emission will be
Chapter 3 37
detected by the detectors. The wavelengths, used in this work, were 1.36 and 22 p.m, which are the same as the ones, used in [23]. The intensity of the particle continuum emission obeys Planck's law and can be written for two different wavelengths 1 and 2 as follows:
(3.11)
where Aw is the preexponential factor in Planck's law, e1,2 the particle emissivity, 11,2 the pyrometrical wavelengths, C the second constant in Planck's law and 411,2 the spectral width of the filters.
shock tube
3a 0
3b 0
laser
1
chopper
2b
1. IR pyrometry
2 a,b. Extinction
3 a,b. IR spectroscopy
O<t: photocells
(/ mirrors
t------1 filters
Figure 3.S. Tile experimental tools positioning
The coal particles have been considered to emit as a grey body, with e1 = e2• A cloud, consisted of the "grey" particles, is not necessarily grey. Evaluations of a deviation of the cloud emission from the grey body emission will be performed in the next chapter. A calibration of the pyrometrical system with a band lamp removes an uncertainty in determination of A,.. and 411,2• From the ratio of the intensities derived from equation (3.11) at two different wavelengths a particle temperature can be calculated. Determination of the calibrated band lamp temperature has been performed within 20 K of accuracy.
Experimental 38
In case of an optically thin cloud the preexponential factor A.., is proportional to the total radiation surface, which means to the number of particles multiplied by the radiating surface of a single particle, seen from the measuring system. It is not possible to determine the absolute value of A.., from equation (3.11) but it is possible to measure its relative change in time, which will correspond to the change in time of the effective radiation surface (ERS).
3.2.2 Arrangement of the extinction measurements
Laser extinction methods have been applied to investigate the behaviour of soot particles in shock tube experiments in [13] and [14]. This method is based on the extinction of the laser light, transmitted across the shock tube. It has been used for burnout measurements in pulverised particle combustion. A detailed presentation of the application of the extinction arrangement to burnout measurements is given in chapter 4. Extinction measurements in this experimental work have been performed using a He·Ne laser with the wavelength of 3.4 !J.m. The choice of the wavelength has been determined by several factors: a possible combination of the extinction measurements with IR pyrometry (see chapter 4), a low dependence of the extinction coefficient on the wavelength (see chapter 4 and [2]) and availability of the experimental devices. This wavelength is very close to the wavelength of the hydrocarbon absorption and emission. Because of this, extinction measurements have been used only after the fact has been established, that there is no volatile matter in the gas phase (see chapter 4). A schematic representation of the arrangement for the extinction measurements is presented in fig. 3.5 (2 a and b). It consists of a He· Ne laser, a chopper, quartz windows and an IR detector. The amplitudes of the chopped signal before and during experiment have been compared in order to measure extinction.
3.2.3 Arrangement of the IR emission spectroscopy
IR spectroscopy is widely used in investigations of flames, see e.g. [24], and dispersed phase combustion investigations, see e.g. [14]. Emission spectroscopy has been applied in these experiments in order to indicate the presence of carbon monoxide, carbon dioxide and hydrocarbons in the gaseous phase in reaction volume. The emission spectroscopy technique, used in these experiments, consists of IR photocells and narrow band spectral filters. The photocells with filters have been situated directly behind the shock tube windows (see fig. 3.5). The windows are made of ZnSe, a material which is transparent in the IR spectral region of interest. The wavelengths have been chosen in spectral regions, where particular gaseous species of interest have a strong absorption
Chapter 3 39
line in comparison with spectral lines of other gases (especially water vapour). The chosen wavelengths are: 3.46 p.m for hydrocarbons, 4.26 p.m for carbon dioxide and 4. 70 p.m for carbon monoxide (see [24] and [25]). All of them correspond to vibrational-rotational spectral bands. Because of the fact that the rotational structure is not resolved by these spectral measurements the lines are treated as simple vibrational. The spectral width 4}.. of the narrow band filters, used in these experiments have been equal to .2 p.m. The validity of the chosen wavelengths for emission spectroscopy have been checked in experiments with pure carbon monoxide, carbon dioxide and propane and revealed a strong emission signal coming from the shock tube, when hot gas conditions have been reached. In order to check the sensitivity and to calibrate the complete experimental spectral arrangement, a special calibrating device for absorption spectroscopy has been designed. It is shown in fig. 3.6.
to pump
l
to power supply~·---I_
l Ar
W ribbon
t)
~ /vr\ to pump
l sap hire windows
/ \ IR detector
~C2] filter
l chopper
1 0-ring
l CO, C02, propane
Figure .1. 6. IR ca/ihratioo device for spectroscopical measurements
The calibrating device consists of two chambers: a chamber with a light source and a chamber with a test gas. A tungsten ribbon, heated by electric current, has been used as a light source. To prevent fast oxidation of the ribbon the chamber of the light source has been evacuated and filled with 10 to" of argon. The test gas chamber is separated from the light source chamber and the external detecting system by IR-transparent sapphire windows. The detection system consists of a chopper and an IR detector with a narrow band filter. Gases, which have been used in the calibrations are carbon monoxide, carbon dioxide and propane. A ratio of the transmitted light intensity (/,) to the incident one (/;) is
Experimental 40
a function of the absorbing gas pressure (pa) and the length of the light path through the absorbing gas (Ia) (see, e.g., [26]) and can be written as follows:
(3.12)
where Apr is a pressure coefficient. The results of the calibration are presented in fig. 3.7 in a logarithmic scale. The graph of C02 absorption obeys equation (3.12) for pressures lower than 100 to". The saturation of the C02 graph can be explained by the fact that the spectral width of the filter is bigger than the line width. It can cause about 30 % error in the measurements of the gas concentration under normal pressures. This error is lower for higher pressures, where the spectral line is significantly more broadened. Such a saturation has not been observed for the calibrations with CO
and propane.
1 0.9 0.8 0.7 0.6
0.5
> 0.4 <IS
<IS 0.3 = ~ {/)
0.2
pressure, torr
Figure 3. 7. Calibration curves for CO,. C02 and iJydrocarbon
Another source of error is an influence of the negative absorption [26] due to the high population of the high vibrational levels. A calculation performed in [27] for o~J vibrational transition, 4. 7 JJm transition shows that at the gas temperature of about 300 K the population of the first level is about 3.261 irl times lower than of the zero level. A similar calculation shows that at the gas
Chapter 3 41
temperature of about 1500 K the population of the first level is about 13 % of the zero level. Thus the influence of the negative absorption can be neglected
within these frames of accuracy. Similar calculations, which give accuracies from
5 - 10 % are valid also for carbon dioxide and propane. These suppositions are considered to be satisfactory for the measurements performed in order to
indicate the existence of a particular substance in the gas phase.
3.3 Coal samples
3.3.1 Coal characteristics
Analysis of the coal, which has been used in these experiments, is presented in
table 3.1. The coal has been ground, sieved and analyzed at the European Centre for Coal Specimens (SBN). The finest Polish and Illawara coals ( < 6 p.m
in diameter) have been used in the burn out experiments. The big Polish and
Canadian coals ( < 70 p.m) have been used in the ignition experiments. Before
the experiments the big coal has been sieved additionally to obtain a fraction
between 44 and 62 p.m. The value for coal density, which have been used for
calculations in this work, is about 1200 kg/m3• This value has been obtained in
private communication with Mr. A van der Veen at SBN. 95 % of the finest
coal has a size less than 6 p.m. Distribution tests for the Polish coal have been run at Hosakawa Micron using coulter counter technique. This distribution is presented in fig. 3.8. An agglomeration of the coal particles is responsible for the presence of particles with sizes higher than 6 p.m. The problem of agglomeration is solved by the injection system, used in the experiment, and the rupture of agglomerates by the incident shock (see, e.g. [2)). The particle size distribution
for the small particles for both coals is assumed to be linear (see fig. 3.8) with
the maximum diameter equal to 6 p.m and the minimum diameter equal to 2 p.m.
The linear distribution of the coal particle size is apparently a characteristic of the grinding device and the sieving procedure.
3.3.2 Particle mean size
It is possible to introduce different values for a mean particle size. Considering a particle number distribution as f(xp) with particle diameter xP the total number of
particles N can be written as
Experimental
PROXIMATE ANALYSIS
(%WEIGHT)
COAL SAMPLE: 236P042
MINE: PARYZ COUNTRY: POLAND
ASH VOLM FIX-C
DRY DRY DRY
3.50 41..40 55.10
C H N s CI
CAL VAL
(MI/kg) DRY
32.94
ULTIMATE ANALYSIS (DRY)
(%WEIGHT) 77.70 5.66 1.86 0.96 0.05
0-dif
10.30
PROXIMATE ANALYSIS
(%WEIGHT)
COAL SAMPLE: 217AU24
MINE: ILLA W ARA
COUNTRY: AUSTRALIA
ASH VOLM FIX-C
DRY DRY DRY
14.42 30.36 65.22
ULTIMATE ANALYSIS (DRY) c H N
(%WEIGHT)
PROXIMATE ANALYSIS (%WEIGHT)
76.60 4.18 1.36
COAL SAMPLE: 256CA39
MINE: COAL VALLEY
COUNTRY: CANADA
ASH VOLM FIX-C DRY DRY DRY
10.90 34.80 54.30
c H N
s 0.30
s
CAL VAL
(MI/kg) DRY
34.49
CI 0-dif
0.04 3.10
CI
CAL VAL (MI/kg) DRY
28.16
ULTIMATE ANALYSIS (DRY)
(%WEIGHT) 70.03 4.65 0.96 0.20 0.01
0-dif
13.25
Table J. 1. Analysis of coal used in this study
42
Chapter 3 43
(3.13)
where dmin and dmax are the minimum and the maximum particle diameters. Then the mean linear particle diameter dt> the mean square particle diameter dsrelated to particle surface, and the mean cubic particle diameter de, related to particle volume or mass can be written as follows:
(3.14)
The values calculated for small particles ( < 6 pm) using the linear distribution. presented in fig. 3.8, are as follows: d1 = 4.3 pm, ds = 4.5 pm, de 4.6 pm. Most of the measurements, performed in this work, are proportional to the particle surface, which means that the mean square particle diameter suites the measured values the best. A small correction to this value though can be introduced. Due to reaction at the particle surface the particles are being heated proportional to their surface (see equations (2.17)-(2.19)) but cooled only proportional to their linear dimension. This introduces a spread in the particle temperature as a function of the particle size. Bigger particles will have higher temperature. Due to the characteristics of the two wavelength pyrometry the particles with higher temperature will have bigger influence on the temperature and effective radiation surface measurements, because of exponential dependence of the intensity on the particle temperature in Planck's law (see equation (3.11)). A corrected value for a mean particle diameter dr can be calculated on the basis of equation (2.17)-(2.19) and (3.11) as follows:
Experimental 44
[ l Ld-exp[ (T +C ) L\(~)]x;f(xP)dxP
exp C 4(~) d/ = ___ ___: __ • _4_,_P-='~::---~---(3.15)
- HcRp 1 _ 1 1 4P--K-' L\(I)- l.
1- 1
2'
where T m is the measured particle temperature and «p represents the temperature spread due to combustion. Computer calculations of the mean radiative diameter have been performed with variables in equation (3.15) set to usual values for these experiments as follows: Q = 10 MJ/kg, RP = 1 kg/(m2 s),
K = .1 Jj(m2 s K), T. = 1500 K, Tm = 2000 K and with the linear distribution from fig. 3.8. The obtained value of d, is equal to 4.9 p.m. All calculations involving particle size for small coal particles ( < 6 p.m ), performed in this work. are related to this value as a mean particle diameter. Apparently it varies with a change of the heat release. But a comparison of the mean square diameter with the mean radiative one shows that the change lays within 10% of accuracy. A size distribution for big particles ( < 70 pm) does not play any significant role in
this work (see chapter 5).
-;:agglomeration
::i 8.00 ~ ..: Ill
6.00 .&> E ;:t d
~ 4.00 .2 -.. "' 2.00 .; Q, .....
.; ........
........ mean
0.00 0 1 2 3 4 5 6 7 8
particle size, ~m
Figure 3.8. Particle number distribution
Chapter 3 45
Literature
1. Field, M.A, et al., Combustion of pulverised coal, The British Coal Utilisation Research Association, Leatherhead, 1967.
2. Seeker, W. R., The kinetics of ignition and particle burnout of coal dust
suspensions under rapid heating conditions., Ph.D. Dis., Kansas State University, Kansas, 1979.
3. Carpenter, A. M. and Scorupska, N. M., Coal combustion - analysis and
testing., IEACR/64, London, UK, 1993.
4. Smith, I. W., et al., Coal Combustion Testing: Optimum Laboratory
Procedure, End of Grant Report No 993, Commonwealth of Australia National Energy Research, Development and Demonstration Program, Department of Primary Industries and Energy, Canberra, Australia, 1991.
5. Ten Brink, H. M., et al., Mineral Transformations in Staged Combustion of
Pulverised Coal, Netherlands Energy Research Foundation ECN, Service Unit General Services, Petten, The Netherlands, 1991.
6. Woodburn, E. T., et al., Fuel, 53, 1974, 38-46.
7. Yoshikawa, K., et al., Specialists Meeting on Coal Fired Power Generation,
The Institute of Engineers, Sydney, 1981, 4.4.1-4.4.7
8. Seeker, W. R., et al., Proceedings of the Seventeenth Symposium (International) on Combustion, The Combustion Institute, Pittsburgh, 1978,
155-166.
9. Nettleton, M.A. and Stirling, R., Proc. Roy. Soc., A300, London, 1967, 62-77.
10. Boiko, V. M., et al., Fizika Gorenia i vzriva (in Russian), 27, 2, 1991, 101-111.
11. Nettleton, M. A. and Stirling, R., Proc. Roy. Soc., A322, London, 1971, 207-221.
12. Nettleton, M.A. and Stirling, R., Combust. Flame., 22, 1974, 407-414.
Experimental 46
13. Park, C. and Appleton, J.P., Combust. Flame., 20, 1973, 369-379.
15. Banin V. E., et aL, Proceedings of the Seventh International Conference on
Coal Science, Banff, Canada, 1993, 31-34.
16. Shapiro, A. H., The Dynamics and Thennodynamics of Compressible Fluid
Flow, John Wiley & Sons, New York, 1953.
17. Barin, I., Thennochemical Data of Pure Substances, 2nd-edit., VCH,
Weinheirn, 1989.
18. Ivanov, V. A., et al., Proceedings of the First Russian National Conference
on Heat Transfer (in Russian), Moscow, 21-25 th November, 1994.
19. Handbook of Chemistry and Physics, 561h edition, Ed. Weast, R.C., CRC
Press, Clevelend, Ohio, 1975-1976.
20. Ayling, A. B. and Smith I. W., Combust. Flame., 18, 1972, 173-184.
21. Midkief, K C., et al., Combust. Flame., 64, 1986, 253-266.
22. Timothy, L. D., et aL, Proceedings of the Ninteenth Symposium
(International) on Combustion, The Combustion Institute, Pittsburgh, 1982,
1123-1130.
23. Fletcher, T. H., Comb. Sci and Tech., 63, 1989, 89-105.
24. Handbook of Spectroscopy, Ed. Robinson, J. W., CRC Press, Clevelend,
Ohio, 1981.
25. Atlas of Absorption Lines, Eds. Perk, J. H., et a!., NASA Reference Publication, 1987, 1188.
26. Frish S. E., in: Spectroscopy of gasdischarge pla5ma (in Russian), Ed. Frish S. E., Nauka, Leningrad, 1970.
27. McCartney, E. J., Absorption and Emission by Atmospheric Gases, The Physical Process, John Wiley & Sons, New York, 1983.
Chapter4 47
Chapter 4.
Methods and results of combustion experiments
A description of experimental methods, based on measurement techniques and experimental tools which were outlined in subsection 3.2, as well as the results obtained are presented in this chapter. Because of the reasons mentioned in subsection 3.1, experiments on combustion have been performed only with small particles with a diameter less than 6 pm.
4.1 Experimental methods
Reaction rates of coal particle combustion have been measured in two different ways: through direct measurements of change in particle size (method of burnout) and through measurements of energy release due to combustion ( energy balance method). Both methods are based on two wavelength infrared pyrometry, introduced in subsection 3.2, and have been performed simultaneously and spatially coherent. Besides, an attempt to measure the CO and C02 release during the combustion process has been made using infrared emission spectroscopic technique (see subsection 3.2).
4.1.1 Burnout measurements
The burnout measurements have been performed with the use of infrared pyrometry and yield a value of relative burnout (see subsection 3.2). As has been mentioned in subsection 3.2, in case of optically thin clouds. the value which is obtained in experiments as the pre-exponential factor in Planck's law (see equation (3.11)) is the effective radiation surface. It is proportional to the single particle surface and the total number of particles seen by the detector. To prove the fact that the total number of particles stays practically unchanged and not disturbed (e.g., by unexpected gas movements in the shock tube) during the time of the measurements, experiments with nitrogen have been performed. Fig. 4.1 presents the results of two coal experiments with nitrogen and with a nitrogenoxygen mixture, performed at comparable (within 50 K) gas temperatures. Both effective radiation surface and particle temperature curves are presented as a
Methods and results 48
function of time. The steep rise of the temperature in both figures corresponds to the arrival of the reflected shock and hence to the starting point when the stable hot gas conditions are set. As has been shown in subsection 3.1 the temperature of a small ( < 6 pm) particle follows a change of the gas temperature within a hundred of microseconds. In the nitrogen experiment, the particle temperature stays close to the temperature of the gas, while in the experiment with the nitrogen-oxygen mixture it is higher than the gas temperature, obviously due to the heat release during combustion (see fig. 4.1).
2400 r------------------------------------------,
2000
~ ;;. 1600
E-< - 1200
400
2 3 4
t, ms
Figure 4. J. Particle tempcnture 110d ERS time dependence for experiments wi/lJ H;110d Nr02 mixture
5
The change of the effective radiation surface in time also reveals quite different behaviour. In the nitrogen experiment, the value of the effective radiation surface stays almost constant, while for the oxygen-nitrogen mixture it decreases significantly. In the nitrogen experiment the single particle surface does not change because no combustion occurs. Thus the constant behaviour of the effective radiation surface shows that no significant change in the total particle number for at least 5 ms after shock arrival takes place. Therefore, the change of the effective surface of radiation in the experiments with the oxygen-nitrogen mixture reveals the real change in the surface of a single particle with a constant total number of them exposed for measuring devices. A relative change in a single particle size relates to an effective radiation surface (ERS) changing as
Chapter 4
a(t) _ ERS(t) a(O) - ERS(O)
49
(4.1)
where the particle radius a and ERS are given as a function of time t and a(O) and ERS(O) are the correspondent values at t=O.
Fig. 4.2 shows time dependence of the ERS and particle radius for the same case of oxygen-nitrogen experiment presented in fig. 4.1.
::s CIS --......, "' CIS
"":."-=! CIS ~ ,...... -......, tl.)
~ p:,;j
1000
800
600
400
200
t, ms
Figure 4.2. E.RS 1t11tl radius a time dependence for experiments wit/J ~ 1t11tl ~-02 mixture
In order to find the reaction rate of combustion the following assumptions should be taken into account: a particle is a perfect sphere and combustion occurs only at the particle surface with the constant density of the particle. The validity of the last
assumption will be discussed later. In this case one can write that
(4.2)
where for perfect sphere AP = 4n:a2 and mP is determined by equation (2.22). Using
Methods and results 50
these assumptions, the equation for the particle combustion rate can be rewritten as follows:
(4.3)
Assuming further that the maximum of the relative radius curve (see fig. 4.2)
corresponds to the original particle size before combustion and the slope of the curve represents the first time derivative of the particle radius, one can find the
reaction rate of combustion (Rp). The problem of mean particle sizes has been discussed before in subsection 3.3. A mean radiative size (mean diameter) equal to 4.9 pm in case of small particles has
been chosen for the measurements presented here. During combustion though, the
particle distribution can change, e.g. due to the faster burn-off of the small particles. To evaluate an influence of the distribution change on the relative particle size measurements, a small program has been made. Let us assume that the particle temperature, measured in the experiment and assigned to the temperature of
particles of the mean radiative size, is the same for particles of all sizes. Before combustion begins this assumption only represents the definition of the mean radiative size and during combustion the deviation of the particle temperature from the mean value is considered to be the second order effect compared to the complete burn-off effect of the smallest particles in the distribution. The total ERS as a function of time can be presented in this case as a sum of all particle surfaces
as follows:
ERS(t) ='E[;tw.a;,~ , (4.4)
where ft is the statistical weight of particles with radius between ap,lO) and ap,;(O) + Lla. According to equation (4.3) the change of the particle size can be written as
(4.5)
The change of the particle size is independent on the particle size and therefore the particle distribution changes. The system of equations (4.4)-(4.5) has been solved
numerically for values of RP = 1 kg/m2 s, Pp = 1200 kgjm3 and particle distribution presented in subsection 3.3.
Chapter 4 51
Simulteneously a calculation of the burnout of mono-sized 4.9 p.m particles under
the same conditions has been performed. The results of these calculations are presented in fig. 4.3. The relative particle size behaviour in time for both cases is rather close to each other and the difference lays within accuracy of the measurements.
4.) N
1.0
'iii 0.8 ~ t.l
·t: o.6 = Q.
"'0 ~ 0.4 ...... -= e ~ 0.2 ~
0.0 0
,. "" ""
1
"" """" mono-sized particles ····... I •••••••• •••
2 3 4
t, ms
"""" "", ,.
5 6
Fl!fure lfi.:J. Relatire jJIU'Iicle si'ze /Jellaviour in time for monosi'zed {4..9 pm) particles ud witll particle distribution {accordinlf to .J.:J)
The actual cloud of particles is not necessarily optically thin. Treating the emitting particle cloud as a grey body, with the emissivity of each single particle equal to 1, one can introduce a dimensionless emissivity factor for a cloud fl, which is the total surface of all particles emitting in the direction of the detector divided by the total surface of the gas volume exposed to it multiplied by the extinction coefficient Q .... An experimentator should arrange an extinction experiment in such a way that an acceptance angle of the optical detection system is smaller than the scattering angle of the first diffraction maximum (see, e.g. [1]). The acceptance angle of the optical
scheme in the experiments presented in this study is equal to .028. The minimum difraction angle (for the shortest wavelength 1.34 p.m) is equal to .045. This means that the condition of extinction measurements is fulfilled. The extinction coefficient shows the fact that the real extinction surface can be bigger than the real particle surface due to Mie scattering on the particle (see, e.g., [1 ]). Calculations of the extinction coefficient for coal particles can be found, e.g. in [2]. Calculations of the extinction coefficient for this study have been performed by F. Commissaris [3] on the basis of [l] anq [4] for a coal particle with a = 2.4 p.m. Results of these calculations are presented in fig. 4.4 as a function of the
Methods and results 52
wavelength. At the wavelengths about 1.3 - 2.2 p.m the value of Qa: is about 2.4 -2.6. An expression for the dimensionless emissivity factor can be written as follows:
(4.6)
where n is the number density of particles, SP the cross-section of a single particle and I the length of the emitting chamber. One can easily see that the emissivity here
is closely related to ERS, because it is proportional to the number concentration of particles and the single particle surface.
0 2 3 4
"A, J..lffi
Figure 4. 4. Particle extinction coefficient as function of wavelengt!J (radius a=2.4 pm}
5
Particles emit from their actual surface and absorb by the surface which is bigger
than their actual surface by the factor Qex . Therefore the total emissivity of the
cloud can be written as
Tlr: =f.....!!.... exp(-~x)dx = -1-(1-e -~) ,
0 Qj. / Qex (4.7)
where x is the coordinate along the optical axis. The measured value of interest is
Chapter 4 53
the total emissivity normalised on the initial total emissivity. The first derivative of
the emissivity with respect to time is
d(fl:dflo) =P d{n/no) , dt dt
(4.8)
where the subscript (0) mentions the initial value of a corresponding term. From
the equation (4.6) '1 /flo is equal to ERS(t) / ERS(O). Thus, factor ~ gives the relation between the real measured normalised ERS and calculated one for the optically thin cloud. The similar kind of relation but for the particle size is given by
the square root of p. When the calculations of the slope are performed when
particles are partially burned, the cloud can be optically thin and the exponent of the changing emissivity in the factor P will be close to 1 (see equation (4.8)). The emissivity of a cloud has been measured by means of extinction of He-Ne laser
light on the wavelength 3.4 pm. The ratio of the extinction signal (/0 ) to the signal
without extinction (/ex,0) is given by
fa -=exp{-n). fex,O
(4.9)
With cloud emissivity in the beginning of the experiment flo measured in such a
way, initial value of factor p can be calculated. Fig 4.5 presents the simultaneous
time dependent curves of both the chopped extinction (top graph) and ERSpyrometry (lower graph) curves for burning particles. These two methods show
complete similarity of the measured values. Factor P calculated from a series of extinction graphs for different experiments is about 1.3-1.5. Because of the mentioned similarity between extinction and two wavelength pyrometry
measurements only the later ones have been used mostly in this work. Thus the calculations of the reaction rate of combustion from the experimental data
have been performed as follows: ERS grc~.phs have been converted to present the change of the particle size with the aid of equation (4.1), the slope of the latter graphs has been measured and multiplied by square root of the factor p. Finally the
reaction rate has been calculated from equation ( 4.3 ). Because of the change of the particle temperature during the process of combustion, the calculated reaction rate has been related to an average value of the temperature obtained for each interval of the calculations.
Methods and results 54
-1.00
-0.80 M" = ~
= -0.60
.8 .... u
·= -0.40 .... l< !lj
-0.20
0.00 0 2 3 4 5 6 7 8
t, ms 1.00
0.80
\ ;::i 0.60 ~
rll ~ 0.40 j;.l.1
0.20 l• .. ••
0.00 0 2 3 4 5 6 7 8
t, ms
Figure 4.5. Chopped extinction (top graph) and ERS-pyrometry (lower graph) curves for /.Juroiog coal particles (radius a--2. 4 pm)
A detailed analysis of the pyrometrical measurements of particle clouds is given in [5]. In an evaluation of experimental errors the fact that "grey" particles can make not "grey" cloud has to be taken into account. Fig. 4.4 shows a dependence of the extinction coefficient on wavelength. Difference in the value of the extinction coefficient gives different values of the total emissivity of the cloud for 1.34 and 2.2 p.m wavelengths of the two wavelength IR pyrometry (see equation (4.7)). Taking into account the deviation of the particle cloud emissivity from the "grey" body emissivity one can evaluate an accuracy of the particle temperature and burnout measurements. For the temperature range of interest the particle temperature measurements lay
Chapter 4 55
within 50 K of accuracy. This has also been confirmed in the experiments with a nonreactive medium (nitrogen) and coal particles. In the absence of combustion when the radiative cooling does not play a significant role the gaS partide temperatures should be equal. The gas temperature has been measured by a method presented in subsection 3.1.1. The particle temperature measured with IR twowavelength pyrometry. The difference between the gas and particle temperatures lays within 50 K interval. An uncertainty of the burnout measurements due to the fact that the cloud is not "grey" lays well within the expermental error. Other two factors which can influence these measurements are the fact that a part of radiation scattered from the particles which are not directly exposed to the detection system can be received by detector and change of the extinction coefficient Qex due to the particle burnout. The first effect gives rise to a decrease of the extinction coefficient and the second effect to an increase of it. Experiments with coal particles of different sizes in a nonreactive medium showed that a difference between the particle and gas temperature measurements still lay within 50 K interval. Experiments in order to measure an uncertainty of the burnout measurments have not been performed. But a variation of the extinction coefficient between 1.5 and 2.5 gives rise only to < 10 % error in the burnout measurements.
4.1.2 Energy balance method
To illustrate the energy balance method we shall use the data of the experiments presented in figs. 4.1 and 4.2. Fig. 4.6 gives time dependencies of the particle temperature for the experiment with nitrogen and for the one with oxygen-nitrogen mixture. Apart from the particle temperature graphs, the gas temperature, calculated as has been shown in 3.2, for each shock is presented. As mentioned before, there is almost no difference between the particle and the gas temperatures in the nitrogen experiment. In the experiment with the oxygen-nitrogen mixture though, these temperatures differ substantially. This difference is related to the heat released during the coal particle combustion. The analysis of the energy balance method is strongly related to the TET analysis presented in section 2.3. To acquire an equation of time-dependent coal particle behaviour, considering that combustion occurs only at the particle surface, one should assemble equations (2.15) and (2.19) as follows:
Figure 4.6. Particle temperature measured wit.l.t IR pyrometry and gas temperature calculated from toe s.IJoc.C ware re/ocity
for experiments wit.l.t N.z and N.z-02 mixture
5
56
The term of the radiation cooling is considered to be small in comparison with the term of the cooling by heat conductivity. A simple evaluation to prove this fact can be performed. Assuming that the particle emissivity is dose to 1 the term of the radiation cooling Wrad can be calculated as follows: Wrad = aT/ W/m 2
, where a =
5. 7-1(}8 [6]. If the particle temperature is 2500 K and the gas temparature is 1500
K then for a particle with the radius about 3 IJm Wrad = 2.2 MW/m2 while cooling due to the heat conductivity is about 30 MW/m2
• Cooling by radiation plays a more
Chapter4 57
significant role for big particles and higher temperatures.
When thermal equilibrium between the particle and the gas is established, the timedependent particle temperature graph becomes flat and the first derivative of the particle temperature with respect to time becomes zero. Making the left side of equation (4.10) zero, one can write for RP:
(4.11)
If the energy production per unit mass during combustion and the heat conductivity of the gas are known, the energy balance method gives us a possibility to obtain the
value of the reaction rate of coal particle combustion simultaneously with the measurements of the corresponding value from using the burnout method. Or reversing the problem, using both of these methods, one can acquire information on the heat release during the particle combustion. If the time for a particle to establish thermal equilibrium is long enough, then the particle can be partially burnt and the new value of a, obtained from the burnout method, should be used in the calculations. The value for He has been chosen equal to 10 Ml/kg (from, e.g., [7]), which corresponds to the surface combustion of C to CO. The values for the heat conductivity have been taken from [6] and their values as a function of temperature represented in table 4.1. The temperature, which has been chosen to calculate the values of the heat conductivity is an average of particle and gas temperatures.
4.1.3 Emission spectroscopy method
Several difficulties arise during the use of emission spectroscopy of gases containing emiting particles. The main one is that it is impossible to separate the gas emission and the background continious emission of coal particles at one wavelength from each other. The measured signal depends on several processes: emission from the gas volume, emission from particles, absorption in the gas volume and absorption and scattering by particles. This compels us to use this method in this work mostly to indicate the existence (or non-existence) of some gas species in the gas volume. The usual procedure is illustrated in fig. 4.7. Several signals are measured simultaneously: two signals with the particle surface pyrometer (at 1.34 and 2.4 j.lm
in the scheme of fig. 4.7) and signals from emission spectroscopy (e.g, at 4.7 and 4.3 pm in the scheme). From the pyrometer signals the particle surface temperature and ERS are calculated (see subsection 4.1.1 and 4.1.2). This gives us a possibility to calculate the particle radiation at the wavelengths of the spectral lines, using Planck's law for the wavelengths of interest. The comparison of the signal measured
Methods and results
1.34 J.lffi
2.4 J.lffi
4.7/4.3 J.lffi
CO/C02
_______ L _____ _ I I I I I I
Tp, ERS : I
SURF 1 •• , ••
I ··-' L---.-----------', ,' ' r-----L-
' I 7 I ',I 4. 14.3 1
:.li urn ' I I 1 CO/C021 [ ______ ...!
Figure 4. 7. Illustration of t!Je procedure used in t!Je emission spectroscopy method to obtain information on CO/C02 production
Figure 4. 8. Comparison of the calculated particle background radiation and measured CO + background radiation at wa velengt!J 4. 7 pm
58
Chapter4 59
at these lines and the calculated one, gives an indication of the existence of the
particular gas component. One should take into account the fact that there are no
gaseous products of the combustion or devolatilisation formed in the very beginning of the experiment. Thus the calculation and measured curves should be identical in the beginning. Fig. 4.8 illustrates a comparison of these curves for CO (at 4.7 pm)
in the experiment with the oxygen-nitrogen mixture, which is also presented in figs. 4.1 and 4.2. It shows time resolved behaviour of the radiation measured at the
wavelength of CO-emission, the continious background calculated from the simultaneous pyrometrical measurements and their difference. The non-zero
difference between these two curves indicates the production of CO during combustion.
Some evaluations to make a further analysis can be performed.
One can treat the emitting particles as a grey body with an emissivity factor for a cloud given by equation (4.6). The intensity of the particle radiation in a spectral
interval without absorption (/p) in this case can be found similar to equation (4.7):
1 =I (1-exp( -'!)) p bp Qex '
(4.12)
where A and C are the first and second Planck's constants, the 1 wavelength of
measuring device, .:11 the spectral width of the measuring device, Ib.p black body radiation intensity in the spectral interval .:11 at the particle temperature and (1-
exp(-q))/Qex the total emissivity of the cloud. The gas is considered to radiate only from the gas volume with temperature Tg. In
this case the intensity of the gas radiation with self-absorption is (e.g. from [8]):
(4.13)
where x is the dimensionless gas absorption coefficient, lb,g the black body radiation
intensity in a spectral interval at the gas temperature and lJ 1 the spectral line width. a 1 should be changed into .:11 if the spectral line width is greater than the spectral
Methods and results 60
width of the device, which is the case here (see section 2.2). The term (1- exp(-q))
is the total gas emissivity factor.
To simplify the equations we will consider that the spectral line width is greater than the spectral width of the device. When emitting particles are dispersed in the
absorbing and emitting gas volume one can write for the total intensity (/ 11) in a spectral interval:
(4.14)
lb .!!_ +Ib X .p Qex ,g
x+fl
where x is the coordinate along the optical axis.
As mentioned before the total intensity (/ 11) is measured in the experiment while the
particle radiation term (/p) is calculated from the measurements on other wavelengths. The ratio of the total intensity of the radiation received by the detector to the intensity from the particles without absorption is
(4.15)
Ib,g _ J c[ 1 _ 1 ]] Ib,p -expl A:" TP Tg ,
where equations (4.12) and (4.13) have been used to find the ratio of black body
radiation at particle and gas temperatures and the subscript (0) indicates that the corresponding value is taken in the beginning of the combustion. The value of '1 can
be found in the way which has been explained in subsection 4.1.1. Thus equation (4.15) gives a possibility to calculate the gas absorption coefficient. Applying the calibrations presented in section 2.2 one can find the partial pressure of the
absorbing components. The difficulty, which can arise here is that too much gas, which is being formed during combustion, can make the gas volume at the wavelengths of interest
Chapter4 61
completely "black" and no further gas production can be measured. In this case the data, which can be obtained, give the minimum value of the produced gas density.
4.2 Experimental results
Dependencies of the combustion rate measurements on the particle temperature and partial oxygen pressure, as well as experimental results of the emission spectroscopy measurements are presented in this section.
4.2.1 Dependence of the combustion rate on temperature
The experiments to determine dependence of the combustion reaction rate for the small ( < 6 11m) particles of two different kinds of coal (Polish and Illawara) in pure oxygen have been performed. Two different methods: energy balance method and burnout method, have been applied in both cases. The results of both methods applied are presented in fig. 4.9 for Polish and fig 4.10 for lllawara coal. The graphs are of the Arrhenius type with the reverse particle temperature on the horizontal axis and logarithmic scale for the reaction rates on the vertical axis. All curves in the both graphs are linear, which means that the Arrhenius type of reaction rate expression (see equation (2.1)) is valid. In both cases though, there is a difference between the reaction rate measured from burnout and energy balance methods (for Polish coal this difference is rather significant). The possible nature of this difference is discussed later in this chapter.
4.2.2 Dependence of the combustion rate on the partial oxygen pressure
Experiments to determine a dependence of the combustion reaction rate on the partial oxygen pressure for the small ( < 6 pm) particles of the two different coals (Polish and Illawara) in the oxygen-nitrogen mixture have been performed. Two different methods: the energy balance method and the burnout method have been applied in both cases. In order not to introduce the additional difficulties in the calculations of the reaction rates the experiments have been performed in such a way, that the particle temperatures of different measurements were as close to each other as possible. Fig. 4.11 presents an Arrhenius plot of the reaction rates for experiments both in pure oxygen and oxygen-nitrogen mixtures calculated from the burnout method for Illawara coal. The partial oxygen pressure has been varied from .4 to about 10 bars.
No significant difference for the reaction rates as a function of oxygen pressure can be seen in this case. On the other hand, the same type of graph but for the energy balance method, shows a difference in the reaction rates measured in nitrogen
Methods and results
20 energy balance
rn 10
"' e -C{)
.lid ,u .... as .... c:: 0 ..... .... (,) as Q) burn out ....
Figure 4.12. Arr.IJenius plot of combustion rate based on energy balance met!Jod for experiments wit.IJ Illawara coal (a-2.4 pm) in 0 2 and 0 2 -N.z mixtures
Methods and results
0 2, bar
Figure 4.1.J. Combustioo rate io Or~ mixture diyided by tile combustioo rate io pure ozygtJD as a fuoctioo of tile partial oxygeo pressure
measured witll bum out llDd eoergy balllDce metllods for PolisJJ coal
2.-----------------------------------~
l energy balance
0.1 ~~~-i--~~~~------~--~--~~~~~
0.2 10
0 2 , bar
Figure 4.14. Comf1ustioo rate io O:r~ mixture dirrided by combustioo r.rlle io pure ozygeo as a fuoctioo of tile partial ozygeo pressure measured
witJJ buro out llDd eoergy balllOce metllods for Illawara coal
64
Chapter 4 65
oxygen mixtures and pure oxygen {see fig. 4.12). The same type of difference in the reaction rate behaviour depending on the method used reveals itself in the experiments with Polish coal, where the partial oxygen pressure has been varied between .3- 10 bars.
To present the reaction rate behaviour more clearly, the value of the reaction rate in each case of the experiments with oxygen-nitrogen mixtures, measured either by burnout or energy balance method, has been divided by the corresponding value of the reaction rate in pure oxygen at the same particle temperature (see, e.g, figs. 4.11 and 4.12). This value can be found for both Illawara and Polish coal from the original Arrhenius plot. Fig 4.13 presents the reaction rate behaviour for Polish coal, measured using the two methods mentioned above, as a function of partial oxygen pressures. For the burnout method applied there is a slight decrease of the reaction rate with decrease of oxygen concentration. The same decrease in case of energy balance method applied is growing much faster. For partial oxygen pressure higher than one bar though, both methods show almost no dependence of the reaction rate on oxygen concentration. Fig. 4.14 shows the similar combustion rate behaviour but for lllawara coal. The nature of it will be discussed later in this chapter.
4.2.3 Influence of an inhibitor on the combustion reaction rate
As has been mentioned in [9], [10], the combustion of volatiles (more generally hydrocarbons and carbon monoxide) react through radicals and the reactivity is strongly influenced by inhibiting additives like freons. To fmd a possible role of volatile matter in the combustion process a small amount of freon (TF) (less than 1 % in pressure) has been added in the combustion experiments with oxygennitrogen mixtures and Polish coal. The result of the reaction rate measurements for these experiments, using the energy balance method is presented in fig. 4.15 as a function of the partial oxygen pressure in comparison with the experiments without freon additives. For the partial oxygen pressure higher than 1 bar no difference between the values of the reaction rate obtained in these two cases has been found. For the partial oxygen pressures lower than 2 bar, the decrease of the reaction rate for the experiments with freon additives starts earlier and goes faster than in experiments with the pure oxygennitrogen mixtures. Thus the inhibitor additives influence the combustion process. The possible explanation for this influence will be given later in this chapter.
Figure 4.1.f. Combustion r11te in 0;-.N;mi.rture divided by combustion r11te in pure o.rygen liS 11 function of tile p11rti11/ o.rygen pressure
me11sured witll energy b11/11nce metllod in experiments witll Po/is./J COII/IIDd in/Jibiting 11dditive
66
4.2.4 Carbon monoxide, carbon dioxide and volatile matter production in pulverised coal combustion experiments
As has been mentioned earlier, the emission spectroscopy methods used in this experiment have mostly an indicative character, though it is still possible to perform some quantitative evaluations. A part of the combustion experiments have been accomplished with these spectroscopic measurements in order to find the possible existence of the combustion products and volatile matter in the gas volume. The analyses of these measurements have been performed using the scheme presented in subsection 4.13 and illustrated in figs. 4.6 and 4.7. Fig. 4.16a presents time behaviour of the intensity of the C02 emission line in comparison with the calculated behaviour of the continuum emission of the particle cloud only (without absorption) on the same wavelength. The obvious difference in these two curves indicates the existence of carbon dioxide in the gas volume. Spectroscopical measurements on the wavelength of the hydrocarbon emission have been performed simultaneously and in the same experiment with the measurement presented in fig 4.16a. The result of these measurements is presented in fig. 4.16 b in comparison with the calculated behaviour of the particle cloud emission. Practically no difference can be found between these to curves, which indicates that no hydrocarbons are present in the gas volume.
Figure 4.1711. Compuisoo of tllc ciJicuiiJicd p.utic/c b11ckgrouod r11di1Jtioo IJDU mcllSurcd CO + b11ckgrouod radi111ioo 111 wllrclcogtll 4. 7 pm
1.00
.: ~
0.80 . :i = 0.60 ~
>. -•-" <IJ i = 0.40 Q) -c
•-" I 0.20 calculated
0.00 0 2 3 4 5 6 7
t, ms
Figure 4.17 b. Comp~~.risoo of tllc ciJicuiiJicd pllrliclc b11ckgrouod r1Jdi11tioo IJDU mciJsurcd C02 + b11ckground riJdilllion 111 WIJYclcogi.IJ 4.2 pm
68
Chapter 4 69
Another pair of simultaneous measurements is presented in figs. 4.17a and bin the same way as in figs. 4.16 a and b. These measurements have been performed to indicate the carbon monoxide and carbon dioxide existence in the gas volume. Both indications are obviously positive. To estimate an amount of both products in the gas volume the procedure described in subsection 4.1.3 has been applied. The results of the partial pressure as a function of time is presented in fig. 4.18. Carbon monoxide and carbon dioxide partial concentrations rise simultaneous, which means that the carbon dioxide production takes place in the vicinity of the coal particle.
70
60 co 50
..... 40 ..... 0 .... ~ 30
20
10
0 0 2 3 4 5 6 7
t, ms
Figure 4.18. Partial pressure of CO lllld C02 as a fuoctioB of time ~kma~dbomMc~m~~~«U&~nmQsm~M~
4.3 Discussion of experimental results
In this chapter a zone, within which coal particle combustion occurs, is defined. Some qualitative as well as quantitative evaluations to determine the combustion mechanism in terms of Combustion Zones (see chapter 2) is performed. A comparison of the results obtained with a simple model is provided.
4.3.1 Diffusion limit
It is very important to find out wether the combustion is limited by the chemical reaction at the particle surface (or in the close vicinity of the particle surface) or
Methods and results 70
by the diffusion transport of oxygen towards the reacting particle.
Such calculations can be performed in a way , which is similar to evaluations presented in example 1 in subsection 2.1.1. Figs. 4.19a and b present the comparison of the experimental results from figs. 4.9 and 4.10 with the calculated curve of
diffusion limit as a function of temperature. Data, which are used here, present the results of experiments with Polish (fig. 4.19a) and Jllawara (fig. 4.19b) coal particles
in pure oxygen with both energy balance and bum-out methods applied. The oxygen
pressure in these experiments has been almost constant at about 8 bar, while the
particle temperature has varied from 1600 K to 2600 K and the gas temperature has been changed from 1200 K to 1600 K. The diffusion coefficient D is a function of the gas temperature (see equation (2.2)). A mean value of it has been calculated
for each experiment on the basis of a temperature, which is the average between the temperatures at the particle surface and far from the particle. The mean
particle size for these calculations has been 2.5 ,mz. The chemical reaction at the particle surface is considered to be combustion of C to CO. To calculate the
diffusion limit, oxygen density at the particle surface Ps in equation (2.2) has been equal to 0. The final curve for diffusion limit in figs. 4.19a and b is an approximation of the calculated data. As is seen in figs. 4.19a and b, all
experimental data lay well below the diffusion limit. It means that the measured combustion rates in the experiments with pure oxygen are determined by the chemical reaction at the particle surface (or in the close vicinity of the particle).
In the experiments with oxygen-nitrogen mixtures the particle and gas temperatures have been altered not too much (see, e.g., fig. 4.12), while the partial oxygen
pressure has been changed from .3 bar to 10 bar. Figs. 4.20 a and b present a comparison of the experimental data with the calculated diffusion limit curve as a function of partial oxygen pressure with the experimental data. To avoid complications with both changing temperature and partial oxygen pressure, the real values of the measured combustion rates (rather than dimensionless ones presented in figs. 4.13 and 4.14) of all experiments with oxygen-nitrogen mixtures have been put in a graph as a function of the partial oxygen presssure while the diffusion limit has been calculated as follows: an average value of the particle temperatures for all oxygen-nitrogen experiments have been calculated, the corresponding value of the diffusion coefficient has been taken and the diffusion limit has been calculated from
equation 2.2. This procedure can be considered to be rather accurate for a such kind of evaluations because most of the experimental data lay within temperature difference of 150 K.(see ,e.g., fig. 4.12). Both figs. 4.19 and 4.20 show that there is no experimental point above the diffusion limit, which means that the combustion
rates are determined not incorrect. For the partial oxygen pressures lower than 1 bar all experimental points measured by both methods, mentioned above lay on the curve of the diffusion limit. This shows that for this region of the partial oxygen pressure the combustion rate is limited by diffusion. For the experiments with the
Chapter4
I pure oxygen, Illawara 100
rll energy balance '\ "' s / diffusion limit -t:ll) 10 ..;,;: D ~
<1)
? ~ .....
II = .... burn out d 0 § 0
OD~ 0 ..... ..... 0
"' <1) ....
~ 0.2
0.40 0.50 0.60 0.70
1000/TP, 1000/K
I pure oxygen, Polish 100 ...
rll energy balance '\ "' s ~. diffusion limit -t:ll) ..;,;: 10 • ~ ...... /. • h "' .... • • d burn out . 9 ••• • ...... •• 0 «l • <1) • ....
0.2 0.30 0.40 0.50 0.60 0.70
1000/TP, 1000/K
Figure 4.1 !I 11, h. Co.mp11rison of experimentally .measured combustion reaction r11tes for Dlllwllra (a) and Polisli (h) co11ls wit.IJ Clllculated diffusion
limit (11~2.4 p.m) in experiments wit.IJ pure oxygen
71
Methods and results
100
<l'l
"' s -.. l)l)
10 ~
~ .... Cd ... c:
.!2 .... '>) Cd 0 ...
0.2 0.2
100
<l'l ... s -.. l)l)
10 ~
~ .... Cd ... c:
.!2 .... '>) Cd G) ...
0.2 02
nitrogen-oxygen, Illawara
diffusion limit
\ energy b7ce
8 D D
~ burn out
10
partial pressure of 0 2, bar
nitrogen-oxygen, Polish
diffusion limit
\ nergy balance .. ~ . • • • • \
burn out
partial pressure of 0 2, bar
• • • 10
II
Figure 4.20 a, h. Comparison of experimentally measured combustion reaction rates for I/Jawara (a) and Poliso (h) coals wit.IJ calculated diffusion
limit(a=2.4 pm) in experiments wit.IJ 0 2 + N2mixture
72
Chapter4 73
partial oxygen pressure higher than 1 bar the limitation mechanism becomes the chemical reaction. Thus the conditions of Zone III (see chapter 2) are fulfilled only for the experiments with an oxygen partial pressure below 1 bar. It is still to be found to which Zone the rest of the experimental results belongs to.
4.3.2 Chemical control of combustion
As shown above if the partial oxygen pressure is high enough, combustion is controlled by chemical reaction at the particle surface (or in the close vicinity of it). Evaluations in order to define the combustion regime more precisely can be made. These evaluations are similar to ones performed in [10], [11]. But some preliminary conclusions can be already made from the qualitative analyses of the experimental data. The main characteristics of the coal particle combustion within Zones II and I are presented in subsections 2.1.2 and 2.1.3. Within Zone II, a particle combusts in a shrinking mode and reveals the apparent reaction order n, which is connected with the true one m as follows: n = (m + 1)/2. As is seen in figs. 4.1 and 4.2 particles actually combust with decrease in particle size. This change of the particle radius corresponds to the real combustion. Experiments in nitrogen (see, e.g., fig. 4.1) have shown that neither significant swelling or non-combustion shrinking occurs. With the first condition for combustion within Zone II fulfilled, it is still difficult to imagine that this Zone is applicable for our experiments. Figs. 4.13-4.15 show that the measured order n of the reaction is close to zero for the partial oxygen pressures higher than 1 bar. The corresponding value for the true reaction order m would be -1, which is hardly possible for the coal combustion kinetics. Combustion in Zone I, on the other hand, can reveal the true order of reaction equal to the apparent one, but it occurs in the shrinking regime, which is not the case in our experiments. This leaves us with one more possibility of the "rough sphere" combustion, which occurs with the decrease of the particle size and reveals the true order of reaction. In order to verify this hypothesis evaluations, performed in [2] and based on the analysis of [11],[12] and [13], should be applied to the results of this experiment. As
is shown in chapter 2, combustion occurs in the "rough sphere" zone if the penetration depth of the oxygen molecules within the particle pores is smaller than the mean free path in the gas mixture. Taking into account that our previous analysis was based on the macro characteristics of the gas, such as diffusion coefficient D, we shall use the connection of it with an expression for the mean free path as follows (see, e.g. [14]):
Methods and results
_ J 3RTg v - --mean M '
74
(4.16)
where V mean is the mean square velocity of the molecules, Tg gas temperature and M molecular weight of the gas mixture. One can write for the mean free path 11 for equation (4.16) that
(4.17)
For further calculations the following values have been chosen: M = 30 ·Ht3
kg/mole, Tg = 2000 K and D = 41.(}5 m2/s (see [15]). The value of the mean free path lr calculated in such a way is equal to about .14 p.m. The depth of penetration of the oxygen molecules into the particle, until the oxygen molecules will be consumed by reaction, can be evaluated for the "rough sphere"
combustion as follows (see [11]):
L (4.18)
where DP is the diffusion coefficient in pores, p. the oxygen density at the particle surface, e the porosity of the coal and Rp,m the measured reaction rate per unit of external surface. For the combustion region with chemical control at the particle surface the value
of the oxygen density at the particle surface can be assumed to be equal to the value of the oxygen density far from the particle (see subsection 4.3.1). If the pore diameter is smaller than the mean free path for the gas molecules, which is the case for high bituminous coal (see, e.g. [2]), Knudsen diffusion occurs. The pore
diffusion coefficient DP in this case can be calculated similar to equation (4.16) but with the value of the mean free path l set equal to two radii of the pore 2 rP. The
relation between DP and D is given by:
Chapter4
2r D =D2
p l J
Using equation (4.19), equation (4.18) can be rewritten as follows:
L
75
(4.19)
(4.20)
For high bituminous coal an average value of the porosity 8 = .1 and of the pore
radius rP = 11.&3 pm. In this experiment an average value of the measured
reaction rate Rp,m = 3 kg/m2 and of the oxygen density Ps = 2 kg/m3• The depth
of the oxygen penetration L,s> calculated in such a way, is .06 pm. This value is
smaller than the value of the mean free path calculated above. Thus, the criterium for the "rough sphere" combustion formulated in subsection 2.1.4 is fulfilled. The measured values of the activation energy EP and reaction order n correspond to the
real ones.
4.3.3 Influence of volatile matter
As mentioned in chapter 2, volatile matter produced during devolatilisation, as well
as carbon monoxide produced during surface combustion, can burn in the gas phase and change the energy balance significantly. The difference between combustion
rate measurements with the burnout and energy balance method presented in
subsection 4.2.1 can be explained by the influence of the homogeneous combustion. The experiments with inhibitor (see subsection 4.2.3) confirm this conclusion. As described in chapter 2, the volatile combustion can occur at the particle surface or in the gas volume far from the particle. The change of the particle size during combustion shows that there is enough oxygen at the particle surface and the volatile flame should be attached to the particle. In order to see an influence of the homogeneous combustion figs. 4.9 and 4.10
should be recalculated in terms of the difference J T between the particle temperature TP and the gas temperature T ~ , which is proportional to the
combustion rate RP and the heat of combustion He (see equation (4.11)). Figs. 4.21
a and b present this recalculation for both types of coal used in the experiments. The temperature difference, found from the energy balance method, represents the values measured directly. The combustion rates acquired by the burnout method, which corresponds to the heterogeneous combustion, have to be multiplied by the
Methods and results
Illawara coal
1500 • ::.::: burn out, 30 MJ/kg
~ 1000 I. 8 <I
500 burn out, 10 MJ/kg~
0 0.40 0.50 0.60 0.70
1000/TP, 1/K
Polish coal 2000
1500 burn out, 30 MJ/kg
::.::: • I f-i 1000 <I • burn out, 10 MJ/kg
\. • 500 • & & &
0 L_~~--~~_L~~~~~~~~~~~~~
0.40 0.50 0.60 0.70
1000/TP, 1/K
Figure 4.21 a, h. Comparison of particle temperature increase due to combustion measured with energy halaoce method aod calculated wit/J two Yalues
of JJeat of combustion {10 MJjxg 80d .10 MJjxg) from t/Je data ohtaioed by huro out metJJod for Il/awara {a) 80d PolisJJ (h) coal
76
Chapter4 77
heat of combustion He. Two different values of it are used here: 10 MJ/kg for the combustion of C to CO at the particle surface and 30 MJ /kg, which represent the total combustion heat of the coal (compare with table 3.1). Figs. 4.21 a and b show that the heat of combustion He taken as 10 MJ/kg provides the particle with sufficient energy to be heated to the temperature differences measured in the energy balance method only in the experiments with Illawara coaL Even in this case the values of the combustion rate calculated from the burnout method lay somewhat lower than the combustion rates calculated from the energy balance method. The use of the value 30 MJjkg for the heat of combustion He gives a better correspondence between the data acquired by the energy balance and burnout
methods for Polish coaL The use of the value 30 MJjkg for the heat of combustion He for Illawara coal makes all points of the burnout method situated much higher than the points of the energy balance method. The value of the combustion heat which can produce the best fit between two methods lays somewhere between those two values closer to 10 Mj/kg. This means that the heterogeneous combustion only is not sufficient to explain the experimental facts and the homogeneous combustion plays a big role in the combustion process of the small particles. This has been also shown in the calculations performed in [16]. An influence of volatiles can be expected to be higher for a coal type with higher volatile content. One can see in fig. 4.21 a, that for Polish coal with higher volatile content (see table 3.1) the points, calculated from the burnout experiment with H, equal to 30 MJjkg, lay very close to the points acquired by the energy balance method. The points of the burnout method but for Illawara coal with lower volatile content (see table 3.1) lay close to the points of the energy balance method if a lower value of the heat of combustion is used. This means that devolatilisation, and hence the homogeneous combustion close to the particle surface, of the Polish coal particles has been going faster with higher energy release in the volume. Another experimental fact proves this point. The emission spectroscopy measurements showed no volatile matter existence in the gas volume which means that the volatile matter combusts close to the particle surface. The fact that not only CO but also C02 is present in the gas volume gives an idea that some combustion of CO and volatile matter also takes place. In order to make this point clear some evaluations have to be performed. The problem of homogeneous flame attachment is closely related to the problem of defining the ignition position presented in subsection 2.3.5. If the ignition occurs close to the particle surface it is reasonable to think that the subsequent combustion will occur at the same region or even closer to the surface. In order to evaluate this position one can introduce a characteristic combustion radius rc from equation (2.31) as follows:
Methods and results 78
(4.21)
If the calculated characteristic combustion radius '• is smaller than the particle
radius a, the volatile flame is attached to the particle surface. The devolatilisation
rate R4 is not a well defined value because of the reasons presented in section 2.2.
As an approximation in order to evaluate how big this value is we shall use an equation for a single order reaction as follows from [17]:
(4.22)
where mv is the mass of volatiles in the coal particle, AP the preexponential factor
and E ... the activation energy. For an evaluation the volatile mass can be taken equal
to half the particle mass mP (see equation (2.22)). A4 is equal to 1.34 Uf s·1, E.,. is
equal to 8917 K (see [17]) and TP is equal to 2500 K. The value of the devolatilisation rate R4 calculated in such a way is equal to 1.9 kg/m2 s. The value
of the diffusion coefficient D, which corresponds to the chosen temperature TP' is equal to 91.(}5 m2/s (see [15]). The usual value of the gas density p is 2.5 kg/m3
•
The characteristic combustion radiusr., calculated from equation (4.21), in this case is .05 pm. This is smaller than the particle radius and thus, the volatile flame is attached to the particle surface. If the volatile combustion occurs in the thin layer at the particle surface then the heat of combustion goes to the particle more efficient than if combustion would
occur far from the particle. In order to evaluate the layer thickness A1 one can assume that the volatile matter released during devolatilisation with the combustion
rate Rd burns completely with the combustion rate R ... in this layer. If the layer is thin then one can write that
and then (4.23)
For the evaluation of the combustion rate of the volatile combustion R ... the data of
Clulpter 4 79
the quasiglobal mechanism of the hydrocarbon oxidation from [18] is used. An expression of the combustion rate can be written as follows:
(4.24)
where Av is the preexponential coefficient, Tv the combustion temperature, k the order of the temperature dependence, [Fuel] the fuel concentration,[Oxidizer] the oxygen concentration, Ev the activation energy, c the reaction order with respect to the fuel concentration and b the reaction order with respect to the oxygen concentration. In order not to introduce unnecessary confusion the system of units used in this equation is the same as the one used in [18] except for activation energy. This system is em-s-mole-Kelvin. The unit, used for activation energy, is K. Using propane for a fuel in these calculations the data for equation (4.24) from [18] are: Av = 8.6-IfJ1
, k = 0, b = 1.65, c = .1 and Ev = 15181. The concentration of the volatile matter in the reaction zone can be written from equations (2.31) and (4.21) as follows:
rc ~ =-'
r
(4.25)
where MP is the molecular mass of propane. The concentration of the volatile matter is calculated at the particle surface. The data used in equation (4.24) usual for this experiment are: Tv = 2500 K, [Fuel] = 1.4 -IrP and [Oxidizer] = 31-lrP.
The combustion rate of the volatile matter 1\, calculated from equation (4.24), is equal to 1.41£1 kgjm1 s. Using the value of the devolatalisation rate R4, calculated from equation ( 4.22), one can find from equation (4.23) that the thickness of the layer 4 1 is 1.4 pm. This value is a factor two smaller than the particle size. This means that the volatile combustion occurs in a relatively thin layer near the particle surface and the heat released in it influences essentially the heat balance of the particle, which is in good agreement with the experimental data acquired.
Methods and results 80
4.3.4 Comparison of experimental results with a model
As is shown above the combustion rate calculated from the burnout method does not correspond to the combustion rate calculated from the energy balance method. The reason for this is the combustion of volatiles in the gas volume. Thus the combustion rate, calculated from the burnout method represents the real particle burnout while the combustion rate calculated from the energy balance method represents the energy release during the particle combustion. Equation (4.11) has been used in order to calculate the value of the combustion rate measured by the energy balance method. In order to find the value for the energy release rate per unit area of the particle surface the combustion rate RP should be multiplied by the heat of combustion He from subsection 4.1.2. The rate of the energy release RE can be written as follows:
(4.26)
where AE is the preexponential factor and EE the activation energy. The reaction order n is changing from 0 for the reaction controlled regime (the oxygen partial pressure higher than 1 bar) to 1 for the regime controlled by the mass transfer (the oxygen partial pressure lower than I bar).
The values of the preexponential factors A and AE and the activation energies EP and EE, calculated from the experimental data obtained, are summarised in the table 4.2. The reaction order n has been assumed to be 0 (see, e.g., fig 4.20). For the creation of the model one has to take into account the fact that in equation (4.2) for the burnout and in equation (4.10) for the energy release different values for the combustion rate should be used. A simple numerical model proposed here is based on the following equation for change of the particle size:
and for change of the particle temperature:
dTP(t) = 3 [R -K T/t)-Too -oT4(t)l ' dt a(t)QPCP E a(t) p
Figure 4 . .2.2 11,0. Comparison of tile mt:~~sured colli particle temperature wit/J model calculation for Illawara (a) 8Bd Polis/J (h) coal
81
Methods Qlld results 82
The surface combustion rate RP is governed by equation (2.1). The energy release
rate is governed by equation ( 4.26). The values of heat conductivity K as a function
of temperature are given in table 4.1. The value of density Pp used is 1200 kg/m3
and the value of heat capacity is 2000 Jjkg K. The reaction order in the chemically
controlled regime of combustion has been taken equal to 0. The values of
preexponential factors and activations energies for both types of coal are used from
table 4.2.
The comparison of the model and experimental results for both types of coal,
presented in figs. 4.22 a and b, shows a good correspondence between the
calculated and measured values. The value of the particle temperature in the
stationary situation TpOo when the first derivative of the particle temperature with respect to time is 0, is given as a function of the gas temperature Tg. As it is seen
from figs. 4.22 a and b, a relatively slow growth of the particle temperature in the
beginning is followed by a fast raise of it starting from some value of the gas
temperature. Apparently this effect corresponds to the particle ignition. Combustion
in this case can still occur in the reaction controlled regime because of the particle
burnout. This will be discussed in more details in the following chapters.
The difference between two curves in figs. 4.22 a and b shows an influence of the
volatile matter in the process of ignition and combustion.
Literature
1. Borhen, C. F. and Huffman, D., Absorption and scattering of light by small
particles, Wiley-Interscience, New York, 1983.
2. Seeker, W. R., The kinetics of ignition and particle burnout of coal dust
suspensions under rapid heating conditions, Ph.D. Dis., Kansas State
University, Kansas, 1979.
3. Commissaris, F. A. C. M., Measurements of coal particle-size in shock-tube
experiments using laser Mie-scattering, Report EG/92/605, Eindhoven
University of Technology, The Netherlands, 1992.
4. Dalzell, W. H. and Sarofim, A. F., Journal of Heat Transfer, 91, 1969, 100-
104.
5. Vasilieva, I. A., Physics-Uspekhi, 36 (8), 1993, 694-732.
6. Handbook of Chemistry and Physics, 561h edition, Ed. Weast, R.S., CRC Press,
Clevelend, Ohio, 1975-1976.
~u4 83
7. Kapteijn, F. and Moulijn, J.A, in: Carbon and Coal Gasification, NATO ASI Series E, 105, Eds. Figueiredo, J.L, and Moulijn, J.A, Martinus Nijhoff
Publishers, Dordrecht/ Boston/ Lancaster, 1986.
8. Kirilin, V.A and Sheyndlin,A.E., MHD Energy Conversion, Physiotechnical
Problems, Progress in Astronautics and Aeronautics, 101, American Institute of Aeronautics and Astronautics Inc., New York, 1983.
9. Nettleton, M.A. and Stirling, R., Combust. Flame, 22, 1974, 407-414.
10. Rosser, W.A., et al., Proceedings of the Seventh Symposium (International) on
Combustion, Butterworths, London, 1959, p. 175.
11. Mulcahy, M. F. R. and Smith, I. W., Rev. Pure and Appl. Chern., 19, 1969, 81-108.
12. Wheeler, A. in: Advances in Catalysis and Related Subjects, III, Eds. Fran.keburg, W.G., et al., Academic Press Inc., New York, 1951.
13. Frank-Kamenetskii, D. A., Diffusion and heat transfer in chemical kinetics,
Plenum Press, New York-London, 1969.
14. Sivuchin, D.V., Obshi Kurs Fiziki, Termodinamika, (in Russian), III, Nauka, Moscow, 1979.
15. Field, M. A., et al, Combustion of pulverised coal, The British Coat Utilisation Research Association, Leatherhead, 1967.
16. Lau, C. W. and Niksa, S., Combust. Flame, 90, 1992, 45-70.
17. Gururajan, V. S., et at, Combust. Flame, 81, 1990, 119-132.
see equation (2.1) see equation (2.1) see equation (4.26) see equation (4.26)
Illawara
Polish
with n~O at P,=S b with n=O at P,~s b with n~o at P,~s b with n=O at P,=S b
2550 ± 690 12600 ± 550 29 ± 7
50± 7 7075 ± 315 69 ± 17
Table 4.2. Illawara and Polish coal characteristics calculated nom experimental data.
8230 ± 520
10140 ± 560
Chapter 5 85
Chapter 5.
Results and discussion of ignition experiments
This chapter deals with the results of ignition experiments performed with big ( < 70 pm) and small ( < 6 pm) particles. For more information on particle sizes see chapter 3. The results of the experiments are compared with various ignition scenario's.
5.1 Introduction
The main problems and features, with which one is faced investigating the ignition of coal, are outlined in chapters 2 and 3. Ignition of coal particle douds is usually characterised by an abrupt growth of emission signals due to the growth of the particle surface temperature. It is safer though to use a growth of the measured particle surface temperature as only an indication of ignition, because the growth of the emission signal can also occur due to the increase of the particle number or the particle surface. An indication of ignition by the measured particle surface temperature growth has been used in this work. The time between the moment when a particle has been exposed to hot gas conditions and the temperature rise is defined as the ignition delay time (see fig S.la). The ignition delay time generally is strongly influenced by several factors, such as particle heat capacity, particle size, particle reactivity, characteristics of volatile matter, devolatilisation rate and so on. Thus the ignition delay time is determined not only by chemical characteristics of the coal but by physical ones as well and thus not only by chemical processes but also by conditions of an experimental procedure. Measurements made, keeping in mind TET analysis (see chapter 2), are closer to characterisation of coal itself, though even in this case pretreatment of coal is very important. Ignition experiments very often give values of reaction rates, which are rather far from the values obtained by using other techniques [1]. Usually ignition delay time in real combustors does not play any significant role, because for the relatively big particles (about 70 pm) it is much shorter than the time, needed for burnout. On the other hand, the use of smaller particles in the advanced combustors (e.g., MHD) can imply some problems connected with the ignition delay time, because, as will shown below, it is comparable with the coal particle burnout time. Thus, using different methods it is possible to investigate the nature of the ignition process. Information for coal characterisation can also be obtained.
Ignition experiments 86
5.2 Ignition of big particles
In ignition experiments with big coal particles ( < 70 p.m) two types of coal:
Canadian and Polish, sieved in order to obtain size fraction between 44 and 62 p.m (see table 2.1 and section 2.3), have been used.
5.2.1 Particle temperature measurements
As is shown in [2] and [3], big coal particles are usually surrounded by a soot cloud. This makes it very difficult to measure the temperature of the coal particle surface itself. The screening effect can also be produced by smaller particles, originally stuck at the surface of the big one. The nature of the screening particles is not of importance for the presented work. An ensemble of the screening particles will be called below as a cloud or a shell. The term "cloud" will be used while speaking about rather thick layer of the screening particles. The term "shell" will be used while talking about thin (mostly hot) layer of the screening particles which possibly includes not all particles of the cloud. It should be mentioned here that the problem of screening does not occur (at least not in the first stages of coal combustion) using small (in our case < 6 p.m) particles [4], when the difference in sizes of the possible screening particles and the main particles is not too big. The time for a big particle to reach the gas temperature is rather long (several ms) (see subsection 2.1.2). This means that the main particles are staying relatively cold for at least the first milliseconds of the experiment. On the other hand the small submicron screening particles follow the temperature of the surrounding them gas very fast (tens of microseconds (see subsection 2.1.2). Fig. 5.1b presents the measured particle temperature as a function of time in the experiments with nitrogen. As is mentioned before (see chapter 3), the creation of the hot gas conditions occurs in two steps: first creation of not too hot conditions (about 500-600 K) and then after about .5 ms creation of hot conditions (in most of
experiments > 1000 K). The measured temperature rises to the gas temperature in about 100 ps after creation of the hot gas (- 1100 K) conditions. This time is about 60 times shorter than the time which is required for a big particle to reach the same temperature (see subsection 2.1.2). This means that the measured temperature is the temperature of the screening particles. Furthermore the small submicron screening particles follow the temperature of the surrounding them gas very closely. This can be seen from the experimental results for small ( < 6 p.m) particles. If, for example, the difference between the particle and gas temperatures for a small coal particle ( < 6 p.m) at the gas temperature equal to 1100 K is less than 50 K (usual value for our experiments see chapter 4 and figs. 4.21 a and b), the similar difference for a particle 10 times smaller is 5 K (see
Chapter 5
2300
02+N2 creation of hot gas conditions
1900
::.4 ;.. 1500
r-. gas temperature
-¥ 1100 -------------- ----------
! ignition delay time
700 -1 0 2 3 4
time, ms
2300
N2 creation of hot gas conditions
~ 1900
::.4 ~ 1500 measured particle temperature r-.
' 1 1100 :~~-r --
gas temperature
700 -1 0 2 3 4
time, ms
Figure f. 1 11, h. Puticle temperature measured witll I.R pyrometry and gas temperature calculated hom tlle s./Joc.k wave velocity for expenments witll big particles {<70 pm) of Polish coal
in O:r~ mixture (a) and ~ (h)
87
a
b
Ignition experiments 88
equations (2.17) and (2.19)). Because of the exponential behaviour of the detected intensities in the two wavelength pyrometry measurements (see equation (3.11)), the measured temperature will correspond to the hot screening particles and thus to the gas temperature, rather than to the cold screened ones (see fig 5.1a). On other hand the measured temperature presented in fig. 5.1a in an experiment with an oxygennitrogen mixture and temperature in the bulk of gas equal to about 1100 K can not correspond to the gas (screening particles) temperature too far from the big particle because the temperature in the bulk of gas does not change significantly during the first stages of combustion and is lower than the measured one. Thus the measured temperature will correspond to the gas (screening particles) temperature in the cloud, surrounding the big particle, at a position where an exothermal homogeneous reaction occurs and apparently to reaction of the volatile matter with oxygen. The volatile matter release begins under relatively low temperature and can start already after arrival of the incident shock. There is not enough time for big particles to be burnt completely, that is why the shock tube has to be cleaned thoroughly before an experiment with big coal particles. As is found in the experiments, accumulation of the coal particles from the earlier experiments gives a lower value of the temperature measured by IR two wavelength pyrometry. This can be explained by two facts: first the particles already exposed to the hot gas conditions have smaller volatile content and second a smaller relative amount of small particles comparing with the number of big ones exist in the shock tube after first experiments. It is in agreement with the fact that the measured rigid phase temperature belongs to the gas phase. It is interesting to mention here, that the ignition delay time is practically independent on the number of accumulated in the shock tube particles. It can be explained by the fact, that the detected ignition occurs in the gas, which surrounds the newly injected particles. As soon as the fact, that the particle temperature measurements correspond to the temperature of the gas phase at least in the first several milliseconds of the experiment, is established we can proceed with the presentation of the ignition experiment results for big particles. One should keep in mind that all measurements, which will be mentioned below relate mostly to the conditions in the gas phase around big particles. In order to avoid confusion and to mention the fact that the pyrometrical measurements are still measurements not of the gas temperature but of a dispersed rigid phase, the temperature obtained by these measurements will be called rigid phase (rp) temperature.
5.2.2 Dependence of ignition delay time on oxygen concentration
Experiments to determine dependence of the ignition delay time on the partial oxygen pressure for the big ( < 70 p.m.) particles of two different coals (Polish and
Chapter 5 89
Canadian) in the oxygen-nitrogen mixture have been performed. The total pressure in these experiments remained almost constant and equal to 7.5-8 bar. The partial
oxygen pressure has been varied between 2.5 and 8 bar. The gas temperature far from the particles remained equal to 1100 ± 30 K. Fig. 5.2 presents the results of the measured ignition delay times. It is seen that with the increase of the partial oxygen pressure the ignition delay times for both Canadian and Polish coals are getting shorter. A difference between these two curves is apparently due to the difference of the coal type used (see table 2.1).
s 2
.~ -
0 L-----~----~-----L----~----~----__J
2 3 4 5 6 7 B
partial 0 2 pressure, bar
Figure .f.2 Ignition delay time as a fllllction of toe partial oxygen pressure for experiments wit/J Polis.IJ and Ca.tJadim coal
5.2.3 Influence of water vapour on the ignition process
Experiments to determine the influence of water vapour on the ignition delay time for the big ( < 70 pm) particles of Polish coal in the oxygen-nitrogen mixture have been performed under conditions similar to the ones described in 5.2.2 but with initial injection of water vapour during the usual filling procedure (see chapter 3), using natural humidity of the ambient air and reducing it to a certain value by evacuating the shock tube. If the "dry gas" experiments described in 5.2.2 have been performed with the partial pressure of water vapour before the shock less than lft4
mbar (it should be taken into account that even "dry gas" experiments are not 100% dry) the similar pressure in the "wet gas" experiments has been equal to approximately lft2 mbar. The correspondent values for water vapour pressure after compression is about 40 times higher in both cases.
Ignition experiments 90
Fig. 5.3 shows ignition delay times, obtained in the "wet gas" and "dry gas" experiments, as a function of the partial oxygen pressure. The behaviour of this dependence in the "wet" experiments remains basically the same as in the "dry" ones. A significant difference though occurs in the absolute values of the ignition delay times, which are much shorter when water is introduced in the system.
3.50
3.00 Dry T8 = 1060 K
00 2.50 e Q) 2.00
.5 ..... » 1.50 .!!
Q) Wet "0 1.00
0.50
0.00 2 3 4 5 6 7 8
partial 0 2 pressure, bar
Figure 5.3 Ignition delay time as a function of tlJe piUtial oxygen pressure for experiments witlJ PolislJ coal witlJ {weij
and witlJout {dry) water vapour
Fig. 5.4 presents the rp preignition temperature (see fig. S.la) as a function of the partial oxygen pressure for the "dry" and ''wet" experiments with initial gas temperature in the shock tube Tg = 1120 K. The experiments do not show any definite dependence of the rp preignition temperature on oxygen concentration for both cases. An influence of the water vapour is still seen. The "dry" branch of the rp temperatures lays between 1400 and 1500 K, while the ''wet" one lays between 1200 and 1300 K. Fig. 5.4 also shows an average value of the gas temperature for the experiments performed. Further discussion of the observed effect will be presented later.
5.2.4 Dependence of ignition delay time on gas temperature
Experiments to determine dependence of the ignition delay time on the gas temperature for the big ( < 70 JSm) particles of Polish coal in the pure oxygen have been performed. The gas temperature has been varied between 900 and 1500 K
Chapter 5
1500
:..:: • .. ~ Dry ~
!!> 1400 ... = ..... tiS
• ' ....
!!> 1300 Q.,
e !!> .....
• • • I •
!!> 1200 Ill tiS
Wet • ..c:: Q.,
~ 1100 .~ ....
1000 2 3 4 5 6
partial 0 2 pressure, bar
Figure 5. 4. Rigid pease (rp) preignition temperature as a function of /lJe partial oxygen pressure in "dry" and "'wet"' experiments
91
The oxygen concentration has been maintained as constant as possible and equal to 8.5 ± 1.5 bar. The ignition delay times, obtained in these experiments, are presented in fig. 5.5 as a function of the reverse gas temperature and reveal a typical exponential behaviour. The rest · of the curves correspond to the measurements of the autoignition delay time for methane, found in literature. Further comparison of these curves will be performed later in this study.
[18]
0 ~----~~--.. ~-4~~---£~~--------~
0.00 0 50 1.00 1.50
1 000/T 8, 1 000/K
Figure 5.5. Ignition delay time as 11 function of reYerse gas temperature for experiments JYi/lJ coal of /lJis study and {4/ and for
ignition of me/lJane from {12-18}
Ignition experiments 9 2
5.2.5 Dependence of the ignition rp temperature slope (time derivative of rp temperature) on the oxygen partial pressure
Fig. 5.6 shows a dependence of the rp temperature slope after ignition (see fig. 5.1a) on the oxygen partial pressure for the experiments with Canadian coal and Polish coal with and without water. The dependence of the rp temperature slopes seems to be linear with the oxygen partial pressure in "dry" experiments. The "wet"
experiments though, do not reveal any certain functional behaviour probably because of lack of experimental points.
1300 Ill Canadian e - 1100 without water ~
oi 900 Polish
J Q.
~ with water~ithout water Ill
II) 700
j ... ::l - 500 <II ... II) Q.
e 300 •• II) -100
2 4 6 8
partial 0 2 pressure, bar
Figure S. (f. Depeodeoce of tiJe rp temperature igoitioo slope oo tiJe partial oxygen pressure for Polish coal witiJ IIBd witiJout water
Yapour aod for CIIBadillB coal witiJout water Yapour
5.3 Discussion of the ignition experiments with big particles
There are several possible scenario of the big particle ignition (see chapter 2). In this section we shall consider some of them together with discussion of the observations which support them and other observations which cannot be explained.
5.3.1 Water vapour effect
As is mentioned in subsection 5.2.3 water vapour has a significant influence both on the ignition delay time and the preignition rp temperature. This influence can not occur due to the change of thermodynamical properties of the mixture, because
Chapter 5 93
the partial water vapour pressure, even in the "wet" experiments, is about 500000 times lower than the total pressure of the gas mixture. Thus this influence can only be explained by the effect that H and OH radicals, produced from water vapour, have on the process of volatile combustion. Combustion of volatiles, taking into account the fact that they consist mostly of hydrocarbons, proceeds first as combustion to CO and then combustion of CO to C02• Water has almost no influence on the first stage of combustion. The water influence on the second step and hence on the complete reaction is drastic and even a small amount of water present increases the reaction rate by orders of magnitude (see, e.g., [5] and [6]). Thus the fact that the ignition delay time is shorter in case of ''wet" experiments is understandable. On the other hand the fact that the preignition rp temperature is lower in wet experiments is much more difficult to explain. The first possible explanation is that the rate of a reaction, which heats the gas around the coal particle, decreases with introduction of small amounts of water. Such reactions, which can be applied in our case are not known to the author. Thus the reaction rate can become only faster and the second explanation, presented below, sounds more relevant. The position where volatile combustion occurs with respect to the coal particle surface is determined by the rate of devolatilisation from the particle surface and reaction rate in the volume (see section 2.2). An approximation of the fast reaction in the gas volume (thin sheet) can not be correct in our case because if the reaction is so fast that it is limited by oxygen diffusion from the bulk of the gas (mass transfer limitation), it can not be accelerated neither by water nor by anything else. This means that the reaction in the gas volume is relatively slow in comparison with mass transfer. When the particle is not too hot the rate of devo1atilisation can be not high enough to "push" oxygen significantly from the particle and there is a significant amount of it through the complete reaction zone (similar to fig 2.8). One should not forget though that close to the particle the gas is colder than farther in the gas volume. Thus most of the energy output will occur at a point remote from the particle surface. In order to find the flame position a following mass balance equation can be written:
(5.1)
where Rv is the combustion rate of volatiles in the gas volume, lc the distance from the centre of the particle to the reaction zone, .:1 the thickness of the reaction zone
Ignition experiments 94
(the thickness of the reaction zone is considered to be significantly smaller than the
distance of it from tbe centre of tbe particle), A, tbe preexponential coefficient for
the reaction in the volume E, the activation energy of this reaction and T, the temperature of the reaction zone.
In order to evaluate the temperature of the reaction zone one can write an energy balance equation as follows:
(5.2)
where Q. is the caloric value of combustion in tbe zone, K the mean value of tbe
heat gas heat conductivity, r the distance from the particle centre and T the
temperature in the gas around the particle. -l, and + l, with a vertical line means that the corespondent term is responsible either for cooling of the reaction zone in
the direction of the coal particle or to the bulk of gas (the thickness of tbe reaction zone, though not infinitely small, is considered to be much smaller than lc). In order
to find these terms one should solve a heat conductivity equation with two sets of
boundary conditions, as follows:
a ( 2 ar> - r K- =0, i:Jr i:Jr
Set 1: Tja =TP
Set 2: Tl 1 =T, '
(5.3)
where TP is the particle surface temperature and T _is tbe temperature of the gas far from the particle surface. For the evaluation the gas is considered to be not
moving. A solution for these two sets of equations can be written, as follows:
(5.4)
i:JT T -T Set2: -I;~=- - '
i:Jr ,
Using equation (5.1), (5.2) and (5.4) an expression for tbe temperature in the
Chapter 5 95
reaction zone Tc can be written as follows:
_ TP X -1 X-1 T--+T--+ A' c X .. X ~"c
(5.5)
where X is the dimensionless distance of the combustion zone from the particle
centre. The first term in the equation is responsible for the cooling to the particle
the second one for the cooling to the bulk of gas and the third one for reaction heat
release. If the heat released in the reaction is much smaller than the effects of
cooling, which means that Pc is much smaller than T .. , the temperature of the reaction zone as a function of the distance from the particle centre, repeats a
simple temperature profile for a cold particle in hot environment (see fig. 5.7 with
Pc = 0, Tp=500 K and T.,=llOO K ). If the reaction heat release is significant the
function changes somehow but still decreases within several radii near the particle
(see fig. 5.7with Pc = 900Kand Pc = 2600Kwhile I;,=500Kand T.,=llOOK).
Evaluations of the factor Pc for fig. 5.7 have been performed using equation (5.5)
with Qz=30 M1jkg, Rd=.05 kg/(m 2 s) and K=.05 1/(m s K) for Pc 900 K and Q2 =30 M1jkg, Rd=.15 kg/(m2 s) and K=.05 1/(m s K) for Pc = 2600 K Table 4.1
has been used to substitute a mean value of heat conductivity K. For the calorific
value of combustion Q values of calorific value of coal from table 3.1 have been
used. This value, as well as the value of devolatilisation rate Rd can vary
significantly depending on the coal type and parameters of devolatilisation (see, e.g.,
[7]). They have been chosen here to demonstrate the different possible regimes of
the volatile combustion.
First let us check the stability of the combustion zone position, taking into account
that combustion occurs at the positive slope of the temperature profile in fig. 5.7.
Square of the radius of the reaction zone is reverse proportional to the reaction
rate in the volume Rv. A small fluctuational increase of the reaction zone
temperature gives rise to the increase of the reaction rate, which in its turn shifts
the reaction zone closer to the cold particle in the region with relatively lower gas
temperature. The temperature of combustion will decrease and the reaction zone
will shift back to its original position. A similar effect will occur if the reaction zone
temperature accidentally decreases. This means that as long as the particle is colder
than the gas volume the reaction zone position is stable.
An increase of the reaction rate due to the introduction of water vapour shifts the
reaction zone closer to the cold particle in the region with a relatively lower gas
Ignition experiments 96
temperature. The reaction rate decreases with the decrease of combustion temperature till new equilibrium closer to the particle surface and a lower reaction zone temperature will be established (see fig 5.7). Thus the influence of water vapour on the reaction zone temperature can be explained in this way. The reaction zone temperature does not depend on oxygen concentration (see fig. 5.4), because the rate of the reaction of carbon monoxide with oxygen is a weak function of oxygen concentration (see [5]).
with water without water
1500
:::e: oi 1300 ... = .... Ill ... q.) 1100 c. e ll
q.) .... q.) 900 Ill
""-B=OK e
Ill ..c: c. ~ 700 01)
·;:
500 0 2 4 6 8 10
dimensionless distance
Figure 5. 7. Depeotleoce of the temperature io the reactioo zooe (Ttl as 11 fuoctioo of the tlimeosiooless tlistuce from the particle
ceoter for t!Jree ralues of factor .8" (0, .9(}(), 26(}() K)
5.3.2 Autoignition, scenario 1
A water influence on the ignition delay time can be explained by additional
production of the radicals which make the ignition delay time shorter in case of
autoignition. Induction (ignition delay) times 't; for hydrocarbons are usually described by
functions of the type [8]:
(5.6)
Chapter 5 97
where A;g is the pre-exponential factor, [Fuel], [Oxygen], [Inert] are the concentrations of the hydrocarbon, oxygen and inert component, respectively and E; is the activation energy of ignition. Fig. 5.5 presents an ignition delay time dependence on the reverse gas temperature for these experiments, as well as curves based on literature data for methane with: a. = 0, p = -1, y = 0, A;g =I -1 (}6 and E;g=/0180 Kfrom [9], a. =.3, p =-1.6, y =O,A;g=5 -1(}21 sand E;g=32100 K from [10], a. =.4, p =-1.6, y =0, A;g=3.6-J(J19 and E;g=30600 K from [11], a. =.4, p =-1.6, y =0, A;g=7.65-J(J18 and E;g=25400 K from [12], a.=O, P=-1, y=O, A;g=B-1.(}14 and E;g=25600 K from [13] and a. =.33, p =-1.03, y =O,A;g=3.62-J(J14 and E;g=23000 K from [14]. Specified values for A;g are ins when concentrations are in mole/cm3
•
The fuel concentration has been assumed to be equal to the oxygen concentration (see chapter 2 for the ignition position) and has been set equal to 1-1.(}4 mo/ejcm3•
There is also a curve which presents results of ignition experiments from [4] with Pittsburg Seam coal with the particle size 14.9 pm and volatile matter content 35%. Using the same units as above, equation (5.6) can be rewritten with a. =0, P =-2.1, y=O, A;g=l.9-J(J8 and E;g=/0800 K for the Polish coal used in our experiments. Because of the large scatter of ignition data for methane it is not difficult to fit our experiment with a set which represents one of them. It should be mentioned though that experimental results which fit our curve better have been obtained under higher gas temperatures than the gas temperature in our experiment. A comparison of the curve obtained in our experiments with the results obtained in [4] give also an indication of a possible effect of the particle size on the ignition delay time, which is not included in the autoignition scenario. Another fact, which can not be explained by simple autoigniton is the preignition combustion, which raises the rp temperature for about 400 K above the gas temperature. Thus this scenario does not give an explanation for all facts acquired in the experiment.
5.3.3 Heterogeneous ignition with heating from the homogeneous combustion, scenario 2
The main idea of this scenario is that ignition occurs at the particle surface with parallel combustion in the volume. A development of the particle surface temperature cannot be observed because of the screening effect of the combustion shell in the gas volume around the coal particle. In this case the ignition which is presented in fig. 5.1a corresponds to the moment when the particle temperature grows higher than the temperature of the shell and from this moment the measured rp temperature corresponds to the particle surface temperature. The big particle temperature measurements can be influenced by the screening shell. This fact though will not be taken into account in further evaluations. Thus a point of the real ignition can not be defined and the time, which has been called ignition delay
Ignition experiments 98
time, represents only a time it takes for a particle to be heated to the temperature of combustion in the volume. The shell temperature though, is different for combustion with and without water (see 5.3.1). Water does not influence combustion at the particle surface but the temperature which the particle has to reach to become detectable is lower. Because of this, the measured "ignition delay time" is also shorter. To unify the data one has to choose the same temperature (further 1550 K), which a particle has to reach in all experiments and to measure the delay time which is necessary for a particle to reach it. Fig. 5.8 presents this delay time as function of oxygen concentration for "wet" and "dry" experiments with Polish coal and for "dry" experiments with Canadian coal. It should be mentioned that the experimental error of the delay time in this case is much higher than that for the "ignition delay time". The results of the "wet" experiments do not differ within the experimental error from the "dry" ones. A very important question is what happens with the combustion in the volume when the particle temperature increases. It has been shown in 5.3.1 that as long as the particle temperature is lower than the temperature in the bulk of gas, the flame position is stable. Similar speculations but applied to the case when the particle temperature is higher than the temperature in the bulk of gas, show that the flame position is unstable and as soon as the particle temperature is high enough the gas flame collapses to the particle surface and exposes the particle to the cold gas environment. Thus the heat exchange between the particle and the gaseous environment is divided into steps before and after flame collapse. The amount of heat which the particle receives from the hot shell can be determined from equation (5.3) similar to equation (5.4) with a set of boundary conditions the same as Set 1 in equation (5.3). Then the heat flux from the gas at the particle surface QP is
(5.7)
•= X '
where • represents a factor by which one has to multiply the heat transfer, calculated for a hot shell situated far from the particle surface. The first step before the gas flame collapsed on the particle surface can be subdivided in two more steps: the particle temperature increase before the real ignition and after it. The real ignition occurs at particle temperatures lower than the shell temperature and is screened by it. The time it takes a particle to reach the ignition point is determined mainly by the heat transfer from the shell (see equation (5.7)). The time it takes a particle to reach a chosen temperature, which is higher
Figure S.8. Theoretical IHld e.:cpcrimentttl ignition delay times as a function of t!Je partial oxygen pressure
500
Ill
.§_ 400 Experiment with Polish coal ~
~ Q. 300 0 -Ill G)
""' = 200 -«< ""' G)
Q. s 100 G) -
0 1 2 3 4 5 6
partial 0 2 pressure, bar
Figure S..9. T/Jeoretical IUld e.:cperimen/111 rp temperature ignition slopes as a function of t!Je partial o.:cygeo pressure
99
Ignition experiments 100
than the shell temperature is determined mainly by the heat released in the reaction at the particle surface Q,., which can be written from equations (2.1) and (2.19) as
(5.8)
The amount of heatH, produced in the reaction changes from H,0 ~>~10 MJ per kg
of coal for the combustion to CO to H,02 .. 30 MJ per kg of coal for combustion to
C02 (see chapter 2). The temperature dependence of relative amount of CO and
C02 produced is given by equation (2.10). An expression for H,, used in further evaluations in this case can be written, as follows:
1 ( z ) H =-- H +--H "l+Z co 1+Z co2' (5.9)
where Z is determined by equation (2.10).
A complete equation of heat transfer for the particle during the first step of the temperature evolution can be written using (2.22) similar to (2.15), as follows:
(5.10)
Equations (5.7)-(5.10) have been used to make a computer model for the behaviour of the delay time and the temperature slope for Polish coal, presented in figs. 5.8
and 5.9. It should be mentioned that after the particle temperature reaches the
temperature of the shell (about 1400 K for the "dry" experiments, see fig. 5.4) and combustion in the volume collapses to the particle surface the particle becomes exposed to the cold gas (about 1100 K) and the parameter 1jr has been chosen equal
to 1. The system of equations (5.7)-(5.10) has several free parameters, such as ljr, n, A and Er In order to solve the system of equations these parameters have been first evaluated and then finally adjusted in the program. In order to evaluate the factor 1jr one should take into account that when the
amount of oxygen is relatively high the reaction rate and hence the chemical energy release after ignition are also high. This means that the ignition delay time will be
Chapter 5 101
mainly determined by the heating up time before ignition. A characteristic time 'th
in this case can be evaluated as follows:
(5.11)
The value of the heat conductivity at the mean temperature 1000 K from table 4.1 is equal to .7 W/(m K). The values for cpar is 15001/(kg K)and for Pp is 1200 kgfm3
(see section 2.3). The mean particle radius a is equal to 25 pm and the characteristic time 'th at high oxygen pressure is equal to 1 ms (see fig. 5.8). Substituting this values in equation (5.11) one can find that the factor 1jJ is equal to 6. Further fitting of calculations with the experimental points in the programm gave a value of this factor equal to 7. For a big particle the influence of the oxygen transfer to the particle surface can already be a significant limiting factor. In order to take this into account an additional equation for the oxygen concentration at the particle surface can be written using equations (2.1) and (2.2), as follows:
(5.12)
where y is equal to. 75 and Dis equal to 410-5 m2/s (see chapter 2). If the combustion process is limited by diffusion the effective reaction order is 1 a priori. If combustion is limited by the reaction at the surface this does not apply. As soon as the term QP in equation (5.10) is constant the dependence of the temperature slope on oxygen concentration gives the reaction order R. The reaction R order in the model has been chosen equal to 1 (see fig. 5.9). The calculations are sensitive to the absolute value of the reaction rate RP but not to specific values of the reaction rate components A and Er Because of this the value of EP has been taken equal to 5900 K from the experiments with small particles of the Polish coal from the table 4.2. The value of A has been varied to fit the graph of the temperature slope as a function of the partial oxygen pressure (see fig. 5.9). The results of these calculations are presented in figs. 5.8 and 5.9. They fit experimental points well. Fig. 5.10 presents a dependence of the reverse delay time on the partial oxygen pressure for the experiments with the Polish coal. It is interesting to see that both the temperature slope dependence in fig. 5.9 and the reverse delay time dependence
Ignition experiments 102
approximated with a linear function in fig. 5.10 are equal to 0 at about the same partial oxygen pressure 2 bar. This pressure corresponds to the situation when there is not enough oxygen for the particle temperature to grow and thus the delay time can not be measured.
1.00
fll e 0.80 Polish • - ___,.. ..... coal u e 0.80 ... • >.
.!':! Q)
0.40 "0 I Q) fll ... Q)
> 0.20 Q) ...
0.00 2 3 4 5 6
partial 0 2 pressure, bar
Figure .f.JQ. TbeoreticalllDd experimeotal rtwerse igoit.ioo delay times as a fuoctioo of the partial oxygeo pressure for Polish coal
It should be mentioned at the end of this subsection that the process of the homogeneous flame collapse to the particle surface, described above, occurs at similar conditions as adiabatic ignition from [15], though if in [15] the zero gradient of the gas temperature at the surface is an indication that the reaction in the volume can support itself. In our case ignition occurs at the surface and the processes in the volume play an important but secondary role in it. As a concluding remark it can be said that the proposed heterogeneous model describes the experimental data better than the autoignition one. Still more experiments have to be performed in order to support this fact quantitatively.
5.4 Ignition of small particles
The presentation of experiments of the small ( < 6 pm) particles ignition in this work will be given in a somewhat different order than usual. This topic is closely connected with the combustion experiments presented in chapter 4. Because of this we will start with the analysis of the experimental material on the ignition which is
Chapter 5 103
already present in the combustion experiments and only after this we will proceed with the experiments performed directly for ignition. It should also be pointed out that the temperature measurements in ignition experiments with small coal particles are completely similar to the ones in combustion experiments. As has been mentioned above, unlike the temperature measurements of big particles, the ones for small particles correspond to the particle surface temperature of the particle itself.
5.4.1 Ignition in combustion experiments
The analysis of the ignition behaviour of the small coal particles is based on the data and model calculations presented in chapter 4 and particularly in subsection 4.3.4. As has been mentioned above ignition is a transition process between the reaction limited combustion and diffusion limited one. The results of combustion experiments in figs. 4.21 a and b present temperatures which correspond to the particle temperature plateau after temperature rise, which means after ignition (see fig. 4.5). It has been shown in chapter 4 that these plateau temperatures correspond to the chemically controlled regime of combustion (see figs. 4.18 a and b). Thus particles ignite but do not reach the diffusion limited regime of combustion. It happens because during the temperature rise the particle size decreases. As a consequence the oxygen flux to the particle surface and the heat flux from it increase and the particle temperature reaches a maximum at temperatures, which still correspond to the chemically controlled regime of combustion. The model, described in subsection 4.3.4, has been used in order to illustrate this fact. The parameters have been taken similar to the ones used in calculations of the Polish coal combustion. Figs. 5.11 a and b present the particle temperature behaviour with the changing particle size (fig. 5.11 a) and with the fixed particle size (fig. 5.11 b). The gas temperature in the calculations has been gradually increased from 1060 to 1420 K. The minimum gas temperature after which ignition occurs is about 1260 K.
The particle history after ignition though is different, as has been expected, for calculations with the fixed and changing particle size. Fig. 4.21a and b (see subsection 4.3.4) present a dependence of the particle maximum temperature measured in the experiments as well as calculated with the model (see fig 5.lla) on the gas temperature. It can be seen in figs. 4.21 a and b that the particle maximum temperature, measured in the experiments rises very steep starting from some temperature which lays between 1200 and 1300 K and apparently corresponds to the ignition point. All experiments performed at gas temperatures lower than this threshold temperature should not reveal any ignition. Below it will be shown that it is not completely true. Particle and gas temperature measurements in such a point analyzed with the aid of TET analysis (see subsection 2.3.2) can give directly the value of the activation
Figure S.11 a, 6. T.1Jeoretica1 time 6e.IJa vi our of t.IJe particle temperature (a-2. 4 pm) for c.IJaogiog (a) aotl fixed (6) particle size wit.IJ a
gratlua/J.y iocreasiog gas temperature (1060-1420 K)
104
energy from equation (2.25). The experiments presented here have not enough accuracy for such kind of measurements.
ChapterS 105
5.4.2 Delayed ignition
A number of experiments has been performed with small particles of Polish coal in an oxygen-nitrogen mixture at gas temperatures lower than 1200 K, which means lower than ignition threshold defined in subsection 5.4.1. An example of such an experiment is shown in fig 5.12 as a time dependence of the particle temperature.
Conditions in the gas were: the gas temperature Tg has been equal to 1060 K and the partial oxygen pressure 7.9 bar. Indeed no immediate ignition occurs. The particle temperature reaches a value which is almost equal to or a little bit higher than the gas temperature and stabilizes at this value for some time. The time interval of the stable particle temperature is followed by the primary ignition with relatively slow increase of temperature. Mter some time a secondary ignition occurs changing of a rather moderate temperature slope in a steep one. Ignition at gas temperatures lower than the threshold temperature of ignition will be further called as a "delayed ignition". The question is what causes this "delayed ignition". The end of this chapter is devoted to this problem.
2300
2100
1900
1700 Secondary ignition
~ ~ 1500
E-< ~ 1300 Primary ignition
\. 1100
900
700 0 2 3 4 5 6
time,ms
Figure .f./2. Time hc.!Javiour oft/Je particle IC11lperature (a=2.4 pm) wit.IJ primary and secondary ignitions
Dependence of the delayed ignition delay time on partial oxygen concentration, gas temperature and particle concentration
Fig. 5.13a presents results of the ignition experiments in an oxygen-nitrogen mixture at the gas temperature Tg equal to 1060 K. The amount of coal injected in the shock
Ignition experiments
8r---------r-----,------------------.
s~co~~ary-}- 0 tgmlwn 1
T8=1060 K, 500 mg
r F--~-;-~m-ila_i:_~_--;~,_...;:JE:._~r--o-e_n_d_o_f_c_o_m....lp.Zre::..s_s_;\...:n_-1 >. «< :g I
2 o secondary I
ignition r < I
3 4 5
I begining of compression
6 7 8 9 a .. --------------,------------------.
secondary T g = 1060 K, 1000 mg /ignition
0
0 3
8
6
"' e ,; E
4 ·::: >. «< "il "'0
2 I no sec ndary I
. . . I Igm IOn 1
0 3
4
4
5 6 7 8
=1120 K, 500 mg
secondary
compression
s 6 7 8
partial 0 2 pressure, bar
9
9
Figure 5.1.1 a,h,c. Primary and secondary ignition delay time as a function of t.!Jc partial oxygen pressure for experiments wit.IJ different
gas temperatures .?;. aod amounts of coal injected (for more information sec subsection 5.4.2)
106
Chapter 5 107
tube is 500 mg. The figure shows delay times for both primary and secondary ignition as a function of the partial oxygen concentration. It should be mentioned here that not every primary ignition is followed by the secondary one. When the partial oxygen pressure is lower than a certain value no secondary ignition within the experimental time and sometimes also no primary igntion is detected. Another remark has to be made about compression, which occurs after 2.8 ms counting from the creation of the hot gas conditions and continues for about 1 ms. This compression leads to a small gas temperature increase (about 50 K). The nature of this compression has been discussed in subsection 3.1.1. The time between the beginning of the compression and its end (the compression period) is equal to about 1 ms. The primary ignition delay time is a step function of the partial oxygen pressure. This step occurs when by decreasing the partial oxygen pressure a point is reached where ignition delay time is long enough for the primary ignition to take place after the compression period. The gas temperature increase due to compression apparently influences the ignition behaviour of coal particles. This produces the step in the ignition delay time dependence on the partial oxygen pressure. The secondary ignition delay time is more chaotic and tends to be longer with the decrease of the partial oxygen pressure. Fig. 5.13b presents results of experiments similar to the ones presented in fig. 5.13 a. The only changed parameter is the amount of coal injected in the shock tube. In these experiments it was equal to 1000 mg. The dependence of the ignition delay time on oxygen concentration in this case is significantly different. The prima~Y ignition delay time occurs about 1 ms earlier. The secondary ignition appears also earlier and is less scattered. The partial oxygen pressure under which no secondary ignition takes place within experimental times is lower. Fig. 5.13c presents results of the experiments similar to the ones presented in fig. 5.13a. The only changed parameter is the gas temperature. In this experiment it is equal to 1120 K. The change of the ignition behaviour is similar to the one described above for the experiments presented in fig. 5.13b. Fig. 5.14 presents the particle temperatures at the point of the secondary ignition as a function of the partial oxygen pressure for conditions of the experiments presented in figs.5.13a- 5.13c. The particle temperature of the secondary ignition depends neither on the partial oxygen concentration nor on the other experimental conditions.
Discussion of presented experiments with small particles
The phenomenon of delayed ignition can have two possible causes: development of the particle surface of a single particle and interaction between the particles. The difference between the experiments presented in figs. 5.13a and 5.13b clearly shows
Figure f./4. Measured secondary igoitioo temperatures as a fuocdoo of t/Je partial oxygeo pressure for dif.kreot gas tempenturtJS
r,. /JOO llD/ouot of Polis.IJ coal iojected (a=2.4 pm)
108
that the ignition process depends on the particle number concentration and thus the delayed ignition occurs due to the interaction between the particles.
An interaction between the particles can occur in two ways: either through emission and absorption of radiation by the particle surface or through the gas volume. The radiation term oT/ (see equation (4.28)) has to be compared with the heat
conductive one "(Tp- T .)/a. At a particle temperature equal to 1100 Kanda gas temperature equal to 1060 K the first term is at least 10 ten times lower. This makes the idea of the radiation exchange influence on the ignition not very likely. Thus the interaction between the particles apparently occurs through the bulk of
gas. It should be mentioned that the delay time of the delayed ignition is very sensitive to the temperature in the gas volume. It is seen in fig. 5.13a that a temperature
increase due to compressionin the gas volume of about 50 K cart lead to ignition while under conditions without compression ignition would occur after a longer delay time. Ignition delay time of the delayed ignition is also shorter when the gas temperature is 60 K higher (see fig. 5.13c).
Two possible scenarios of the interactions of the coal particles through the gas volume can be imagined.
Scenario 1. First step: due to the process of devolatilisation the volatile matter is
first accumulated in the gas volume and then ignites due to autoignition with some
delay. This corresponds to the primary ignition. Second step: combustion of volatiles increase the particle temperature and when the gas and particle temperatures are
Chapter 5 109
high enough heterogeneous ignition of coal particle occurs (see subsection 5.4.1). This corresponds to the secondary ignition. Scenario 2. Ignition of volatiles occurs immediately at the particle surface and heat
of the heterogeneous combustion accumulates in the gas volume. Primary ignition in this case is not ignition at all but just increase of the particle temperature due
to increase of the gas temperature. The secondary ignition occurs in the same way as in scenario 1.
These scenarios are very close to each other. The main difference between them is that the second scenario has no first step or it takes place very fast. Let us first
consider the facts and make evaluations of the characteristics which both of those
scenarios have in common.
The main feature which has to be evaluated in both cases is an influence of the heat produced due to the particle combustion on the gas temperature. The amount
of gas mgas which is present in the test section of the shock tube is about .07 kg. The value of heat capacity of the gas (oxygen) cpg at the conditions of the experiments
is about 1100 Jj(K kg). The amount of coal available mcoaJ is about 51tr kg. The
calorific value of coal Q is 30 MJjkg. The equation for a temperature increase ..::iTgas can be written as follows:
(5.13)
An increase of the gas temperature calculated in such away is equal to about 200 K. This can influence the ignition process significantly. This fact supports both
scenarios of ignition. It should be mentioned here that in the experiments with combustion presented in chapter 4 the influence of the gas heating has been considered to be not important because almost twice less coal has been used and only early stages of combustion have been used for the calculations. The fact that the particle temperature of secondary ignition depends neither on the
amount of coal injected nor on original gas temperature (see fig. 5.14) shows that the secondary ignition represents single particle ignition without interaction between the particles and corresponds to the ignition mechanism described in subsection 5.4.1. Apart from this, it can be shown that the model presented in subsection 2.3.6
is fulfilled only in the case that an empirical coefficient a in it is very close 1. The second term in the denominator of equation (2.33) in our case is much higher than
1 but still no change in particle ignition temperature has been measured with
increase of the cloud density by two times. With a equal to 1 this model can be still valid but does not represent details of the ignition behaviour of coal particles.
Ignition experiments 110
Increase of the original gas temperature makes the time needed to reach the ignition gas temperature shorter. This fact can be supported by comparison of figs. 5.13a and 5.13c. In order to find a possible influence of the volatile matter on the delayed ignition of the coal particles char samples of small Polish coal have been produced in KEMA using a drop tube with nitrogen at 1200 K. Fig. 5.15 shows a comparison of two experiments with coal and with char. The gas temperature in both experiments has been equal to 1120 K. 1000 mg of coal/char has been injected in both experiments. While coal ignites, char does not show any ignition. Apparently volatile matter has a big influence on the delayed ignition. The necessary condition of volatile ignition of scenario 1 is fulfilled. But scenario 2 is also valid because heat can be accumulated during the volatile matter combustion.
2000
1800
~ 1600
0.. E-t 1400
1200
1000 0 2 4 6 8
time, ms
Figure 5. .15. Time !Jc.IJa riour of t.IJe coa.l pHtic.le temperature of Polis.IJ coal (a•2.4 pm) and c.IJar of Polis.IJ coa.l in experiments
wit.IJ gas temperature T,-.1.120 K
The fact, that the delay time of the primary delayed ignition is about 1 ms shorter and the secondary one is at least 2 ms shorter in the experiments with 1000 mg of coal than in the experiments with 500 mg of coal at the same gas temperature and in the region of the high oxygen partial pressures, apparently can be explained by higher amount of volatile matter available for combustion in the volume. This supports directly the second scenario of ignition. The first step of the first scenario (autoignition) is mostly either not influenced by an increase of volatile matter concentration or even delayed by it (see [8]). An additional experiment has been performed with the introduction of a small (about .5 %) amount of water in the
Chapter 5 111
shock tube similar to the one described in subsection 5.2.3 while the oxygen partial pressure has been about 8 bar. Unlike experiments with big particles no influence of water vapour on the ignition delay time nor on the temperature time behaviour has been found. It can be expected that the increased radical production caused by the introduction of small amount of water in the system can give rise to the faster autoignition. Apparently this is not the case. It has been shown in section 4.3 that water influences combustion of volatiles in case of big particles. The fact that it does not happen in the experiments with small particles indicates that the combustion process under high partial oxygen pressure is limited by devolatilisation and not by reaction in the volume. The decrease of the partial oxygen pressure though can change this situation. If the partial oxygen pressure is low enough the gas temperature, at which the secondary ignition occurs, is not reached within experimental time. Increase of an amount of volatile matter due to increasde of the amount of coal
injected in the shock tube shifts the partial oxygen pressure limit for secondary ignition to the region of lower pressures due to increase of the combustion rate in the volume.
Concluding remarks on the delayed ignition of small particles.
From the discussion presented above it can be concluded that: The delayed ignition occurs due to the heat accumulation in the gas volume The accumulated heat is produced due to combustion of the volatile matter Both scenario 1 and 2 can be valid but scenario 2 seems more consistent with the complete experimental picture.
An overview of the ignition experiments can be presented as follows:
Gas temperature quantitave change qualitative change
Water influence yes no
Role of volatiles heating of the particle heating of the particle and gas
Heterogeneous ignition after homogeneous simulteneously or after long delay
Ignition experiments 112
Literature
1. Smith, I. W., et al, Coal Combustion Testing: Optimum Laboratory Procedure, End of Grant Report No 993, Commonwealth of Australia National Energy Research, Development and Demonstration Program, Department of Primary Industries and Energy, Canberra, Australia, 1991.
2. Timothy, L. D., et al., Proceedings of the Ninteenth Symposium (International) on Combustion, The Combustion Institute, Pittsburgh, 1982, 1123-1130.
3. Timothy, L. D., et al., Proceedings of the Twenty-first Symposium (International) on Combustion, The Combustion Institute, Pittsburgh, 1986, 1141-1148.
4. Seeker, W. R., The kinetics of ignition and particle burnout of coal dust suspensions under rapid heating conditions., Ph.D. Dis., Kansas State University, Kansas, 1979.
5. Dryer, F. L. and Classman I. , Proceedings of the Fourteenth Symposium (International) on Combustion, The Combustion Institute, Pittsburgh, 1973, 987-1003.
6. Frank-Kamenetskii, D. A., Diffusion and heat transfer in chemical kinetics, Plenum Press, New York-London, 1969.
7. Prado, G., et al. in: Fundamentals of the Physical-Chemistry of Pulverised Coal Combustion, NATO ASI Series E, 137, Eds. Lahaye, J. and Prado, G., Martinus Nijhoff Publishers, Dordrecht/Boston/ Lancaster, 1987.
8. Heffington, W. M. et al. , Proceedings of the Sixteenth Symposium (International) on Combustion, The Combustion Institute, Pittsburgh, 1976, 997-1011.
9. Asaba, T. et al. , Proceedings of the Ninth Symposium (International) on Combustion, The Combustion Institute, Pittsburgh, 1963, 193.
10. Bowman, C. T. and Seery, D. J., Combust. Flame., 12, 1968, 611.
11. Bowman, C. T., Comb. Sci and Tech., 2, 1970, 161.
12. Seery, D. J. and Bowman, C. T., Combust. Flame., 14, 1970, 37.
13. White, D. R., Shock tube studies of Nitrogen Vibrational Relaxation and Methane Oxidation, Contract AF 33 (615)-5772, Project 7023, Report S-70-1054, Aerospace Research Labs., Off. of Aerospace Research, WPAFB, Ohio.
14. Lifshitz, A., et al., Combust. Flame., 16, 1971, 311-321.
15. Annamalai, K and Durbetaki, P., Combust. Flame, 29, 1992, 193-208.
Chapter 6 113
Chapter 6
Conclusions
6.1 Methods
This study is performed using a shock tube for a fast ( < 100 ps) creation of hot gas
conditions with gas temperatures from 600 to 2500 K and gas pressure about 8-10
bar.
Non-interactive diagnostic methods based on infrared (IR) emission have been worked out for the measurments of particle surface temperature, relative number concentration of coal particles and the detection of the gaseous combustion products. The particle relative size measurements based on the IR two wavelength pyrometry being compared with laser extinction measurements showed a complete similarity. Emission spectroscopy measurements using the background radiation from hot particles as a reference source demonstrated a good applicability of this method for diagnostics of the combustion products. Simultaneous use of the burn out and energy balance methods based on IR pyrometry together with the emission spectroscopy method form a useful compact diagnostic system for pulverised coal combustion investigation.
6.2 Combustion
It has been found that for small particle ( < 6 p.m) heterogeneous combustion occurs in the regime of "rough sphere" kinetics for a partial oxygen pressure higher than 1 bar. The true reaction order measured under these conditions is very close to 0. When the partial oxygen pressure is lower than 1 bar the combustion is limited by diffusion. A good agreement between the evaluated diffusion limit and the experimentally measured combustion rate confirms the validity of the methods used. A comparison of the combustion rate measured by "burn out" method with the energy release during combustion measured by the "energy balance" method as well as the nonexistence of the measured volatile matter in the gas volume demonstrates a strong influence of the homogeneous combustion in a thin layer near a coal particle on the energy balance of combustion. In the heat balance a value of the combustion heat should be used higher than the one which corresponds to heterogeneous combustion with carbon monoxide production. Polish coal with a volatile content higher than in lllawara coal reveals a higher rate of heat release. Another approach is to use kinetic values not of the burn out but of heat release rate directly. A model based on this approach shows a good agreement with the
Conclusions 114
experiments. As is measured in the experiment and confirmed by the model a
decrease of the particle size due to combustion prevents a particle temperature runaway after ignition. Thus combustion after ignition occurs in the reaction controlled regime rather than in the diffusion controlled one. If the particle temperature reaches a plateau this plateau occurs not due to the fact that combustion becomes limited by diffusion but due to the dynamical equilibrium of a burning particle.
6.3 Ignition
As has been found in the experiments, ignition of small coal particles ( < 6 p.m) occurs in two different ways. The "usual" ignition, when the temperature is constantly rising is predictable by the combustion model based on the data of combustion experiments performed in this work. Another kind of ignition is called "delayed" because it occurs with some delay after the creation of the hot gas conditions and when the particle temperature plateau is already reached. This ignition is influenced by the amount of coal injected into the system. As is shown in the study the "delayed" ignition occurs due to the accumulation of heat in the gas due to the volatile matter combustion in the gas volume. The gas temperature interval where the transition from the "usual" to the "delayed" ignition occurs is 1200
• 1300 K. The experiments demonstrate that the particle interactions give rise to a decrease of a gas temperature limit for ignition while the ignition particle temperature remains the same (within accuracy of the experiments). Both types of ignitions can not be classified neither as a pure heterogeneous or homogeneous ignition and are ignitions of the mixed type where volatile matter combustion has a big influence on the processes at the surface. In addition, a minor hydrodynamical effect of the shock tube influences the "delayed" ignition strongly. Experiments with big coal ( < 70 p.m) particles show that the measured particle temperature corresponds to the temperature of the hot shell around the particle heated by the volatile matter combustion. Combustion of volatile matter in the vicinity of the coal particle give rise to a relatively fast heating of the particle and its heterogeneous ignition. Ignition in this case, as in the case of small particle ignition, is of the mixed type.
Thus the fact that ignition of big particles occurs homogeneously and of small particle heterogeneously is not confirmed completely. Processes in the volume as well as at the surface have a big influence on each other.
6.4 General conclusion
Results of the experiments show that a shock tube technique can be used for coal
characterisation in respect with combustion as well as for a basic study of the pulverised
coal combustion.
List of symbols
reaction coefficient (kgj(m2 s Pd")). preexponential factor for ignition in (5.6). preexponential coefficient of the combustion in the volume (kg/(m3 s)). preexponential factor of the energy release (W/(m2 Pd")). pressure coefficient (1/(Pa m)). seep. 75.
115
preexponential factor in Planck's law (Wjm3).
preexponential factor of the reaction rate in Zone II (klf1-m)/2j(s112 m(l-lm)/2)).
particle surface (m2).
particle size (m). size of the fraction of particles in (4.4) (m). order of the reaction (see p. 79). concentration of an active product (molejm3
).
second constant in the Planck's law (K m). drag coefficient. concentration of an active product (molejm3
)
heat capacity of the coal particle (l/(K kg)). velocity of the incident shock (mjs). velocity of the reflected shock (m/s). heat capacity of the gas (l/(K kg)). order of reaction (see P.· 79). diffusion coefficient (m2js). diffusion coefficient at some standard pressure and temperature (m 2/s ). diffusion coefficient of oxygen in the pores (m 2/s). minimum particle diameter (m ). maximum particle diameter (m ). mean linear particle diameter (m). mean square particle diameter (m ). mean cubic particle diameter (m ). mean radiative particle diameter (m). activation energy for reaction at the particle surface (K). adsorption activation energy (K). desorption activation energy (K). activation energy for particular reaction of devolatilisation (K). effective radiation surface (m2
).
activation energy of the combustion in the volume (K). activation energy (seep. 79). activation energy for ignition in (5.6) (K). drag force (N). rate constant of branching (1/s). statistical weight of particles (1/m). rate constant of chain termination (1/s). flux of a gas componentj (kgj(m2 s)). transmitted light intensity in a spectral interval per unit solid angle (W{m2
).
incident light intensity in a spectral interval per unit solid angle (W jm ). intensity in a spectral interval per unit solid angle (W/m2
).
extinction signal. intensity of the particle radiation in a spectral interval without absorption per unit solid angle (Wjm2
).
intensity of the black body radiation in a spectral interval without absorption at the particle temperature per unit solid angle (Wjm2
).
intensity of the black body radiation in a spectral interval without absorption at the gas temperature per unit solid angle (Wjm2
).
total intensity in a spectral interval per unit solid angle (W/m2).
heat of combustion (1/kg). heat of combustion to CO (Jjkg). heat of combustion to COil/kg). resulting flux of oxygen, calculated per unit of mass of carbon (kg/(m2 s)). Planck's constant (J s ). enthalpy of the gas after the incident shock (1/kg). enthalpy of the gas before the incident shock (Jjkg). enthalpy of the gas after the reflected shock (1/kg). reaction rate coefficient of devolatilisation (1/s ). reaction rate coefficient of a particular reaction of devolatilisation (1/s). preexponential factor for particular reaction of devolatilisation (1/s). penetration depth of oxygen (m ). length of the light path through the absorbing gas (m). length of the emitting chamber (m ). mean free path (m ). distance from the centre of the particle to the reaction zone (m ). molecular weight of C (kg/mole). molecular weight of 0 2 (kg/mole). mass of particle (kg). true reaction order. mass of coal available (kg). mass of gas (kg). Avagadro's number (1/mole). number of particles. number of pore mouths per unit of external surface (1/m2
).
apparent reaction order. rate of chain generation (mole/(m3 s)). partial pressure of gaseous reactant at the particle surface (Pa). pressure (Pa). standard pressure (Pa). pressure of the gas after the incident shock (Pa). pressure of the gas before the incident shock (Pa). pressure of the gas after the reflected shock (Pa). absorbing gas pressure (Pa ). calorific value of coal (Jjkg). term of energy release of the chemical reaction (J). term of heating due to the heat transfer to the gas volume (J). extinction coefficient. heat flux from the gas at the particle surface (W/m2
).
heat released in the reaction at the particle surface (Wjm2).
cloud radius (m). surface reaction rate per unit of external surface (kg/(m2 s)). apparent reaction rate in Zone II (kg/(m 2 s)). reaction rate in Zone III (kg/(m 2 s)). universal gas constant (1/K mole). rate of chemical adsorption (kg/(m2 s)). rate of chemical desorption (kg/(m2 s)). devolatilisation rate at the particle surface (kg/(m2 s)). measured reaction rate per unit of external surface (m2
).
rate of volatile combustion (kg/(m3 s)). rate of the energy release (Wjm2).
mean pore radius (m ). characteristic combustion radius (m). distance from the particle centre (m).
116
4
Clp J} y .:1l .:1, .:1 .4Tgas E
'1 'lv 'lE 'K
l y
v. 8 Ps P. Pp p Po P; Pr
crossection of a single particle (m2).
steric factor. particle temperature or temperature of gas at the particle surface (.K). gas temperature (.K). standard temperature (.K). particle temperature in the ignition point (.K). gas temperature in the ignition point (.K). measured particle temperature (.K). temperature of the reaction zone (.K). particle temperature at the stationary situation (.K). combustion temperature (.K). time (s). velocity of the gas after the incident shock (m/s). difference between the particle and the gas velocity (m/s ). amount of volatiles released up to time t (mole). limit of V after large t (mole). amount of volatiles released in particular reaction up to time t (mole). limit of V; after large t (mole). mean square velocity (m/s). radial velocity (m/s). dimensionless distance of the combustion wne from the particle centre. particle diameter (m ). coordinate along the optical axis (m ). mass fraction of a gas component j . number of active sites per unit area (1/m2
).
see (5.9). empirical power index. temperature coefficient (K/m ). factor. stoichiometric factor. filter spectral width (m ) . combustion layer thickness (m ) . thickness of the reaction zone (m ) . increase of the gas temperature (.K) • emissivity. emissivity factor. gas viscosity. total emissivity. heat conductivity (Jj(K m)). wavelength (m). mole ratio. coverage of the active sites. porosity of the coal. partial density of the gaseous reactant at the surface (kg/m3
).
partial density of the §aseous reactant in the gas volume (kgjm3).
particle density (':ff(m ). gas density (kgjm ). gas density before the incident shock (kgjm3
).
gas density after the incident shock (kgjm3}
gas density after the reflected shock (~m ). constant in Kirchhoffs law (Wj(m2 deg ). acceleraHon characteristic time (s). heating characteristic time (s). ignition delay time (s). see (5.7).
117
118
Acknowledgements
I want to express my gratitude to those without whom my work would have been much more difficult or impossible to accomplish.
Thank you, Bram Veefkind (dr. Veefkind). Without you this study would not even have started. Regular and irregular discussions with you gave me skill and courage to perform my difficult work. Thank you, prof. Rietjens. As my thesis professor you guided me on my way from the beginning to the end of my thesis work and kept me on the main stream of the problem. Thank you, Wijnand Rutgers (prof. Rutgers). Discussions with you and your precision in the expression of thoughts helped me to formulate my thoughts on paper and make them clear to myself. Thank you, Inna Abramovna (prof. Vasilieva). I consider myself to be your student for ever. Thanks for your excellent support on the diagnostics part of my thesis. Thank you, Valentin Anatolievich (dr. Biturin) for your philosophical, scientifical and human support. Together with V. Ivanov you contributed to this thesis with a computational experiment. Thank you, Frank Commissaris. Your permanent scientific attacks on me kept me in shape and improved my thesis a lot. Thank you, Yves Creyghton. You have survived sharing an office with me staying kind and supportive. Your precise work on the layout of your thesis gave the main frame of mine. Thank you, Herman Koolmees. You taught me to work with big technical devices and were always there to shoot any trouble. Thank you, Ad van Iersel. Your artistic work in fine mechanics and fme work in art helped me to make all small gauges, which would be ugly, or would not work, without you. Thank you, Ad Holten. Without your skills in computers and electronics a pen, a piece of paper and a calculator would be still my acquisition and computing systems. Thank you, Adriaan van der Veen for your help in coal preparation. Thank you, Joop de Smit for helping me with coal size analyzing. Especially big thanks for your human support during my first steps in this country. I wish to thank all members of the group whom I did not mention yet for their help and support at my work and in my daily life. Finally I would like to thank my fiancee Hanneke de Smit for a very boring work of brushing up the language of my thesis without even slightest understanding of their content, for waiting for me in the evening while I was late from work and for her love to the scientist with all the inconveniences, which it brings.
Name: Date of birth:
Place of birth:
Education:
CURRICULUM VITAE
Vadim E. Banin 6 December 1965 Moscow, Russia, USSR
1973-1979 specialised English school
1979-1982 physical and mathematical school
1982-1988 Moscow Physical-Technical Institute (MPTI) Department of chemical physics. Diploma cum laude.
Research activities:
1988 Practical work at the Institute for High Temperatures of the USSR Academy of Sciences (IVT AN) in the laboratory for plasma diagnostics.
1988-1990 Research assistant at IVTAN
1990-1994
in the same laboratory. The subject of work: Gas discharge at hot ceramics electrodes in a flow of combustion products. The work has been performed under supervision of prof.dr. I.A. Vasilieva.
Ph.D. student in Eindhoven University of Technology The Netherlands (EUT). The subject of Ph.D work is described in this thesis. The thesis professor is prof.dr. L.H.Th. Rietjens.
Stellingen behorend bij het proefschrift
Shock tube research on kinetics of pulverised coal particles
combustion and ignition
V.E. Banin
Eindhoven, vrijdag 18 november 1994
1. With decreasing gas temperature or with increasing particle size, processes in the volume play a larger role in coal particle combustion. Conditions can be created in such a way that the influence of an installation will be predominant and even lead to new phenomena such as two-step ignition.
2. The shock tube technique can be used for coal characterisation with respect to combustion as well as for a basic study of pulverised coal combustion.
3. The time scale of the shock tube experiments does not allow one to follow the complete process of combustion of big coal particles, but is adequate for small particles' combustion studies. In this respect a shock tube is presumably the only possible tool because of the fast creation of hot gas conditions.
4. While performing measurements in a hot environment it is preferable to use optical diagnostics. Firstly, they do not influence experimental conditions. Secondly, they produce results that are related to the characteristics of the experimental object rather than to the conditions of the experimental tool.
5. The same tool or method can be used in at least two ways. If your attempts to perform a scattering experiment with a laser do not succeed, try to enjoy a subtle play of the light reflections on the wall.
6. The influence of volatiles on the process of combustion can not be completely separated from the whole process of combustion. In this respect homogeneous and heterogeneous combustion and ignition are strongly interrelated.
7. The less money you have for an experiment, the more you have to think. In the worst case, if you have almost no money, you can become a theoretician, which is possibly not so bad after all.
8. The installation used in this study can be equally used for experiments on pulverised coal combustion as well as for experiments on combustion of any pulverised matter.
9. The use of more efficient energy production processes can postpone an environmental apocalypse for some time. In this respect the use of waste as an energy source in the combustion plants can produce a double environmental benefit.
10. There is a strong influence of the coal particle number concentration on the ignition. This confrrms the rule of thumb of professor Essenhigh: " If you are in a room filled with coal dust set your thumb at an arm's length. If you can't see it get out of there" (private communication].
11. One well known man said that everything in the human being comes from his heart. Another said that everything comes from his stomach. The third said that human behaviour can be explained by sex. The fourth one said that everything is relative. In an explanation of a complex phenomenon you can start &om whatever point you like and if the system of equations is closed you will come to the same result.