20
Shonda Kuiper Grinnell College
| Date post: | 29-Dec-2015 |
| Category: |
Documents |
| Upload: | magdalen-henry |
| View: | 214 times |
| Download: | 0 times |
Shonda Kuiper
Grinnell College
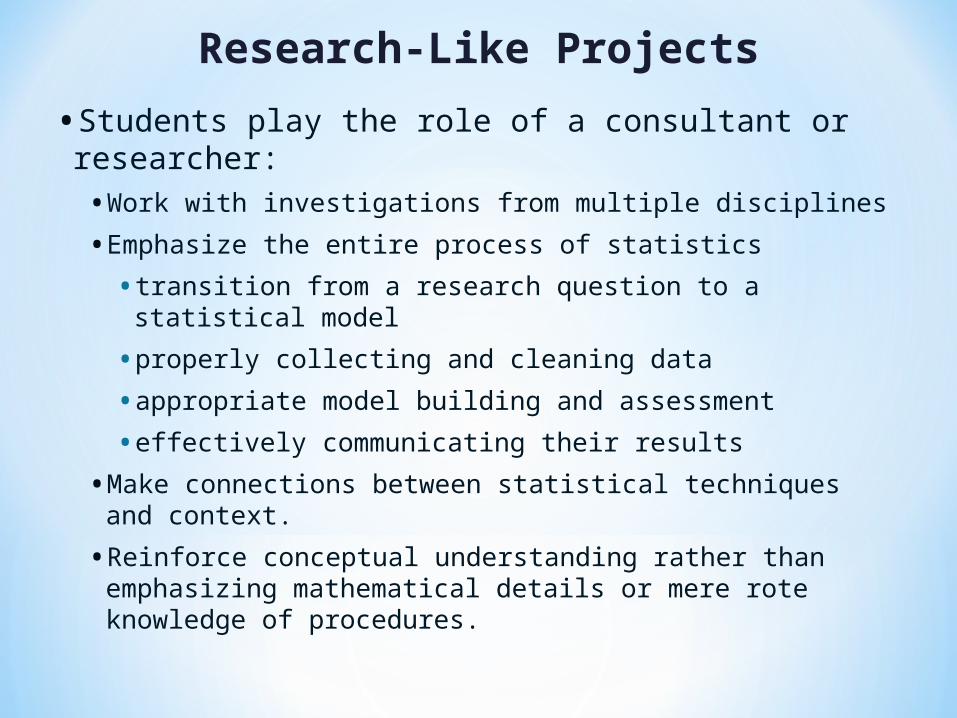
Research-Like Projects
•Students play the role of a consultant or researcher:•Work with investigations from multiple disciplines
• Emphasize the entire process of statistics
• transition from a research question to a statistical model
• properly collecting and cleaning data
• appropriate model building and assessment
• effectively communicating their results
• Make connections between statistical techniques and context.
• Reinforce conceptual understanding rather than emphasizing mathematical details or mere rote knowledge of procedures.
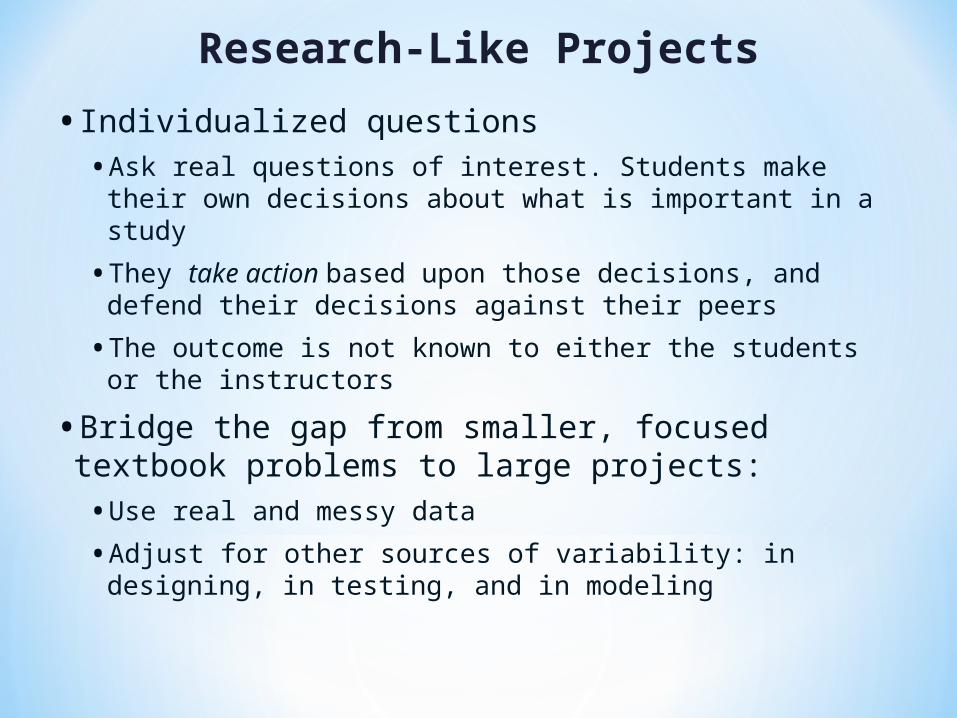
Research-Like Projects
• Individualized questions• Ask real questions of interest. Students make their own
decisions about what is important in a study
• They take action based upon those decisions, and defend their decisions against their peers
• The outcome is not known to either the students or the instructors
•Bridge the gap from smaller, focused textbook problems to large projects:• Use real and messy data
• Adjust for other sources of variability: in designing, in testing, and in modeling
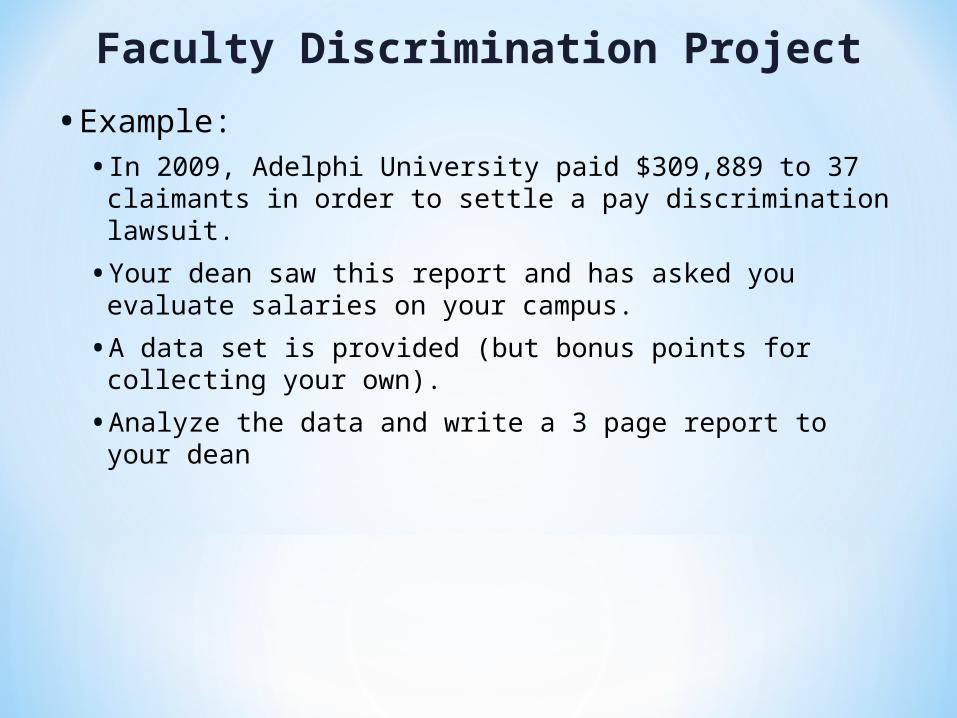
Faculty Discrimination Project
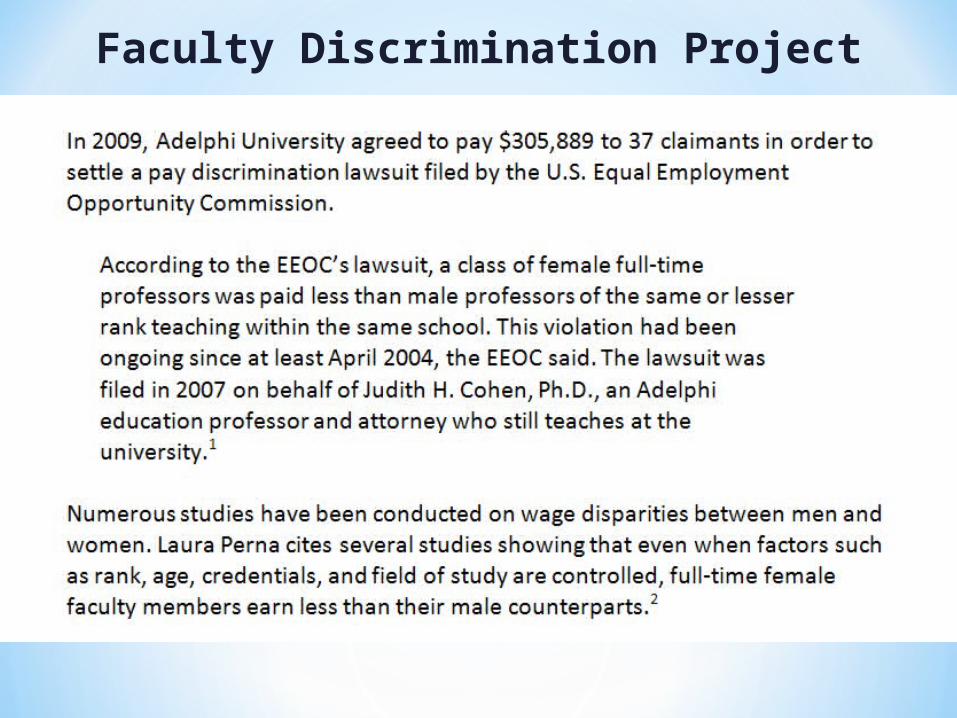
•Example:• In 2009, Adelphi University paid $309,889 to 37 claimants
in order to settle a pay discrimination lawsuit.
• Your dean saw this report and has asked you evaluate salaries on your campus.
• A data set is provided (but bonus points for collecting your own).
• Analyze the data and write a 3 page report to your dean
Faculty Discrimination Project
Faculty Discrimination Project
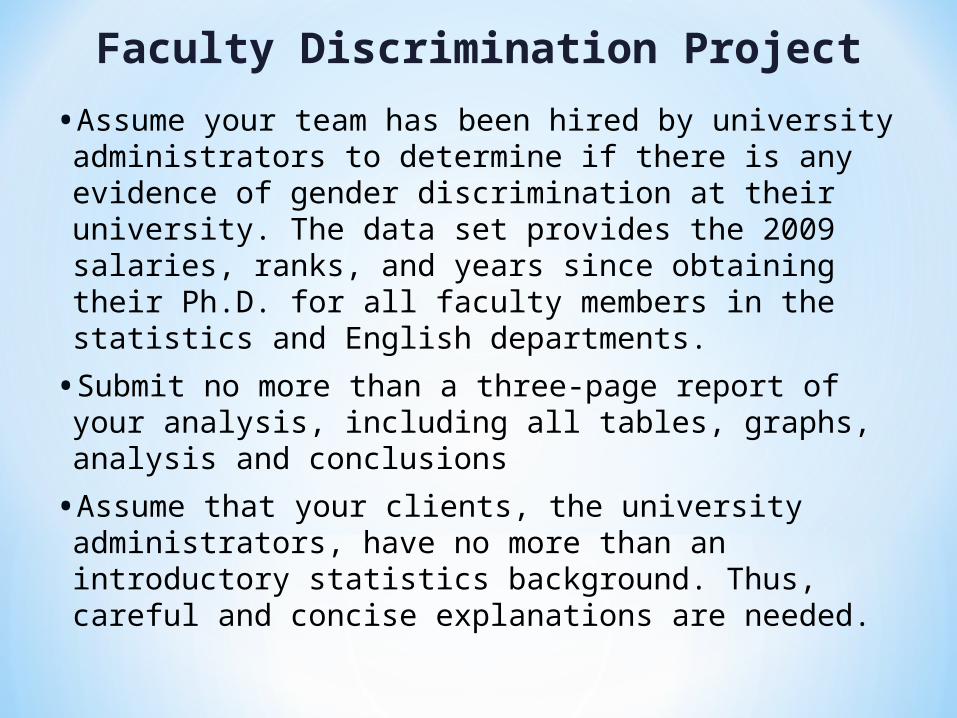
•Assume your team has been hired by university administrators to determine if there is any evidence of gender discrimination at their university. The data set provides the 2009 salaries, ranks, and years since obtaining their Ph.D. for all faculty members in the statistics and English departments.
•Submit no more than a three-page report of your analysis, including all tables, graphs, analysis and conclusions
•Assume that your clients, the university administrators, have no more than an introductory statistics background. Thus, careful and concise explanations are needed.
Faculty Discrimination Project
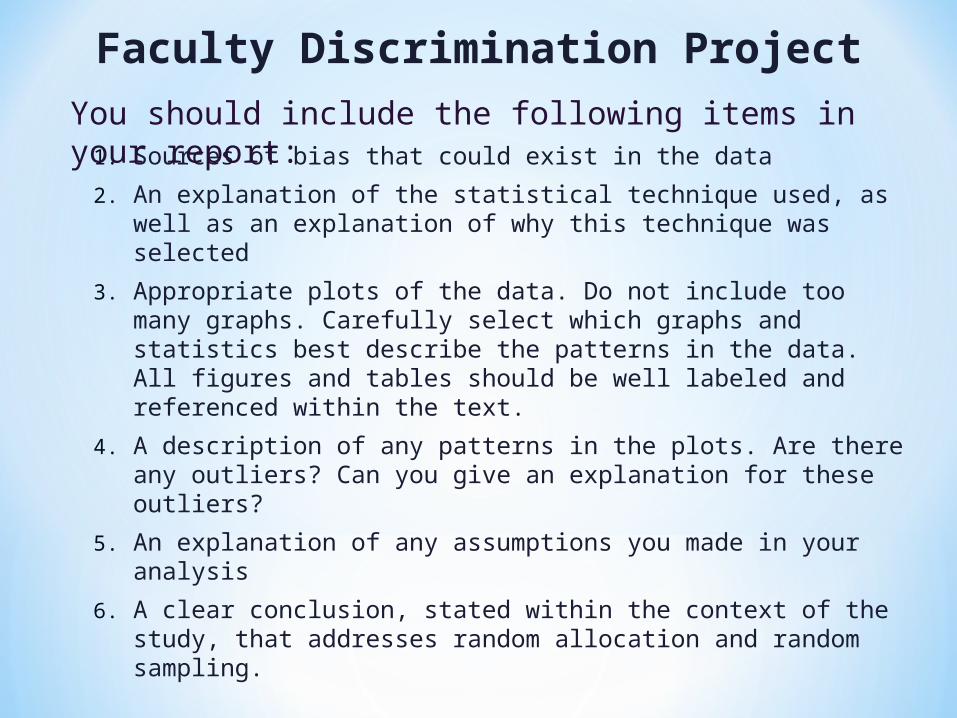
1. Sources of bias that could exist in the data
2. An explanation of the statistical technique used, as well as an explanation of why this technique was selected
3. Appropriate plots of the data. Do not include too many graphs. Carefully select which graphs and statistics best describe the patterns in the data. All figures and tables should be well labeled and referenced within the text.
4. A description of any patterns in the plots. Are there any outliers? Can you give an explanation for these outliers?
5. An explanation of any assumptions you made in your analysis
6. A clear conclusion, stated within the context of the study, that addresses random allocation and random sampling.
You should include the following items in your report:
Multistage Review Process
•Write report:
•Submit 1st draft in class for peer review
•Revise report
•Submit final report, peer comments, and data
Writing about Graphs and Figures*
•Use linked language: Use language that combines statistical terms (e.g., mean, correlation, skewed-right) with your subject matter. Remember, the data are about something, they are not mere numbers.
•Put figures near words: No one likes to have to hunt for a figure. This kind of distancing suggests to the reader that the figure is window dressing. Include and refer to a figure only if it helps make your point.
•Use captions and number figures consecutively: Good captioning is a great help to a reader. Good figures have a stand-alone quality about them.
*These five items were originally provided within a handout from Tom Moore
Writing about Graphs and Figures
•Use tables to summarize: It is a common mistake to assume that numerical comparisons can be consumed from written prose. Such comparisons can be simplified for the reader if accompanied by simple summary tables. Use rounded numbers in the table to just enough digits to make meaningful comparisons without losing much information.
•Attend to axes: Label axes with clear variable names and, if appropriate, units. Make the scales clear, uncluttered, and the appropriate size. When the goal is to compare graphs, make sure the graphs have common scales.
Faculty Discrimination Project
• Is your language appropriate for your audience? (abbreviations, acronyms, or jargon)
•Did you clearly state your main findings? (not simply describing data)
•Did you distinguish between opinions and the data? (“we are confident that there is no discrimination”)
•What assumptions did you make and how did in influence your results? This must be at the appropriate level of detail. (how much space should be given to address assumptions)
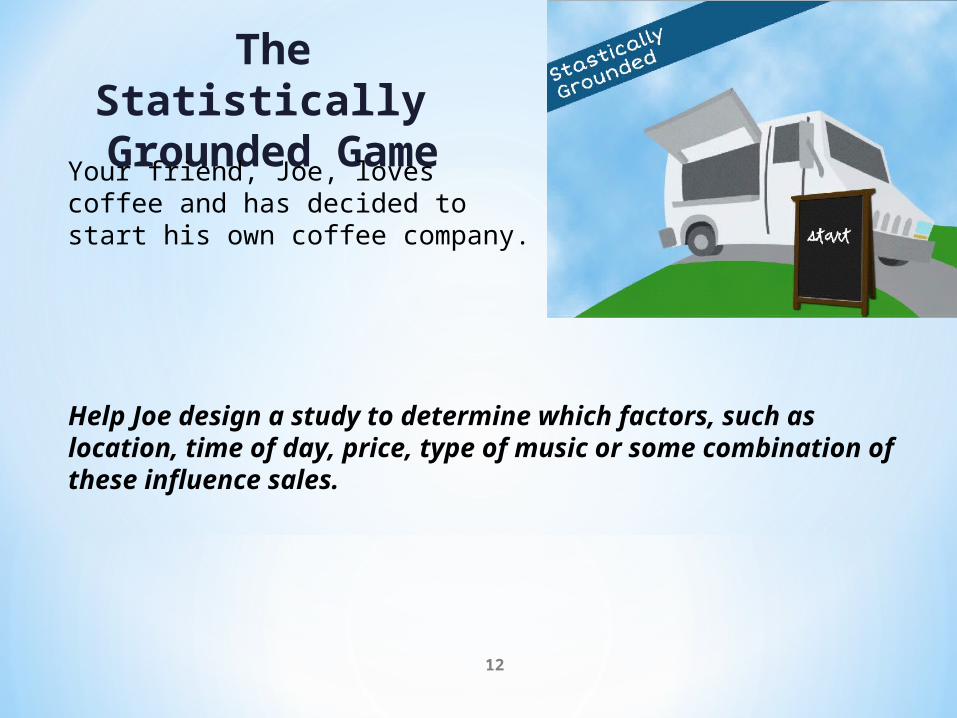
The Statistically
Grounded Game
12
Your friend, Joe, loves coffee and has decided to start his own coffee company.
Help Joe design a study to determine which factors, such as location, time of day, price, type of music or some combination of these influence sales.
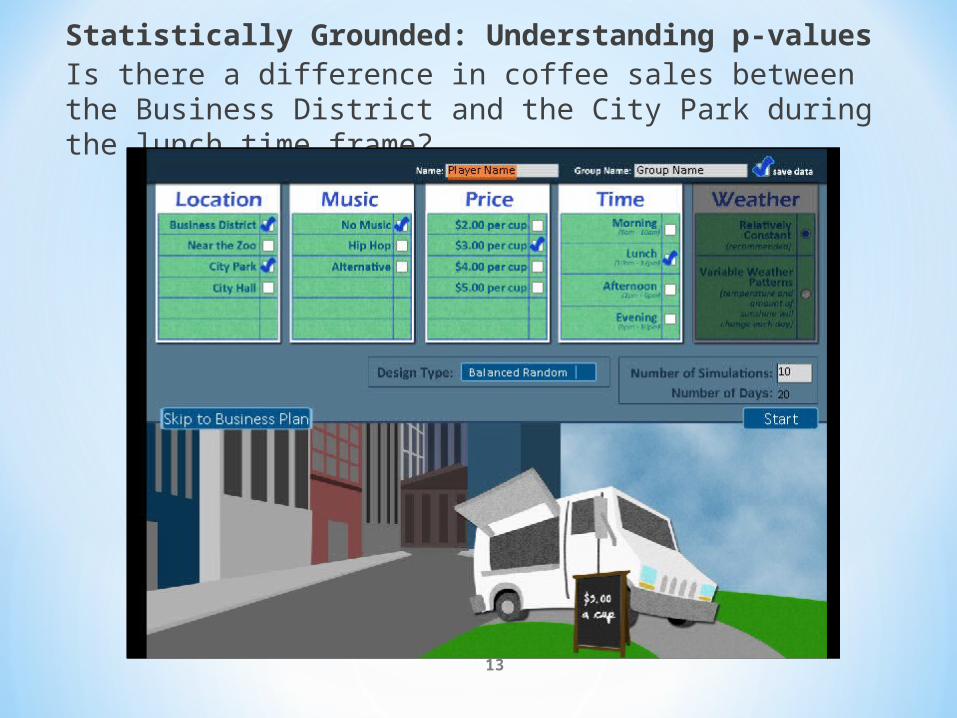
Statistically Grounded: Understanding p-valuesIs there a difference in coffee sales between the Business District and the City Park during the lunch time frame?
13
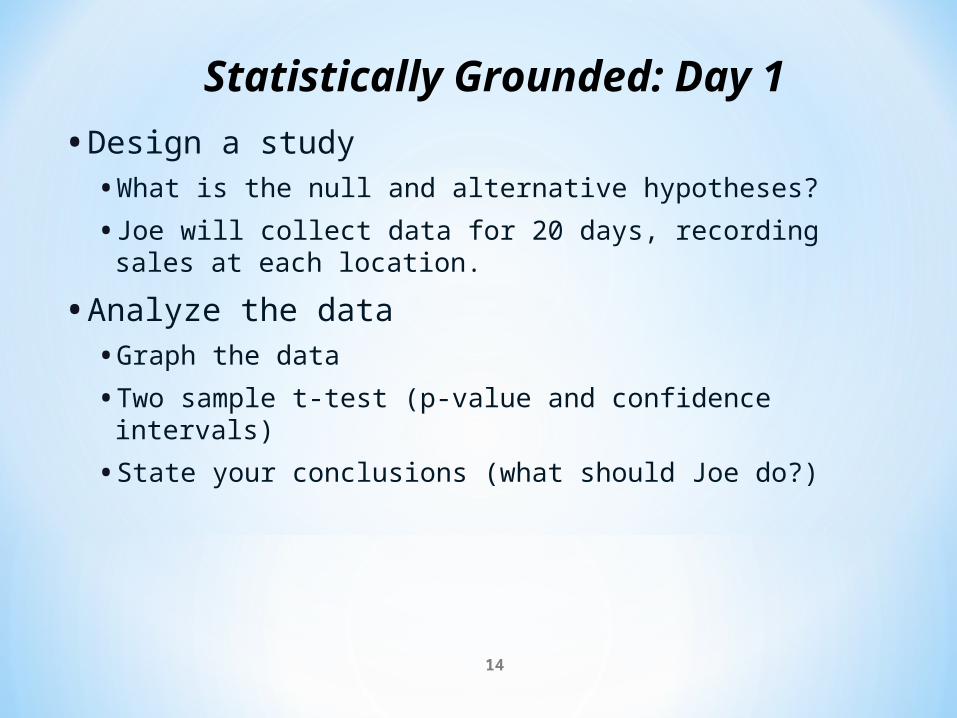
•Design a study•What is the null and alternative hypotheses?
• Joe will collect data for 20 days, recording sales at each location.
•Analyze the data • Graph the data
• Two sample t-test (p-value and confidence intervals)
• State your conclusions (what should Joe do?)
14
Statistically Grounded: Day 1
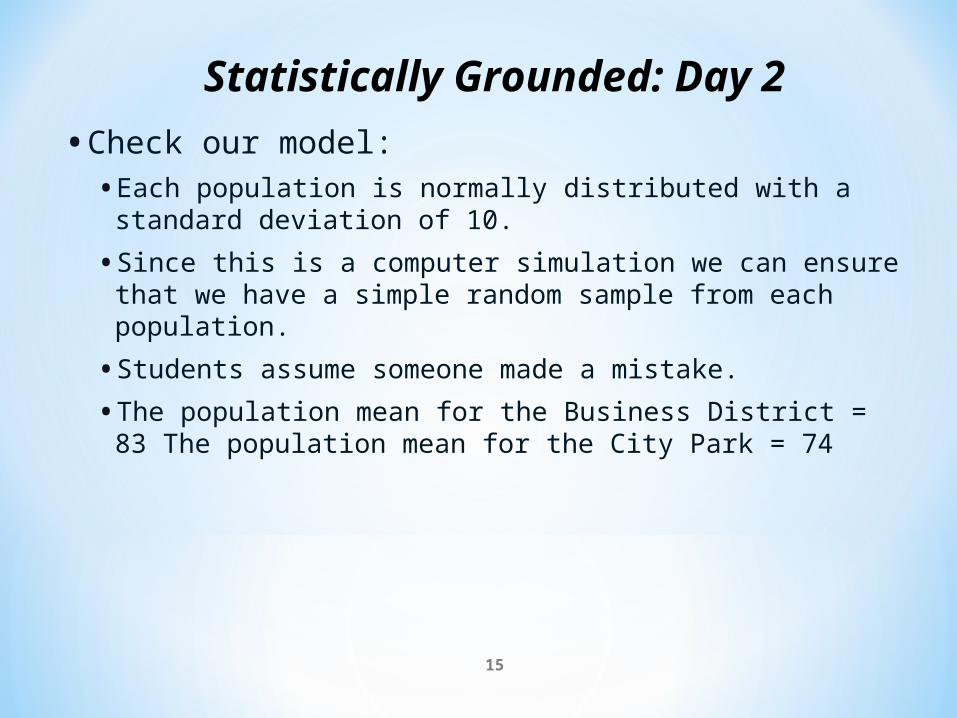
•Check our model:• Each population is normally distributed with a standard
deviation of 10.
• Since this is a computer simulation we can ensure that we have a simple random sample from each population.
• Students assume someone made a mistake.
• The population mean for the Business District = 83 The population mean for the City Park = 74
15
Statistically Grounded: Day 2
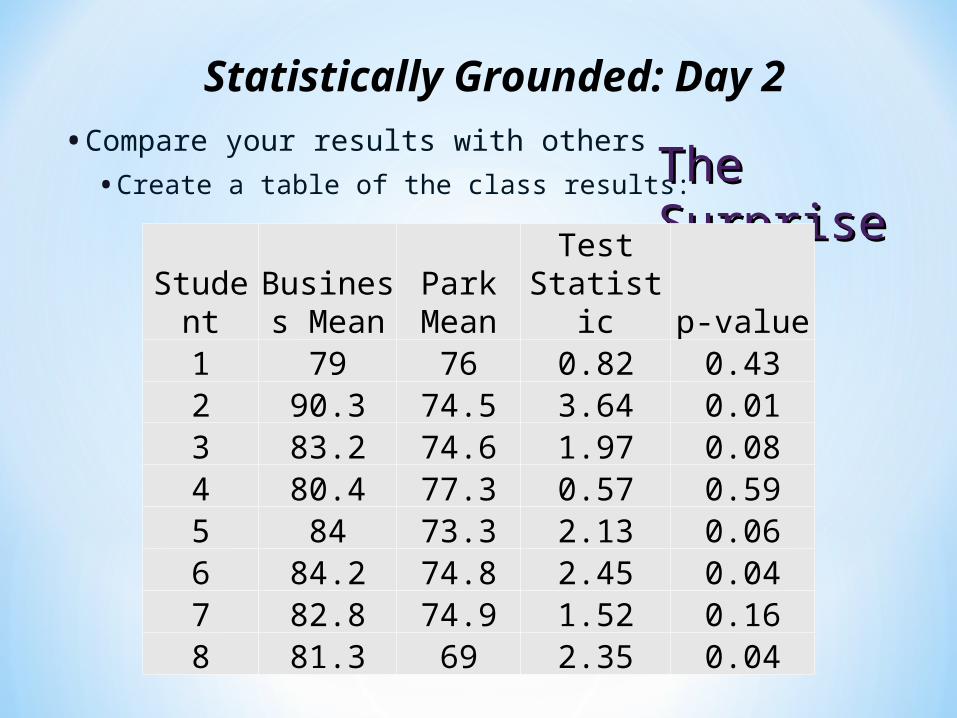
•Compare your results with others
• Create a table of the class results:
16
Statistically Grounded: Day 2
The The Surprise !Surprise !
Student
Business Mean
Park Mean
Test Statistic p-value
1 79 76 0.82 0.432 90.3 74.5 3.64 0.013 83.2 74.6 1.97 0.084 80.4 77.3 0.57 0.595 84 73.3 2.13 0.066 84.2 74.8 2.45 0.047 82.8 74.9 1.52 0.168 81.3 69 2.35 0.04
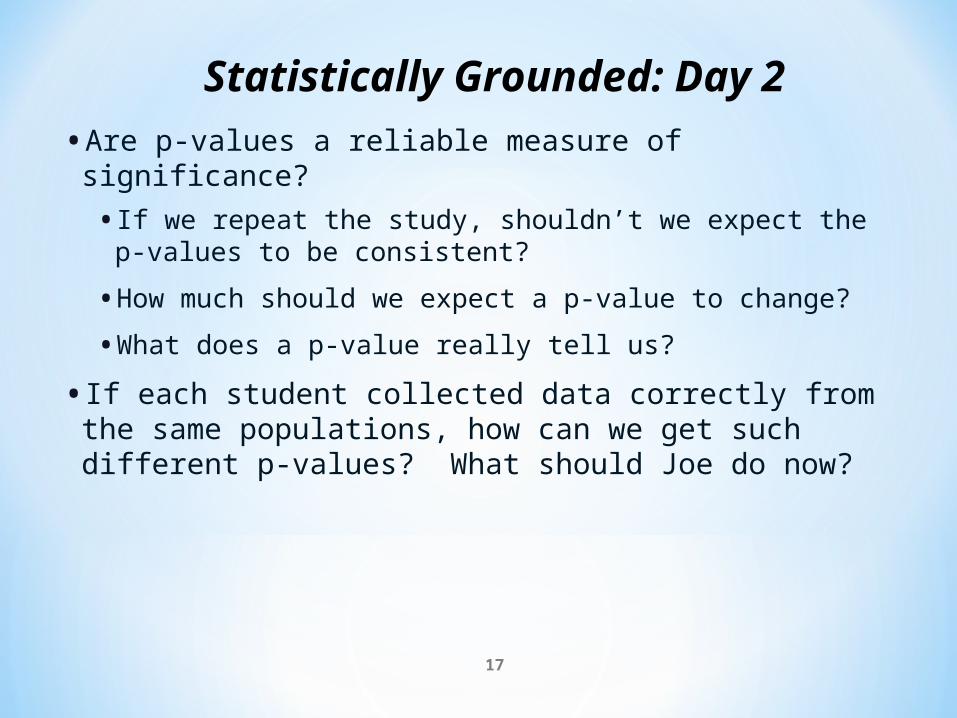
•Are p-values a reliable measure of significance?
• If we repeat the study, shouldn’t we expect the p-values to be consistent?
• How much should we expect a p-value to change?
•What does a p-value really tell us?
• If each student collected data correctly from the same populations, how can we get such different p-values? What should Joe do now?
17
Statistically Grounded: Day 2
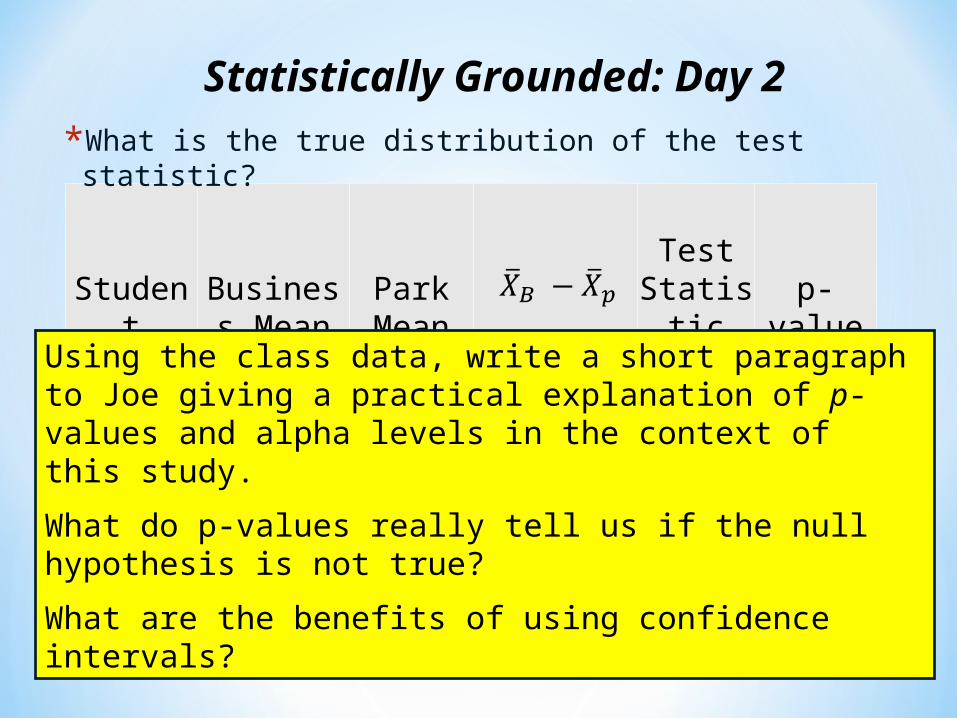
StudentBusiness
MeanPark Mean
Test Statisti
c p-value1 79 76 3 0.82 0.432 90.3 74.5 15.8 3.64 0.013 83.2 74.6 8.6 1.97 0.084 80.4 77.3 3.1 0.57 0.595 84 73.3 10.7 2.13 0.066 84.2 74.8 9.4 2.45 0.047 82.8 74.9 7.9 1.52 0.168 81.3 69 12.3 2.35 0.04
*What is the true distribution of the test statistic?
18
Statistically Grounded: Day 2
Using the class data, write a short paragraph to Joe giving a practical explanation of p‐values and alpha levels in the context of this study.
What do p-values really tell us if the null hypothesis is not true?
What are the benefits of using confidence intervals?
Benefits of Writing Projects
•Active learning in a real context fosters a sense of engagement and encourages students to go deeper
•Clear links between learning and goals provide an intrinsic motivation to ask more questions
•A classroom environment where groups of students are conducting unique (but related) research projects creates an atmosphere where students are eager to share their work.
•Students want to compare their results and discuss how slight modifications in their data collection or model assumptions can impact the results.
•Students share tips, experiences, and knowledge which can be similar to peer-to-peer teaching.
Suggested References
•Article from Chance by Jane Miller "How to Communicate Statistical Findings: an Expository Writing Approach” http://www.statlit.org/Miller.htm
•Damned Lies and Statistics: Untangling Numbers from the Media, Politicians, and Activists by Joel Best http://www.statlit.org/Miller.htm
•Making Data Meaningful http://www.unece.org/stats/documents/writing• A guide to writing stories about numbers
• A guide to presenting statistics
• A guide to communicating with the media
• A guide to improving statistical literacy


