Page 1
l Global Research l
Important disclosures can be found in the Disclosures Appendix
All rights reserved. Standard Chartered Bank 2017 https://research.sc.com
Kelvin Lau +852 3983 8565
[email protected]
Senior Economist, Greater China
Standard Chartered Bank (HK) Limited
Chidu Narayanan +65 6596 7004
[email protected]
Economist, Asia
Standard Chartered Bank, Singapore Branch
Tony Phoo +886 2 6603 2640
[email protected]
Senior Economist, NEA
Standard Chartered Bank (Taiwan) Limited
Edward Lee +65 6596 8252
[email protected]
Head, ASEAN Economic Research
Standard Chartered Bank, Singapore Branch
Aldian Taloputra +62 21 2555 0596
[email protected]
Senior Economist, Indonesia
Standard Chartered Bank, Indonesia Branch
Special Report
Shop Talk – China, ASEAN and the future
Highlights
Rising wages remain a key challenge in China, according to our
eighth annual survey of more than 200 manufacturers in the Pearl
River Delta (PRD) region. Our respondents expect wages to rise by
7.2% on average in 2017. The business outlook is more positive in
2017 than in 2016 – 42% expect orders to increase, and margins are
expected to drop only 0.1% on average, versus a 6.1% drop in 2016.
High-end manufacturers are focusing on productivity gains through
investment, while low-end manufacturers prefer to relocate
operations to counter rising local wages. More respondents said
they would prefer to relocate overseas versus moving inland, for the
first time in our annual survey.
ASEAN remains the preferred destination for manufacturers looking
to relocate. FDI from Northeast Asia in ASEAN is increasing. In
particular, Taiwanese producers based in the PRD expect a growing
contribution from ASEAN to their production output over the next
one to two years.
The Big Bay Area regional development plan seeks to integrate
Guangzhou, Shenzhen and Zhuhai with neighbouring Hong Kong
and Macau by generating synergies that are expected to drive
China’s economy in the medium term.
Page 2
Special Report: Shop Talk – China, ASEAN and the future
14 June 2017 2
Contents
China – Moving up the value chain 3
Infographic 5
PRD – The present and future 7
PRD survey – Feeling the economic pulse 8
What doesn’t kill you makes you stronger 8
Labour and wages 9
Gauging other challenges beyond wages 13
Factory relocation is a growing option 17
Investment is the key to solving the PRD’s problems 20
How different Asian manufacturers stack up 22
A deeper dive into manufacturers’ preferences 23
Divergent preferences due to structural dissimilarities 23
Wage growth, 2016 actual versus 2017 expectations 28
Big Bay Area – Creating a PRD city cluster 30
Big Bay Area – Creating a PRD city cluster 31
From assembling goods to assembling economies 31
ASEAN – Rising interest from Northeast Asia 34
ASEAN – Rising interest from Northeast Asia 35
Taiwan investors are upbeat on ASEAN 41
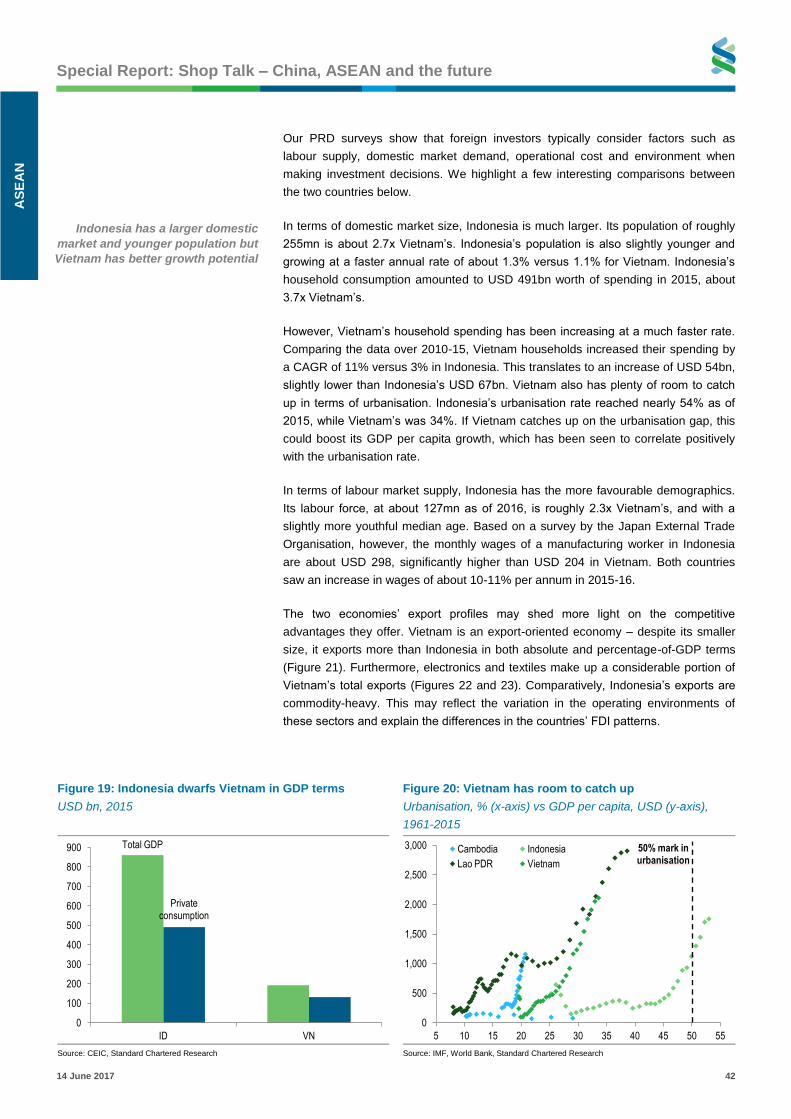
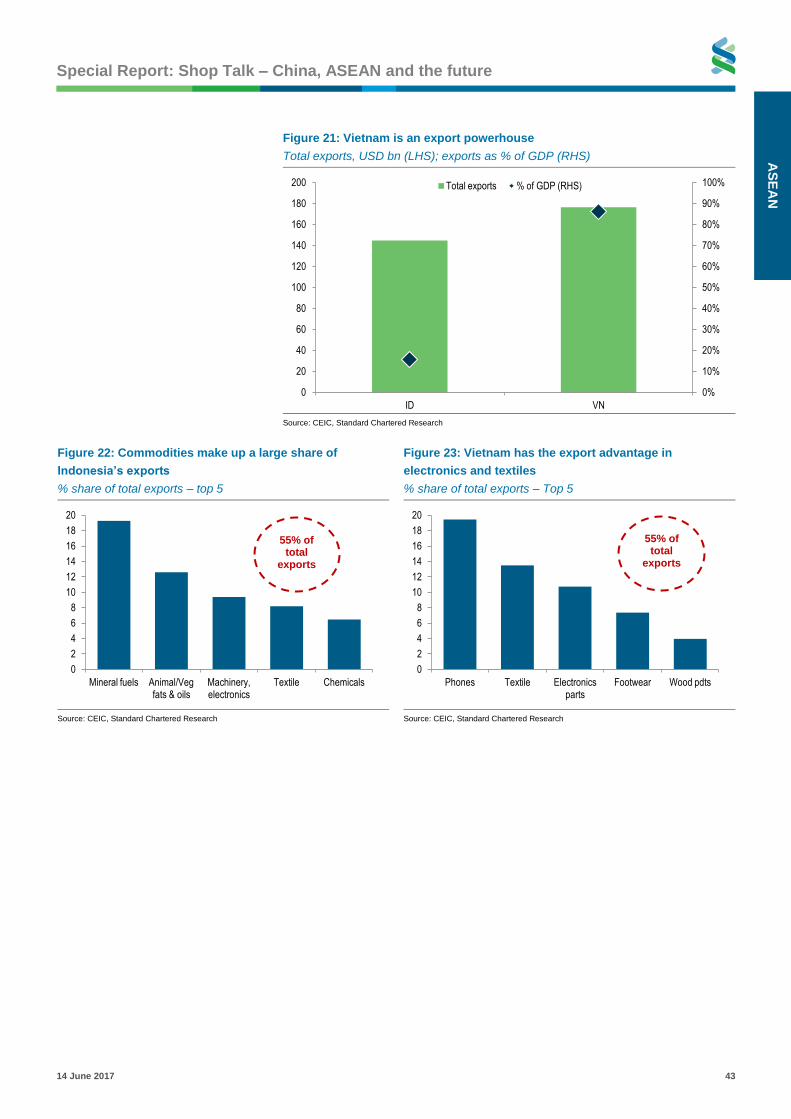
Spoilt for choice – Indonesia or Vietnam? 41
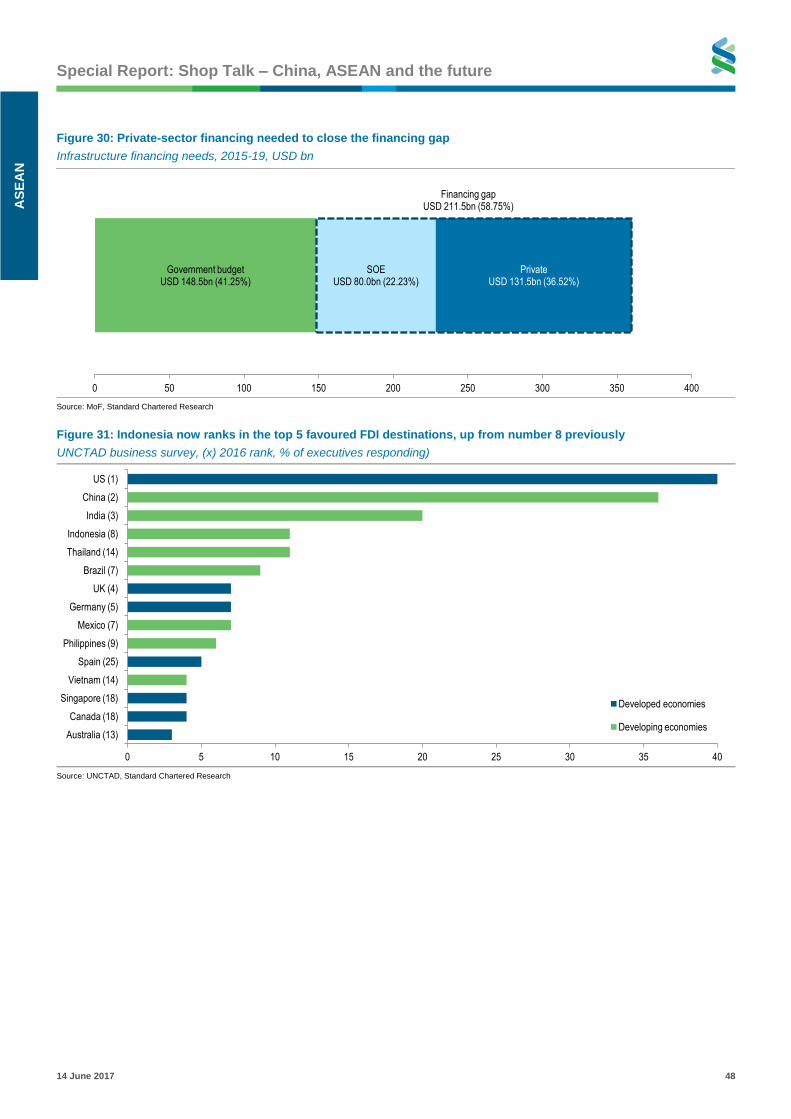
Indonesia – Searching for a new growth engine 44
Global Research Team 49
Page 3
Special Report: Shop Talk – China, ASEAN and the future
14 June 2017 3
Overv
iew
China – Moving up the value chain Our annual survey of Pearl River Delta (PRD) manufacturers enters its eighth year in
2017. With over 200 responses, the survey provides unique insights into China’s
manufacturing landscape and its transformation over the years. We believe our
survey is no longer complete without including ASEAN as an important constituent.
ASEAN continues to gain from the PRD’s transformation and challenges, and the
region has received increasing amounts of foreign direct investment (FDI) from
Northeast Asia.
Rising wages remain a key challenge for PRD manufacturers, albeit less so than in
previous years.
Our respondents expect wages to rise by 7.2% on average in 2017, easing steadily
from 7.7% in 2016 and 7.8% in 2015 (expectations based on our survey).
However, almost half expect hikes of 10% or more, up from a third last year. We
believe this is because the actual wage increase of 5.9% in 2016 undershot
initial expectations, increasing pressure to raise wages this year.
Despite persistent cost pressure, the business outlook for manufacturers appears to
be improving. Respondents expect margins to drop only 0.1% on average this year,
versus a 6.1% drop in 2016. Our respondents also expect orders to improve by 1.6%
on average over the next six months, significantly better than the 7.6% decline
expected last year.
This is likely driven more by the improving outlook for key overseas markets than by
upbeat prospects for China. 42% of respondents hold a largely positive view on
ASEAN economies, and they are more positive on the US but more neutral towards
China. This mirrors our own expectations for China – we believe GDP growth peaked
at 6.9% y/y in Q1-2017 and we expect slower growth for the rest of 2017, averaging
6.6% for the full year. We also believe that monetary tightness will persist as long as
growth remains above 6.5% and deleveraging does not cause systemic risks.
Figure 1: High-end manufacturers prefer to boost investment while low-end manufacturers opt to move operations, in
order to tackle labour challenges
Industry Preferred response to labour shortage
Estimated wage rise (%)
Wages as a share of total costs (%)
Expected change in orders over next
6 months (%)
Expected change in margins in (%)
2016 2017 2016 2017 2016 2017 2016 2017
2016 vs 2015
2017 vs 2016
Semiconductor manufacturing equipment
Automation/ Move out of
China
Automation/ More capex
6.0 8.8 20.8 19.7 -10.8 1.6 -7.9 1.9
Semiconductor fabrication
More capex/ Automation
More capex/ Move higher up
value chain 9.2 10.3 21.7 19.0 -11.0 -1.3 -7.2 -7.1
Electronics packaging assembly
More capex/ Move inland
Automation/ More capex
7.6 7.1 24.2 26.1 -9.8 2.4 -8.9 1.2
Component manufacturing
Automation/ More capex/ Move inland
Automation/ Move out of
China 9.4 7.1 22.7 21.6 -7.6 3.0 -5.5 -2.7
Non-electronics manufacturing
Automation/ Move out of
China
Automation/ Move out of
China 6.4 6.6 21.9 19.7 -4.0 2.6 -4.0 1.5
All manufacturers
7.7 7.2 22.5 21.5 -7.6 1.6 -6.1 -0.1
Note: Red is high, green is low and yellow is moderate; Source: Standard Chartered Research
The PRD offers us unique insights into China’s cyclical slowdown and
structural transformation
The outlook for business growth and profitability appears to be
improving
Page 4
Special Report: Shop Talk – China, ASEAN and the future
14 June 2017 4
Overv
iew
Clients involved in semiconductor fabrication expect the highest wage increases this
year among the sectors we surveyed. They are also best placed to absorb these
wage increases given their corresponding productivity gains: over 85% said their per-
worker output rose faster than wages in 2016. Higher-end manufacturers also favour
capex as a way to address labour challenges. In contrast, component manufacturers
and non-electronics manufacturers prefer to move out of China, heavily favouring
ASEAN as an alternative production destination.
Manufacturers increasingly prefer to relocate production facilities outside of China
rather than move further inland (a popular option in past years). This likely reflects
the rapid rise in wages even in inland China cities. ASEAN has been the top choice
for overseas relocation since we started our PRD survey. This trend still appears to
be intact.
Rising costs in China continue to benefit ASEAN as manufacturers look for
alternative production sites. In addition to cost-induced pressure, client requests to
diversify production centres are also prompting PRD manufacturers to move to
ASEAN. The Mekong region – specifically Vietnam and Cambodia and increasingly
Myanmar – remains the preferred destination. This year, Cambodia took over the top
spot from Vietnam.
ASEAN’s growing domestic market is another pull factor for FDI; this is in line with
our positive long-term view on the region. Sustained FDI, favourable demographics,
regional stability, governments’ focus on growth policies and urbanisation are likely to
boost the region’s purchasing power. In addition to the manufacturing sector, the
financial sector in ASEAN is attracting FDI, likely as banks follow their clients (such
as manufacturers relocating to ASEAN) into the region.
Northeast Asia is the region’s manufacturing powerhouse. The recent shift in
manufacturing investment away from China has resulted in increased FDI flows from
Northeast Asia into ASEAN. The latest data indicates that investment from Northeast
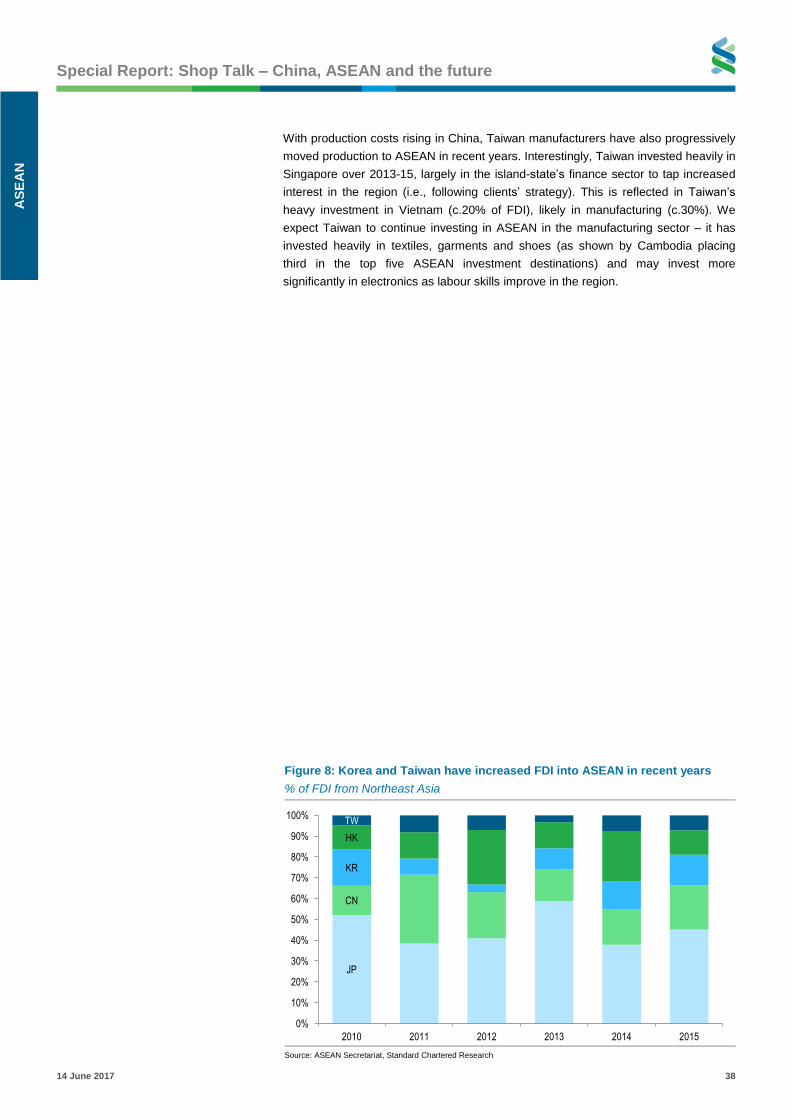
Asia accounts for 32% of total FDI into ASEAN, up from 23% in 2010. Japan remains
the largest investor in ASEAN, but South Korea, Taiwan and China are steadily
increasing their shares. Vietnam in particular is attracting growing manufacturing FDI
from Korea and Taiwan. We also expect increasing construction investment in
ASEAN from China as China’s ‘Belt and Road’ infrastructure projects progress.
ASEAN’s growing domestic markets
are a key pull factor for FDI
ASEAN remains the favoured
destination for relocating
production outside China
Page 5
Special Report: Shop Talk – China, ASEAN and the future
14 June 2017 5
Info
gra
ph
ics
Infographic Figure 1: Wage growth, 2016 actual vs 2017 expectations
% of respondents; blue shading indicates faster expected wage growth this year versus 2016
2017
Down No change Up 5% Up 10% Up 15% Up 20%
2016
Down 0.9% 0.0% 0.0% 0.0% 0.5% 0.5%
No change 1.4% 7.1% 5.7% 3.8% 0.5% 0.5%
Up 5% 0.5% 5.7% 27.8% 10.4% 1.9% 0.0%
Up 10% 0.0% 0.5% 2.4% 17.9% 4.2% 0.9%
Up 15% 0.0% 0.0% 0.0% 1.9% 0.9% 1.4%
Up 20% 0.0% 0.5% 0.0% 0.0% 0.9% 1.4%
Total 2.8% 13.8% 35.9% 34.0% 8.9% 4.7%
Source: Standard Chartered Research
Figure 2: Margin change, 2016 actual vs 2017 estimate
% of respondents; blue shading indicates those expecting better margin changes this year than last year
2017
Down 30% Down 20% Down 10% No change Up 10% Up 20% Up 30%
2016
Down 30% 1.0% 1.4% 1.0% 0.5% 0.0% 0.0% 0.5%
Down 20% 1.4% 2.4% 1.9% 0.5% 1.0% 0.0% 0.0%
Down 10% 0.0% 2.4% 13.5% 4.8% 2.9% 1.0% 0.0%
No change 0.0% 0.0% 3.9% 24.2% 6.3% 0.5% 0.0%
Up 10% 0.0% 0.0% 1.4% 5.3% 16.9% 0.0% 0.0%
Up 20% 0.0% 0.0% 0.0% 0.0% 1.9% 1.4% 0.0%
Up 30% 0.0% 0.0% 0.0% 0.5% 0.0% 0.0% 1.4%
Source: Standard Chartered Research
Figure 3: 2017 outlook for EU/US/ASEAN/China
% of respondents
Figure 4: What is your biggest concern for 2017?
% of respondents
Source: Standard Chartered Research Source: Standard Chartered Research
0% 20% 40% 60% 80% 100%
China
ASEAN
US
Europe
Positive Moderately positive Neutral Moderately negative Negative
0% 5% 10% 15% 20% 25% 30% 35% 40%
Others
Brexit fallout from triggering of Article 50
Rise in geopolitical tensions
Surprise European election outcomes
China supply-side challenges
China demand slowdown
Further Renminbi volatility/ accelerated capital outflow
US-China trade war/ Trump-related shocks
Page 6
Special Report: Shop Talk – China, ASEAN and the future
14 June 2017 6
Info
gra
ph
ics
Figure 5: Component manufacturing
2017
2016
Down 10% Down 5% No change Up 5% Up by 10% Up by 15% Up by 20%
Down 10% 0.0% 0.0% 0.0% 0.0% 0.0% 0.0% 3.1%
Down 5% 0.0% 0.0% 0.0% 0.0% 0.0% 0.0% 0.0%
No change 0.0% 6.3% 12.5% 9.4% 0.0% 0.0% 0.0%
Up 5% 0.0% 3.1% 0.0% 12.5% 15.6% 0.0% 0.0%
Up 10% 0.0% 0.0% 3.1% 3.1% 15.6% 6.3% 3.1%
Up 15% 0.0% 0.0% 0.0% 0.0% 0.0% 0.0% 6.3%
Up 20% 0.0% 0.0% 0.0% 0.0% 0.0% 0.0% 0.0%
Source: Standard Chartered Research
Figure 6: Electronics packaging assembly
2017
2016
Down 10% Down 5% No change Up 5% Up by 10% Up by 15% Up by 20%
Down 10% 1.9% 1.9% 0.0% 0.0% 0.0% 0.0% 0.0%
Down 5% 0.0% 0.0% 0.0% 0.0% 0.0% 0.0% 0.0%
No change 0.0% 0.0% 9.6% 9.6% 5.8% 1.9% 1.9%
Up 5% 0.0% 0.0% 5.8% 26.9% 3.8% 3.8% 0.0%
Up 10% 0.0% 0.0% 0.0% 0.0% 15.4% 3.8% 1.9%
Up 15% 0.0% 0.0% 0.0% 0.0% 1.9% 1.9% 0.0%
Up 20% 0.0% 0.0% 0.0% 0.0% 0.0% 0.0% 1.9%
Source: Standard Chartered Research
Figure 7: Semiconductor fabrication
2017
2016
Down 10% Down 5% No change Up 5% Up by 10% Up by 15% Up by 20%
Down 10% 0.0% 0.0% 0.0% 0.0% 0.0% 0.0% 0.0%
Down 5% 0.0% 0.0% 0.0% 0.0% 0.0% 6.7% 0.0%
No change 0.0% 0.0% 6.7% 0.0% 0.0% 0.0% 0.0%
Up 5% 0.0% 0.0% 0.0% 13.3% 13.3% 0.0% 0.0%
Up 10% 0.0% 0.0% 0.0% 0.0% 33.3% 6.7% 0.0%
Up 15% 0.0% 0.0% 0.0% 0.0% 6.7% 0.0% 0.0%
Up 20% 0.0% 0.0% 0.0% 0.0% 0.0% 6.7% 6.7%
Source: Standard Chartered Research
Figure 8: Semiconductor manufacturing equipment
2017
2016
Down 10% Down 5% No change Up 5% Up by 10% Up by 15% Up by 20%
Down 10% 0.0% 0.0% 0.0% 0.0% 0.0% 0.0% 0.0%
Down 5% 0.0% 0.0% 0.0% 0.0% 0.0% 0.0% 0.0%
No change 0.0% 0.0% 6.3% 6.3% 6.3% 0.0% 0.0%
Up 5% 0.0% 0.0% 0.0% 25.0% 6.3% 0.0% 0.0%
Up 10% 0.0% 0.0% 0.0% 0.0% 18.8% 12.5% 0.0%
Up 15% 0.0% 0.0% 0.0% 0.0% 0.0% 0.0% 0.0%
Up 20% 0.0% 0.0% 0.0% 0.0% 0.0% 6.3% 6.3%
Source: Standard Chartered Research
Figure 9: Non-electronics
2017
2016
Down 10% Down 5% No change Up 5% Up by 10% Up by 15% Up by 20%
Down 10% 0.0% 0.0% 0.0% 0.0% 0.0% 0.0% 0.0%
Down 5% 0.0% 0.0% 0.0% 0.0% 0.0% 0.0% 0.0%
No change 0.5% 2.1% 1.5% 2.1% 0.0% 0.0% 6.2%
Up 5% 0.0% 4.6% 18.0% 6.2% 1.0% 0.0% 29.9%
Up 10% 0.0% 0.0% 2.1% 8.8% 1.0% 0.0% 11.9%
Up 15% 0.0% 0.0% 0.0% 1.0% 0.5% 0.5% 2.1%
Up 20% 0.0% 0.0% 0.0% 0.0% 0.0% 0.0% 0.0%
Source: Standard Chartered Research
Page 7
PRD – The present and future Kelvin Lau +852 3983 8565
[email protected]
Senior Economist, Greater China
Standard Chartered Bank (HK) Limited
Chidu Narayanan +65 6596 7004
[email protected]
Economist, Asia
Standard Chartered Bank, Singapore Branch
Page 8
Special Report: Shop Talk – China, ASEAN and the future
14 June 2017 8
PR
D, p
res
en
t an
d f
utu
re
PRD survey – Feeling the economic pulse
What doesn’t kill you makes you stronger
We conducted our eighth annual client survey of China’s Pearl River Delta (PRD)
manufacturers over February-March 2017, with over 200 responses. The firms are
mostly headquartered in Hong Kong, Taiwan or mainland China with manufacturing
operations in the PRD. Our survey clients are likely among the more successful firms
in the region, having survived years of labour shortage and wage inflation, and they
probably emerged stronger from last year’s economic slowdown. Their strong profile
may skew the results slightly, and the outlook could be bleaker than our sample
suggests. Nevertheless, since our clients have largely successfully faced down
challenges in the past, their responses give us a useful glimpse into how the
manufacturing industry, and therefore China, is transforming.
There are four parts to our survey findings; we list the key takeaways below:
Labour and wages: Average wage growth of 5.9% in 2016 materially undershot our
respondents’ initial expectations, acting as a shock absorber amid the economic
slowdown last year. They see a modest rebound in nominal wage growth this year, in
line with China’s stabilising economy. Compared with wages, the perception of a
labour shortage appears to be much more inelastic, likely more influenced by
structural supply constraints than by cyclical demand swings. We believe the more
diverse workforce utilisation rates reflect the ‘winners’ standing apart from the ‘losers’
as nimbler firms get leaner and more competitive in challenging times, gaining
market share at the expense of their competition.
Non-wage challenges: Our clients see margins stabilising and orders recovering.
Borrowing money has become more difficult, and we see this continuing in 2017
amid tighter financial conditions. Many see a weaker Renminbi as positive for their
business but are wary of higher Renminbi volatility. A potential US-China trade war
tops the list of concerns in 2017, with 60% of respondents seeing a medium or high
impact from this event.
Moving capacity elsewhere: The share of firms looking to move capacity overseas
continued to rise and, for the first time, overtook firms looking to move inland.
Cambodia and Vietnam remain the top destinations, and ‘better labour supply’ is still
the top cited reason. Many clients are still considering moving or are in the early
stages of relocation. A still-large wage gap with China, fewer infrastructure
bottlenecks and strong economic fundamentals should help drive more ASEAN-
bound investment over time.
Investing in the future: 68% of respondents plan to increase capex spending this
year. Investing in automation and robotics not only explains and absorbs high wages,
but can give the economy a much-needed productivity boost, in our view. All this
echoes how the labour shortage and other challenges can be positive for an
economy if they force the right behavioural changes at the micro level. We believe
that what doesn’t kill the PRD, and instead pushes the region’s manufacturers to
upgrade and reinvent themselves, will make China stronger.
Knowing how corporates upgrade
and reinvent themselves helps us
understand China’s transformation
Page 9
Special Report: Shop Talk – China, ASEAN and the future
14 June 2017 9
PR
D, p
res
en
t an
d fu
ture
Labour and wages
Multi-year downtrend to cap wage growth rebound in 2017
Our respondents expect to raise wages by 7.2% on average in 2017. Almost half
(47%) expect hikes of 10% or more this year, up from 34% last year, as respondents
shift up the brackets (Figure 2). This represents an acceleration from last year’s
actual hike of 5.9%, which significantly undershot (more so than prior years) initial
expectations of 7.7% based on last year’s survey (Figure 3); we believe this reflected
slower economic growth in 2016.
On a same-company basis, just over 30% of respondents plan to raise wages more
than they did last year, up from 22% in 2016 and 26% in 2015; those who expect to
raise them less than last year fell below 14% from 18% prior (Figure 2). A significant
number of respondents swung from expecting no hikes in 2016 to expecting a hike of
10% or more in 2017 – these could be catch-up moves after manufacturers held off
wage hikes in 2016 due to tough business conditions.
While China’s economy is off to a much better start this year, 6.9% y/y GDP growth in
Q1 was likely the peak of the cycle (we forecast GDP growth of 6.6% in 2017); more
importantly, our latest findings continue to show wage expectations on a multi-year
downtrend. Chances are that 2017 actual wage growth will be closer to the 6.0-6.5%
Figure 1: Is the labour shortage better or worse than
before?
% of respondents
Figure 2: Wage growth, 2016 actual vs 2017 expectations
% of respondents; blue shading indicates faster expected
wage growth this year versus 2016
2017
Down No
change Up 5% Up 10% Up 15% Up 20%
2016
Down 0.9% 0.0% 0.0% 0.0% 0.5% 0.5%
No change
1.4% 7.1% 5.7% 3.8% 0.5% 0.5%
Up 5% 0.5% 5.7% 27.8% 10.4% 1.9% 0.0%
Up 10% 0.0% 0.5% 2.4% 17.9% 4.2% 0.9%
Up 15% 0.0% 0.0% 0.0% 1.9% 0.9% 1.4%
Up 20% 0.0% 0.5% 0.0% 0.0% 0.9% 1.4%
Total 2.8% 13.8% 35.9% 34.0% 8.9% 4.7%
Source: Standard Chartered Research Source: Standard Chartered Research
Figure 3: Wages set to rise 7.2% in 2017 vs 5.9% in 2016
Actual and expected wage increase, % of respondents
Figure 4: Falling short of expectations, 2016 in particular
Surveyed wage increase, expectation vs. actual
Source: Standard Chartered Research Source: Standard Chartered Research
2015
2016
2017
0% 10% 20% 30% 40% 50% 60% 70%
Less difficult
Same
More difficult
2016 2017
0% 10% 20% 30% 40% 50%
Down 10%
Down 5%
No change
Up 5%
Up 10%
Up 15%
Up 20%
Others Expectation
Actual
5.5
6.0
6.5
7.0
7.5
8.0
8.5
9.0
9.5
2013 2014 2015 2016 2017
Wage growth slowed in 2016, acting
as a shock absorber, but is
expected to rebound in 2017
Page 10
Special Report: Shop Talk – China, ASEAN and the future
14 June 2017 10
PR
D, p
res
en
t an
d f
utu
re
range based on past trends. Real wage growth is likely to show a similar modest
rebound given the steady inflation outlook – we forecast CPI inflation of 2.1% in 2017
versus 2.0% prior.
Labour shortage unfazed by demand swings
The persistent labour shortage underpins our view of a modest rebound in wage growth
this year. A year of economic headwinds has done little to changing the perceived
tightness in worker supply. 26% of our respondents said the labour shortage has
worsened in the past 12 months, only a tad lower than 27% a year ago (Figure 1). In
fact, those foreseeing less labour-market tightness fell to 13% from almost 20% prior,
indicating a quick dissipation of lingering slack expectations from last year. China’s
labour shortage has increasingly become a supply rather than demand story over the
years. While this limits the emergence of excess supply during a downturn, longer-
term challenges stemming from an ageing population continue to loom.
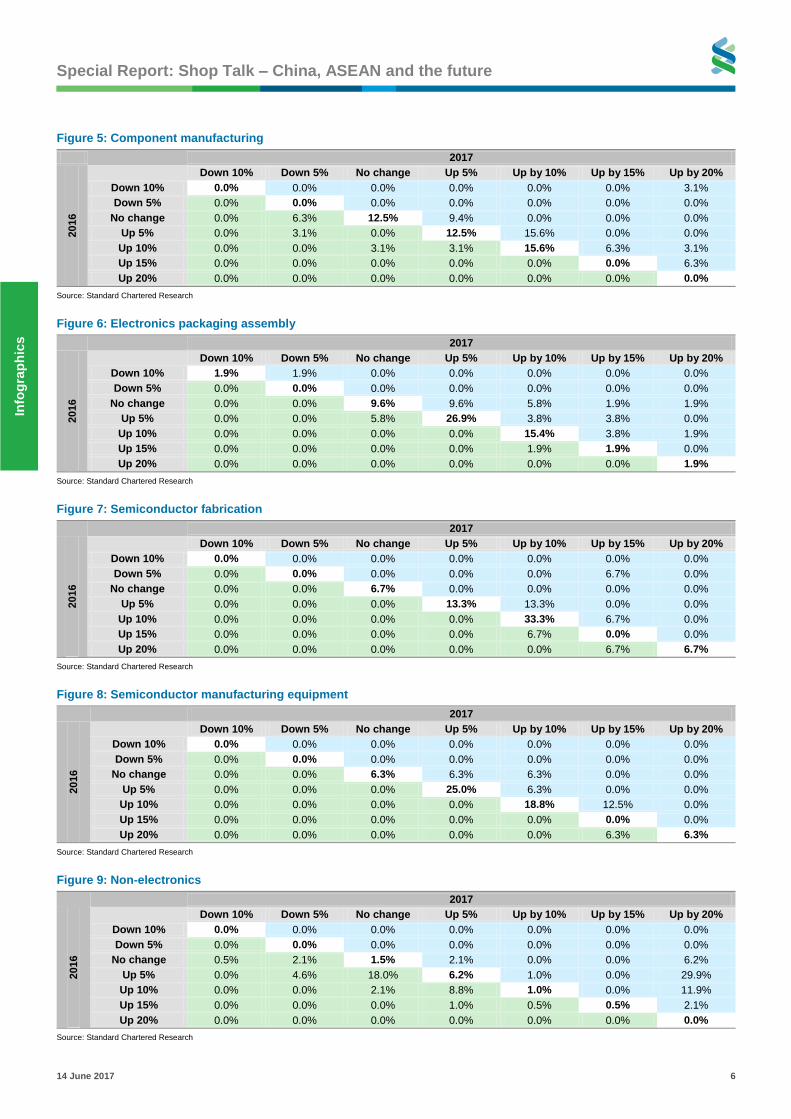
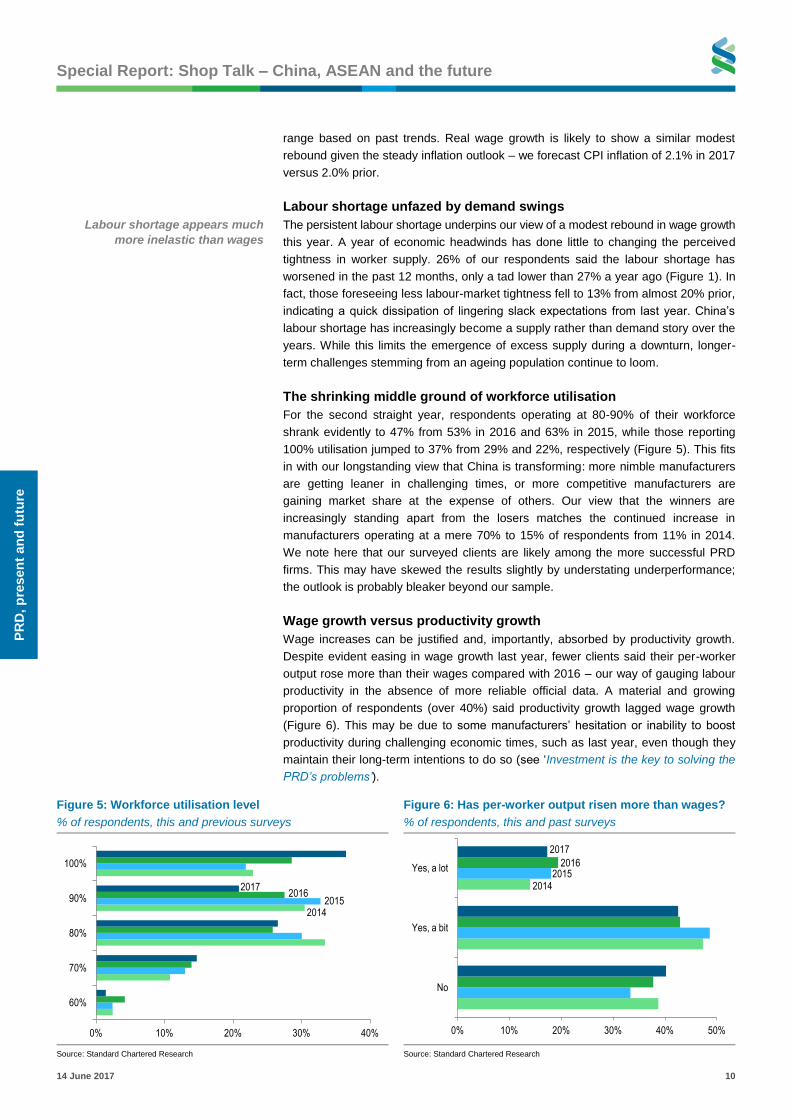
The shrinking middle ground of workforce utilisation
For the second straight year, respondents operating at 80-90% of their workforce
shrank evidently to 47% from 53% in 2016 and 63% in 2015, while those reporting
100% utilisation jumped to 37% from 29% and 22%, respectively (Figure 5). This fits
in with our longstanding view that China is transforming: more nimble manufacturers
are getting leaner in challenging times, or more competitive manufacturers are
gaining market share at the expense of others. Our view that the winners are
increasingly standing apart from the losers matches the continued increase in
manufacturers operating at a mere 70% to 15% of respondents from 11% in 2014.
We note here that our surveyed clients are likely among the more successful PRD
firms. This may have skewed the results slightly by understating underperformance;
the outlook is probably bleaker beyond our sample.
Wage growth versus productivity growth
Wage increases can be justified and, importantly, absorbed by productivity growth.
Despite evident easing in wage growth last year, fewer clients said their per-worker
output rose more than their wages compared with 2016 – our way of gauging labour
productivity in the absence of more reliable official data. A material and growing
proportion of respondents (over 40%) said productivity growth lagged wage growth
(Figure 6). This may be due to some manufacturers’ hesitation or inability to boost
productivity during challenging economic times, such as last year, even though they
maintain their long-term intentions to do so (see ‘Investment is the key to solving the
PRD’s problems’).
Figure 5: Workforce utilisation level
% of respondents, this and previous surveys
Figure 6: Has per-worker output risen more than wages?
% of respondents, this and past surveys
Source: Standard Chartered Research Source: Standard Chartered Research
2014 2015
2016 2017
0% 10% 20% 30% 40%
60%
70%
80%
90%
100%
2014 2015
2016
2017
0% 10% 20% 30% 40% 50%
No
Yes, a bit
Yes, a lot
Labour shortage appears much
more inelastic than wages
Page 11
Special Report: Shop Talk – China, ASEAN and the future
14 June 2017 11
PR
D, p
res
en
t an
d fu
ture
Less pressure from statutory minimum wage hikes
Provinces have been under less pressure to deliver statutory wage hikes. Since
2016, provinces have been allowed to hike minimum wages only once every two to
three years (from at least once every two years). This is part of the 13th Five Year
Plan (FYP, 2016-20) which called only for ‘rationally determined minimum wage
rates’. This also contrasts with targeted minimum wage increases of ‘at least 13% a
year on average’ in the government’s 12th FYP (2011-15), during which the actual
average increase was 13.1%. So far this year, only three provinces have hiked
minimum wages by an average of 7.8% (Figure 9). This is down from last year’s total
of nine provinces and their average wage hike of 10.7%, already materially lower
than in prior years on both counts (Figure 10).
A less assertive Beijing on mandating wage increases is good news for PRD
manufacturers. They have generally not been averse to statutory minimum wage
hikes in ‘good times’, in our view. They already pay wages above the minimum level
and would likely hike wages given a demand-driven shortage. In challenging times,
however, manufacturers are more sensitive and vulnerable to wage hikes. It is
therefore encouraging that only 5% of our surveyed clients saw a ‘huge’ impact on
their wage levels this year, versus a high of 15% in 2016 (Figure 7). Another 42%
(down from 57% last year) said regulatory wage hikes forced them to raise wages
more than they had planned. 33% said they would have hiked wages anyway,
Figure 7: Impact of minimum wage hikes
% of respondents
Figure 8: Have you negotiated wages in past 6 months?
% of respondents
* New options this year; Source: Standard Chartered Research Source: Standard Chartered Research
Figure 9: Minimum wages in selected provinces/cities
Top-tier minimum wage levels, CNY
Figure 10: Less urgency for provinces to hike minimum
wages
Source: CEIC, Standard Chartered Research Source: CEIC, Standard Chartered Research
2014 2015
2016 2017
0% 10% 20% 30% 40% 50% 60% 70%
No impact, likely no minimum wage hike this year*
No impact, already paying above minimum wage*
No impact, will raise wages the same anyway
Some impact, raised wages more than initially planned
Huge impact, would not have hiked wages otherwise
2014 2015
2017
0% 10% 20% 30% 40% 50% 60% 70%
No , and I don’t think I will this year
No, but I think I will probably have to this year
Yes
2016
2015 2016
2017
0
500
1,000
1,500
2,000
2,500
Shanghai Shenzhen Shaanxi
0
5
10
15
20
25
30
2011 2012 2013 2014 2015 2016
Number of provinces that adjusted minimum wages
Average minimum wage
increase (%)
Only three provinces have hiked
statutory minimum wages so far
this year
Page 12
Special Report: Shop Talk – China, ASEAN and the future
14 June 2017 12
PR
D, p
res
en
t an
d f
utu
re
regardless of minimum wage changes, beating 28% in 2016 and 30% in 2017 (even
with the two new additional ‘no change’ options diverting some of the responses
away this time). 17% expect no minimum wage hike and see no impact on their wage
decision this year.
More stubborn pressure from wage negotiation
Compared with mandatory wage hikes, the rise of collective wage bargaining is a
trend harder to reverse. 38% of respondents said they have had formal wage
negotiations with worker representatives in the past six months (Figure 8) – down
from 54% last year but still materially higher than 23% in 2015 and 24% in 2014.
Wage negotiations tend to lead to more sizeable wage adjustments: firms that
negotiated wages hiked by an average of 12.3%, more than twice the 5.9% surveyed
headline nominal wage growth in 2016.
We believe the pressure is on the authorities to continue to promote collective wage
bargaining to improve worker protection and calm labour tensions; as such,
additional policy relief for manufacturers will likely have to come from elsewhere.
Our prior surveys showed a long-running trend of local governments putting more
pressure on companies to enrol migrant workers in social insurance schemes.
Nowadays, payments to the five insurance categories (endowment, medical,
unemployment, employment injury and maternity) and the housing provident fund
account for 40% of a company’s wage bill if fully implemented. The authorities have
been lowering corporate contribution rates for such payments in phases since 2015.
The cumulative benefits of such social insurance concessions could provide material
cost relief to PRD manufacturers in 2017.
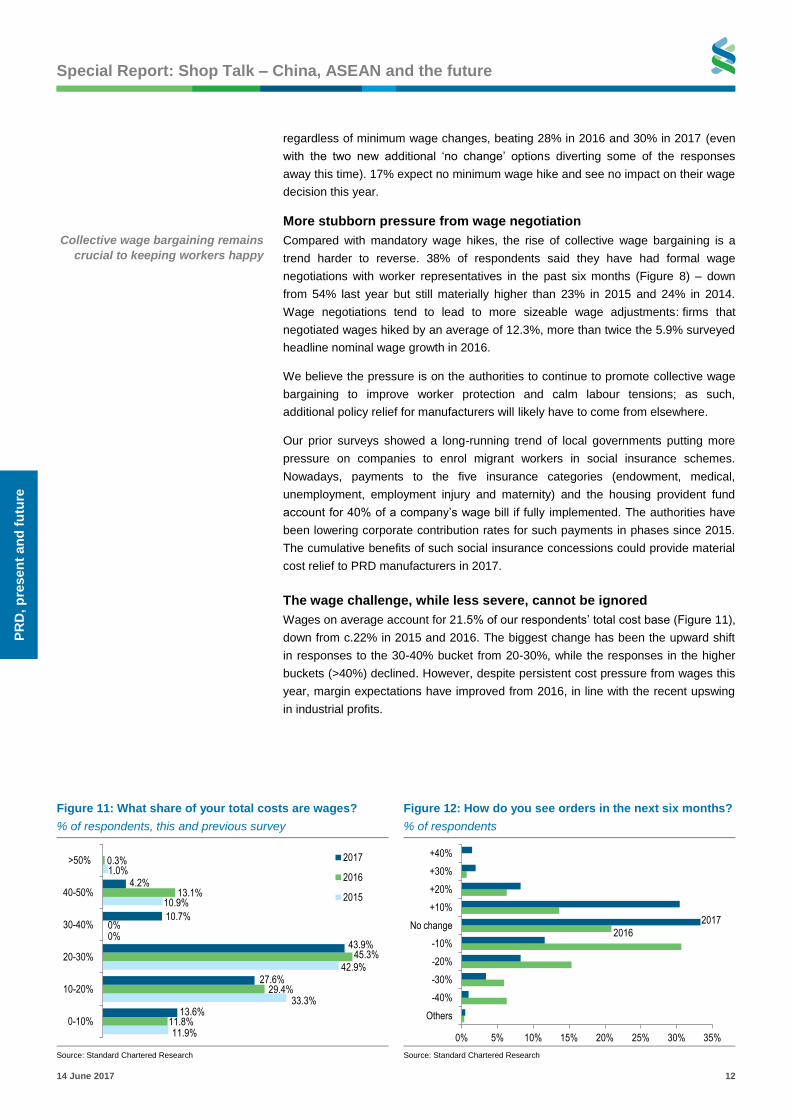
The wage challenge, while less severe, cannot be ignored
Wages on average account for 21.5% of our respondents’ total cost base (Figure 11),
down from c.22% in 2015 and 2016. The biggest change has been the upward shift
in responses to the 30-40% bucket from 20-30%, while the responses in the higher
buckets (>40%) declined. However, despite persistent cost pressure from wages this
year, margin expectations have improved from 2016, in line with the recent upswing
in industrial profits.
Figure 11: What share of your total costs are wages?
% of respondents, this and previous survey
Figure 12: How do you see orders in the next six months?
% of respondents
Source: Standard Chartered Research Source: Standard Chartered Research
11.9%
33.3%
42.9%
0%
10.9%
1.0%
11.8%
29.4%
45.3%
0%
13.1%
0.3%
13.6%
27.6%
43.9%
10.7%
4.2%
0-10%
10-20%
20-30%
30-40%
40-50%
>50% 2017
2016
2015
2016
2017
0% 5% 10% 15% 20% 25% 30% 35%
Others
-40%
-30%
-20%
-10%
No change
+10%
+20%
+30%
+40%
Collective wage bargaining remains
crucial to keeping workers happy
Page 13
Special Report: Shop Talk – China, ASEAN and the future
14 June 2017 13
PR
D, p
res
en
t an
d fu
ture
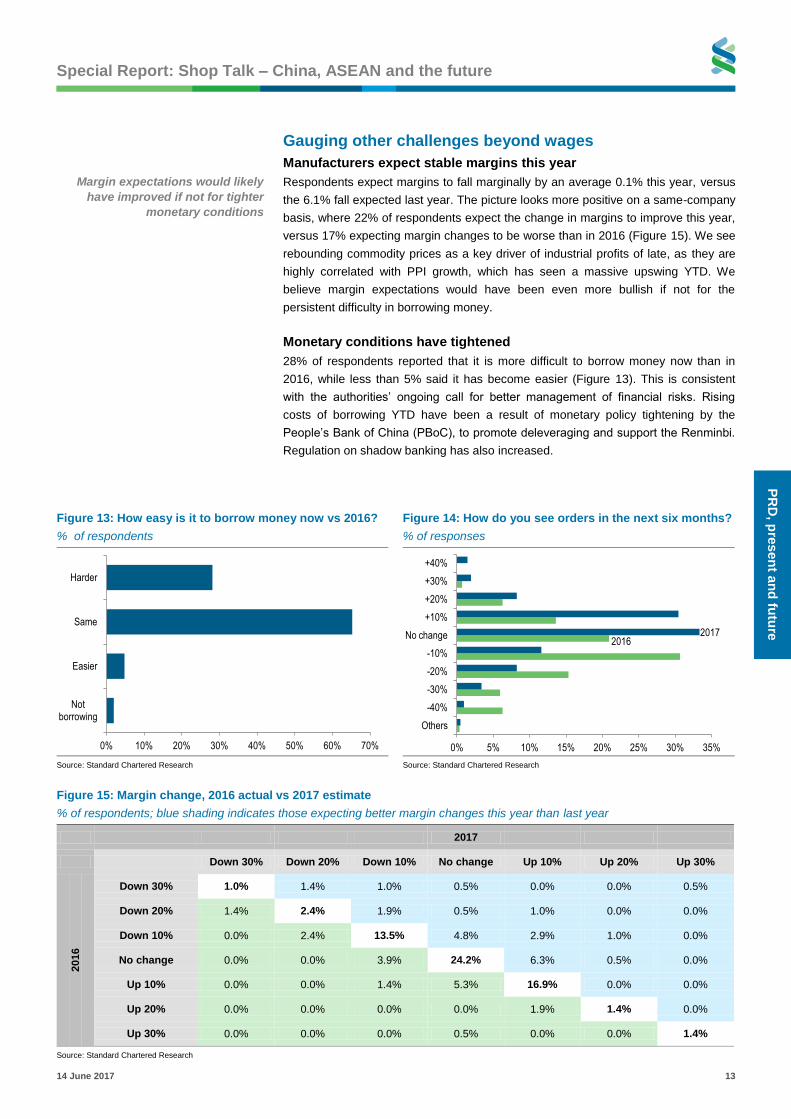
Gauging other challenges beyond wages
Manufacturers expect stable margins this year
Respondents expect margins to fall marginally by an average 0.1% this year, versus
the 6.1% fall expected last year. The picture looks more positive on a same-company
basis, where 22% of respondents expect the change in margins to improve this year,
versus 17% expecting margin changes to be worse than in 2016 (Figure 15). We see
rebounding commodity prices as a key driver of industrial profits of late, as they are
highly correlated with PPI growth, which has seen a massive upswing YTD. We
believe margin expectations would have been even more bullish if not for the
persistent difficulty in borrowing money.
Monetary conditions have tightened
28% of respondents reported that it is more difficult to borrow money now than in
2016, while less than 5% said it has become easier (Figure 13). This is consistent
with the authorities’ ongoing call for better management of financial risks. Rising
costs of borrowing YTD have been a result of monetary policy tightening by the
People’s Bank of China (PBoC), to promote deleveraging and support the Renminbi.
Regulation on shadow banking has also increased.
Figure 13: How easy is it to borrow money now vs 2016?
% of respondents
Figure 14: How do you see orders in the next six months?
% of responses
Source: Standard Chartered Research Source: Standard Chartered Research
Figure 15: Margin change, 2016 actual vs 2017 estimate
% of respondents; blue shading indicates those expecting better margin changes this year than last year
2017
Down 30% Down 20% Down 10% No change Up 10% Up 20% Up 30%
2016
Down 30% 1.0% 1.4% 1.0% 0.5% 0.0% 0.0% 0.5%
Down 20% 1.4% 2.4% 1.9% 0.5% 1.0% 0.0% 0.0%
Down 10% 0.0% 2.4% 13.5% 4.8% 2.9% 1.0% 0.0%
No change 0.0% 0.0% 3.9% 24.2% 6.3% 0.5% 0.0%
Up 10% 0.0% 0.0% 1.4% 5.3% 16.9% 0.0% 0.0%
Up 20% 0.0% 0.0% 0.0% 0.0% 1.9% 1.4% 0.0%
Up 30% 0.0% 0.0% 0.0% 0.5% 0.0% 0.0% 1.4%
Source: Standard Chartered Research
0% 10% 20% 30% 40% 50% 60% 70%
Not borrowing
Easier
Same
Harder
2016 2017
0% 5% 10% 15% 20% 25% 30% 35%
Others
-40%
-30%
-20%
-10%
No change
+10%
+20%
+30%
+40%
Margin expectations would likely
have improved if not for tighter
monetary conditions
Page 14
Special Report: Shop Talk – China, ASEAN and the future
14 June 2017 14
PR
D, p
res
en
t an
d f
utu
re
M2 has been running below its 12% target for 12 straight months as of April. This,
together with our survey finding, echoes our monthly tracker, which shows that banks
have been cautious in lending amid tighter liquidity and regulations, and funding
costs have stayed high for SMEs. The recent drop in the sub-index reading for banks’
attitude towards lending to SMEs indicates tougher credit access. The financing cost
component of our proprietary SME Confidence Index has also been persistently
below the neutral 50 mark.
We believe the tightening monetary policy bias is likely to remain as long as
(1) growth stays above 6.5%, and (2) deleveraging does not cause systemic risks.
While GDP growth probably peaked at 6.9% y/y in Q1, we do not expect a slowdown
to derail the ongoing deleveraging process. We also take comfort from the
authorities’ commitment to handle the timing and pace of tightening regulatory
measures carefully, to avoid creating new risks in the process of resolving existing
risks. We expect the PBoC to guide credit growth toward the 12% target – new
Chinese yuan (CNY) loans and monthly total social financing (TSF) increased by
12.9% y/y and 12.8%, respectively, in April, implying no relief from deleveraging
pressure – while providing enough liquidity to pre-empt a liquidity crunch.
Orders, especially external orders, are looking up
On the demand side, respondents expect orders to improve by 1.6% on average in
the next six months, versus expecting a 7.6% decline at the same time last year
(Figure 14). Only 24% of respondents see weaker orders in the next six months,
while 42% expect an improvement. The biggest migration versus 2016 is from the -
10% and -20% buckets to the ‘no change’ and +10% ones.
The expected improvement in orders is likely partly driven by a positive outlook on
key overseas markets rather than on China’s economy (Figure 16). 42% of
respondents are generally upbeat on ASEAN economies, versus 16% being
negative. Respondents view the US positively on a net basis (27% versus 14%,
respectively); this contrasts with a more neutral view on China’s economy.
All this echoes our call that the recent softening in China’s real activity, after a strong
start to the year, could be an indicator of slower growth in the coming quarters.
External trade could remain a bright spot barring an escalation in trade tensions,
offsetting a likely slowdown in housing investment, tighter credit conditions, and
fading support from the prior restocking process.
Figure 16: 2017 outlook for EU/US/ASEAN/China
% of respondents
Figure 17: Impact of CNY depreciation on your business
% of responses
Source: Standard Chartered Research Source: Standard Chartered Research
0% 20% 40% 60% 80% 100%
China
ASEAN
US
Europe
Positive Moderately positive Neutral Moderately negative Negative
0%
10%
20%
30%
40%
50%
60%
Very negative Somewhat negative
No change Somewhat positive
Very positive
Respondents are more bullish on
the US and ASEAN economies than
on China
Page 15
Special Report: Shop Talk – China, ASEAN and the future
14 June 2017 15
PR
D, p
res
en
t an
d fu
ture
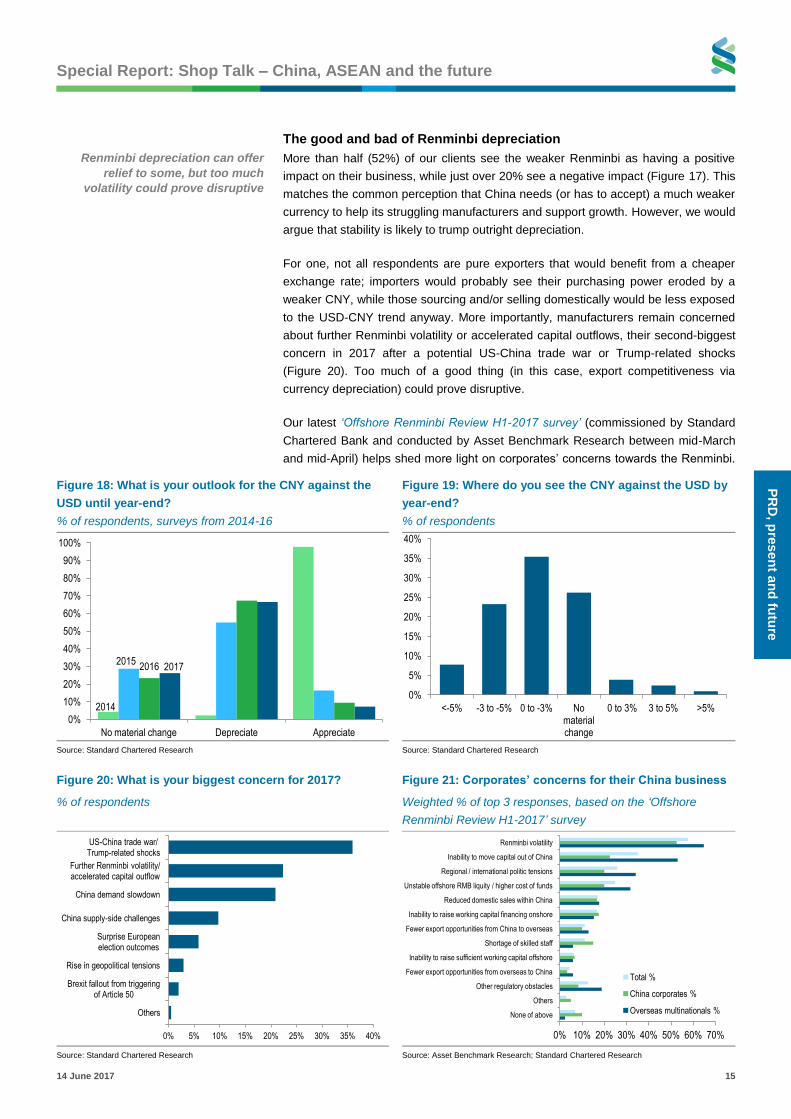
The good and bad of Renminbi depreciation
More than half (52%) of our clients see the weaker Renminbi as having a positive
impact on their business, while just over 20% see a negative impact (Figure 17). This
matches the common perception that China needs (or has to accept) a much weaker
currency to help its struggling manufacturers and support growth. However, we would
argue that stability is likely to trump outright depreciation.
For one, not all respondents are pure exporters that would benefit from a cheaper
exchange rate; importers would probably see their purchasing power eroded by a
weaker CNY, while those sourcing and/or selling domestically would be less exposed
to the USD-CNY trend anyway. More importantly, manufacturers remain concerned
about further Renminbi volatility or accelerated capital outflows, their second-biggest
concern in 2017 after a potential US-China trade war or Trump-related shocks
(Figure 20). Too much of a good thing (in this case, export competitiveness via
currency depreciation) could prove disruptive.
Our latest ‘Offshore Renminbi Review H1-2017 survey’ (commissioned by Standard
Chartered Bank and conducted by Asset Benchmark Research between mid-March
and mid-April) helps shed more light on corporates’ concerns towards the Renminbi.
Figure 18: What is your outlook for the CNY against the
USD until year-end?
% of respondents, surveys from 2014-16
Figure 19: Where do you see the CNY against the USD by
year-end?
% of respondents
Source: Standard Chartered Research Source: Standard Chartered Research
Figure 20: What is your biggest concern for 2017?
% of respondents
Figure 21: Corporates’ concerns for their China business
Weighted % of top 3 responses, based on the ‘Offshore
Renminbi Review H1-2017’ survey
Source: Standard Chartered Research Source: Asset Benchmark Research; Standard Chartered Research
2014
2015 2016 2017
0%
10%
20%
30%
40%
50%
60%
70%
80%
90%
100%
No material change Depreciate Appreciate
0%
5%
10%
15%
20%
25%
30%
35%
40%
<-5% -3 to -5% 0 to -3% No material change
0 to 3% 3 to 5% >5%
0% 5% 10% 15% 20% 25% 30% 35% 40%
Others
Brexit fallout from triggering of Article 50
Rise in geopolitical tensions
Surprise European election outcomes
China supply-side challenges
China demand slowdown
Further Renminbi volatility/ accelerated capital outflow
US-China trade war/ Trump-related shocks
0% 10% 20% 30% 40% 50% 60% 70%
Renminbi volatility
Inability to move capital out of China
Regional / international politic tensions
Unstable offshore RMB liquity / higher cost of funds
Reduced domestic sales within China
Inability to raise working capital financing onshore
Fewer export opportunities from China to overseas
Shortage of skilled staff
Inability to raise sufficient working capital offshore
Fewer export opportunities from overseas to China
Other regulatory obstacles
Others
None of above
Total %
China corporates %
Overseas multinationals %
Renminbi depreciation can offer
relief to some, but too much
volatility could prove disruptive
Page 16
Special Report: Shop Talk – China, ASEAN and the future
14 June 2017 16
PR
D, p
res
en
t an
d f
utu
re
The sample here goes beyond the PRD, extending to the rest of China and overseas
multinational corporates (MNCs) as well. The survey results confirm that corporates
are not done worrying about Renminbi volatility, prompting them to manage their
exposures more actively. Inability to move capital out of China was also a prominent
concern, especially among overseas MNCs, possibly as they are more affected by
the recent window guidance (Figure 21). We also see more corporates staying on the
sidelines across main offshore Renminbi (CNH) products this year compared with
2016 – a reflection of weak confidence affecting actual usage.
The prevailing capital controls and window guidance are unlikely to be reversed near-
term as long as depreciation expectations and capital outflow pressures remain.
Two-thirds of our respondents see the CNY depreciating further against the USD
before year-end, versus a mere 7% expecting appreciation, reflecting lingering
pessimism compared with a year ago (Figure 18). Expectations of the extent of
further depreciation are largely modest – only 8% of respondents see depreciation of
more than 5% this year versus 15% a year ago.
Vulnerability to geopolitical risks
A potential US-China trade war tops the list of our clients’ concerns for 2017 – rightly
so, in our view – with 60% expecting a high or medium negative impact from this
event (Figure 22). This is more material than the impact seen from an oil price shock
(51%), a hard and messy Brexit (40%) and an escalation of the South China Sea
conflict (36%). On average, 80% of respondents are exposed to some degree of
such geopolitical shocks, prompting over 70% to put in place some form of mitigation
or contingency plan for such risks (Figure 23).
Among the most popular actions are (1) reorienting the sales market toward other
countries, (2) diversifying suppliers/logistics arrangement and (3) diversifying the
production base to other countries. All this involves expanding one’s reach and/or
operations overseas – a rising trend among PRD manufacturers ever since rising
domestic wages became a prominent issue. We believe the new focus on
geopolitical risks could add impetus to China’s ongoing expansion in trade and
investment ties with other emerging markets, especially ASEAN.
Figure 22: How vulnerable is your business towards the
following geopolitical risk scenarios?
% of responses
Figure 23: Do you have mitigation or contingency plan in
place for the geopolitical risk(s) you identified above
% of respondents
Source: Standard Chartered Research Source: Standard Chartered Research
0% 20% 40% 60% 80% 100%
US-China trade war
Escalation in South China Sea conflict
Hard and messy Brexit
Oil price at above USD 80/bbl
High Medium Low No impact Benefit!
0% 5% 10% 15% 20% 25% 30%
Yes, by reorienting sales market toward other countries
Yes, by diversifying suppliers / logistics arrangement
Yes, by diversifying production base to other countries
Yes, via M&As to achieve better horizontal or vertical integration
Yes, by reducing market exposure / doing more hedging
No, but would probably need one soon
No, don’t see the need to
Others
Rising awareness of geopolitical
risks is giving firms pause to
consider moving production
overseas
Page 17
Special Report: Shop Talk – China, ASEAN and the future
14 June 2017 17
PR
D, p
res
en
t an
d fu
ture
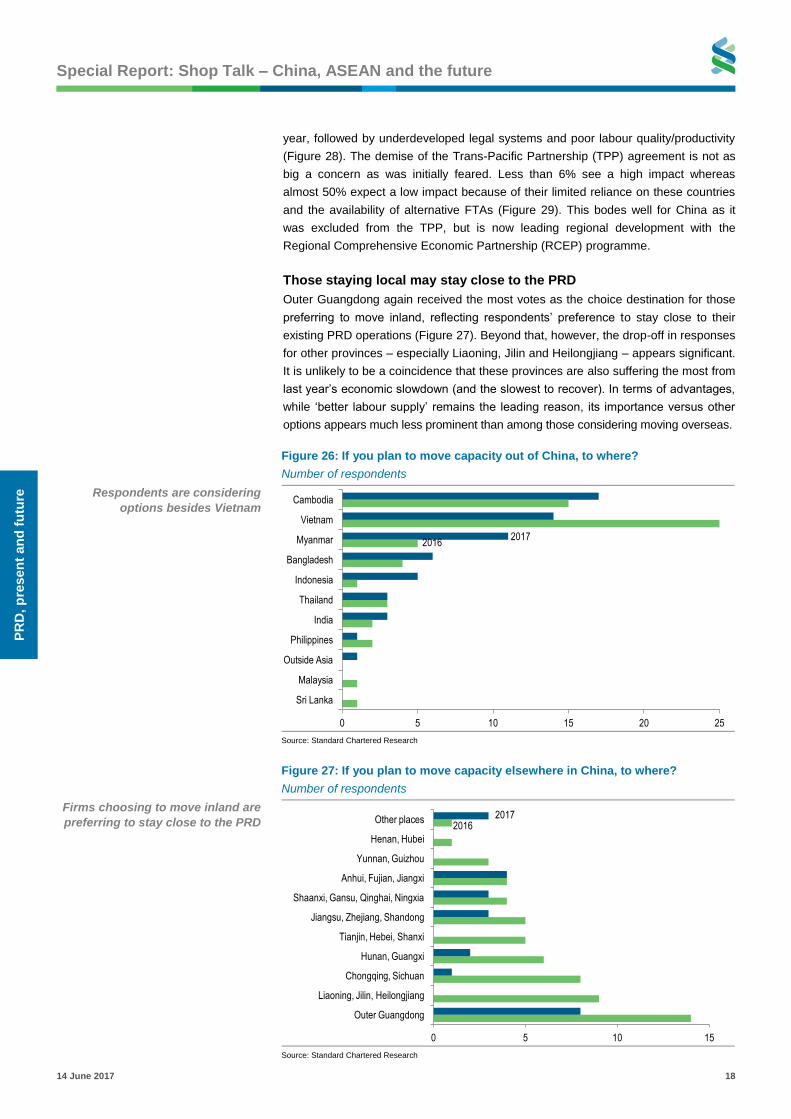
Factory relocation is a growing option
Overseas relocation favoured over moving inland
PRD manufacturers have long acknowledged relocating manufacturing operations as
one of the ways to counter rising local wages. Interestingly, however, the share of those
looking to relocate overseas has been rising while the share of those considering a
move inland has been falling (Figure 24). This year is no exception; however, those
choosing to relocate overseas (17%; 9% in 2013) have overtaken those moving inland
(10%; 30% in 2013) for the first time.
This could be a reflection of more rapid wage increases in inland cities compared
with (and as a catch-up to) coastal cities in recent years. Last year’s nation-wide
slowdown in economic activity might have also hurt inland cities’ attractiveness from
a demand perspective. In contrast, overseas destinations are preferred largely for
their better labour supply and other reasons such as tax incentives (Figure 25). There
is also growing recognition that some overseas destinations offer as promising an
economic outlook (if not better) and proximity to new buyers and customers as most
China provinces outside the PRD.
Cambodia overtakes Vietnam as top destination
Among those opting to move capacity overseas, Cambodia and Vietnam are the
most favoured destinations, as in prior years (Figure 26). While Vietnam’s share of
the response (23%) is still high, it dropped materially from 2016 (42%) as firms have
developed an interest in other ASEAN markets such as Myanmar and Bangladesh
(cheaper labour). However, these firms have not yet moved operations out of China.
Our respondents also think Cambodia, Myanmar and Indonesia are as attractive as
Vietnam in terms of tax incentives and Free Trade Agreement (FTA)-related benefits.
These choices may indicate that those considering relocating from China are mostly
low-end producers in sectors such as textiles and garments. Vietnam, however,
remains the top choice for those seeking a ‘better economic outlook’ – a factor that
could become an increasing driver of FDI into ASEAN countries if they follow in the
PRD’s development footsteps.
Low impact from TPP’s demise paves way for RCEP
We also asked our respondents about the main concerns over relocating factories
overseas. Underdeveloped transport and infrastructure again topped the list this
Figure 24: How do you respond to labour shortages?
% of respondents, this and past surveys
Figure 25: Advantages of relocating
No. of respondents
* Not an option before 2015; ** new option this year; Source: Standard Chartered Research Source: Standard Chartered Research
2013 2014 2015
2016 2017
0% 10% 20% 30% 40% 50% 60% 70%
Move capacity out of China
Move capacity inland
Produce things higher up in the value chain**
Invest more in capital equipment
Invest more in automation/ streamlining processes*
Moving inland
Moving overseas
0 5 10 15 20
Other
Proximity to new buyers and customers
Better economic outlook
FTA-related benefits (even without TPP)
Other savings on non-wage business costs
Attractive tax incentives
Better labour supply (quantity/quality)
ASEAN remains the top choice for
overseas relocation
Page 18
Special Report: Shop Talk – China, ASEAN and the future
14 June 2017 18
PR
D, p
res
en
t an
d f
utu
re
year, followed by underdeveloped legal systems and poor labour quality/productivity
(Figure 28). The demise of the Trans-Pacific Partnership (TPP) agreement is not as
big a concern as was initially feared. Less than 6% see a high impact whereas
almost 50% expect a low impact because of their limited reliance on these countries
and the availability of alternative FTAs (Figure 29). This bodes well for China as it
was excluded from the TPP, but is now leading regional development with the
Regional Comprehensive Economic Partnership (RCEP) programme.
Those staying local may stay close to the PRD
Outer Guangdong again received the most votes as the choice destination for those
preferring to move inland, reflecting respondents’ preference to stay close to their
existing PRD operations (Figure 27). Beyond that, however, the drop-off in responses
for other provinces – especially Liaoning, Jilin and Heilongjiang – appears significant.
It is unlikely to be a coincidence that these provinces are also suffering the most from
last year’s economic slowdown (and the slowest to recover). In terms of advantages,
while ‘better labour supply’ remains the leading reason, its importance versus other
options appears much less prominent than among those considering moving overseas.
Figure 26: If you plan to move capacity out of China, to where?
Number of respondents
Respondents are considering
options besides Vietnam
Source: Standard Chartered Research
Figure 27: If you plan to move capacity elsewhere in China, to where?
Number of respondents
Firms choosing to move inland are
preferring to stay close to the PRD
Source: Standard Chartered Research
2016 2017
0 5 10 15 20 25
Cambodia
Vietnam
Myanmar
Bangladesh
Indonesia
Thailand
India
Philippines
Outside Asia
Malaysia
Sri Lanka
2016 2017
0 5 10 15
Outer Guangdong
Liaoning, Jilin, Heilongjiang
Chongqing, Sichuan
Hunan, Guangxi
Tianjin, Hebei, Shanxi
Jiangsu, Zhejiang, Shandong
Shaanxi, Gansu, Qinghai, Ningxia
Anhui, Fujian, Jiangxi
Yunnan, Guizhou
Henan, Hubei
Other places
Page 19
Special Report: Shop Talk – China, ASEAN and the future
14 June 2017 19
PR
D, p
res
en
t an
d fu
ture
Factory relocation is a slow-burning narrative
We talked about the shift in preferences and the underlying drivers for manufacturers
moving capacity elsewhere. As factory relocations are multi-year projects that involve
long planning times and heavy investment, it is not surprising that a majority (57%)
who say they will move are still in the ‘consideration’ stage, and another 17% have
only just started moving (Figure 30). Only 17% have already relocated and started
operations, with another 9% more than half way through their move.
We see a glass half full – the survey shows the massive potential of ASEAN-bound
investment from China, which should materialise over the coming years, or even
decades. The short-term driver of this trend is the cost advantage (labour and more)
the ASEAN region offers. The expected average cost savings from moving capacity
overseas and inland are c.19% and 16%, respectively. These are higher than the
11% average savings from automation and streamlining, 13% from investing more on
capital, and 12% from moving products up the value chain (Figure 31).
Over time, we also expect some transportation and infrastructure bottlenecks to clear,
legal systems to mature and labour quality and productivity to improve in ASEAN,
making it more attractive to China investors. Longer-term, we expect ASEAN’s strong
fundamental story to shine through (more on this in later sections).
Figure 28: Concerns over relocating
No. of respondents
Figure 29: How impacted are you by TPP’s demise?
% of responses
Source: Standard Chartered Research Source: Standard Chartered Research
Figure 30: What stage of moving are you at?
% of respondents
Figure 31: How much would your response save you?
Wage savings, %
Source: Standard Chartered Research Source: Standard Chartered Research
Moving inland
Moving overseas
0 10 20 30
Lack of proximity to suppliers
Future high wage inflation
Strong labour unions/labour laws
High non-wage business costs
Uncertain political/social outlook
Poor labour quality and productivity
Underdeveloped legal system
Underdeveloped transport/infra.
0% 5% 10% 15% 20% 25% 30%
High impact, because TPP countries are our main production base/sales market
Low impact, because of low reliance on TPP countries as production base/sales market
Low impact, because there are (or likely will be) alternative FTAs
No impact
Not sure
Positive impact, actually, because I operate in countries that lose out to TPP
0% 20% 40% 60%
Already moved and started operations
Have already started the move, > 50% done
Move under way, just started
Still under consideration - haven't decided yet
Those who said would move
0% 20% 40% 60% 80% 100%
Automation/streamlining
More capital investment
Move capacity inland
Move capacity overeseas
Move product up value chain
< 10% 10-20% 20-25% 25-30% > 30%
The majority of respondents who
prefer to move capacity overseas
are still in the ‘consideration’ stage
Page 20
Special Report: Shop Talk – China, ASEAN and the future
14 June 2017 20
PR
D, p
res
en
t an
d f
utu
re
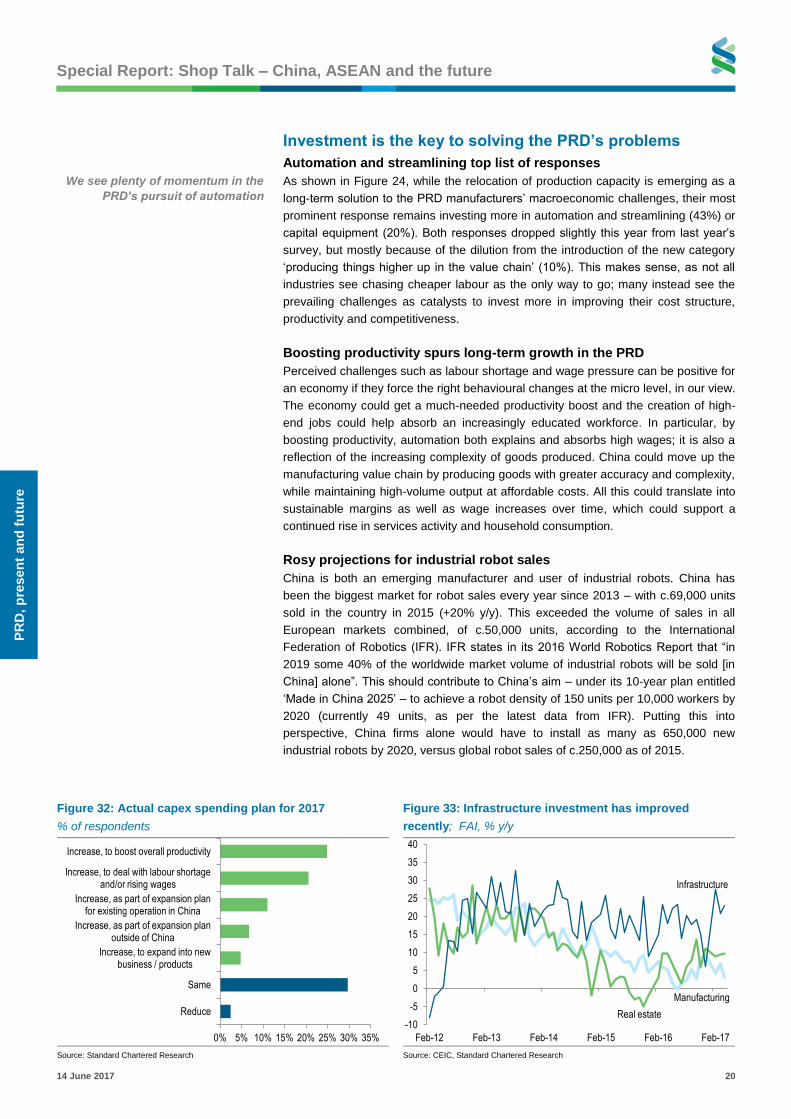
Investment is the key to solving the PRD’s problems
Automation and streamlining top list of responses
As shown in Figure 24, while the relocation of production capacity is emerging as a
long-term solution to the PRD manufacturers’ macroeconomic challenges, their most
prominent response remains investing more in automation and streamlining (43%) or
capital equipment (20%). Both responses dropped slightly this year from last year’s
survey, but mostly because of the dilution from the introduction of the new category
‘producing things higher up in the value chain’ (10%). This makes sense, as not all
industries see chasing cheaper labour as the only way to go; many instead see the
prevailing challenges as catalysts to invest more in improving their cost structure,
productivity and competitiveness.
Boosting productivity spurs long-term growth in the PRD
Perceived challenges such as labour shortage and wage pressure can be positive for
an economy if they force the right behavioural changes at the micro level, in our view.
The economy could get a much-needed productivity boost and the creation of high-
end jobs could help absorb an increasingly educated workforce. In particular, by
boosting productivity, automation both explains and absorbs high wages; it is also a
reflection of the increasing complexity of goods produced. China could move up the
manufacturing value chain by producing goods with greater accuracy and complexity,
while maintaining high-volume output at affordable costs. All this could translate into
sustainable margins as well as wage increases over time, which could support a
continued rise in services activity and household consumption.
Rosy projections for industrial robot sales
China is both an emerging manufacturer and user of industrial robots. China has
been the biggest market for robot sales every year since 2013 – with c.69,000 units
sold in the country in 2015 (+20% y/y). This exceeded the volume of sales in all
European markets combined, of c.50,000 units, according to the International
Federation of Robotics (IFR). IFR states in its 2016 World Robotics Report that “in
2019 some 40% of the worldwide market volume of industrial robots will be sold [in
China] alone”. This should contribute to China’s aim – under its 10-year plan entitled
‘Made in China 2025’ – to achieve a robot density of 150 units per 10,000 workers by
2020 (currently 49 units, as per the latest data from IFR). Putting this into
perspective, China firms alone would have to install as many as 650,000 new
industrial robots by 2020, versus global robot sales of c.250,000 as of 2015.
Figure 32: Actual capex spending plan for 2017
% of respondents
Figure 33: Infrastructure investment has improved
recently; FAI, % y/y
Source: Standard Chartered Research Source: CEIC, Standard Chartered Research
0% 5% 10% 15% 20% 25% 30% 35%
Increase, to boost overall productivity
Increase, to deal with labour shortage and/or rising wages
Increase, as part of expansion plan for existing operation in China
Increase, as part of expansion plan outside of China
Increase, to expand into new business / products
Same
Reduce
Manufacturing
Real estate
Infrastructure
-10
-5
0
5
10
15
20
25
30
35
40
Feb-12 Feb-13 Feb-14 Feb-15 Feb-16 Feb-17
We see plenty of momentum in the
PRD’s pursuit of automation
Page 21
Special Report: Shop Talk – China, ASEAN and the future
14 June 2017 21
PR
D, p
res
en
t an
d fu
ture
Official data says manufacturing investment stays soft for now
While our respondents acknowledge the need for more manufacturing investment,
the official data has been subdued YTD. Planned investment under newly started
projects, a forward-looking indicator, saw negative growth of 5.9% y/y in January-
April. And while the government’s proactive fiscal stance has translated into strong
infrastructure investment growth, private-sector investment weakened after a decent
start to the year (Figure 33). This fuels the longstanding worry that SOEs’
overbearing economic presence could be crowding out private investment, an issue
that may only be resolved through SOE reforms and banking-sector reforms. The
push for deleveraging is also posing headwinds to manufacturing investment, with
respondents seeing lower credit access and higher funding costs (reflecting a
tightening monetary policy bias).
The good news is that the majority (68%) of our PRD clients plan to increase capex
spending in 2017 (Figure 32), so a catch-up in H2-2017 is possible, assuming a more
constructive macro and monetary backdrop. The bulk of those planning to step up
their investment this year are doing it to boost productivity (25%) or to deal with the
labour shortage (21%). Lingering cautiousness over the macro outlook may explain
the reduced urgency to expand existing/new operations and products.
All this is another timely reminder that while PRD manufacturers are far from
resolving their structural and cyclical challenges, these could spur much-needed
upgrades on a micro level and reforms on a macro level. We believe it is now down
to the authorities to facilitate the relevant changes while balancing their various policy
objectives, including sustaining growth and promoting deleverage.
The recent macro backdrop has not
been conducive to manufacturing
investment
Page 22
How different Asian manufacturers stack up Chidu Narayanan +65 6596 7004
[email protected]
Economist, Asia
Standard Chartered Bank, Singapore Branch
Kelvin Lau +852 3983 8565
[email protected]
Senior Economist, Greater China
Standard Chartered Bank (HK) Limited
Page 23
Special Report: Shop Talk – China, ASEAN and the future
14 June 2017 23
Asia
n m
an
ufa
ctu
rers
A deeper dive into manufacturers’ preferences
Divergent preferences due to structural dissimilarities
Low-cost electronics clients are similar to non-electronics clients
We dig deeper into what drives our clients’ preferences, analysing responses from an
industry perspective (see the PRD – The present and future section). Our
respondents are almost equally split between electronics and non-electronics
manufacturers, with around 53% in electronics manufacturing. Of these, 45% are
involved in electronics packaging assembly, 29% in component manufacturing, and
13% each in semiconductor fabrication and semiconductor manufacturing equipment.
Non-electronics manufacturers include those producing garments and apparel,
plastic products, toys and furniture.
Figure 1: High-end manufacturers prefer to boost investment while low-end manufacturers opt to move operations, in
order to tackle labour challenges
Industry Preferred response to labour shortage
Estimated wage rise (%)
Wages as a share of total costs (%)
Expected change in orders over next
6 months (%)
Expected change in margins in (%)
2016 2017 2016 2017 2016 2017 2016 2017
2016 vs 2015
2017 vs 2016
Semiconductor manufacturing equipment
Automation/ Move out of
China
Automation/ More capex
6.0 8.8 20.8 19.7 -10.8 1.6 -7.9 1.9
Semiconductor fabrication
More capex/ Automation
More capex/ Move higher up
value chain 9.2 10.3 21.7 19.0 -11.0 -1.3 -7.2 -7.1
Electronics packaging assembly
More capex/ Move inland
Automation/ More capex
7.6 7.1 24.2 26.1 -9.8 2.4 -8.9 1.2
Component manufacturing
Automation/ More capex/ Move inland
Automation/ Move out of
China 9.4 7.1 22.7 21.6 -7.6 3.0 -5.5 -2.7
Non-electronics manufacturing
Automation/ Move out of
China
Automation/ Move out of
China 6.4 6.6 21.9 19.7 -4.0 2.6 -4.0 1.5
All manufacturers 7.7 7.2 22.5 21.5 -7.6 1.6 -6.1 -0.1
Red is high, green is low and yellow is moderate; Source: Standard Chartered Research
Figure 2: What share of your total costs are wages?
% of respondents
Source: Standard Chartered Research
0% 5% 10% 15% 20% 25% 30% 35% 40%
0-10%
10-20%
25-25%
25-30%
30-40%
40-50% Non-electronics
Semiconductor manufacturing equipment
Semiconductor fabrication
Electronics packaging assembly
Component manufacturing
Page 24
Special Report: Shop Talk – China, ASEAN and the future
14 June 2017 24
Asia
n m
an
ufa
ctu
rers
Wages still contribute a material share of total costs
While wages as a share of total costs have declined, they still constitute a material
proportion of manufacturers’ total costs. Our clients estimate that total wages account
for an average of 21.5% of their total costs, down from 22.5% last year and 21.9% in
2015. The share of wages (of total costs) has fallen across the board in all industries,
expect in electronics packaging assembly. Wages make up over 26% of all costs for
these firms, the highest among our survey respondents and up from 24% in 2016. At
the other end of the spectrum, firms involved in semiconductor fabrication reported
the smallest share of wages (of total cost) at 19%, having dropped the most from
2016 (21.7%). Non-electronics manufacturers said wages make up only 19.7% of
their total costs, more than in value-added electronics manufacturing but less than in
low-end electronics assembly.
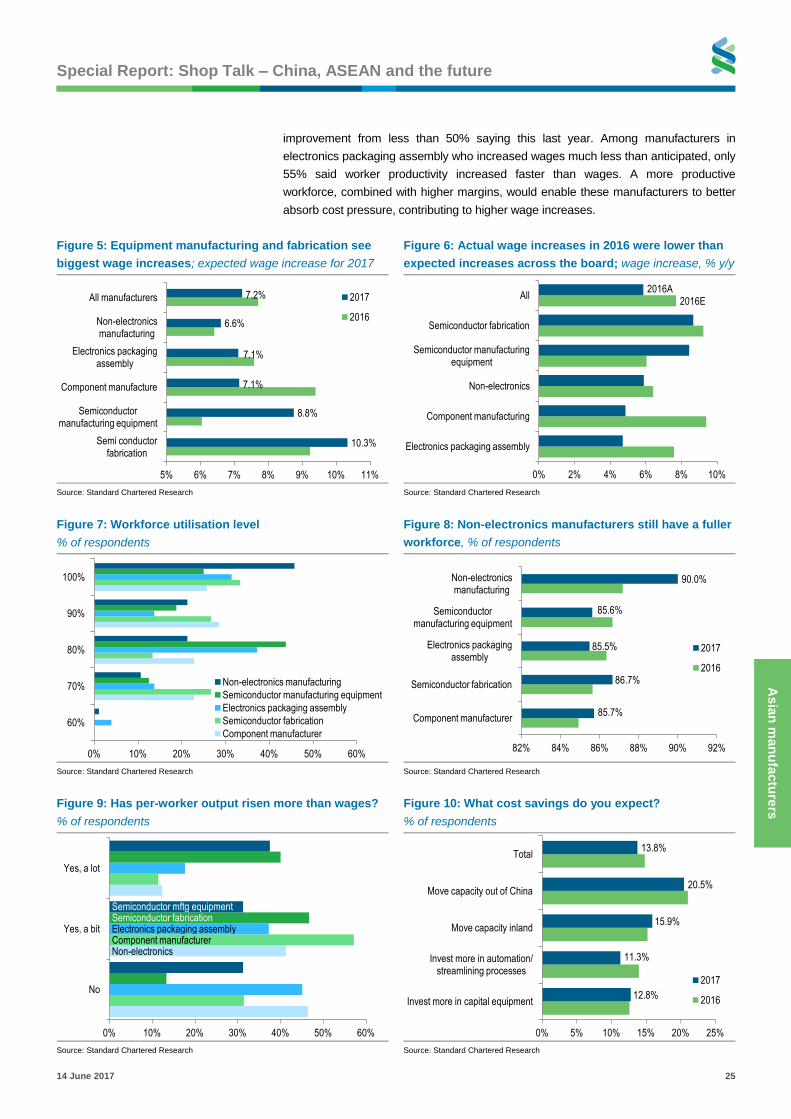
Semiconductor fabricators expect the highest wage increase this year, at 10.3% y/y,
among the highest of all respondents; they anticipated an increase of 9.2% y/y in
2016. Semiconductor equipment manufacturers also estimated strong wage growth
of 8.8% y/y this year, among the lowest of all respondents and well above the 6% y/y
they expected last year. But this does not necessarily imply that firms reporting low
wage increases now have lower cost pressure – they may simply have been ahead
of the curve and increased wages in previous years in response to earlier pressure.
Another potential reason semiconductor fabricators foresee more wage increases
again this year is that wage pressure on them has been delayed as their labour force
is more skilled and likely already at higher wage levels.
Across all industries, actual wage increases in 2016 were lower than expected at the
beginning of the year, significantly so in component manufacturing and electronics
packaging assembly. Packaging assembly firms raised wages by only 4.7%, despite
expecting a 7.6% increase at the beginning of 2016 whereas component manufacturers
had to raise wages by just 4.9%, much lower than their projection of 9.4% in Q1-2016.
Lower-than-expected wage increases last year might explain the decline in
expectations of wage increases this year, as actual wage increases tend be lower.
Worker productivity also differed significantly between industries; an overwhelming
majority of more than 85% of manufacturers in semiconductor fabrication said per-
worker output had risen faster than wages in the previous year, either slightly or
significantly, compared to 75% saying this in 2016. In contrast, only 53.6% of non-
electronics manufacturers saw worker productivity increase faster than wages, an
Figure 3: What is your expected wage increase?
% of respondents
Figure 4: Wages, as a share of total costs, have fallen
across the board, but remain high (% of total costs)
Source: Standard Chartered Research Source: Standard Chartered Research
0%
10%
20%
30%
40%
50%
60%
70%
80%
down no change up 5% Up by 10% Up by 15% Up by 20%
Semiconductor manufacturing equipment
Non-electronics manufacturing
Electronics packaging assembly
Semiconductor fabrication
Component manufacture
2016
2017
0% 5% 10% 15% 20% 25% 30%
Electronics packaging assembly
Component manufacturing
Semiconductor manufacturing equipment
Non-electronics
Semiconductor fabrication
All
Wages make up an average of
21.5% of manufacturers’ total costs
Page 25
Special Report: Shop Talk – China, ASEAN and the future
14 June 2017 25
Asia
n m
an
ufa
ctu
rers
improvement from less than 50% saying this last year. Among manufacturers in
electronics packaging assembly who increased wages much less than anticipated, only
55% said worker productivity increased faster than wages. A more productive
workforce, combined with higher margins, would enable these manufacturers to better
absorb cost pressure, contributing to higher wage increases.
Figure 5: Equipment manufacturing and fabrication see
biggest wage increases; expected wage increase for 2017
Figure 6: Actual wage increases in 2016 were lower than
expected increases across the board; wage increase, % y/y
Source: Standard Chartered Research Source: Standard Chartered Research
Figure 7: Workforce utilisation level
% of respondents
Figure 8: Non-electronics manufacturers still have a fuller
workforce, % of respondents
Source: Standard Chartered Research Source: Standard Chartered Research
Figure 9: Has per-worker output risen more than wages?
% of respondents
Figure 10: What cost savings do you expect?
% of respondents
Source: Standard Chartered Research Source: Standard Chartered Research
10.3%
8.8%
7.1%
7.1%
6.6%
7.2%
5% 6% 7% 8% 9% 10% 11%
Semi conductor fabrication
Semiconductor manufacturing equipment
Component manufacture
Electronics packaging assembly
Non-electronics manufacturing
All manufacturers 2017
2016
2016E 2016A
0% 2% 4% 6% 8% 10%
Electronics packaging assembly
Component manufacturing
Non-electronics
Semiconductor manufacturing equipment
Semiconductor fabrication
All
0% 10% 20% 30% 40% 50% 60%
60%
70%
80%
90%
100%
Non-electronics manufacturing
Semiconductor manufacturing equipment
Electronics packaging assembly
Semiconductor fabrication
Component manufacturer
85.7%
86.7%
85.5%
85.6%
90.0%
82% 84% 86% 88% 90% 92%
Component manufacturer
Semiconductor fabrication
Electronics packaging assembly
Semiconductor manufacturing equipment
Non-electronics manufacturing
2017
2016
0% 10% 20% 30% 40% 50% 60%
No
Yes, a bit
Yes, a lot
Non-electronics Component manufacturer Electronics packaging assembly Semiconductor fabrication Semiconductor mftg equipment
12.8%
11.3%
15.9%
20.5%
13.8%
0% 5% 10% 15% 20% 25%
Invest more in capital equipment
Invest more in automation/ streamlining processes
Move capacity inland
Move capacity out of China
Total
2017
2016
Page 26
Special Report: Shop Talk – China, ASEAN and the future
14 June 2017 26
Asia
n m
an
ufa
ctu
rers
Average workforce utilisation among PRD manufacturers is over 86%, higher than in
previous years. The variation in workforce utilisation between manufacturers in
different industries is marginal; component manufacturers still reported among the
lowest utilisation, at 85.7%, slightly higher than 85% last year. At the other end of the
spectrum, non-electronics manufacturers reported the highest utilisation, at 90%,
even higher than 87.2% reported in 2016.
More manufacturers prefer moving out of China than in previous years
Most respondents see streamlining their processes/investing in automation as a
favoured workaround to tackle the rising labour shortage, with almost one in two
respondents choosing that option. The rest are split between investing in capex and
moving operations to a different location. Respondents involved in semiconductor
fabrication prefer to invest in capex – 40% versus only 26% last year. Semiconductor
equipment manufacturers opted for investing in capex and investing in automation
equally. Other manufacturers prefer moving operations – either to other parts of
China or overseas. Electronic component and non-electronics manufacturers both
prefer to move operations overseas to tackle declining labour availability – 17% and
22%, respectively, versus 14% and 18% in 2016.
Figure 11: How do you respond to labour shortages?
% of respondents
Source: Standard Chartered Research
Figure 12: Cambodia is emerging as a key competitor to
Vietnam
% of respondents, among those choosing Vietnam and
Cambodia
Figure 13: Is the labour shortage better or worse than
before?
% of respondents
Source: Standard Chartered Research Source: Standard Chartered Research
0% 5% 10% 15% 20% 25% 30% 35% 40% 45% 50%
Move capacity out of China
Move capacity inland
Invest more in capital equipment
Invest more in automation/ streamlining processes
Non-electronics
Semiconductor manufacturing equipment
Semiconductor fabrication
Electronics packaging assembly
Component manufacturing
Cambodia
Vietnam
0% 10% 20% 30%
Electronics packaging assembly
Semiconductor fabrication
Component manufacturer
Semiconductor mftg equipment
Non-electronics
More difficult Less difficult
0% 10% 20% 30% 40% 50% 60%
Electronics packaging assembly
Semiconductor fabrication
Component manufacturer
Semiconductor mftg equipment
Non-electronics
Worker utilisation is similarly high
among all industries
Streamlining/automation is the
favoured workaround to tackle a
labour shortage
Page 27
Special Report: Shop Talk – China, ASEAN and the future
14 June 2017 27
Asia
n m
an
ufa
ctu
rers
Between Vietnam and Cambodia, Cambodia was favoured among non-electronics
manufacturers (2 to 1), while component manufacturers preferred Vietnam; both
locations were equally preferred by firms in other industries.
Our survey respondents said moving manufacturing capacity overseas led to the
largest savings, of over 20% on average, marginally lower than the 21% estimated last
year. Moving inland remained the next preferred option (in terms of cost saving), saving
15.9%, higher than the 15% expected in 2016. Investing in automation was expected to
bring the least cost savings, of only an estimated 11.3%. Moving manufacturing
appeared to be more attractive and feasible for low-cost manufacturers.
Moving overseas led to the largest
cost savings, of over 21%
Page 28
Special Report: Shop Talk – China, ASEAN and the future
14 June 2017 28
Asia
n m
an
ufa
ctu
rers
Wage growth, 2016 actual versus 2017 expectations
% of respondents; blue shading indicates faster expected wage growth vs 2016
Figure 14: Component manufacturing
2017
2016
Down 10% Down 5% No change Up 5% Up by 10% Up by 15% Up by 20%
Down 10% 0.0% 0.0% 0.0% 0.0% 0.0% 0.0% 3.1%
Down 5% 0.0% 0.0% 0.0% 0.0% 0.0% 0.0% 0.0%
No change 0.0% 6.3% 12.5% 9.4% 0.0% 0.0% 0.0%
Up 5% 0.0% 3.1% 0.0% 12.5% 15.6% 0.0% 0.0%
Up 10% 0.0% 0.0% 3.1% 3.1% 15.6% 6.3% 3.1%
Up 15% 0.0% 0.0% 0.0% 0.0% 0.0% 0.0% 6.3%
Up 20% 0.0% 0.0% 0.0% 0.0% 0.0% 0.0% 0.0%
Source: Standard Chartered Research
Figure 15: Electronics packaging assembly
2017
2016
Down 10% Down 5% No change Up 5% Up by 10% Up by 15% Up by 20%
Down 10% 1.9% 1.9% 0.0% 0.0% 0.0% 0.0% 0.0%
Down 5% 0.0% 0.0% 0.0% 0.0% 0.0% 0.0% 0.0%
No change 0.0% 0.0% 9.6% 9.6% 5.8% 1.9% 1.9%
Up 5% 0.0% 0.0% 5.8% 26.9% 3.8% 3.8% 0.0%
Up 10% 0.0% 0.0% 0.0% 0.0% 15.4% 3.8% 1.9%
Up 15% 0.0% 0.0% 0.0% 0.0% 1.9% 1.9% 0.0%
Up 20% 0.0% 0.0% 0.0% 0.0% 0.0% 0.0% 1.9%
Source: Standard Chartered Research
Figure 16: Semiconductor fabrication
2017
2016
Down 10% Down 5% No change Up 5% Up by 10% Up by 15% Up by 20%
Down 10% 0.0% 0.0% 0.0% 0.0% 0.0% 0.0% 0.0%
Down 5% 0.0% 0.0% 0.0% 0.0% 0.0% 6.7% 0.0%
No change 0.0% 0.0% 6.7% 0.0% 0.0% 0.0% 0.0%
Up 5% 0.0% 0.0% 0.0% 13.3% 13.3% 0.0% 0.0%
Up 10% 0.0% 0.0% 0.0% 0.0% 33.3% 6.7% 0.0%
Up 15% 0.0% 0.0% 0.0% 0.0% 6.7% 0.0% 0.0%
Up 20% 0.0% 0.0% 0.0% 0.0% 0.0% 6.7% 6.7%
Source: Standard Chartered Research
Page 29
Special Report: Shop Talk – China, ASEAN and the future
14 June 2017 29
Asia
n m
an
ufa
ctu
rers
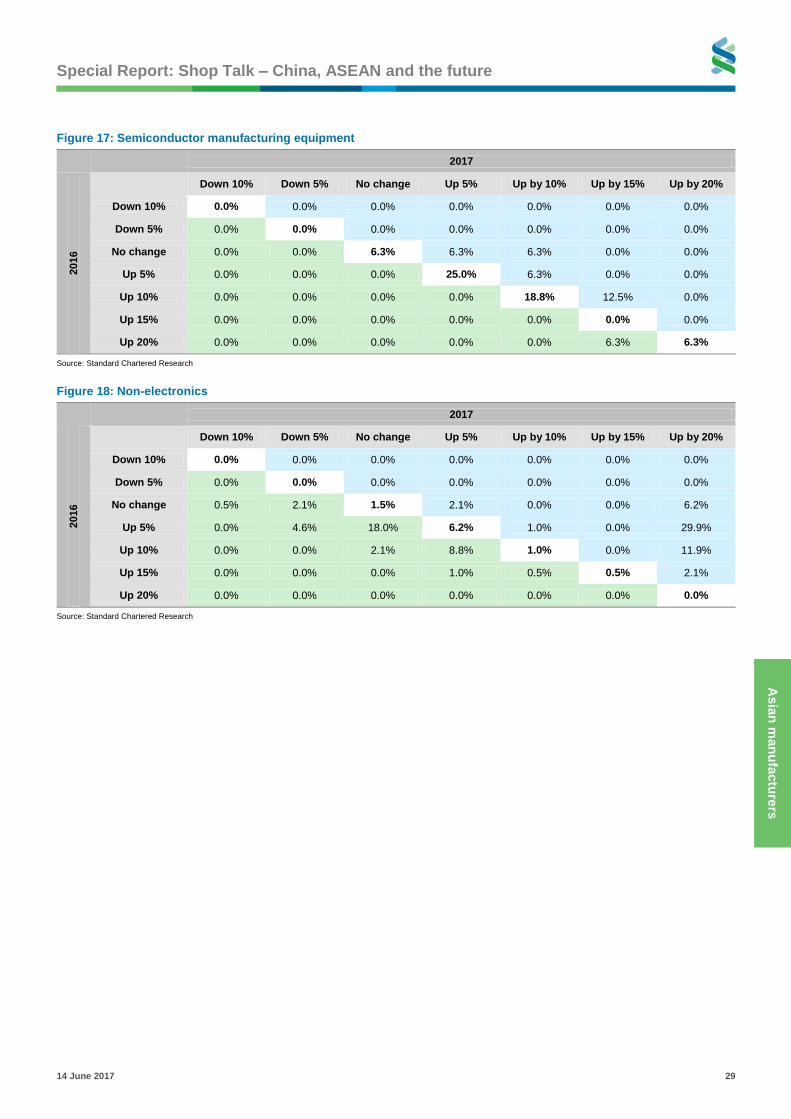
Figure 17: Semiconductor manufacturing equipment
2017
2016
Down 10% Down 5% No change Up 5% Up by 10% Up by 15% Up by 20%
Down 10% 0.0% 0.0% 0.0% 0.0% 0.0% 0.0% 0.0%
Down 5% 0.0% 0.0% 0.0% 0.0% 0.0% 0.0% 0.0%
No change 0.0% 0.0% 6.3% 6.3% 6.3% 0.0% 0.0%
Up 5% 0.0% 0.0% 0.0% 25.0% 6.3% 0.0% 0.0%
Up 10% 0.0% 0.0% 0.0% 0.0% 18.8% 12.5% 0.0%
Up 15% 0.0% 0.0% 0.0% 0.0% 0.0% 0.0% 0.0%
Up 20% 0.0% 0.0% 0.0% 0.0% 0.0% 6.3% 6.3%
Source: Standard Chartered Research
Figure 18: Non-electronics
2017
2016
Down 10% Down 5% No change Up 5% Up by 10% Up by 15% Up by 20%
Down 10% 0.0% 0.0% 0.0% 0.0% 0.0% 0.0% 0.0%
Down 5% 0.0% 0.0% 0.0% 0.0% 0.0% 0.0% 0.0%
No change 0.5% 2.1% 1.5% 2.1% 0.0% 0.0% 6.2%
Up 5% 0.0% 4.6% 18.0% 6.2% 1.0% 0.0% 29.9%
Up 10% 0.0% 0.0% 2.1% 8.8% 1.0% 0.0% 11.9%
Up 15% 0.0% 0.0% 0.0% 1.0% 0.5% 0.5% 2.1%
Up 20% 0.0% 0.0% 0.0% 0.0% 0.0% 0.0% 0.0%
Source: Standard Chartered Research
Page 30
Big Bay Area – Creating a PRD city cluster Kelvin Lau +852 3983 8565
[email protected]
Senior Economist, Greater China
Standard Chartered Bank (HK) Limited
Chidu Narayanan +65 6596 7004
[email protected]
Economist, Asia
Standard Chartered Bank, Singapore Branch
Page 31
Special Report: Shop Talk – China, ASEAN and the future
14 June 2017 31
Big
Bay A
rea
Big Bay Area – Creating a PRD city cluster
From assembling goods to assembling economies
The long search for a way to integrate
Our survey shows that PRD manufacturers plan to invest more in automation, which
could boost their productivity and allow them to produce more sophisticated goods
more efficiently. The long-term vision for the region, however, is not just about
moving up the value chain and becoming more services-oriented; it is also about
integrating PRD cities to create a competitive city cluster. The cities’ clear division of
economic functions makes a strong case for a complementary relationship, not just
among themselves (for example, in the form of the three economic circles headed by
Guangzhou, Shenzhen and Zhuhai, respectively) but also with neighbouring Hong
Kong and Macau (Figure 1).
There has been a strong policy push to promote collaboration between Guangdong,
Hong Kong and Macau in the past decades, ranging from the very broad ‘9+2 Pan-
PRD’ concept in the early 2000s that spanned across nine mainland provinces to the
‘Liveable Bay Area’ study proposed in 2009, which focused on the depth of cross-
border integration, involving only four PRD cities on the mainland side. Although
none of these initiatives have truly taken off, deepening Guangdong-Hong Kong-
Macau cooperation remains a staple policy in the region.
The Big Bay Area’s rise to fame
This brings us to the latest iteration of the region’s cross-border integration grand
plan – the ‘Guangdong-Hong Kong-Macau Big Bay Area’ (or ‘Big Bay Area’). First
mentioned in the main text of the action plan for the Belt and Road initiative in 2015,
Big Bay Area was mentioned again in Premier Li Keqiang’s annual work report at the
start of the National People’s Congress in March this year. The combination of
Figure 1: The economic circles and functional specialisation that the ‘Big Bay Area’ is grounded on
The nine Guangdong cities plus Hong Kong and Macau that make up the proposed ‘Big Bay Area’
Source: Standard Chartered Research
HuizhouGuangzhou
Foshan
Jiangmen
Zhaoqing
Macau(Centre of tourism and leisure)
Hainan
Shenzhen
Dongguan
Zhuhai
Zhongshan
Guangzhou-Foshan-ZhaoqingEconomic Circle
Shenzhen-Dongguan-Huizhou Economic Circle
Zhuhai-Zhongshan-JiangmenEconomic Circle
Technological research and innovation
Modern services
International high-end manufacturing
Advanced manufacturing
(petrochemical in Huizhou)
Hong Kong(International financial and
logistics centre)
PRD cities can collectively achieve
much more through integration
Page 32
Special Report: Shop Talk – China, ASEAN and the future
14 June 2017 32
Big
Bay A
rea
having a ‘national strategy’ status and being Belt and Road-compatible from the get-
go has helped the plan generate plenty of attention and, more importantly,
momentum. The National Development and Reform Commission (NDRC) is
scheduled to make proposals on the plan to the State Council in Q4-2017.
Economic and policy synergies
The Big Bay Area spans across Hong Kong, Macau and nine cities in the Guangdong
province – Guangzhou, Shenzhen, Zhuhai, Foshan, Zhongshan, Dongguan, Huizhou,
Jiangmen and Zhaoqing. This gives the city cluster a mix of economies with
complementary functions. Shenzhen is fast making a name for itself as China’s hub
of technology innovation, the nation’s Silicon Valley for hardware makers. Meanwhile,
Guangzhou, already a provincial leader in areas like culture, education and
healthcare, is well positioned as a modern services centre. Both cities are set to
benefit tremendously from Hong Kong’s international reach and financial prowess.
Their combined influence is expected to radiate to the rest of the Big Bay Area, which
is being set up to move up the manufacturing value chain.
The authorities are not hiding the fact that the Big Bay Area is designed to mirror –
and compete with – other successful bay areas in the world, such as those in San
Francisco, New York and Tokyo. Domestically there is also growing comparison
between the Big Bay Area and the Xiongan New Area project, with both projects
seen as the two new growth poles for China’s economy. Championed by President Xi
Jinping, China announced in April a plan to build an international metropolis involving
three counties of the Hebei province; this Xiongan New Area is set to integrate with
Beijing and Tianjin to form another city cluster, and aims to curb urban sprawl and
tackle other developmental challenges.
The Big Bay Area plan has synergies with other major national strategies such as the
‘Made in China 2025’ campaign and the Belt and Road initiative. Made in China 2015
calls for a similar manufacturing upgrade through innovation. A State Council policy
paper in 2016 on deepening PRD cooperation also mentioned the strategic
importance of the Big Bay Area’s geographical location, placing it squarely on the
21st Century Maritime Silk Road, to allow the city cluster’s economic influence to
radiate out to the Southeast Asia and South Asia regions.
Plenty of challenges remain
Growing the PRD into a full-fledged Big Bay Area will not be without its challenges,
however. Topping the list is the need for freer cross-border flows in terms of people,
goods, services, capital and information. Much progress has already been made in
the past 10-15 years due to China’s conscious policy push – partly to support Hong
Kong and Macau, but chiefly to facilitate the opening of the mainland economy and
financial markets:
The Closer Economic Partnership Arrangement (CEPA), launched in 2003, has
eliminated tariffs and lowered non-tariff barriers in both goods and services trade
between China and Hong Kong over the years.
The Individual Visit Scheme, also launched in 2003, allows travellers from
mainland China to visit Hong Kong and Macau on an individual basis. The surge
in mainland visitors since then reshaped Hong Kong’s retail sector and Macau’s
gaming business.
Synergy comes from the clear
division of economic functions
Page 33
Special Report: Shop Talk – China, ASEAN and the future
14 June 2017 33
Big
Bay A
rea
Cross-border capital flows have also increased sharply since the start of
Renminbi internationalisation at the turn of the decade; Guangdong now has its
own new free trade zone (made up of three economic zones in Qianhai, Hengqin
and Nansha, each located in a different city serving a different niche), which may
mean more financial liberalisation going forward.
Mega-infrastructure projects designed to link the entire PRD region are
underway. The Hong Kong-Zhuhai-Macao Bridge is, for example, set to bring the
western PRD into Hong Kong’s 3-hour-commuting radius.
Yet, many hurdles remain. The Guangdong authorities have, for example, called on
Hong Kong and Macau to relax visa screening and allow on-arrival visas for
mainlanders. This may not be welcomed by Hong Kong residents who have been
chafing under the social strain of the influx of mainland visitors over the past years.
Ongoing controversies around joint-border crossing arrangements at the planned
high-speed railway station in Hong Kong also illustrates the tough balancing act
between opening up and preserving the valuable ‘one country, two systems’
principle. This is something bay area regions elsewhere do not face, as their
cities/counties operate under the same system.
We have also seen China’s recent window guidance on capital outflows prompting
worries about a setback in Renminbi globalisation. Offshore market activity has been
shrinking as genuine Renminbi users are deciding to stay on the sidelines for now.
Simply having a more stable Renminbi YTD has not been enough to restore market
confidence in the currency. Persistent capital outflow pressure means that capital
controls are unlikely to be materially reversed in 2017.
There are also concerns over negative externalities, such as regional integration.
Would people in the Big Bay Area be willing to share the many urban woes, including
overcrowding, heavy pollution and congestion? What about the impact on jobs,
businesses and housing as cities’ economic profiles change?
All these legal, social and practical issues will need time to resolve, in our view. In the
meantime, the absence of truly free cross-border flows may cap the Big Bay Area’s
potential, not least because the cities within will probably not be able or willing to
commit to full spatial integration and functional specialisation.
Coming together
The Big Bay Area initiative appears to the long-awaited and much-needed blueprint
that the PRD’s manufacturers have awaited, which is expected to fulfil policy-makers’
promise to deepen coordination within the Guangdong province and with Hong Kong
and Macau. The potential synergies could create a ‘super city’ cluster which could
underpin China’s economic growth and support its Belt and Road aspirations for
decades to come. These potential gains should provide a solid incentive for all the
parties involved – policy makers, residents, financial markets and manufacturers
across the PRD – to come together and cooperate in achieving regional synergies.
Plenty of policy coordination is
needed to resolve potential legal,
social and practical issues
Page 34
ASEAN – Rising interest from Northeast Asia Edward Lee +65 6596 8252
[email protected]
Head, ASEAN Economic Research
Standard Chartered Bank, Singapore Branch
Tony Phoo +886 2 6603 2640
[email protected]
Senior Economist, NEA
Standard Chartered Bank (Taiwan) Limited
Aldian Taloputra +62 21 2555 0596
[email protected]
Senior Economist, Indonesia
Standard Chartered Bank, Indonesia Branch
Page 35
Special Report: Shop Talk – China, ASEAN and the future
14 June 2017 35
AS
EA
N
ASEAN – Rising interest from Northeast Asia
The manufacturing and financial sectors attract the most FDI
FDI flows into ASEAN remained strong at USD 126bn as of 2015, slightly above USD
124bn in 2014 and above USD 120bn reached in 2013, based on the latest available
data from United Nations Conference on Trade and Development (UNCTAD).
In 2015, FDI into ASEAN made up about 7% of global FDI. While this is lower than
9.8% in 2014, it is still above the average of 6% over 2005-14. ASEAN’s share of
global FDI may have been lowered on account of strong flows into developed
markets due to a spike in M&A activity and corporate reconfiguration driving the 38%
surge in global FDI in 2015, which lowered ASEAN’s share of global FDI. We see
ASEAN’s share of global FDI rebounding from here, as it remains an attractive
investment destination. Comparatively, China’s share of global FDI was 7.7% and
India’s 2.5% in 2015.
Among ASEAN’s many attractions are its ample and cost-efficient labour supply,
improving infrastructure, multiple trade pacts, supportive investment policies, regional
stability, increasing wealth and rapid economic growth. US’ withdrawal from the
Trans-Pacific Partnership (TPP) trade pact raised concerns about its effect on
investment in ASEAN and Vietnam in particular, which would have been a key
beneficiary. But according to our PRD survey, the TPP was just one of many reasons
cited for investing in ASEAN, and it was not the most important reason.
Since 2015, FDI to ASEAN has grown at a CAGR of 12%. Comparatively, FDI has
grown 6% globally and 10% in Asia. With rising labour costs becoming a persistent
problem in China, ASEAN continues to receive investment from Northeast Asia as
manufacturers look for cheaper production centres. The risk of US trade
protectionism, which would affect China substantially, has also encouraged
companies to diversify production sources away from China.
Based on 2013-15 aggregate data, the European Union (EU) remains ASEAN’s largest
investor, accounting for 19% of its total FDI in 2013-15. Intra-regional investment is
second, accounting for 17%; with the CLMV region (Cambodia, Laos, Myanmar and
Vietnam) receiving c.26% of FDI from other ASEAN countries. Comparatively, ASEAN
ex-CLMV receives only about 16% of its investment from the region.
Figure 1: Steady FDI trend in ASEAN, despite the 2015
commodity price plunge
% of total FDI to ASEAN
Figure 2: Top 10 sources of FDI into ASEAN
USD bn; aggregate from 2013-15
Source: UNCTAD, Standard Chartered Research Source: ASEAN Secretariat, Standard Chartered Research
48% 52%
0 10 20 30 40 50 60
ASEAN (% of global FDI)
ASEAN (% of Asia FDI)
Singapore
Indonesia
Thailand
Malaysia
Vietnam
Philippines
Myanmar
Cambodia
Brunei
Laos 2015
Average (2005-14)
0 20 40 60 80
European Union
ASEAN
Japan
USA
China
Hong Kong
Republic of Korea
Australia
Taiwan
New Zealand
Thousands
ASEAN continues to see strong FDI
inflows, almost matching FDI into
China and twice that of India in 2015
Page 36
Special Report: Shop Talk – China, ASEAN and the future
14 June 2017 36
AS
EA
N
Japan is ASEAN’s third-largest source of FDI, with heavy investment in Thailand,
Indonesia and Singapore. FDI from China, Korea and Taiwan is also steadily
increasing in terms of share of total FDI. These three countries accounted for about
14% of total FDI in ASEAN in 2015, up from 10% in 2013. The top nine investors
(excluding ASEAN) account for about 65% of the region’s total FDI, five of which
(Japan, China, Korea, Australia and India) have FTAs with ASEAN.
Finance and manufacturing are preferred sectors for FDI
By sector, FDI in ASEAN favours the financial and insurance sectors, followed by
manufacturing. These sectors attracted close to 60% of total FDI into ASEAN in 2015.
They are followed by wholesale and retail trade, real estate and primary industries.
FDI into Singapore’s financial and insurance sectors potentially accounts for a good
share of this sector’s FDI within ASEAN. Comparatively, manufacturing investment is
more spatially distributed. Unsurprisingly, countries with lower wage costs attract a
fair amount of manufacturing FDI interest. Vietnam has been a standout, and is cited
as one of PRD manufacturers’ lowest-cost destinations for production relocation.
Electronics manufacturing investment in Vietnam has risen sharply in recent years for
this reason.
Indonesia also sees a high amount of manufacturing FDI interest in the food, paper
and printing, pharmaceutical, and machinery and electronics industries. Thailand’s
automobile industry continues to attract the bulk of its FDI (mainly from Japan),
followed by computers and electronics.
Figure 3: Stable FDI trend in recent years
Total FDI into ASEAN (USD bn); % of ASEAN GDP (RHS)
Figure 4: ASEAN-6 attracts 95% of total FDI to ASEAN
USD bn, 2015
Source: UNCTAD, Standard Chartered Research Source: UNCTAD, Standard Chartered Research
Figure 5: Manufacturing is favoured in less costly countries
% of FDI
Agriculture Mining Manufacturing Utilities Construction Services
Vietnam Neg. Neg. 65 5 Neg. 28
Indonesia 5 9 57 7 Neg. 19
Malaysia Neg. 7 52 Neg. Neg. 39
Thailand Neg. Neg. 45 Neg. Neg. 52
Philippines Neg. Neg. 44 26 Neg. 27
Myanmar Neg. 36 12 29 Neg. 22
Singapore Neg. Neg. 14 Neg. Neg. 86
*Neg. – less than 5%; Source: Various official websites, Standard Chartered Research
ASEAN
% of ASEAN GDP
0%
1%
2%
3%
4%
5%
6%
7%
0
20
40
60
80
100
120
140
2007 2008 2009 2010 2011 2012 2013 2014 2015
65
16 12 11 11
5 3 2 1 0.2
0
10
20
30
40
50
60
70
SG ID VN MY TH PH MM KH LA BN
Vietnam has risen in the FDI ranking within ASEAN in recent years
ASEAN’s financial and
manufacturing sectors receive the
largest share of FDI; countries with
lower wage costs draw strong
manufacturing FDI interest
Page 37
Special Report: Shop Talk – China, ASEAN and the future
14 June 2017 37
AS
EA
N
A closer look at investment from Northeast Asia
Rising labour costs in China have been a key driver of manufacturing FDI into
ASEAN in the past few years. The shifting FDI trends indicate an increasing
awareness of the region as an attractive investment destination – not merely from a
production perspective but also for its growing domestic markets, backed by strong
economic growth prospects and rising consumer wealth.
The Northeast Asian region has traditionally been a manufacturing powerhouse.
However, FDI from Northeast Asia into ASEAN has increased in recent years, to
account for 32% of ASEAN’s global FDI, up from 23% in 2010.
Japan remains Northeast Asia’s largest FDI source in ASEAN. Japan has been a key
investor in ASEAN for many years, making investing substantially in Thailand’s
automobile industry and increasingly in Indonesia. Japan’s FDI in ASEAN is
estimated at about USD 58bn over 2013-15, with Thailand and Indonesia absorbing
almost 60%. Almost 50% of Japan’s FDI in the region goes to the manufacturing
sector and c.27% to the financial and insurance sectors (Figure 10).
China was the second-largest investor from Northeast Asia in ASEAN, with
Singapore taking the lion’s share of c.60% out of the total USD 22bn. China’s FDI in
other ASEAN countries is smaller, with Vietnam, Cambodia and Laos in the top five.
China’s FDI in ASEAN is primarily in the real estate and finance/insurance sectors
(which together account for c.50% of its total FDI); manufacturing is third, at 14%.
This may explain why Singapore takes the lion’s share of China’s FDI. Investment in
construction is still relatively low; however, this could grow as China embarks on
more infrastructure projects within the region through its Belt and Road initiative.
South Korea is also a large FDI source for ASEAN, investing about USD 16bn over
2013-15. The bulk of Korea’s FDI goes to Vietnam (c.54%). This is in line with FDI
data by sector, which shows that 50% of its FDI was in manufacturing. Meanwhile,
the increase in Vietnam’s electronic manufacturing capacity reflects the increased
value-add of the country’s manufacturing and exports. Korea also invests in
wholesale and retail in ASEAN (c.19%). While no further data granularity is available,
we think this could be attributable to Korean companies tapping rising consumer
wealth in the region.
Figure 6: Finance and manufacturing are favourite FDI
sectors
% of total investment in ASEAN, 2015
Figure 7: Northeast Asia has become a larger source of
FDI in ASEAN
USD bn; as % of global FDI into ASEAN (RHS)
Source: UNCTAD, Standard Chartered Research Source: ASEAN Secretariat, Standard Chartered Research
0 5 10 15 20 25 30 35
Financial and Insurance
Manufacturing
Wholesale and retail trade; repair of motor vehicles and motor cycles
Real estate
Mining and quarrying
Agriculture, forestry, and fishing
USD bn
% of global FDI (RHS)
0%
5%
10%
15%
20%
25%
30%
35%
40%
0
5
10
15
20
25
30
35
40
45
2010 2011 2012 2013 2014 2015
Japan remains the largest FDI
source from Northeast Asia
Page 38
Special Report: Shop Talk – China, ASEAN and the future
14 June 2017 38
AS
EA
N
With production costs rising in China, Taiwan manufacturers have also progressively
moved production to ASEAN in recent years. Interestingly, Taiwan invested heavily in
Singapore over 2013-15, largely in the island-state’s finance sector to tap increased
interest in the region (i.e., following clients’ strategy). This is reflected in Taiwan’s
heavy investment in Vietnam (c.20% of FDI), likely in manufacturing (c.30%). We
expect Taiwan to continue investing in ASEAN in the manufacturing sector – it has
invested heavily in textiles, garments and shoes (as shown by Cambodia placing
third in the top five ASEAN investment destinations) and may invest more
significantly in electronics as labour skills improve in the region.
Figure 8: Korea and Taiwan have increased FDI into ASEAN in recent years
% of FDI from Northeast Asia
Source: ASEAN Secretariat, Standard Chartered Research
JP
CN
KR
HK
TW
0%
10%
20%
30%
40%
50%
60%
70%
80%
90%
100%
2010 2011 2012 2013 2014 2015
Page 39
Special Report: Shop Talk – China, ASEAN and the future
14 June 2017 39
AS
EA
N
Figure 9: Thailand and Indonesia benefit from Japan’s FDI
in automobiles
% of Japan ASEAN FDI (top 5 destinations); 2013-15
Figure 10: Japan’s FDI goes mainly to the manufacturing
sector in ASEAN
% of Japan ASEAN FDI (top 5 sectors); 2013-15
Source: ASEANstat, Standard Chartered Research Source: ASEANstat, Standard Chartered Research
Figure 11: Korean FDI favours Vietnam
% of Korea ASEAN FDI (top 5 destinations); 2013-15
Figure 12: Korean FDI is heavily skewed to manufacturing
% of Korea ASEAN FDI (top 5 sectors); 2013-15
Source: ASEANstat, Standard Chartered Research Source: ASEANstat, Standard Chartered Research
0%
5%
10%
15%
20%
25%
30%
35%
TH ID SG MY VN
0%
10%
20%
30%
40%
50%
60%
Manuf. Fin./ins. Wholesale/retail Mining Real estate
0%
10%
20%
30%
40%
50%
60%
VN SG ID TH PH
0%
10%
20%
30%
40%
50%
60%
Manuf. Wholesale/retail Fin./ins. Real estate Elec. Construct.
Figure 13: Singapore is China’s favoured destination
% of China ASEAN FDI (top 5 destinations); 2013-15
Figure 14: China FDI favours real estate and finance
% of China ASEAN FDI (top 5 sectors); 2013-15
Source: ASEANstat, Standard Chartered Research Source: ASEANstat, Standard Chartered Research
0%
10%
20%
30%
40%
50%
60%
SG ID VN KH LA
0%
5%
10%
15%
20%
25%
30%
Real estate Fin./ins. Manuf. Mining Wholesale/retail
Page 40
Special Report: Shop Talk – China, ASEAN and the future
14 June 2017 40
AS
EA
N
Figure 15: Singapore takes top spot as Taiwan banks
follow their clients into ASEAN
% of Taiwan ASEAN FDI (top 5 destinations); 2013-15
Figure 16: ASEAN should continue to see manufacturing
FDI from Taiwan
% of Taiwan ASEAN FDI (top 5 sectors); 2013-15
Source: ASEANstat, Standard Chartered Research Source: ASEANstat, Standard Chartered Research
Figure 17: Hong Kong FDI goes largely to Singapore
% of Hong Kong ASEAN FDI (top 5 destinations); 2013-15
Figure 18: Hong Kong FDI favours the finance sector
% of Hong Kong ASEAN FDI (top 5 sectors); 2013-15
Source: ASEANstat, Standard Chartered Research Source: ASEANstat, Standard Chartered Research
0%
10%
20%
30%
40%
50%
60%
70%
SG VN KH TH PH
0%
5%
10%
15%
20%
25%
30%
35%
40%
45%
Fin./ins. Manuf. Wholesale/retail Real estate Elec.
0%
5%
10%
15%
20%
25%
30%
35%
40%
45%
50%
SG MY VN ID PH
0%
5%
10%
15%
20%
25%
30%
35%
40%
45%
50%
Fin./ins. Manuf. Real estate Wholesale/retail Info comm.
Page 41
Special Report: Shop Talk – China, ASEAN and the future
14 June 2017 41
AS
EA
N
Taiwan investors are upbeat on ASEAN
Taiwan investors are positive about ASEAN’s near-term prospects, in our view. 67%
of the Taiwan clients who participated in our latest PRD survey are positive on the
region’s growth outlook, versus only 34% of all participants (excluding Taiwan).
The PRD survey results echo the findings in a separate survey that we conducted of
Taiwan producers based in ASEAN, in which nine out of a total of 14 polled planned
to boost investment in the region in 2017. They expect sales revenues in the region
to pick up by about 10-20% this year, and see ASEAN contribution to their production
output rising in the next 12-24 months. We think this supports the case for ASEAN as
a preferred alternative production base for Taiwan manufacturers seeking to move
out of China.
Our PRD survey results show that 42% of Taiwan corporates that we polled prefer to
shift capacity offshore rather than increase investment in capital equipment and/or
automation – notably higher than 14% of all respondents ex-Taiwan. We think this
reflects continued pressure on Taiwan’s manufacturers to relocate away from China
on account of the rapidly changing operating landscape, partly driven by rising
production costs.
This is especially true for wage-cost savings, as more than half of the Taiwan
manufacturers who participated in our PRD survey expect savings of 10% or more
from relocating production outside China. This is also in line with the results from our
separate survey, in which eight out of 14 Taiwan manufacturers indicated that labour
costs amounted to 10-50% of their total factory production costs.
Other than lower wage costs, Taiwanese producers have also chosen to relocate to
ASEAN due to several other factors; including demand from global brand names to
diversify production capacity elsewhere and on expectations of faster economic
growth in the region which offers the opportunity to tap rising domestic-market
demand. In our separate survey, only three out of 14 indicated that they picked
ASEAN as a base primarily for FTA-related benefits. But more than half indicated
they welcomed government policy and/or incentives enhancing business
competitiveness in the region, including improved infrastructure, availability of talent,
better rule of law and regulations, a benign tax policy and other incentives.
Spoilt for choice – Indonesia or Vietnam?
In our discussions with real-sector investors regarding FDI preferences, Vietnam and
Indonesia typically came up as destinations of interest. Indeed, these two economies
have received roughly similar levels of FDI. In 2015, Indonesia and Vietnam ranked
second and third, respectively, in terms of FDI within ASEAN.
However, our survey showed that Northeast Asian manufacturers relocating
production from China – notably Taiwan – heavily preferred Vietnam over Indonesia.
We also found this to be true of Korean investors. Japan invests heavily in
Indonesia’s manufacturing sector, but we believe this is primarily in the automobile
sector for domestic consumption. China is a growing investor in ASEAN, directing a
similar amount of FDI to Vietnam and Indonesia. Given the strong FDI interest in
these two countries and apparently different reception from Northeast Asian
investors, we provide below a comparative analysis between Indonesia and Vietnam.
Taiwan manufacturers are generally
upbeat about ASEAN; most will
consider increasing capex in the
region
Taiwan investors are showing a
greater preference to relocate due
to rising production costs in China
ASEAN is also preferred for its
domestic market potential
Vietnam and Indonesia are the most
preferred FDI destinations
Page 42
Special Report: Shop Talk – China, ASEAN and the future
14 June 2017 42
AS
EA
N
Our PRD surveys show that foreign investors typically consider factors such as
labour supply, domestic market demand, operational cost and environment when
making investment decisions. We highlight a few interesting comparisons between
the two countries below.
In terms of domestic market size, Indonesia is much larger. Its population of roughly
255mn is about 2.7x Vietnam’s. Indonesia’s population is also slightly younger and
growing at a faster annual rate of about 1.3% versus 1.1% for Vietnam. Indonesia’s
household consumption amounted to USD 491bn worth of spending in 2015, about
3.7x Vietnam’s.
However, Vietnam’s household spending has been increasing at a much faster rate.
Comparing the data over 2010-15, Vietnam households increased their spending by
a CAGR of 11% versus 3% in Indonesia. This translates to an increase of USD 54bn,
slightly lower than Indonesia’s USD 67bn. Vietnam also has plenty of room to catch
up in terms of urbanisation. Indonesia’s urbanisation rate reached nearly 54% as of
2015, while Vietnam’s was 34%. If Vietnam catches up on the urbanisation gap, this
could boost its GDP per capita growth, which has been seen to correlate positively
with the urbanisation rate.
In terms of labour market supply, Indonesia has the more favourable demographics.
Its labour force, at about 127mn as of 2016, is roughly 2.3x Vietnam’s, and with a
slightly more youthful median age. Based on a survey by the Japan External Trade
Organisation, however, the monthly wages of a manufacturing worker in Indonesia
are about USD 298, significantly higher than USD 204 in Vietnam. Both countries
saw an increase in wages of about 10-11% per annum in 2015-16.
The two economies’ export profiles may shed more light on the competitive
advantages they offer. Vietnam is an export-oriented economy – despite its smaller
size, it exports more than Indonesia in both absolute and percentage-of-GDP terms
(Figure 21). Furthermore, electronics and textiles make up a considerable portion of
Vietnam’s total exports (Figures 22 and 23). Comparatively, Indonesia’s exports are
commodity-heavy. This may reflect the variation in the operating environments of
these sectors and explain the differences in the countries’ FDI patterns.
Figure 19: Indonesia dwarfs Vietnam in GDP terms
USD bn, 2015
Figure 20: Vietnam has room to catch up
Urbanisation, % (x-axis) vs GDP per capita, USD (y-axis),
1961-2015
Source: CEIC, Standard Chartered Research Source: IMF, World Bank, Standard Chartered Research
Total GDP
Private consumption
0
100
200
300
400
500
600
700
800
900
ID VN
0
500
1,000
1,500
2,000
2,500
3,000
5 10 15 20 25 30 35 40 45 50 55
Cambodia Indonesia
Lao PDR Vietnam
50% mark in urbanisation
Indonesia has a larger domestic
market and younger population but
Vietnam has better growth potential
Page 43
Special Report: Shop Talk – China, ASEAN and the future
14 June 2017 43
AS
EA
N
Figure 21: Vietnam is an export powerhouse
Total exports, USD bn (LHS); exports as % of GDP (RHS)
Source: CEIC, Standard Chartered Research
Figure 22: Commodities make up a large share of
Indonesia’s exports
% share of total exports – top 5
Figure 23: Vietnam has the export advantage in
electronics and textiles
% share of total exports – Top 5
Source: CEIC, Standard Chartered Research Source: CEIC, Standard Chartered Research
0%
10%
20%
30%
40%
50%
60%
70%
80%
90%
100%
0
20
40
60
80
100
120
140
160
180
200
ID VN
Total exports % of GDP (RHS)
0
2
4
6
8
10
12
14
16
18
20
Mineral fuels Animal/Veg fats & oils
Machinery, electronics
Textile Chemicals
55% of total
exports
0
2
4
6
8
10
12
14
16
18
20
Phones Textile Electronics parts
Footwear Wood pdts
55% of total
exports
Page 44
Special Report: Shop Talk – China, ASEAN and the future
14 June 2017 44
AS
EA
N
Indonesia – Searching for a new growth engine
Competing for FDI flows
We believe FDI will be Indonesia’s next growth catalyst. As the commodity boom
cycle seems to have passed, and fiscal and monetary expansion nears the end of the
road, the country needs a new growth engine. In light of this, Indonesia is
transforming to a higher-value-added manufacturing profile. This will require
financing, advanced technology, human capital and infrastructure – in which FDI will
likely play a substantial part. Attracting FDI will be imperative to accelerate
Indonesia’s desired transformation. We discuss below Indonesia’s FDI trends and its
government’s recent efforts to boost investment in the country.
FDI into Indonesia rebounded in 2016, according to Bank Indonesia (BI) data, with
net FDI flows up more than 60% y/y to IDR 16bn. In gross terms, however, FDI
dropped to USD 3bn due to asset ownership transfers during the country’s tax
amnesty programme (Figure 1). Some residents reclaimed direct ownership of local
asset that previously owned through an overseas special purpose vehicle. This was
recorded both as a foreign outflow and inflow from overseas resident investment.
Gross FDI flows slipped 1.9% y/y in Q1-2017.
Indonesia’s FDI flow trends have evolved in the past decade (Figure 25).
Communications (tertiary sector) saw the biggest inflows at the beginning of 2000,
when it accounted for around 50% of FDI in 2003, based on investment agency data.
Mining (primary sector) attracted investment during the commodity boom in 2011, but
has eased recently along with the cycle. Investment in manufacturing (secondary)
has started to see more traction with the government recently addressing the
investment climate and lack of connectivity. Metal, machinery, electronics, chemicals,
pharmaceuticals and paper industries accounted for 33% of total FDI flows in 2016.
In terms of FDI sources, the picture has been relatively unchanged. Singapore
remains the biggest source of FDI into Indonesia, accounting for almost a third of
total FDI flows in 2016, followed by Japan (19%), US (10%) and China (9%).
Interestingly, FDI from China grew fourfold in 2016 to c.USD 3bn.
Besides providing more sustainable financing for a developing country, FDI is
supportive to growth through the expansion of scale economies, tapping the global
supply chain, promoting the transfer of technology, good governance, and job
creation. A 2012 study by the Research Institute of Industrial Economics suggests
Figure 24: Gross FDI drop due to asset transfer during tax
amnesty in 2016 (FDI, USD bn)
Figure 25: FDI flows have shifted to manufacturing sector
Share of FDI by sector, %
Source: CEIC, Standard Chartered Research Source: CEIC, Standard Chartered Research
Gross
Net
-5
0
5
10
15
20
25
2004 2005 2006 2007 2008 2009 2010 2011 2012 2013 2014 2015 2016
Primary sector
Secondary sector
Tertiary sector
0%
10%
20%
30%
40%
50%
60%
70%
80%
90%
100%
2000 2005 2010 2015 2016
FDI has rebounded, driven by
investment in manufacturing
FDI plays an important role in
boosting economic growth
Page 45
Special Report: Shop Talk – China, ASEAN and the future
14 June 2017 45
AS
EA
N
that productivity (measured by value added per worker) of foreign-owned
corporations in Indonesia is six times that of domestic corporations. FDI has also
been shown to help develop the upstream production chain in providing input
components. Toyota Motor Manufacturing Indonesia, for instance, is estimated to
increase the local content in its products to 65% by 2018 and to 75% by 2019
through using domestically produced raw material, such as plastics and steel.
We expect gross FDI inflows to Indonesia to recover this year and approach the 2015
level of USD 15bn (or up 325% y/y) on a low base effect, but remaining below the
USD 21bn high reached in 2014. Stronger growth momentum, progress in
infrastructure development, and an improving investment climate are likely FDI
drivers. UNCTAD projects that global FDI will grow 5% y/y to USD 1.8tn in 2017, with
flows to developing Asia reaching USD 515bn, an increase of 15% y/y. The agency’s
latest business survey in 2017 ranks Indonesia the fourth-most favoured destination
for FDI (from number 8 in 2016) after the US, China and India (Figure 31). We expect
the country’s manufacturing sector to continue to attract FDI, followed by utilities,
mining and industrial estate.
Economic reforms aim to improve investment climate
The government has released a series of economic reforms to address the
investment climate; this has started to show results. Indonesia’s rank in World Bank’s
Ease of Doing Business survey rose to 91 in 2017, from 106 previously. This was
likely driven by an improvement in the ease of starting a business, getting electricity,
paying taxes and obtaining credit in the country. Indonesia now ranks number 6
among 10 ASEAN countries, higher than the Philippines, Cambodia, Laos and
Myanmar. Nevertheless, continued reforms are needed as Indonesia remains below
the ASEAN average on most investment aspects, especially enforcing contracts
(Figure 26). We list below the key reforms that could have significant impact on
improving the investment climate.
Cutting red tape. The investment coordinating board BKPM has launched
unified investment licensing services in 22 government institutions which were
previously run separately. It has introduced a three-hour service turnaround for
business licences for a minimum investment of IDR 100bn and/or the hire of
1,000 workers; previously, the turnaround was around 23 days. The government
has also revoked 3,143 local regulations that are seen to hamper investment and
against higher hierarchy regulations by the central government.
Figure 26: Indonesia’s Ease of Doing Business rank has improved, but needs
to improve further to catch up with the ASEAN average (World Bank’s Ease of
doing business survey, 2017)
Source: World Bank, Standard Chartered Research
0
20
40
60
80 Starting business
Dealing with construction permits
Getting electricity
Registering property
Getting credit
Protecting minority interest
Paying taxes
Trading across borders
Enforcing contracts
Resolving insolvency
2017
2016
ASEAN
Stronger growth momentum and
structural reform to attract higher
FDI flows in 2017
Indonesia’s rank in World Bank’s
Ease of Doing Business jumped to
91 in 2017 from 106 prior
Page 46
Special Report: Shop Talk – China, ASEAN and the future
14 June 2017 46
AS
EA
N
Revising the investment ‘negative list’ to allow more foreign investment in 84
sectors, such as cold storage, films and medical raw materials.
Simplifying minimum wage formulation. The annual adjustment in the
minimum wage calculation is now based on CPI inflation plus GDP growth. The
increase in the monthly minimum wage was 7.3% y/y in 2017, lower than the
14% hike in 2016 before the introduction of the wage cap.
Tax incentive. The government revised the tax-holiday regulation in 2015,
allowing a tax holiday for corporates that invest a minimum of IDR 1tn in key
industries, such as petrochemicals, machinery, agriculture, maritime transport
and upstream oil and gas companies. The government awarded a tax holiday to
four companies with an investment value of USD2.3bn in 2015.
Making progress on infrastructure projects
The government plans to boost infrastructure spending to USD 360bn over 2015-19
as part of its policy to improve connectivity and lowering logistics costs, which are
needed to boost FDI. The new infrastructure plan comprises 245 projects and two
programmes, including electricity and the development of small/medium aircraft.
According to the government, 10 projects were completed in May, 120 projects are
under construction, and 12 projects are in the procurement stage.
The government’s budget remains the main source of financing for the infrastructure
projects, but it can finance only 40% of the total financing requirement. The biggest
chunk of financing will likely come from the private sector and SOEs (Figure 30). We list
below some selected policies to promote private-sector investment in infrastructure:
Expediting land acquisition. The government’s law No. 2/2012 on land
acquisition for public purposes lays out a stricter judicial process on land price
disputes and requires the involvement of independent land appraisal. Per the
law, the time to acquire land can be compressed to as little as 100 days without
objection, or a maximum 518 days on objections from landowners. Furthermore,
the government has formed a special public service agency (BLU LMAN) to
manage the land fund. The agency has more flexibility in allocating the budget
as it is excluded from the common budgeting process.
Facilitating Public Private Partnerships (PPPs). The government is creating
various facilities to provide support along a project’s life cycle (Figure 29). The
latest facility to be introduced is availability payment (AP), which guarantees the
Figure 27: Around half of the national strategic projects
are under construction as of May
Figure 28: SOE bond issuance increases sharply
SOE bond issuance, IDR tn
*Projects cancelled because National Strategic Project criteria were not fulfilled;
Source: KPPIP, Standard Chartered Research
*2017 is as of May; Source: KSEI, Standard Chartered Research
Completed 20 9%
Under construction
94 42%
Procurement 13 6%
Preparation 83
37%
Cancelled* 15 6%
0
10
20
30
40
50
60
2010 2011 2012 2013 2014 2015 2016 2017*
The government has launched
ambitious infrastructure projects to
boost competitiveness
Measures have been implemented
to promote private-sector
participation
Page 47
Special Report: Shop Talk – China, ASEAN and the future
14 June 2017 47
AS
EA
N
sum of periodical payment after a project is completed. Palapa Ring Broadband is
the most recent PPP project, signed in April, which is supported by the AP facility.
Promoting SOE financing. The government has injected c.IDR 120tn of capital
into SOEs to increase its financing capacity over 2015-17. SOEs raised IDR 53tn
through bond issuance in 2016, double the amount in 2015. Some infrastructure
SOEs construction company raised IDR 10tn from the public by offering a rights
issue in the past two years. The government is also considering SOE asset
securitisation as another alternative scheme to raise financing.
Figure 29: Fiscal facilities to support PPP
Source: KPPIP, Standard Chartered Research
A facility contributing to assist GCA on PPP project preparation (PDF & TA) Managing entity: KPPIP, PT SMI and PT IIF, Ministry of Finance under its new PPP Unit (after establishment)
Contribution to construction cost to increase project financial viability Managing entity: Ministry of Finance Government’s commitment: 49% max per project
Guaranteeing governments contractual obligations under infrastructure concession agreements Managing entity: Indonesia infrastructure Guarantee Fund (IIGF) – wholly owned by MoF Government’s commitment: USD 450mn
MoF regulation on a tax holiday for pioneer sectors, such as base metals, oil refineries, basic petrochemicals, machinery, renewable energy and telecom equipment, to will be further expanded. Managing entity: Ministry of Finance
A scheme in which concessionaires receive a periodical sum of money from the government after the completion of an asset/project Managing entity: Ministry of Finance and Ministry of Home Affairs
A facility to support land acquisition for infrastructure projects, particularly private sector projects and National Strategic Projects. Managing entity: BLU LMAN; Ministry of Finance, Ministry of Agrarian and Land Spatial Government’s commitment: USD 1.2bn (2016) USD 1.5bn (2017)
Project Development
Facility (PDF)
Viability Gap
Funding (VGF) Guarantee Fund Tax Facilities
Availability
Payment Land Acquisition
GOVERNMENT OF INDONESIA
Preparation Bidding Process Construction
Page 48
Special Report: Shop Talk – China, ASEAN and the future
14 June 2017 48
AS
EA
N
Figure 30: Private-sector financing needed to close the financing gap
Infrastructure financing needs, 2015-19, USD bn
Source: MoF, Standard Chartered Research
Figure 31: Indonesia now ranks in the top 5 favoured FDI destinations, up from number 8 previously
UNCTAD business survey, (x) 2016 rank, % of executives responding)
Source: UNCTAD, Standard Chartered Research
Government budget USD 148.5bn (41.25%)
SOE USD 80.0bn (22.23%)
Private USD 131.5bn (36.52%)
Financing gap USD 211.5bn (58.75%)
0 50 100 150 200 250 300 350 400
0 5 10 15 20 25 30 35 40
Australia (13)
Canada (18)
Singapore (18)
Vietnam (14)
Spain (25)
Philippines (9)
Mexico (7)
Germany (5)
UK (4)
Brazil (7)
Thailand (14)
Indonesia (8)
India (3)
China (2)
US (1)
Developed economies
Developing economies
Page 49
Special Report: Shop Talk – China, ASEAN and the future
14 June 2017 49
Global Research Team
Management Team
Dave Murray, CFA +65 6645 6358
Head, Global Research
[email protected]
Standard Chartered Bank, Singapore Branch
Marios Maratheftis +971 4508 3311
Chief Economist
[email protected]
Standard Chartered Bank
Thematic Research
Madhur Jha +44 20 7885 6530
Head, Thematic Research
[email protected]
Standard Chartered Bank
Samantha Amerasinghe +44 20 7885 6625
Economist, Thematic Research
[email protected]
Standard Chartered Bank
Philippe Dauba-Pantanacce +44 20 7885 7277
Global Geopolitical Strategist
[email protected]
Standard Chartered Bank
Global Macro Strategy
Eric Robertsen +65 6596 8950
Head, Global Macro Strategy and FX Research
[email protected]
Standard Chartered Bank, Singapore Branch
Mayank Mishra +65 6596 7466
Macro Strategist
[email protected]
Standard Chartered Bank, Singapore Branch
Becky Liu +852 3983 8563
Head, China Macro Strategy
[email protected]
Standard Chartered Bank (HK) Limited
Geoffrey Kendrick +44 20 7885 6175
Emerging Markets FX & Global Macro Strategist
[email protected]
Standard Chartered Bank
Jeffrey Zhang +852 3983 8540 Fixed Income Strategist
[email protected]
Standard Chartered Bank (HK) Limited
Economic Research
Africa Asia
Razia Khan +44 20 7885 6914
Chief Economist, Africa
[email protected]
Standard Chartered Bank
Victor Lopes +44 20 7885 2110
Senior Economist, Africa
[email protected]
Standard Chartered Bank
Sarah Baynton-Glen +44 20 7885 2330
Economist, Africa
[email protected]
Standard Chartered Bank
Emmanuel Kwapong +44 20 7885 5840
Economist, Africa
[email protected]
Standard Chartered Bank
David Mann +65 6596 8649
Chief Economist, Asia
[email protected]
Standard Chartered Bank, Singapore Branch
Southeast Asia Edward Lee Wee Kok +65 6596 8252
Head, ASEAN Economic Research
[email protected]
Standard Chartered Bank, Singapore Branch
Chidu Narayanan +65 6596 7004
Economist, Asia
[email protected]
Standard Chartered Bank, Singapore Branch
Usara Wilaipich +662 724 8878
Senior Economist, Thailand
[email protected]
Standard Chartered Bank (Thai) Public Company Limited
Aldian Taloputra +62 21 2555 0596
Senior Economist, Indonesia
[email protected]
Standard Chartered Bank, Indonesia Branch
Jonathan Koh +65 6596 1262
Economist, Asia
[email protected]
Standard Chartered Bank, Singapore Branch
South Asia Anubhuti Sahay +91 22 6115 8840
Head, South Asia Economic Research
[email protected]
Standard Chartered Bank, India
Saurav Anand +91 22 6115 8845
Economist, South Asia
[email protected]
Standard Chartered Bank, India
Kanika Pasricha +91 22 6115 8820
Economist, India
[email protected]
Standard Chartered Bank, India
Greater China Shuang Ding +852 3983 8549
Head, Greater China Economic Research
[email protected]
Standard Chartered Bank (HK) Limited
Kelvin Lau +852 3983 8565
Senior Economist, Greater China
[email protected]
Standard Chartered Bank (HK) Limited
Se Yan +86 10 5918 8302
Senior Economist, China
[email protected]
Standard Chartered Bank (China) Limited
Lan Shen +86 10 5918 8261
Economist, China
[email protected]
Standard Chartered Bank (China) Limited
Tony Phoo +886 2 6603 2640
Senior Economist, NEA
[email protected]
Standard Chartered Bank (Taiwan) Limited
Hunter Chan +852 3983 8568
Associate Economist
[email protected]
Standard Chartered Bank (HK) Limited
Korea Chong Hoon Park +82 2 3702 5011
Head, Korea Economic Research
[email protected]
Standard Chartered Bank Korea Limited
Kathleen B. Oh +82 2 3702 5072
Economist, Korea
[email protected]
Standard Chartered Bank Korea Limited
The Americas
Mike Moran +1 212 667 0294
Head, Research, The Americas
[email protected]
Standard Chartered Bank NY Branch
Europe
Sarah Hewin +44 20 7885 6251
Chief Economist, Europe
[email protected]
Standard Chartered Bank
Achilleas Chrysostomou +44 20 7885 6437
Economist, Europe
[email protected]
Standard Chartered Bank
Middle East and North Africa
Dima Jardaneh +971 4 508 3591
Head, Economic Research, MENA
[email protected]
Standard Chartered Bank
Carla Slim +971 4 508 3738
Economist, MENA
[email protected]
Standard Chartered Bank
Bilal Khan +92 21 3245 7839
Senior Economist, MENAP
[email protected]
Standard Chartered Bank (Pakistan) Limited
Page 50
Special Report: Shop Talk – China, ASEAN and the future
14 June 2017 50
FICC Research
Rates Research Credit Research FX Research
Kaushik Rudra +65 6596 8260
Head, Rates & Credit Research
[email protected]
Standard Chartered Bank, Singapore Branch
Nagaraj Kulkarni +65 6596 6738
Senior Asia Rates Strategist
[email protected]
Standard Chartered Bank, Singapore Branch
Arup Ghosh +65 6596 4620
Senior Asia Rates Strategist
[email protected]
Standard Chartered Bank, Singapore Branch
Lawrence Lai +65 6596 8261
Asia Rates and Flow Strategist
[email protected]
Standard Chartered Bank, Singapore Branch
John Davies +44 20 7885 7640
US Rates Strategist
[email protected]
Standard Chartered Bank
Samir Gadio +44 20 7885 8618
Head, Africa Strategy
[email protected]
Standard Chartered Bank
Eva Murigu +25 42 0329 4004
Africa Strategist
[email protected]
Standard Chartered Investment Services Kenya Limited
Kaushik Rudra +65 6596 8260
Head, Rates & Credit Research
[email protected]
Standard Chartered Bank, Singapore Branch
Shankar Narayanaswamy +65 6596 8249
Head, Credit Strategy & Financials
[email protected]
Standard Chartered Bank, Singapore Branch
Bharat Shettigar +65 6596 8251
Head, Asia Ex-China Corporate Credit Research
[email protected]
Standard Chartered Bank, Singapore Branch
Jaiparan Khurana +44 20 7885 6213
Sovereign Strategist
[email protected]
Standard Chartered Bank
Simrin Sandhu +65 6596 6281
Senior Credit Analyst, Financials & Head, ME Credit Research
[email protected]
Standard Chartered Bank, Singapore Branch
Nikolai Jenkins, CFA +65 6596 8259
Credit Analyst, Financials
[email protected]
Standard Chartered Bank, Singapore Branch
Melinda Kohar +65 6596 9543
Credit Analyst
[email protected]
Standard Chartered Bank, Singapore Branch
Eric Robertsen +65 6596 8950
Head, Global Macro Strategy and FX Research
[email protected]
Standard Chartered Bank, Singapore Branch
Robert Minikin +44 20 7885 8674
Head, Asian FX Strategy
[email protected]
Standard Chartered Bank
Nick Verdi +1 646 845 1279
Senior FX Strategist
[email protected]
Standard Chartered Bank NY Branch
Devesh Divya +65 6596 8608
Asia FX Strategist
[email protected]
Standard Chartered Bank, Singapore Branch
Eddie Cheung +852 3983 8566
Asia FX Strategist
[email protected]
Standard Chartered Bank (HK) Limited
Lemon Zhang +65 659 69498
Analyst, FX Research / Global Macro Strategy
[email protected]
Standard Chartered Bank, Singapore Branch
Commodities Research
Paul Horsnell +44 20 7885 6913
Head, Commodities Research
[email protected]
Standard Chartered Bank
Nicholas Snowdon +44 20 7885 2276
Metals Analyst
[email protected]
Standard Chartered Bank
Suki Cooper +1 212 667 0319
[email protected]
Precious Metals Analyst
Standard Chartered Bank NY Branch
Priya Narain Balchandani +65 6596 8254
Energy Analyst
[email protected]
Standard Chartered Bank, Singapore Branch
Judy Zhu +86 21 6168 5016
Metals Analyst
[email protected]
Standard Chartered Bank (China) Limited
Emily Ashford +44 20 7885 7082
Energy Analyst
[email protected]
Standard Chartered Bank
Page 51
Special Report: Shop Talk – China, ASEAN and the future
14 June 2017 51
This page is intentionally blank.
Page 52
Special Report: Shop Talk – China, ASEAN and the future
14 June 2017 52
This page is intentionally blank.
Page 53
Special Report: Shop Talk – China, ASEAN and the future
14 June 2017 53
This page is intentionally blank.
Page 54
Special Report: Shop Talk – China, ASEAN and the future
14 June 2017 54
Disclosures appendix
Analyst Certification Disclosure: The research analyst or analysts responsible for the content of this research report certify that: (1) the views expressed and attributed to the research analyst or analysts in the research report accurately reflect their personal opinion(s) about the subject securities and issuers and/or other subject matter as appropriate; and, (2) no part of his or her compensation was, is or will be directly or indirectly related to the specific recommendations or views contained in this research report. On a general basis, the efficacy of recommendations is a factor in the performance appraisals of analysts.
Global Disclaimer: Standard Chartered Bank and/or its affiliates (“SCB”) makes no representation or warranty of any kind, express, implied or statutory regarding this document or any information contained or referred to in the document (including market data or statistical information). The information in this document, current at the date of publication, is provided for information and discussion purposes only. It does not constitute any offer, recommendation or solicitation to any person to enter into any transaction or adopt any hedging, trading or investment strategy, nor does it constitute any prediction of likely future movements in rates or prices, or represent that any such future movements will not exceed those shown in any illustration. The stated price of the securities mentioned herein, if any, is as of the date indicated and is not any representation that any transaction can be effected at this price. SCB does not represent or warrant that this information is accurate or complete. While reasonable care has been taken in preparing this document and data obtained from sources believed to be reliable, no responsibility or liability is accepted for errors of fact or for any opinion expressed herein. This document does not purport to contain all the information an investor may require and the contents of this document may not be suitable for all investors as it has not been prepared with regard to the specific investment objectives or financial situation of any particular person. Any investments discussed may not be suitable for all investors. Users of this document should seek professional advice regarding the appropriateness of investing in any securities, financial instruments or investment strategies referred to in this document and should understand that statements regarding future prospects may not be realised. Opinions, forecasts, assumptions, estimates, derived valuations, projections and price target(s), if any, contained in this document are as of the date indicated and are subject to change at any time without prior notice. Our recommendations are under constant review. The value and income of any of the securities or financial instruments mentioned in this document can fall as well as rise and an investor may get back less than invested. Future returns are not guaranteed, and a loss of original capital may be incurred. Foreign-currency denominated securities and financial instruments are subject to fluctuation in exchange rates that could have a positive or adverse effect on the value, price or income of such securities and financial instruments. Past performance is not indicative of comparable future results and no representation or warranty is made regarding future performance. While we endeavour to update on a reasonable basis the information and opinions contained herein, we are under no obligation to do so and there may be regulatory, compliance or other reasons that prevent us from doing so. Accordingly, information may be available to us which is not reflected in this document, and we may have acted upon or used the information prior to or immediately following its publication. SCB is acting on a principal-to-principal basis and not acting as your advisor, agent or in any fiduciary capacity to you. SCB is not a legal, regulatory, business, investment, financial and accounting and/or tax adviser, and is not purporting to provide any such advice. Independent legal, regulatory, business, investment, financial and accounting and/or tax advice should be sought for any such queries in respect of any investment. SCB and/or its affiliates may have a position in any of the securities, instruments or currencies mentioned in this document. SCB and/or its affiliates or its respective officers, directors, employee benefit programmes or employees, including persons involved in the preparation or issuance of this document may at any time, to the extent permitted by applicable law and/or regulation, be long or short any securities or financial instruments referred to in this document and on the SCB Research website or have a material interest in any such securities or related investments, or may be the only market maker in relation to such investments, or provide, or have provided advice, investment banking or other services, to issuers of such investments and may have received compensation for these services. SCB has in place policies and procedures and physical information walls between its Research Department and differing public and private business functions to help ensure confidential information, including ‘inside’ information is not disclosed unless in line with its policies and procedures and the rules of its regulators. Data, opinions and other information appearing herein may have been obtained from public sources. SCB expressly disclaims responsibility and makes no representation or warranty as to the accuracy or completeness of such information obtained from public sources. SCB also makes no representation or warranty as to the accuracy nor accepts any responsibility for any information or data contained in any third party’s website. You are advised to make your own independent judgment (with the advice of your professional advisers as necessary) with respect to any matter contained herein and not rely on this document as the basis for making any trading, hedging or investment decision. SCB accepts no liability and will not be liable for any loss or damage arising directly or indirectly (including special, incidental, consequential, punitive or exemplary damages) from the use of this document, howsoever arising, and including any loss, damage or expense arising from, but not limited to, any defect, error, imperfection, fault, mistake or inaccuracy with this document, its contents or associated services, or due to any unavailability of the document or any part thereof or any contents or associated services. This document is for the use of intended recipients only. In any jurisdiction in which distribution to private/retail customers would require registration or licensing of the distributor which the distributor does not currently have, this document is intended solely for distribution to professional and institutional investors. This communication is subject to the terms and conditions of the SCB Research Disclosure Website available at https://research.sc.com/Portal/Public/TermsConditions. The disclaimers set out at the above web link applies to this communication and you are advised to read such terms and conditions / disclaimers before continuing. Additional information, including analyst certification and full research disclosures with respect to any securities referred to herein, will be available upon request by directing such enquiries to [email protected] or clicking on the relevant SCB research report web link(s) referenced herein.
Country-Specific Disclosures – This document is not for distribution to any person or to any jurisdiction in which its distribution would be prohibited. If you are receiving this document in any of the countries listed below, please note the following:
United Kingdom and European Economic Area: SCB is authorised in the United Kingdom by the Prudential Regulation Authority and regulated by the Financial Conduct Authority and the Prudential Regulation Authority. This communication is not directed at Retail Clients in the European Economic Area as defined by Directive 2004/39/EC. Nothing in this document constitutes a personal recommendation or investment advice as defined by Directive 2004/39/EC. Australia: The Australian Financial Services Licence for Standard Chartered Bank is Licence No: 246833 with the following Australian Registered Business Number (ARBN: 097571778). Australian investors should note that this communication was prepared for “wholesale clients” only and is not directed at persons who are “retail clients” as those terms are defined in sections 761G and 761GA of the Corporations Act 2001 (Cth). Bangladesh: This research has not been produced in Bangladesh. The report has been prepared by the research analyst(s) in an autonomous and independent way, including in relation to SCB. THE SECURITIES MENTIONED IN THIS REPORT HAVE NOT BEEN AND WILL NOT BE REGISTERED IN BANGLADESH AND MAY NOT BE OFFERED OR SOLD IN BANGLADESH WITHOUT PRIOR APPROVAL OF THE REGULATORY AUTHORITIES IN BANGLADESH. Any subsequent action(s) of the Recipient of these research reports in this area should be subject to compliance with all relevant law & regulations of Bangladesh; specially the prevailing foreign exchange control regulations. Botswana: This document is being distributed in Botswana by, and is attributable to, Standard Chartered Bank Botswana Limited which is a financial institution licensed under the Section 6 of the Banking Act CAP 46.04 and is listed in the Botswana Stock Exchange. Brazil: SCB disclosures pursuant to the Securities Exchange Commission of Brazil (“CVM”) Instruction 483/10: This research has not been produced in Brazil. The report has been prepared by the research analyst(s) in an autonomous and independent way, including in relation to SCB. THE SECURITIES MENTIONED IN THIS REPORT HAVE NOT BEEN AND WILL NOT BE REGISTERED PURSUANT TO THE REQUIREMENTS OF THE SECURITIES AND EXCHANGE COMMISSION OF BRAZIL AND MAY NOT BE OFFERED OR SOLD IN BRAZIL EXCEPT PURSUANT TO AN APPLICABLE EXEMPTION FROM THE REGISTRATION REQUIREMENTS AND IN COMPLIANCE WITH THE SECURITIES LAWS OF BRAZIL. China: This document is being distributed in China by, and is attributable to, Standard Chartered Bank (China) Limited which is mainly regulated by China Banking Regulatory Commission (CBRC), State Administration of Foreign Exchange (SAFE), and People’s Bank of China (PBoC). Germany: In Germany, this document is being distributed by Standard Chartered Bank Germany Branch which is also regulated by the Bundesanstalt für Finanzdienstleistungsaufsicht (BaFin). Hong Kong: This document (except any part advising on or facilitating any decision on futures contracts trading) is being distributed in Hong Kong by, and is attributable to, Standard Chartered Bank (Hong Kong) Limited 渣打銀行(香港)有限公司 which is regulated by the Hong Kong Monetary Authority. Insofar as this document advises on or facilitates any decision on futures contracts trading,
Page 55
Special Report: Shop Talk – China, ASEAN and the future
14 June 2017 55
it is being distributed in Hong Kong by, and is attributable to, Standard Chartered Securities (Hong Kong) Limited 渣打證券(香港)有限公司 which is regulated by the Securities and Futures Commission. India: This document is being distributed in India by Standard Chartered Bank, India Branch (“SCB India”). SCB India is a branch of SCB, UK and is licensed by the Reserve Bank of India to carry on banking business in India. SCB India is also registered with Securities and Exchange Board of India in its capacity as Merchant Banker, Investment Advisor, Depository Participant, Bankers to an Issue, Custodian etc. For details on group companies operating in India, please visit https://www.sc.com/in/india_result.html. Indonesia: The information in this document is provided for information purposes only. It does not constitute any offer, recommendation or solicitation to any person to enter into any transaction or adopt any hedging, trading or investment strategy, nor does it constitute any prediction of likely future movements in rates or prices or represent that any such future movements will not exceed those shown in any illustration. Japan: This document is being distributed to Specified Investors, as defined by the Financial Instruments and Exchange Law of Japan (FIEL), for information only and not for the purpose of soliciting any Financial Instruments Transactions as defined by the FIEL or any Specified Deposits, etc. as defined by the Banking Law of Japan. Kenya: Standard Chartered Bank Kenya Limited is regulated by the Central Bank of Kenya. The information in this document is provided for information purposes only. The document is intended for use only by Professional Clients and should not be relied upon by or be distributed to Retail Clients. Korea: This document is being distributed in Korea by, and is attributable to, Standard Chartered Bank Korea Limited which is regulated by the Financial Supervisory Service and Financial Services Commission. Macau: This document is being distributed in Macau Special Administrative Region of the Peoples' Republic of China, and is attributable to, Standard Chartered Bank (Macau Branch) which is regulated by Macau Monetary Authority. Malaysia: This document is being distributed in Malaysia by Standard Chartered Bank Malaysia Berhad only to institutional investors or corporate customers. Recipients in Malaysia should contact Standard Chartered Bank Malaysia Berhad in relation to any matters arising from, or in connection with, this document. Mauritius: Standard Chartered Bank (Mauritius) Limited is regulated by both the Bank of Mauritius and the Financial Services Commission in Mauritius. This document should not be construed as investment advice or solicitation to enter into securities transactions in Mauritius as per Securities Act 2005. New Zealand: New Zealand Investors should note that this document was prepared for “wholesale clients” only within the meaning of section 5C of the Financial Advisers Act 2008. This document is not directed at persons who are “retail clients” as defined in the Financial Advisers Act 2008. NOTE THAT STANDARD CHARTERED BANK (incorporated in England) IS NOT A “REGISTERED BANK” IN NEW ZEALAND UNDER THE RESERVE BANK OF NEW ZEALAND ACT 1989, and it is not therefore regulated or supervised by the Reserve Bank of New Zealand. Pakistan: The securities mentioned in this report have not been, and will not be, registered in Pakistan, and may not be offered or sold in Pakistan, without prior approval of the regulatory authorities in Pakistan. Philippines: This document may be distributed in the Philippines by, Standard Chartered Bank (Philippines) which is regulated by the Bangko Sentral ng Pilipinas (Telephone No. (+63) 708-7701, Website: www.bsp.gov.ph). This document is for information purposes only and does not constitute, and should not be construed as an offer to sell or distribute in the Philippines securities that are not registered with the Securities and Exchange Commission unless such securities are exempt under Section 9 of the Securities Regulation Code or such offer or sale qualifies as an exempt transaction under Section 10 thereof. Singapore: This document is being distributed in Singapore by SCB Singapore branch and/or Standard Chartered Bank (Singapore) Limited, provided that research reports relating to certain products may be distributed only to accredited investors, expert investors or institutional investors, as defined in the Securities and Futures Act, Chapter 289 of Singapore. Recipients in Singapore should contact SCB Singapore branch or Standard Chartered Bank (Singapore) Limited (as the case may be) in relation to any matters arising from, or in connection with, this document. South Africa: Standard Chartered Bank, Johannesburg Branch (“SCB Johannesburg Branch”) is licensed as a Financial Services Provider in terms of Section 8 of the Financial Advisory and Intermediary Services Act 37 of 2002. SCB Johannesburg Branch is a Registered Credit Provider in terms of the National Credit Act 34 of 2005 under registration number NCRCP4. Thailand: This document is intended to circulate only general information and prepare exclusively for the benefit of Institutional Investors with the conditions and as defined in the Notifications of the Office of the Securities and Exchange Commission relating to the exemption of investment advisory service, as amended and supplemented from time to time. It is not intended to provide for the public. UAE: For residents of the UAE – Standard Chartered Bank UAE does not provide financial analysis or consultation services in or into the UAE within the meaning of UAE Securities and Commodities Authority Decision No. 48/r of 2008 concerning financial consultation and financial analysis. UAE (DIFC): Standard Chartered Bank, Dubai International Financial Centre (SCB DIFC) having its offices at Dubai International Financial Centre, Building 1, Gate Precinct, P.O. Box 999, Dubai, UAE is a branch of Standard Chartered Bank and is regulated by the Dubai Financial Services Authority (“DFSA”). This document is intended for use only by Professional Clients and is not directed at Retail Clients as defined by the DFSA Rulebook. In the DIFC we are authorized to provide financial services only to clients who qualify as Professional Clients and Market Counterparties and not to Retail Clients. As a Professional Client you will not be given the higher retail client protection and compensation rights and if you use your right to be classified as a Retail Client we will be unable to provide financial services and products to you as we do not hold the required license to undertake such activities. United States: Except for any documents relating to foreign exchange, FX or global FX, Rates or Commodities, distribution of this document in the United States or to US persons is intended to be solely to major institutional investors as defined in Rule 15a-6(a)(2) under the US Securities Exchange Act of 1934. All US persons that receive this document by their acceptance thereof represent and agree that they are a major institutional investor and understand the risks involved in executing transactions in securities. Any US recipient of this document wanting additional information or to effect any transaction in any security or financial instrument mentioned herein, must do so by contacting a registered representative of Standard Chartered Securities (North America) Inc., 1095 Avenue of the Americas, New York, N.Y. 10036, US, tel + 1 212 667 0700. WE DO NOT OFFER OR SELL SECURITIES TO U.S. PERSONS UNLESS EITHER (A) THOSE SECURITIES ARE REGISTERED FOR SALE WITH THE U.S. SECURITIES AND EXCHANGE COMMISSION AND WITH ALL APPROPRIATE U.S. STATE AUTHORITIES; OR (B) THE SECURITIES OR THE SPECIFIC TRANSACTION QUALIFY FOR AN EXEMPTION UNDER THE U.S. FEDERAL AND STATE SECURITIES LAWS NOR DO WE OFFER OR SELL SECURITIES TO U.S. PERSONS UNLESS (i) WE, OUR AFFILIATED COMPANY AND THE APPROPRIATE PERSONNEL ARE PROPERLY REGISTERED OR LICENSED TO CONDUCT BUSINESS; OR (ii) WE, OUR AFFILIATED COMPANY AND THE APPROPRIATE PERSONNEL QUALIFY FOR EXEMPTIONS UNDER APPLICABLE U.S. FEDERAL AND STATE LAWS. Any documents relating to foreign exchange, FX or global FX, Rates or Commodities to US Persons, Guaranteed Affiliates, or Conduit Affiliates (as those terms are defined by any Commodity Futures Trading Commission rule, interpretation, guidance, or other such publication) are intended to be distributed only to Eligible Contract Participants are defined in Section 1a(18) of the Commodity Exchange Act. Zambia: Standard Chartered Bank Zambia Plc (SCB Zambia) is licensed and registered as a commercial bank under the Banking and Financial Services Act Cap 387 of the laws of Zambia and as a dealer under the Securities Act, No. 41 of 2016. SCB Zambia is regulated by the Bank of Zambia, the Lusaka Stock Exchange and the Securities and Exchange Commission.
© Copyright 2017 Standard Chartered Bank and its affiliates. All rights reserved. All copyrights subsisting and arising out of all materials, text, articles and information contained herein is the property of Standard Chartered Bank and/or its affiliates, and may not be reproduced, redistributed, amended, modified, adapted, transmitted in any form, or translated in any way without the prior written permission of Standard Chartered Bank.
Document approved by
David Mann Chief Economist, Asia
Document is released at
08:22 GMT 14 June 2017