12
©2017 | 20 October 2017 Slide 1 Shore Power for Environmentally Friendly Terminal Operations Jim Andriotis – Regional Sales Manager - MARCOM Lima, Peru - October 2017

©2017 | 20 October 2017 Slide 1
Shore Power for Environmentally Friendly Terminal Operations
Jim Andriotis – Regional Sales Manager - MARCOMLima, Peru - October 2017

©2017 | 20 October 2017 Slide 2
Table of Contents
1. Why Shore Power?
2. Technology Used
3. Next Step for Shore Power
4. Summary

©2017 | 20 October 2017 Slide 3
› Reduction of vessel emissions while at port
• Ocean going vessels are majority of pollution emitters at ports
› Fuel reduction of vessels
› Power generation (ship APU) shifted from higher density area such as port complex to lower density areas with greener power generation
• Hydroelectric
• Wind
• Solar
Why Shore Power?
Key Benefits

©2017 | 20 October 2017 Slide 4
› Legislation
• POLA mission; zero emission by 2030
› Emissions Reductions
• Shore power equipped vessels reduced emissions almost completely while plugged in
• Remaining emissions occur during gap between vessel arrival and plug in
POLA Shore Power
Source: 2017 POLA Emissions Inventory Highlights
Utilizing AMP for one container or cruise ship call reduces approx.
1 ton of Nox generated onboard the ship. The resulting Nox
reduction per call is the equivalent of taking 295 cars off the
road
Results of Shore power in Port of Los Angeles
POLA Air emissions Highlight, 2014
©2017 | 20 October 2017 Slide 5
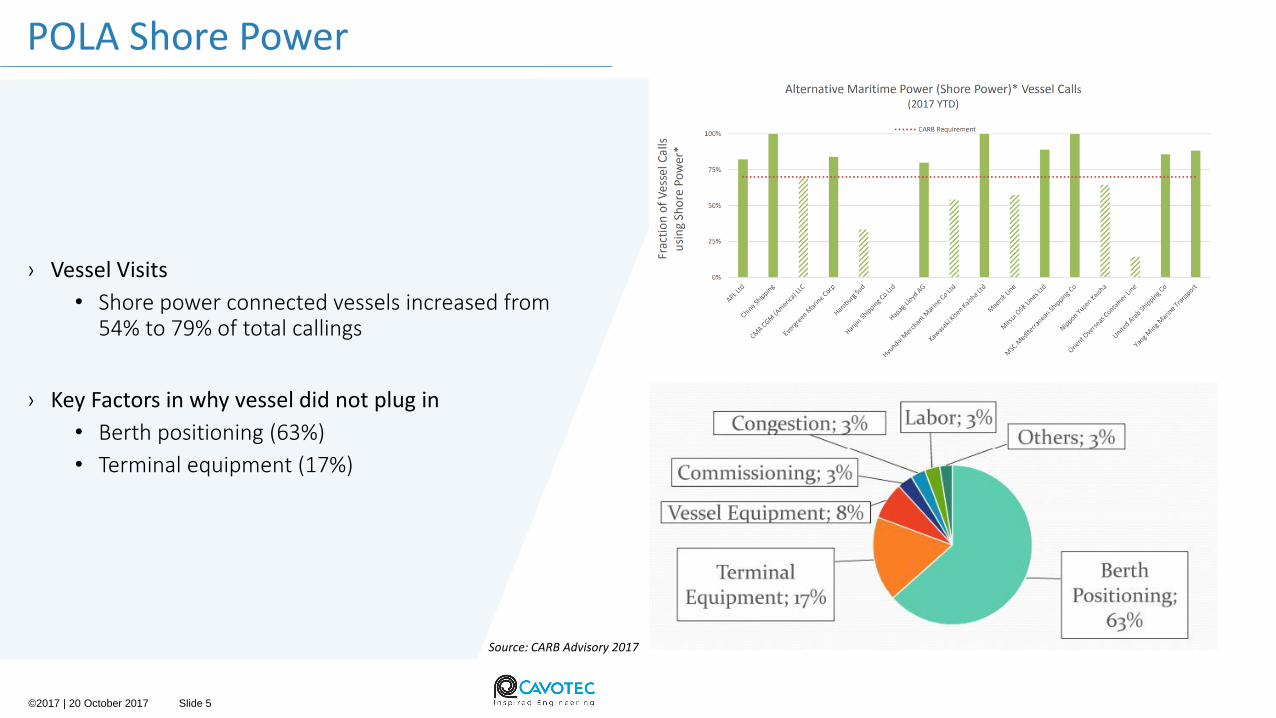
› Vessel Visits
• Shore power connected vessels increased from 54% to 79% of total callings
› Key Factors in why vessel did not plug in
• Berth positioning (63%)
• Terminal equipment (17%)
POLA Shore Power
Source: CARB Advisory 2017

©2017 | 20 October 2017 Slide 6
› Variety of equipment
• 250 AMP Vaults
• 6 AMP Mobiles
• 20 AMP Dispensers / Telescopic
› Variety of port types
• Majority are container terminals
Shore Power Adoption
AMP Technology at over 20 ports
› Over 30 shipping lines:
• NYK Japan
• CSL China
• MSC
• APL
• K-Line
600 Ships equipped with AMP Systems

©2017 | 20 October 2017 Slide 7
› Below ground plug connections
• All conduit also run below berth
› Easy access lift covers
• Load rated covers with easy lift technology
Technology Used
Shore Power Pits
› Full cable management
• Double monospiral drums for multiple cables
› Retractable cable guide
• Guide lowers to guide cable down side of ship
› Remote operation
• Control reel from connection point for easy adjustment
Ship Mounted Reels

©2017 | 20 October 2017 Slide 8
› Boom for lifting connectors
• For ships without on-board reels
› Cable management
• For both land side to pits and ship side
› Flexibility
• Can be used for all ships and cover positions
Technology Used
AMP Mobile
› Flexibility
• Fill “gaps” between pit and ship reel misalignment
› Mobility
• Can be towed to vessel when needed and stored in remote location
› Battery Version
• Battery powered caddy removes need for towing and further reduces emissions
AMP Trailer/Caddy

©2017 | 20 October 2017 Slide 9
› Efficient
• Connection can be completed in a matter of seconds
› Safety
• Remove need for personnel to handle high voltage connections
Next Step for Shore Power
Automated Connections
› Grid feedback
• Allow smart grids to control power demand
› Data analytics
• Use big data to better understand ship demand and usage
Digitalization

©2017 | 20 October 2017 Slide 10
› Automated connection of power and vessel mooring
• Controlled by push of a button
› High power / current requirements
• Connections capable of 1000V / 1800A
› Efficiency
• Faster turnaround times, key for ferries
Next Step for Shore Power
Electric Ferries / Ships
› Bulk Carriers
• High amperage, low voltage requirements
› LNG
• Explosion proof requirements
› Autonomous Vessels
• Zero personnel on shore, automated connection and mooring
Additional Vessel Types
©2017 | 20 October 2017 Slide 11
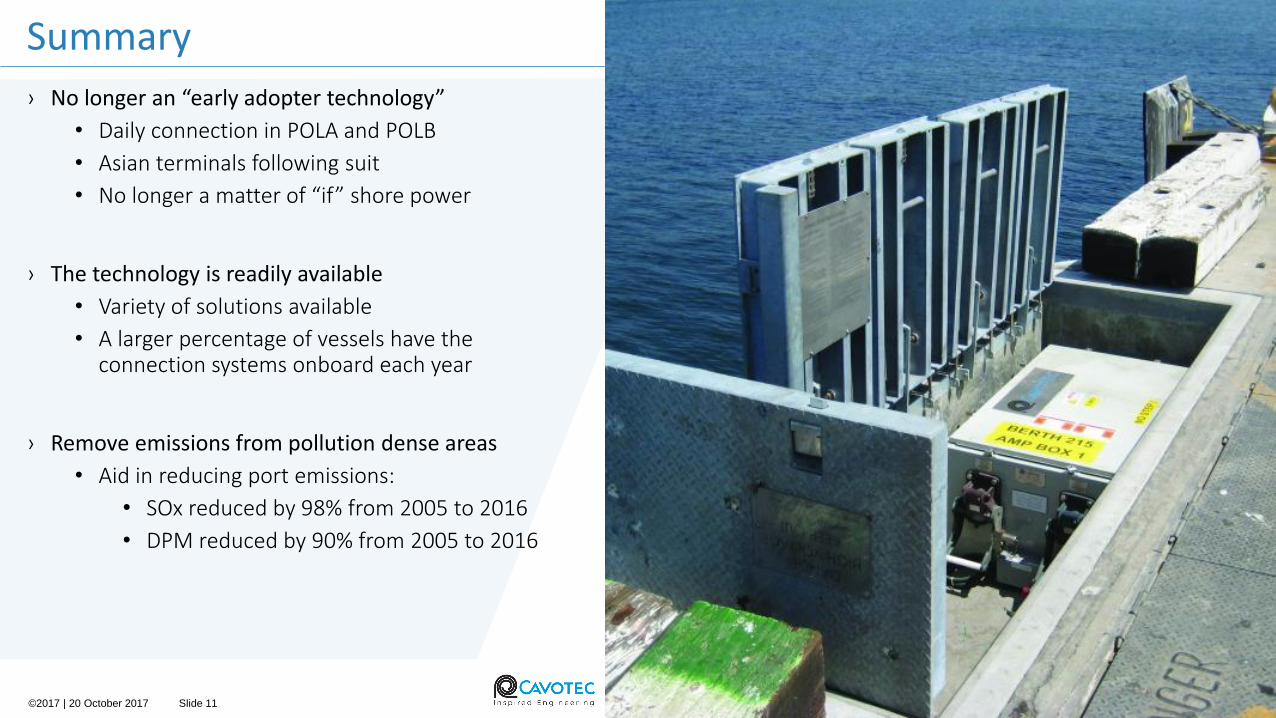
› No longer an “early adopter technology”
• Daily connection in POLA and POLB
• Asian terminals following suit
• No longer a matter of “if” shore power
› The technology is readily available
• Variety of solutions available
• A larger percentage of vessels have the connection systems onboard each year
› Remove emissions from pollution dense areas
• Aid in reducing port emissions:
• SOx reduced by 98% from 2005 to 2016
• DPM reduced by 90% from 2005 to 2016
Summary

©2017 | 20 October 2017 Slide 12
The information contained in this presentation is subject to change, completion or amendment without notice. In furnishing this presentation, neither Cavotec any obligation to provide the recipient with access to any additional information or to update this presentation or to correct any inaccuracies therein, which may become apparent. This presentation does not purport to contain all the information that the recipient may require in its analysis of Cavotec.
This presentation is Cavotec’s property.
Come visit us at booth B1 for more information


