U.S. Energy Information Administration | Short-Term Energy Outlook September 2016 1 September 2016 Short-Term Energy Outlook (STEO) Highlights Benchmark North Sea Brent crude oil spot prices averaged $46/barrel (b) in August, a $1/b increase from July. This was the fourth consecutive month in which Brent spot crude oil prices averaged between $44/b and $49/b. Brent crude oil prices are forecast to average $43/b in 2016 and $52/b in 2017. West Texas Intermediate (WTI) crude oil prices are forecast to average $1/b less than Brent in 2016 and 2017. The current values of futures and options contracts suggest high uncertainty in the price outlook. For example, EIA’s forecast for the average WTI price in December 2016 of $44/b should be considered in the context of Nymex contract values for December 2016 delivery. Contracts traded during the five-day period ending September 1 (Market Prices and Uncertainty Report) suggest the market expects WTI prices could range from $34/b to $65/b (at the 95% confidence interval) in December 2016. U.S. regular gasoline retail prices are expected to decline from an average of $2.18/gallon (gal) in August to $1.92/gal in December. For the year, U.S. regular gasoline retail prices are forecast to average $2.08/gal in 2016 and $2.26/gal in 2017. U.S. crude oil production averaged 9.4 million barrels per day (b/d) in 2015. Production is forecast to average 8.8 million b/d in 2016 and 8.5 million b/d in 2017. Production levels in 2017 for this forecast are 0.2 million b/d higher than in the August STEO. The upward revisions to production largely reflect an assumption of higher drilling activity, rig efficiency, and well-level productivity than assumed in previous forecasts. Natural gas working inventories were 3,401 billion cubic feet (Bcf) on August 26. This level is 8% higher than last year during the same week, and 11% higher than the previous five-year (2011–15) average for that week. EIA projects that natural gas inventories will be 4,042 Bcf at the end of October 2016, which would be the highest end-of-October level on record. Global Petroleum and Other Liquid Fuels EIA estimates that global petroleum and other liquid fuels inventory builds averaged 1.8 million b/d in 2015. The pace of inventory builds is expected to slow to an average of 0.8 million b/d in 2016. Inventory builds are expected to continue into early 2017, and then consistent inventory draws are forecast to begin in June 2017.
Transcript
U.S. Energy Information Administration | Short-Term Energy Outlook September 2016 1
September 2016
Short-Term Energy Outlook (STEO)
Highlights
Benchmark North Sea Brent crude oil spot prices averaged $46/barrel (b) in August, a $1/b
increase from July. This was the fourth consecutive month in which Brent spot crude oil
prices averaged between $44/b and $49/b.
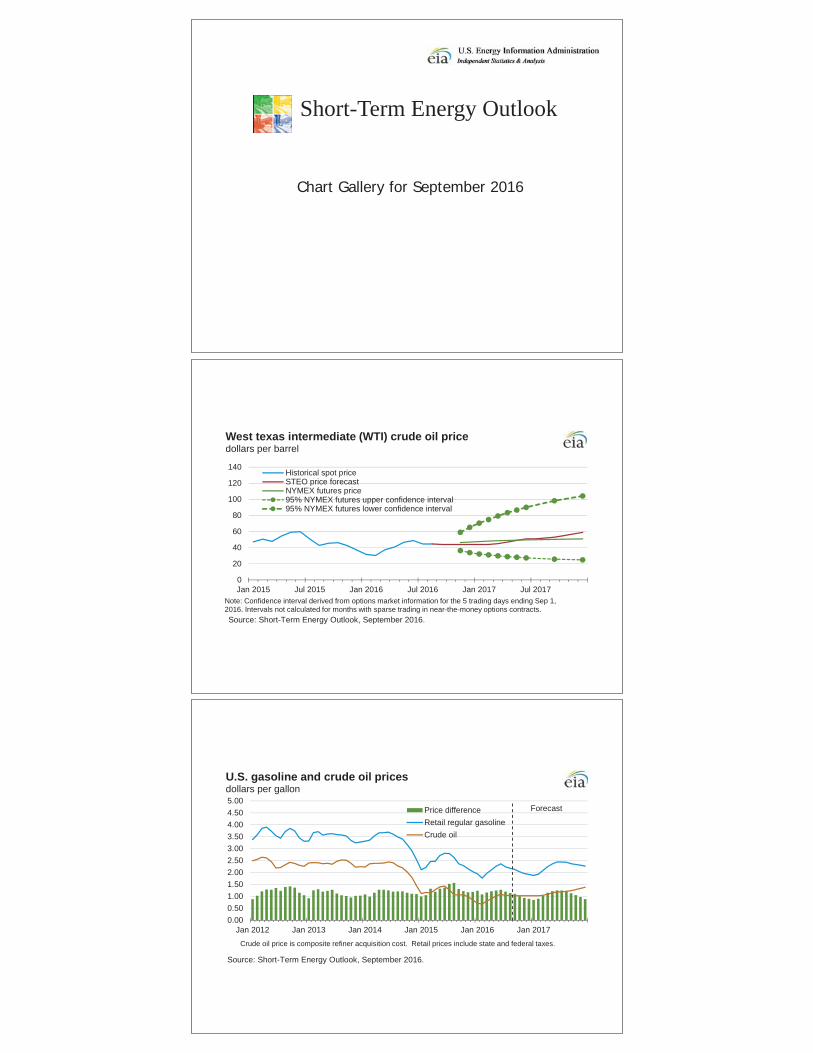
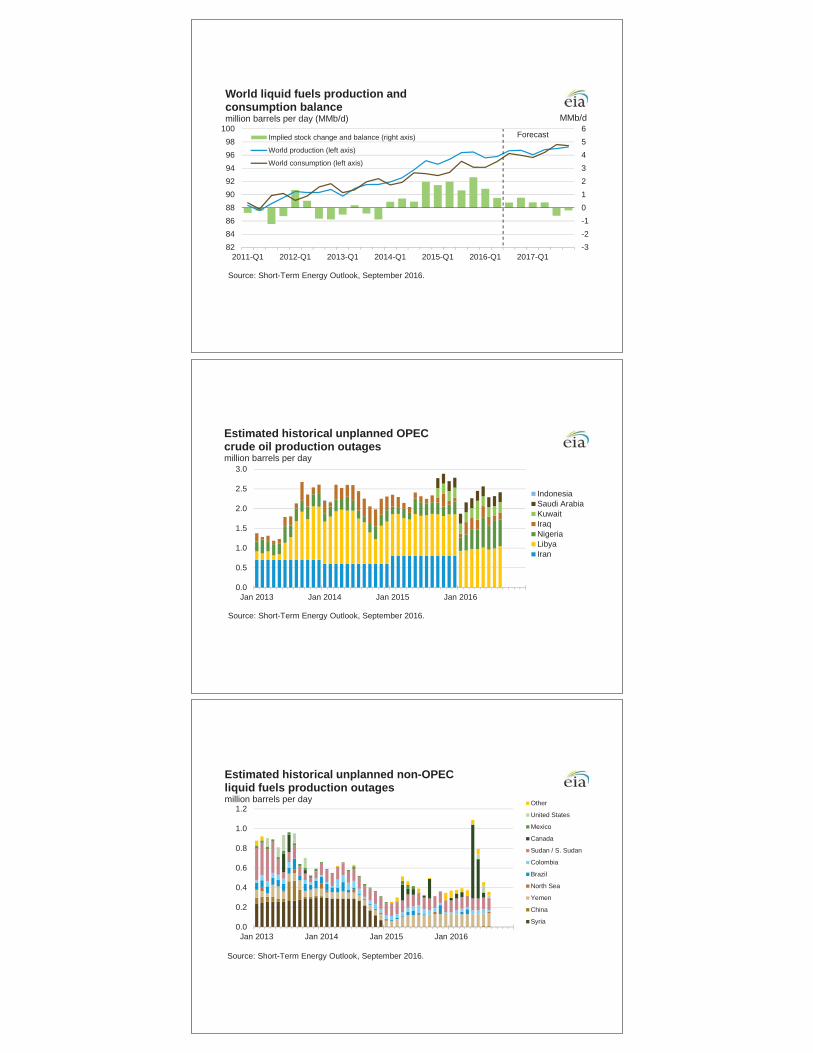
Brent crude oil prices are forecast to average $43/b in 2016 and $52/b in 2017. West Texas
Intermediate (WTI) crude oil prices are forecast to average $1/b less than Brent in 2016 and
2017. The current values of futures and options contracts suggest high uncertainty in the
price outlook. For example, EIA’s forecast for the average WTI price in December 2016 of
$44/b should be considered in the context of Nymex contract values for December 2016
delivery. Contracts traded during the five-day period ending September 1 (Market Prices
and Uncertainty Report) suggest the market expects WTI prices could range from $34/b to
$65/b (at the 95% confidence interval) in December 2016.
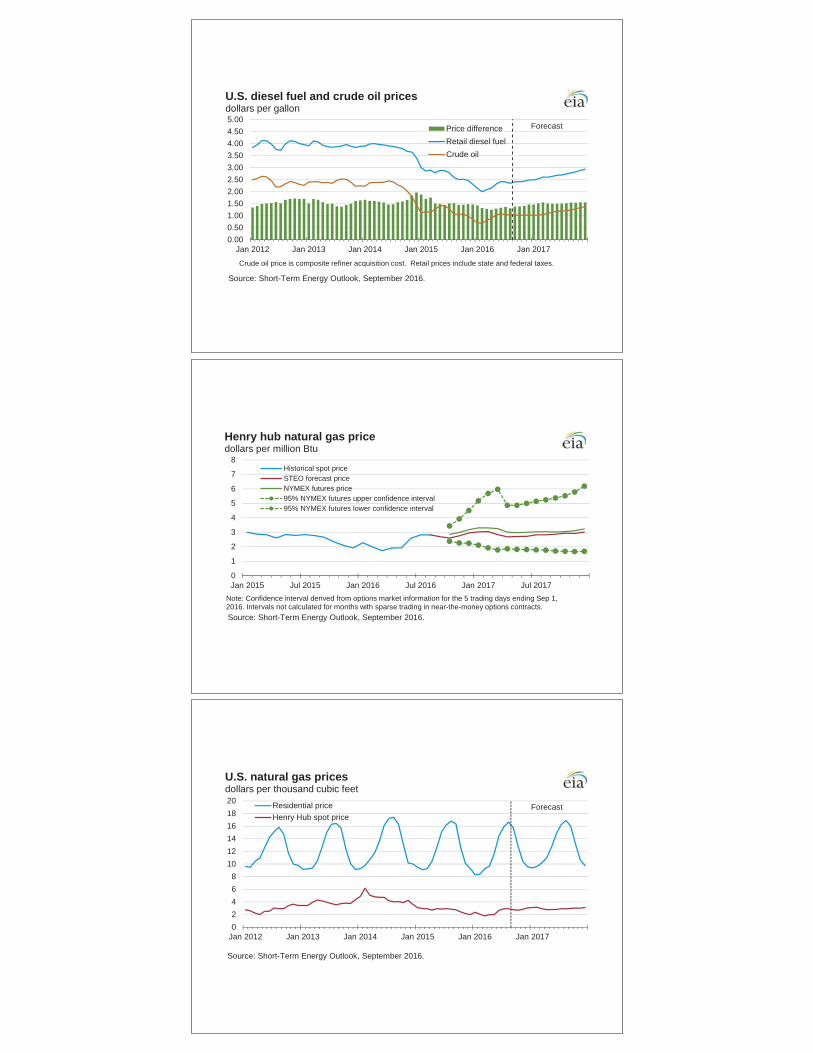
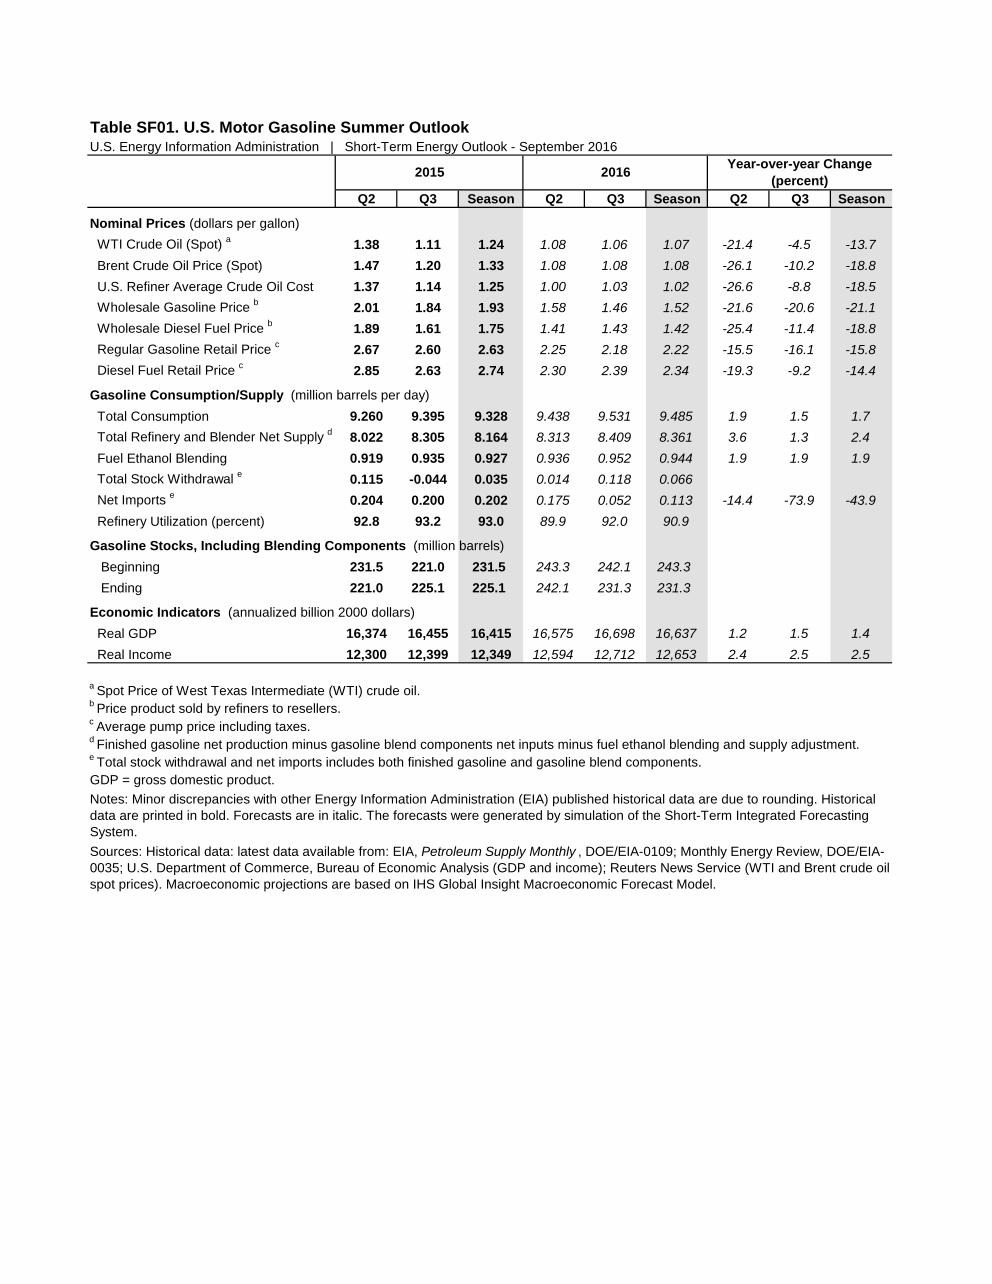
U.S. regular gasoline retail prices are expected to decline from an average of $2.18/gallon
(gal) in August to $1.92/gal in December. For the year, U.S. regular gasoline retail prices are
forecast to average $2.08/gal in 2016 and $2.26/gal in 2017.
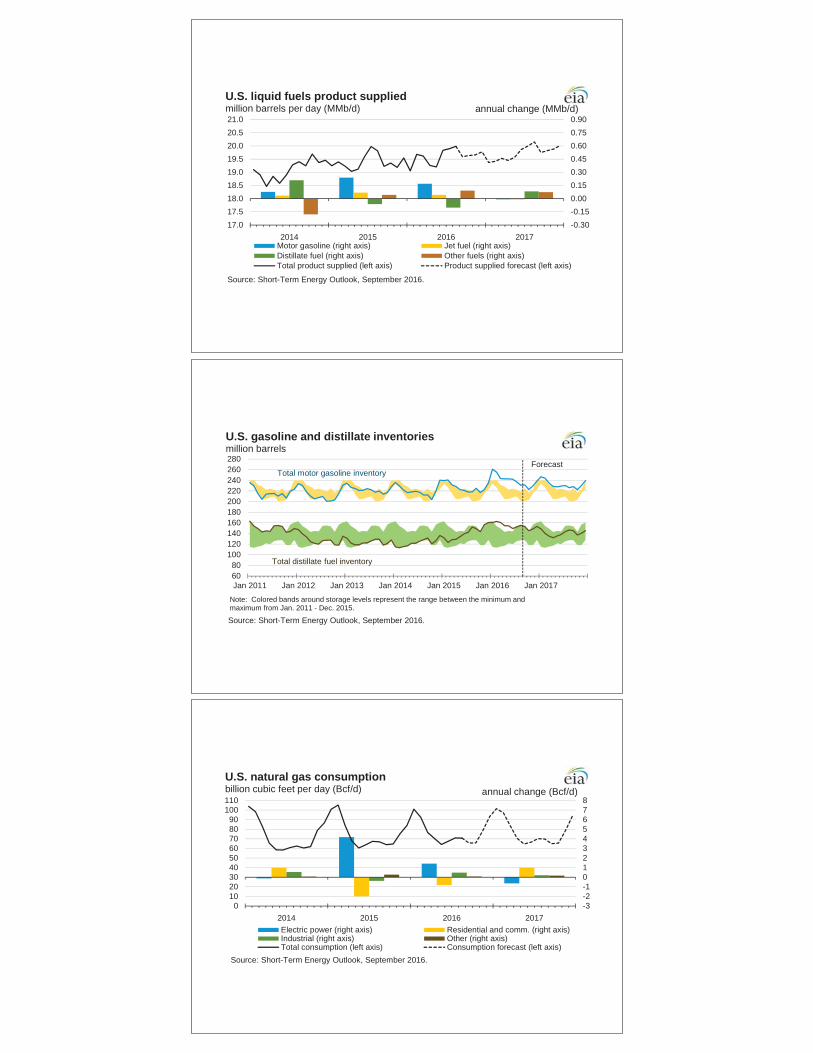
U.S. crude oil production averaged 9.4 million barrels per day (b/d) in 2015. Production is
forecast to average 8.8 million b/d in 2016 and 8.5 million b/d in 2017. Production levels in
2017 for this forecast are 0.2 million b/d higher than in the August STEO. The upward
revisions to production largely reflect an assumption of higher drilling activity, rig efficiency,
and well-level productivity than assumed in previous forecasts.
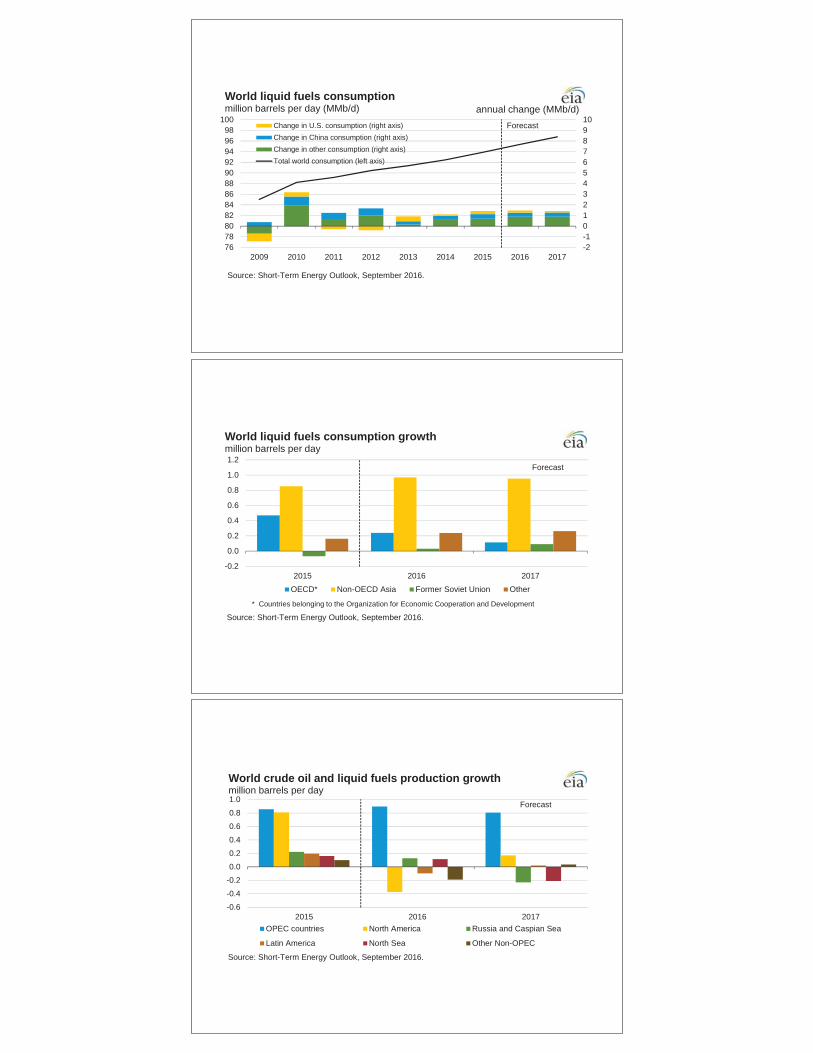
Natural gas working inventories were 3,401 billion cubic feet (Bcf) on August 26. This level is
8% higher than last year during the same week, and 11% higher than the previous five-year
(2011–15) average for that week. EIA projects that natural gas inventories will be 4,042 Bcf
at the end of October 2016, which would be the highest end-of-October level on record.
Global Petroleum and Other Liquid Fuels
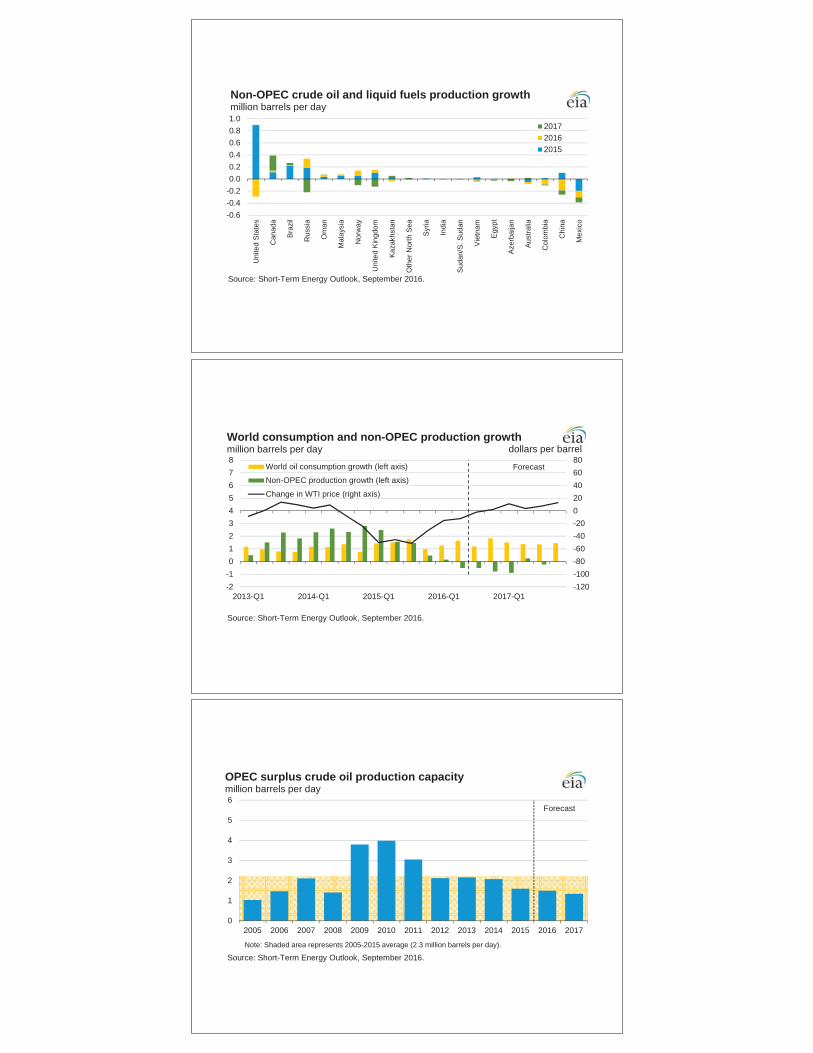
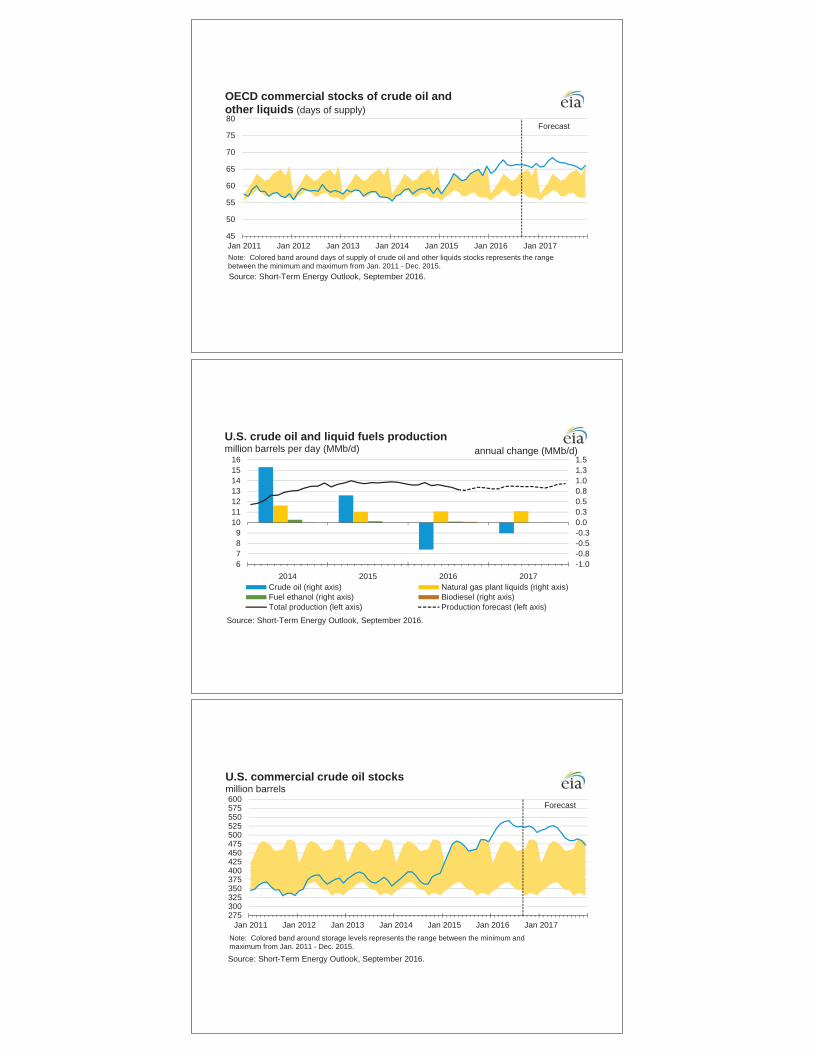
EIA estimates that global petroleum and other liquid fuels inventory builds averaged 1.8 million
b/d in 2015. The pace of inventory builds is expected to slow to an average of 0.8 million b/d in
2016. Inventory builds are expected to continue into early 2017, and then consistent inventory
Source: Short-Term Energy Outlook, September 2016.
Note: Confidence interval derived from options market information for the 5 trading days ending Sep 1, 2016. Intervals not calculated for months with sparse trading in near-the-money options contracts.
Forecast
0.000.501.001.502.002.503.003.504.004.505.00
Jan 2012 Jan 2013 Jan 2014 Jan 2015 Jan 2016 Jan 2017
U.S. gasoline and crude oil pricesdollars per gallon
Price differenceRetail regular gasolineCrude oil
Source: Short-Term Energy Outlook, September 2016.
Crude oil price is composite refiner acquisition cost. Retail prices include state and federal taxes.
Forecast
0.000.501.001.502.002.503.003.504.004.505.00
Jan 2012 Jan 2013 Jan 2014 Jan 2015 Jan 2016 Jan 2017
U.S. diesel fuel and crude oil pricesdollars per gallon
Price differenceRetail diesel fuelCrude oil
Source: Short-Term Energy Outlook, September 2016.
Crude oil price is composite refiner acquisition cost. Retail prices include state and federal taxes.
0
1
2
3
4
5
6
7
8
Jan 2015 Jul 2015 Jan 2016 Jul 2016 Jan 2017 Jul 2017
Henry hub natural gas pricedollars per million Btu
Source: Short-Term Energy Outlook, September 2016.
Note: Confidence interval derived from options market information for the 5 trading days ending Sep 1, 2016. Intervals not calculated for months with sparse trading in near-the-money options contracts.
Forecast
02468
101214161820
Jan 2012 Jan 2013 Jan 2014 Jan 2015 Jan 2016 Jan 2017
U.S. natural gas pricesdollars per thousand cubic feet
Residential priceHenry Hub spot price
Source: Short-Term Energy Outlook, September 2016.
World liquid fuels production andconsumption balancemillion barrels per day (MMb/d)
Implied stock change and balance (right axis)
World production (left axis)
World consumption (left axis)
Source: Short-Term Energy Outlook, September 2016.
MMb/d
0.0
0.5
1.0
1.5
2.0
2.5
3.0
Jan 2013 Jan 2014 Jan 2015 Jan 2016
Estimated historical unplanned OPEC crude oil production outagesmillion barrels per day
IndonesiaSaudi ArabiaKuwaitIraqNigeriaLibyaIran
Source: Short-Term Energy Outlook, September 2016.
0.0
0.2
0.4
0.6
0.8
1.0
1.2
Jan 2013 Jan 2014 Jan 2015 Jan 2016
Estimated historical unplanned non-OPEC liquid fuels production outagesmillion barrels per day Other
United States
Mexico
Canada
Sudan / S. Sudan
Colombia
Brazil
North Sea
Yemen
China
Syria
Source: Short-Term Energy Outlook, September 2016.
Forecast
-2-1012345678910
767880828486889092949698
100
2009 2010 2011 2012 2013 2014 2015 2016 2017
World liquid fuels consumptionmillion barrels per day (MMb/d)
Change in U.S. consumption (right axis)Change in China consumption (right axis)Change in other consumption (right axis)Total world consumption (left axis)
annual change (MMb/d)
Source: Short-Term Energy Outlook, September 2016.
-0.2
0.0
0.2
0.4
0.6
0.8
1.0
1.2
2015 2016 2017
World liquid fuels consumption growthmillion barrels per day
OECD* Non-OECD Asia Former Soviet Union Other
Source: Short-Term Energy Outlook, September 2016.
* Countries belonging to the Organization for Economic Cooperation and Development
Forecast
-0.6
-0.4
-0.20.0
0.2
0.4
0.6
0.8
1.0
2015 2016 2017OPEC countries North America Russia and Caspian Sea
Latin America North Sea Other Non-OPEC
World crude oil and liquid fuels production growthmillion barrels per day
Source: Short-Term Energy Outlook, September 2016.
Forecast
-0.6-0.4-0.20.00.20.40.60.81.0
Uni
ted
Sta
tes
Can
ada
Bra
zil
Rus
sia
Om
an
Mal
aysi
a
Nor
way
Uni
ted
Kin
gdom
Kaz
akhs
tan
Oth
er N
orth
Sea
Syr
ia
Indi
a
Sud
an/S
. Sud
an
Vie
tnam
Egy
pt
Aze
rbai
jan
Aust
ralia
Col
ombi
a
Chi
na
Mex
ico
201720162015
Non-OPEC crude oil and liquid fuels production growthmillion barrels per day
Source: Short-Term Energy Outlook, September 2016.
OPEC surplus crude oil production capacitymillion barrels per day
Source: Short-Term Energy Outlook, September 2016.Note: Shaded area represents 2005-2015 average (2.3 million barrels per day).
Forecast
Forecast
45
50
55
60
65
70
75
80
Jan 2011 Jan 2012 Jan 2013 Jan 2014 Jan 2015 Jan 2016 Jan 2017
OECD commercial stocks of crude oil and other liquids (days of supply)
Source: Short-Term Energy Outlook, September 2016.
Note: Colored band around days of supply of crude oil and other liquids stocks represents the range between the minimum and maximum from Jan. 2011 - Dec. 2015.
-1.0-0.8-0.5-0.30.00.30.50.81.01.31.5
2014 2015 2016 20176789
10111213141516
U.S. crude oil and liquid fuels productionmillion barrels per day (MMb/d)
Crude oil (right axis) Natural gas plant liquids (right axis)Fuel ethanol (right axis) Biodiesel (right axis)Total production (left axis) Production forecast (left axis)
annual change (MMb/d)
Source: Short-Term Energy Outlook, September 2016.
Forecast
275300325350375400425450475500525550575600
Jan 2011 Jan 2012 Jan 2013 Jan 2014 Jan 2015 Jan 2016 Jan 2017
U.S. commercial crude oil stocksmillion barrels
Source: Short-Term Energy Outlook, September 2016.
Note: Colored band around storage levels represents the range between the minimum and maximum from Jan. 2011 - Dec. 2015.
Source: Short-Term Energy Outlook, September 2016.
Forecast
6080
100120140160180200220240260280
Jan 2011 Jan 2012 Jan 2013 Jan 2014 Jan 2015 Jan 2016 Jan 2017
U.S. gasoline and distillate inventoriesmillion barrels
Source: Short-Term Energy Outlook, September 2016.
Note: Colored bands around storage levels represent the range between the minimum and maximum from Jan. 2011 - Dec. 2015.
Total motor gasoline inventory
Total distillate fuel inventory
-3-2-1012345678
2014 2015 2016 20170
102030405060708090
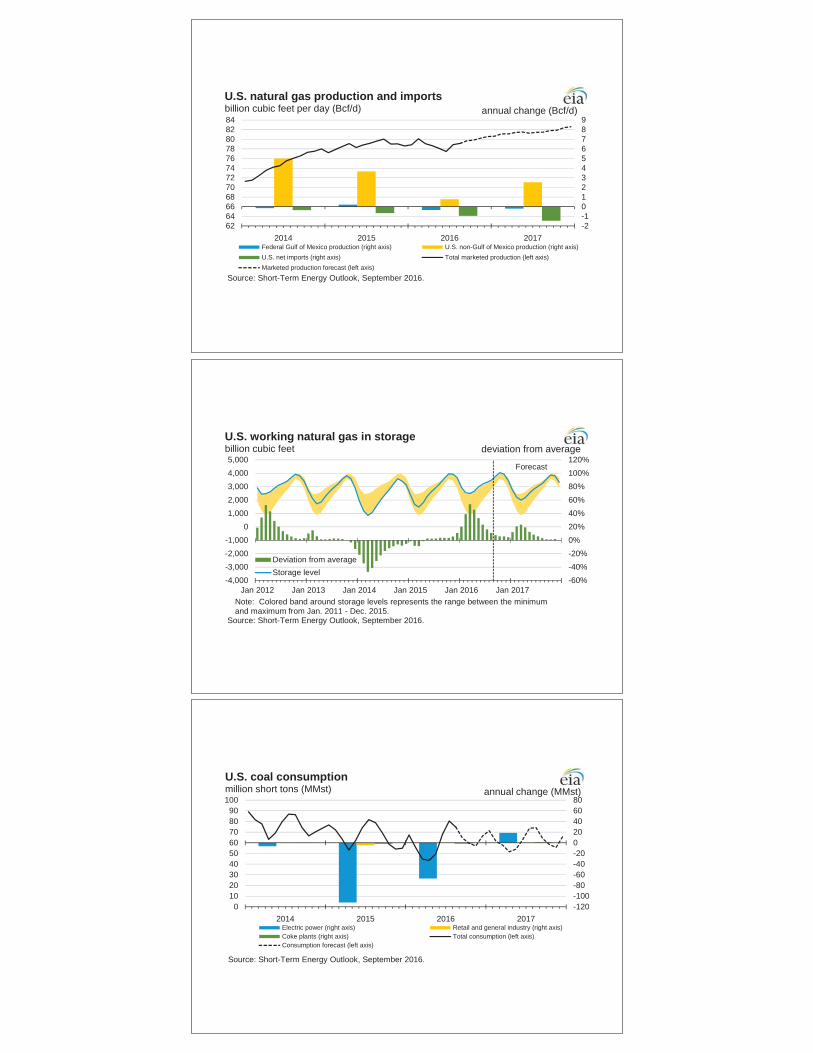
100110
U.S. natural gas consumptionbillion cubic feet per day (Bcf/d)
Electric power (right axis) Residential and comm. (right axis)Industrial (right axis) Other (right axis)Total consumption (left axis) Consumption forecast (left axis)
annual change (Bcf/d)
Source: Short-Term Energy Outlook, September 2016.
-2-10123456789
2014 2015 2016 2017626466687072747678808284
U.S. natural gas production and importsbillion cubic feet per day (Bcf/d)
Federal Gulf of Mexico production (right axis) U.S. non-Gulf of Mexico production (right axis)U.S. net imports (right axis) Total marketed production (left axis)Marketed production forecast (left axis)
annual change (Bcf/d)
Source: Short-Term Energy Outlook, September 2016.
Forecast
-60%-40%-20%0%20%40%60%80%100%120%
-4,000-3,000-2,000-1,000
01,0002,0003,0004,0005,000
Jan 2012 Jan 2013 Jan 2014 Jan 2015 Jan 2016 Jan 2017
U.S. working natural gas in storagebillion cubic feet
Deviation from averageStorage level
deviation from average
Source: Short-Term Energy Outlook, September 2016.
Note: Colored band around storage levels represents the range between the minimum and maximum from Jan. 2011 - Dec. 2015.
-120-100-80-60-40-20020406080
2014 2015 2016 20170
102030405060708090
100
U.S. coal consumptionmillion short tons (MMst)
Electric power (right axis) Retail and general industry (right axis)Coke plants (right axis) Total consumption (left axis)Consumption forecast (left axis)
annual change (MMst)
Source: Short-Term Energy Outlook, September 2016.
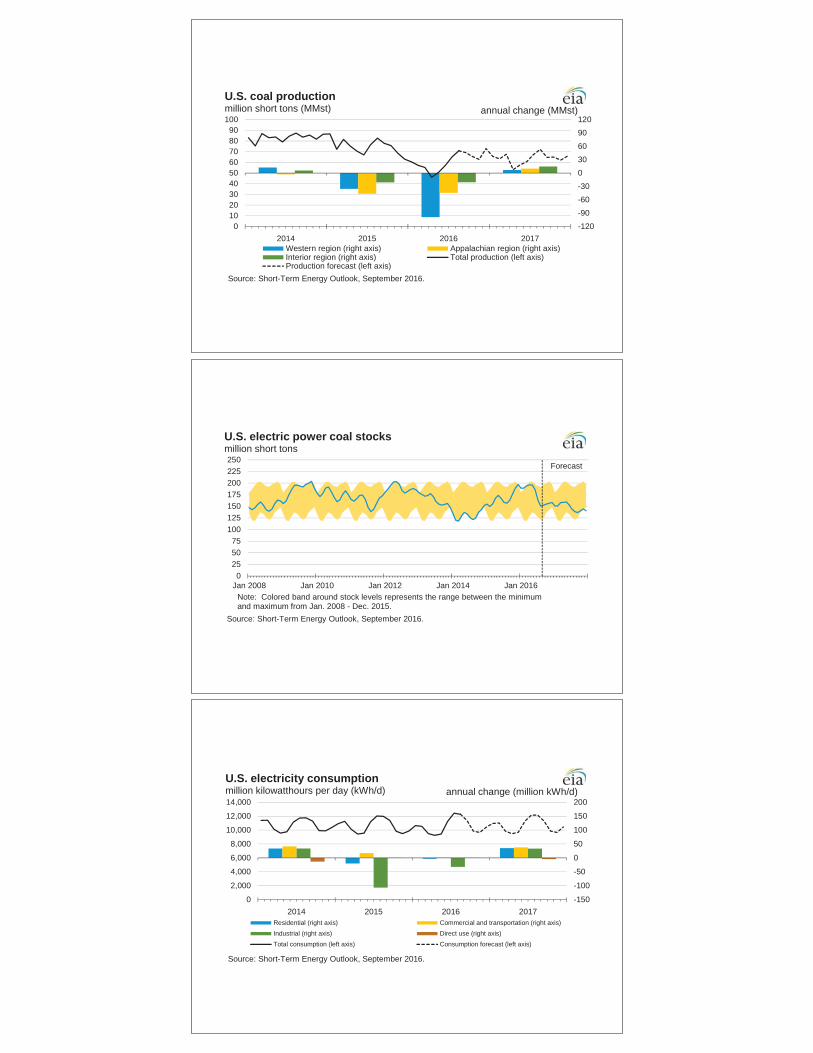
-120-90-60-300306090120
2014 2015 2016 20170
102030405060708090
100
U.S. coal productionmillion short tons (MMst)
Western region (right axis) Appalachian region (right axis)Interior region (right axis) Total production (left axis)Production forecast (left axis)
annual change (MMst)
Source: Short-Term Energy Outlook, September 2016.
Forecast
0255075
100125150175200225250
Jan 2008 Jan 2010 Jan 2012 Jan 2014 Jan 2016
U.S. electric power coal stocksmillion short tons
Source: Short-Term Energy Outlook, September 2016.
Note: Colored band around stock levels represents the range between the minimum and maximum from Jan. 2008 - Dec. 2015.
-150
-100
-50
0
50
100
150
200
2014 2015 2016 20170
2,000
4,000
6,000
8,000
10,000
12,000
14,000
U.S. electricity consumptionmillion kilowatthours per day (kWh/d)
Residential (right axis) Commercial and transportation (right axis)Industrial (right axis) Direct use (right axis)Total consumption (left axis) Consumption forecast (left axis)
annual change (million kWh/d)
Source: Short-Term Energy Outlook, September 2016.
Source: Short-Term Energy Outlook, September 2016.
Note: Hydropower excludes pumped storage generation. Liquid biofuels include ethanol and biodiesel. Other biomass includes municipal waste from biogenic sources, landfill gas, and other non-wood waste.
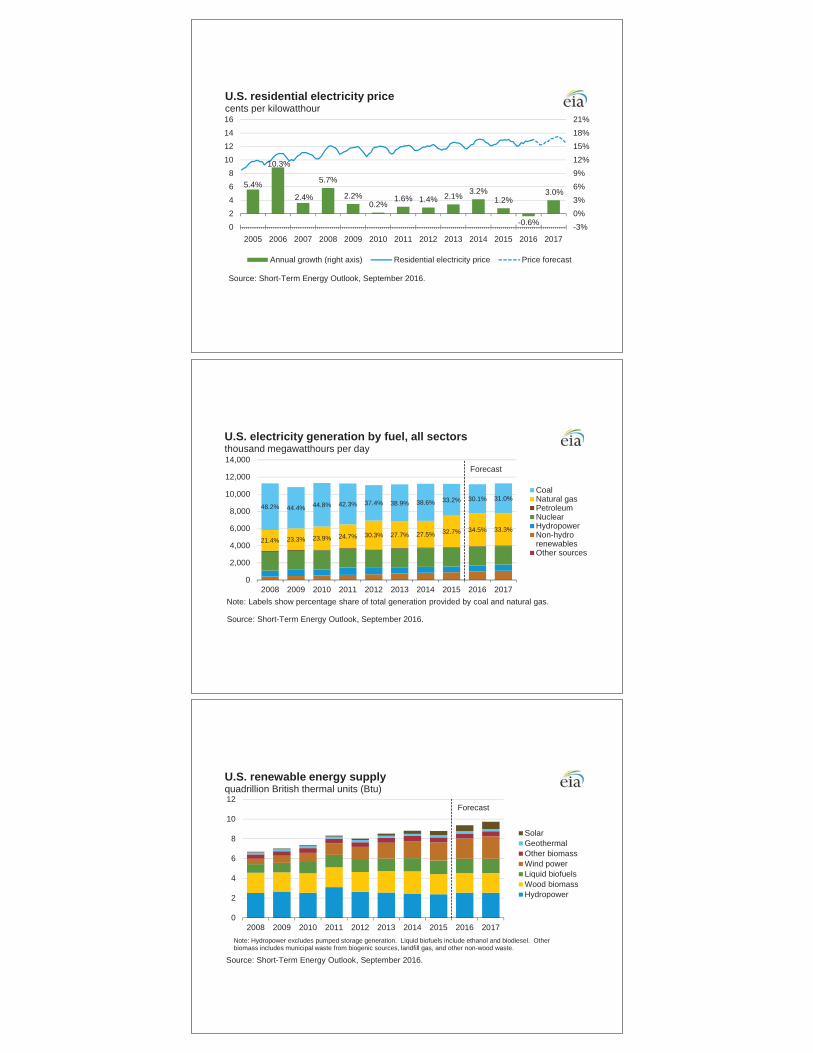
U.S. annual energy expendituresshare of gross domestic product
Source: Short-Term Energy Outlook, September 2016.
Forecast
-15%
-12%
-9%
-6%
-3%
0%
3%
6%
2014 2015 2016 2017
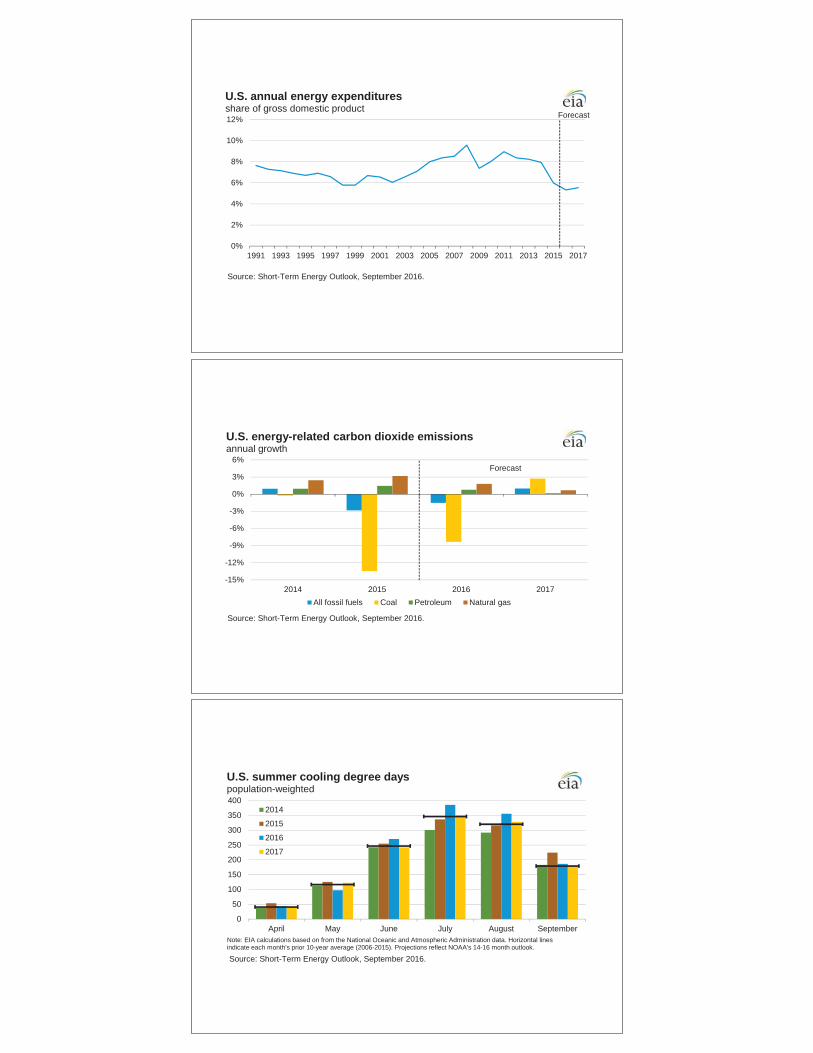
U.S. energy-related carbon dioxide emissionsannual growth
All fossil fuels Coal Petroleum Natural gas
Source: Short-Term Energy Outlook, September 2016.
0
50
100
150
200
250
300
350
400
April May June July August September
U.S. summer cooling degree dayspopulation-weighted
2014
2015
2016
2017
Source: Short-Term Energy Outlook, September 2016.
Note: EIA calculations based on from the National Oceanic and Atmospheric Administration data. Horizontal lines indicate each month's prior 10-year average (2006-2015). Projections reflect NOAA's 14-16 month outlook.
0100200300400500600700800900
1000
October November December January February March
U.S. winter heating degree dayspopulation-weighted
2013/142014/152015/162016/17
Source: Short-Term Energy Outlook, September 2016.
Note: EIA calculations based on National Oceanic and Atmospheric Administration (NOAA) data. Horizontal lines indicate each month's prior 10-year average (Oct 2006 - Mar 2016). Projections reflect NOAA's 14-16 month outlook.
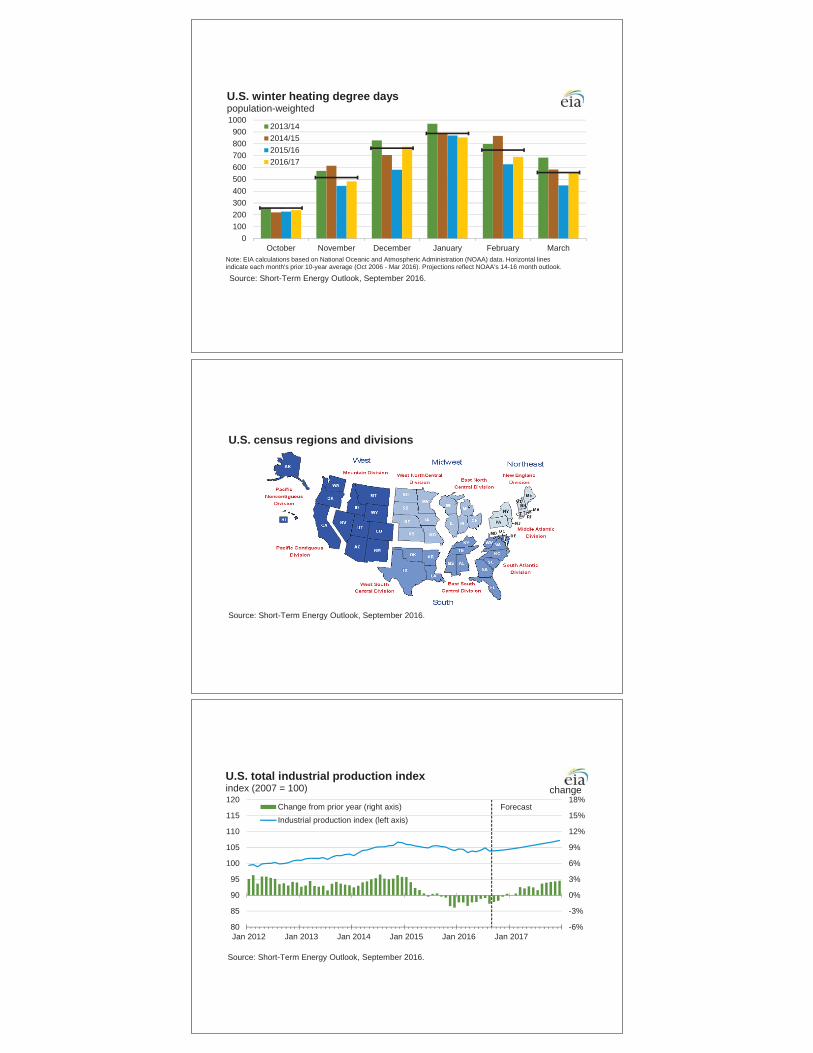
U.S. census regions and divisions
Source: Short-Term Energy Outlook, September 2016.
-6%
-3%
0%
3%
6%
9%
12%
15%
18%
80
85
90
95
100
105
110
115
120
Jan 2012 Jan 2013 Jan 2014 Jan 2015 Jan 2016 Jan 2017
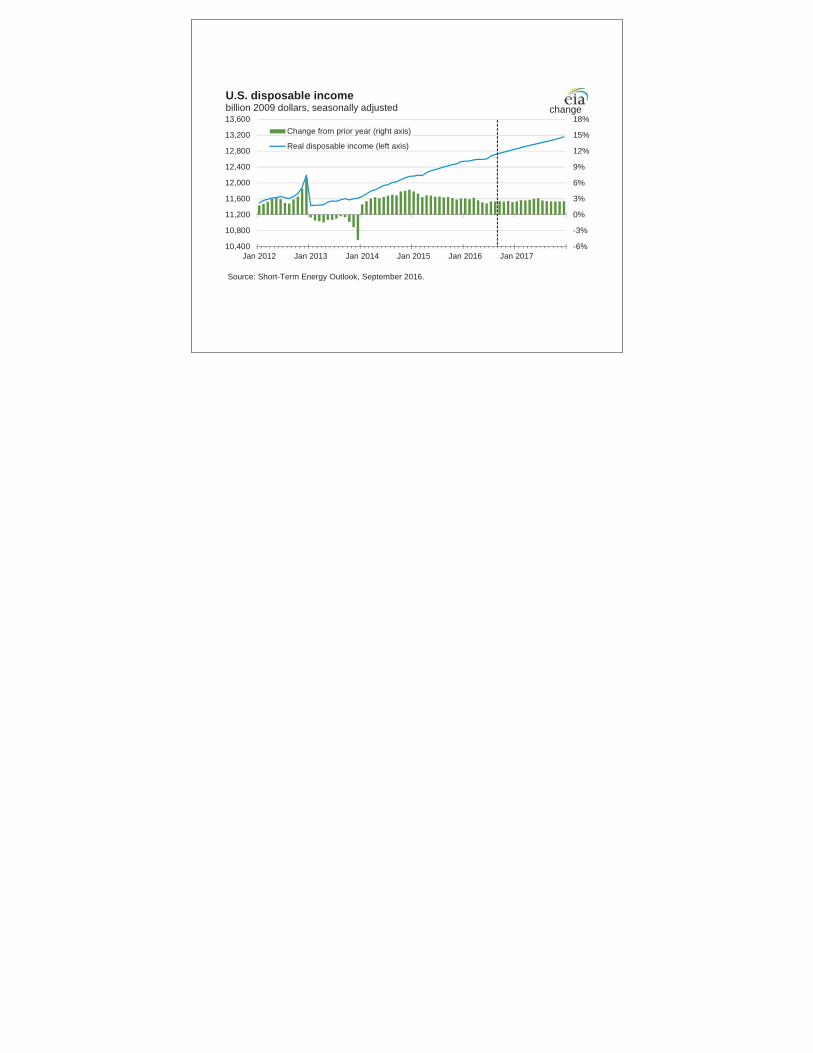
U.S. total industrial production indexindex (2007 = 100)
Change from prior year (right axis)Industrial production index (left axis)
Source: Short-Term Energy Outlook, September 2016.
change
Forecast
-6%
-3%
0%
3%
6%
9%
12%
15%
18%
10,400
10,800
11,200
11,600
12,000
12,400
12,800
13,200
13,600
Jan 2012 Jan 2013 Jan 2014 Jan 2015 Jan 2016 Jan 2017
U.S. disposable incomebillion 2009 dollars, seasonally adjusted
Change from prior year (right axis)
Real disposable income (left axis)
Source: Short-Term Energy Outlook, September 2016.
Economic Indicators (annualized billion 2000 dollars) Real GDP 16,374 16,455 16,415 16,575 16,698 16,637 1.2 1.5 1.4 Real Income 12,300 12,399 12,349 12,594 12,712 12,653 2.4 2.5 2.5
a Spot Price of West Texas Intermediate (WTI) crude oil.
Year-over-year Change(percent)
Table SF01. U.S. Motor Gasoline Summer Outlook
2015 2016
U.S. Energy Information Administration | Short-Term Energy Outlook - September 2016
b Price product sold by refiners to resellers.c Average pump price including taxes.
Sources: Historical data: latest data available from: EIA, Petroleum Supply Monthly , DOE/EIA-0109; Monthly Energy Review, DOE/EIA-0035; U.S. Department of Commerce, Bureau of Economic Analysis (GDP and income); Reuters News Service (WTI and Brent crude oil spot prices). Macroeconomic projections are based on IHS Global Insight Macroeconomic Forecast Model.
d Finished gasoline net production minus gasoline blend components net inputs minus fuel ethanol blending and supply adjustment.e Total stock withdrawal and net imports includes both finished gasoline and gasoline blend components.GDP = gross domestic product.Notes: Minor discrepancies with other Energy Information Administration (EIA) published historical data are due to rounding. Historical data are printed in bold. Forecasts are in italic. The forecasts were generated by simulation of the Short-Term Integrated Forecasting System.
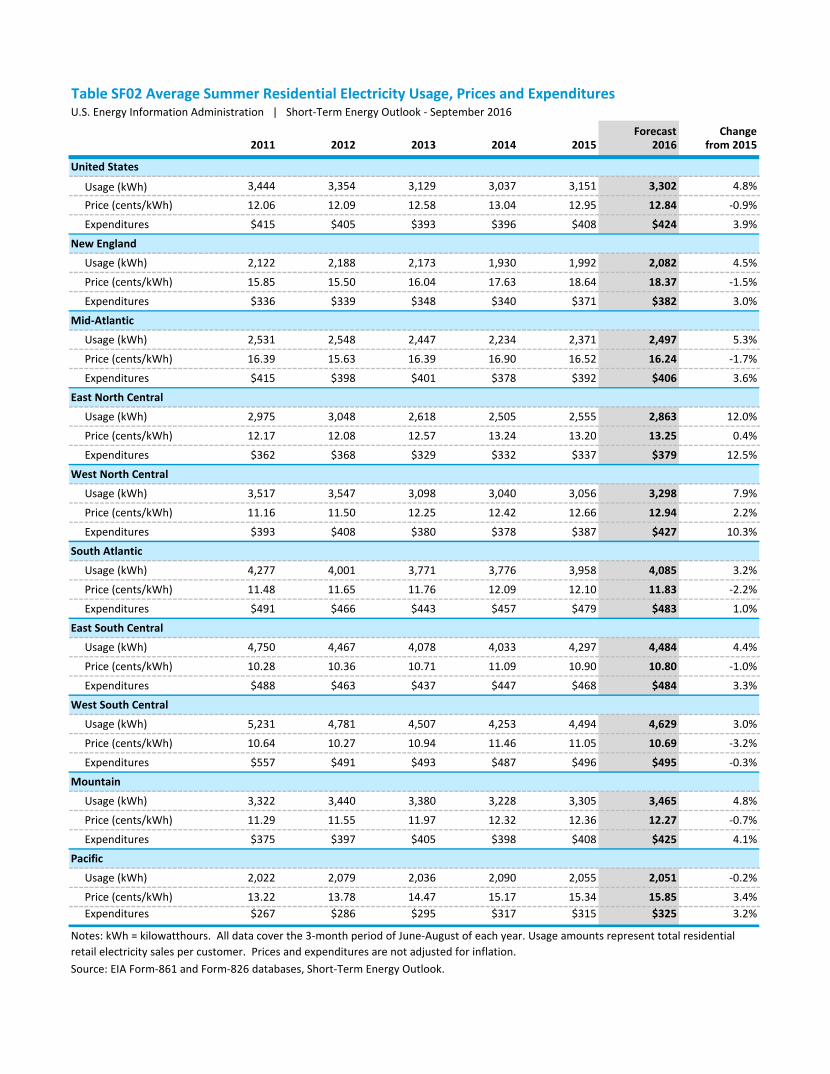
Forecast Change2011 2012 2013 2014 2015 2016 from 2015
Table SF02 Average Summer Residential Electricity Usage, Prices and ExpendituresU.S. Energy Information Administration | Short-Term Energy Outlook - September 2016
Notes: kWh = kilowatthours. All data cover the 3-month period of June-August of each year. Usage amounts represent total residential retail electricity sales per customer. Prices and expenditures are not adjusted for inflation.Source: EIA Form-861 and Form-826 databases, Short-Term Energy Outlook.
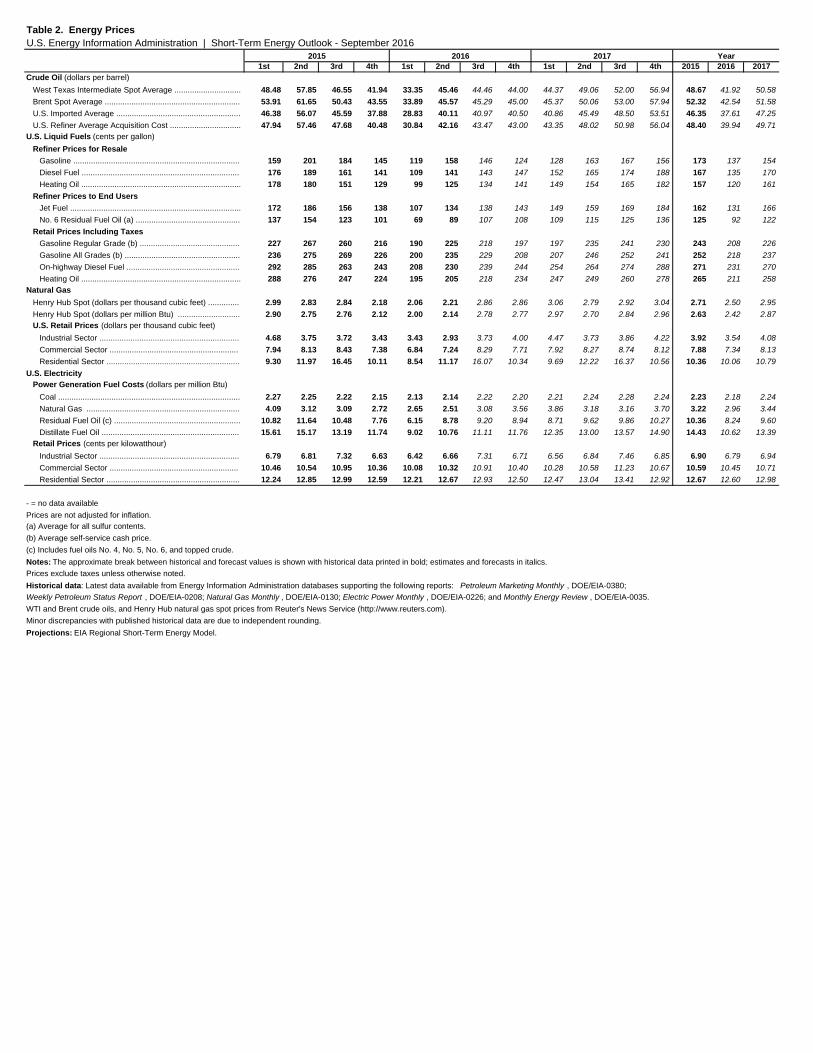
(c) Includes fuel oils No. 4, No. 5, No. 6, and topped crude.
Table 2. Energy PricesU.S. Energy Information Administration | Short-Term Energy Outlook - September 2016
2015 2016 2017 Year
- = no data availablePrices are not adjusted for inflation.(a) Average for all sulfur contents.(b) Average self-service cash price.
Projections: EIA Regional Short-Term Energy Model.
Notes: The approximate break between historical and forecast values is shown with historical data printed in bold; estimates and forecasts in italics.Prices exclude taxes unless otherwise noted.Historical data: Latest data available from Energy Information Administration databases supporting the following reports: Petroleum Marketing Monthly , DOE/EIA-0380;Weekly Petroleum Status Report , DOE/EIA-0208; Natural Gas Monthly , DOE/EIA-0130; Electric Power Monthly , DOE/EIA-0226; and Monthly Energy Review , DOE/EIA-0035.WTI and Brent crude oils, and Henry Hub natural gas spot prices from Reuter's News Service (http://www.reuters.com).Minor discrepancies with published historical data are due to independent rounding.
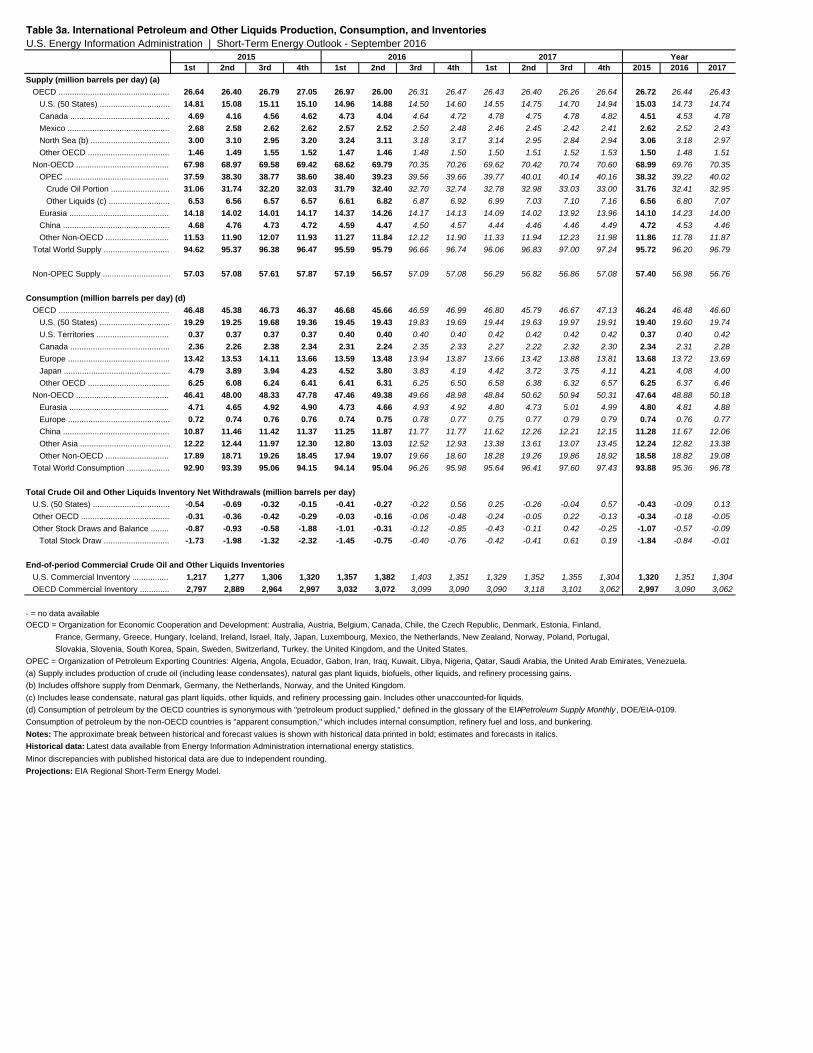
(a) Supply includes production of crude oil (including lease condensates), natural gas plant liquids, biofuels, other liquids, and refinery processing gains.
Table 3a. International Petroleum and Other Liquids Production, Consumption, and InventoriesU.S. Energy Information Administration | Short-Term Energy Outlook - September 2016
2015 2016 2017 Year
- = no data availableOECD = Organization for Economic Cooperation and Development: Australia, Austria, Belgium, Canada, Chile, the Czech Republic, Denmark, Estonia, Finland, France, Germany, Greece, Hungary, Iceland, Ireland, Israel, Italy, Japan, Luxembourg, Mexico, the Netherlands, New Zealand, Norway, Poland, Portugal, Slovakia, Slovenia, South Korea, Spain, Sweden, Switzerland, Turkey, the United Kingdom, and the United States.OPEC = Organization of Petroleum Exporting Countries: Algeria, Angola, Ecuador, Gabon, Iran, Iraq, Kuwait, Libya, Nigeria, Qatar, Saudi Arabia, the United Arab Emirates, Venezuela.
Minor discrepancies with published historical data are due to independent rounding. Projections: EIA Regional Short-Term Energy Model.
(b) Includes offshore supply from Denmark, Germany, the Netherlands, Norway, and the United Kingdom.(c) Includes lease condensate, natural gas plant liquids, other liquids, and refinery processing gain. Includes other unaccounted-for liquids.(d) Consumption of petroleum by the OECD countries is synonymous with "petroleum product supplied," defined in the glossary of the EIA Petroleum Supply Monthly , DOE/EIA-0109. Consumption of petroleum by the non-OECD countries is "apparent consumption," which includes internal consumption, refinery fuel and loss, and bunkering.Notes: The approximate break between historical and forecast values is shown with historical data printed in bold; estimates and forecasts in italics.Historical data: Latest data available from Energy Information Administration international energy statistics.
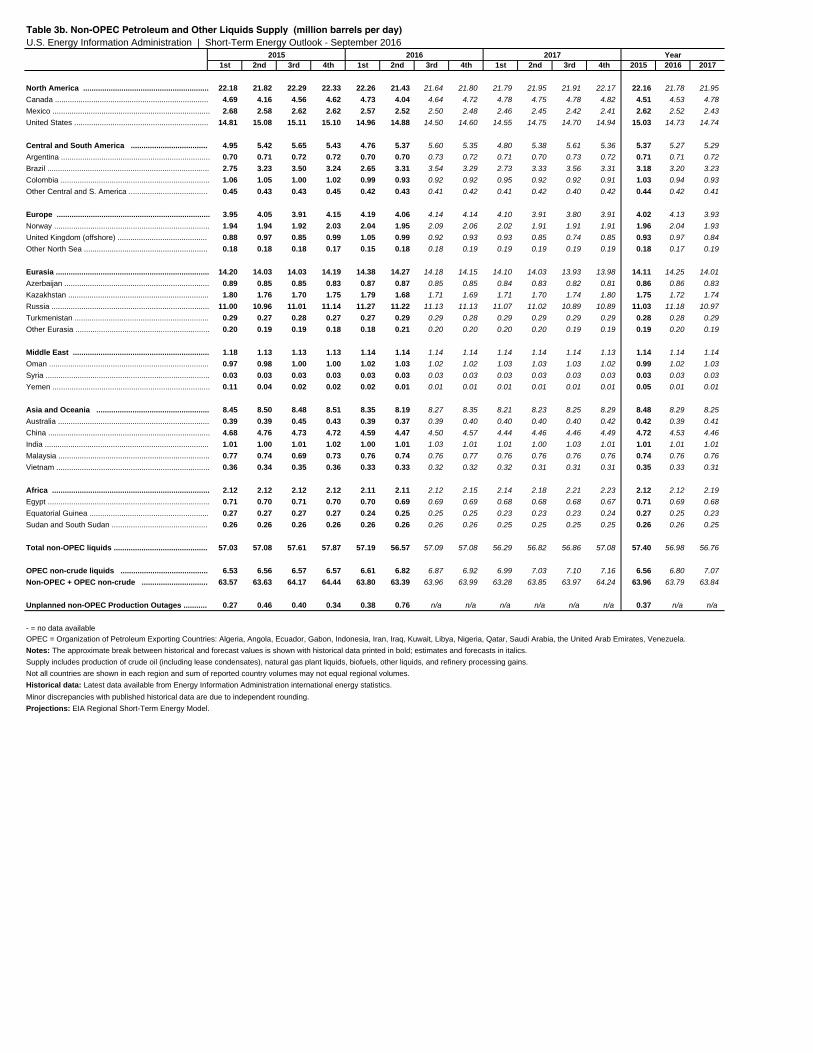
Table 3b. Non-OPEC Petroleum and Other Liquids Supply (million barrels per day)U.S. Energy Information Administration | Short-Term Energy Outlook - September 2016
2015 2016 2017 Year
Minor discrepancies with published historical data are due to independent rounding. Projections: EIA Regional Short-Term Energy Model.
- = no data availableOPEC = Organization of Petroleum Exporting Countries: Algeria, Angola, Ecuador, Gabon, Indonesia, Iran, Iraq, Kuwait, Libya, Nigeria, Qatar, Saudi Arabia, the United Arab Emirates, Venezuela.Notes: The approximate break between historical and forecast values is shown with historical data printed in bold; estimates and forecasts in italics.Supply includes production of crude oil (including lease condensates), natural gas plant liquids, biofuels, other liquids, and refinery processing gains.Not all countries are shown in each region and sum of reported country volumes may not equal regional volumes.Historical data: Latest data available from Energy Information Administration international energy statistics.
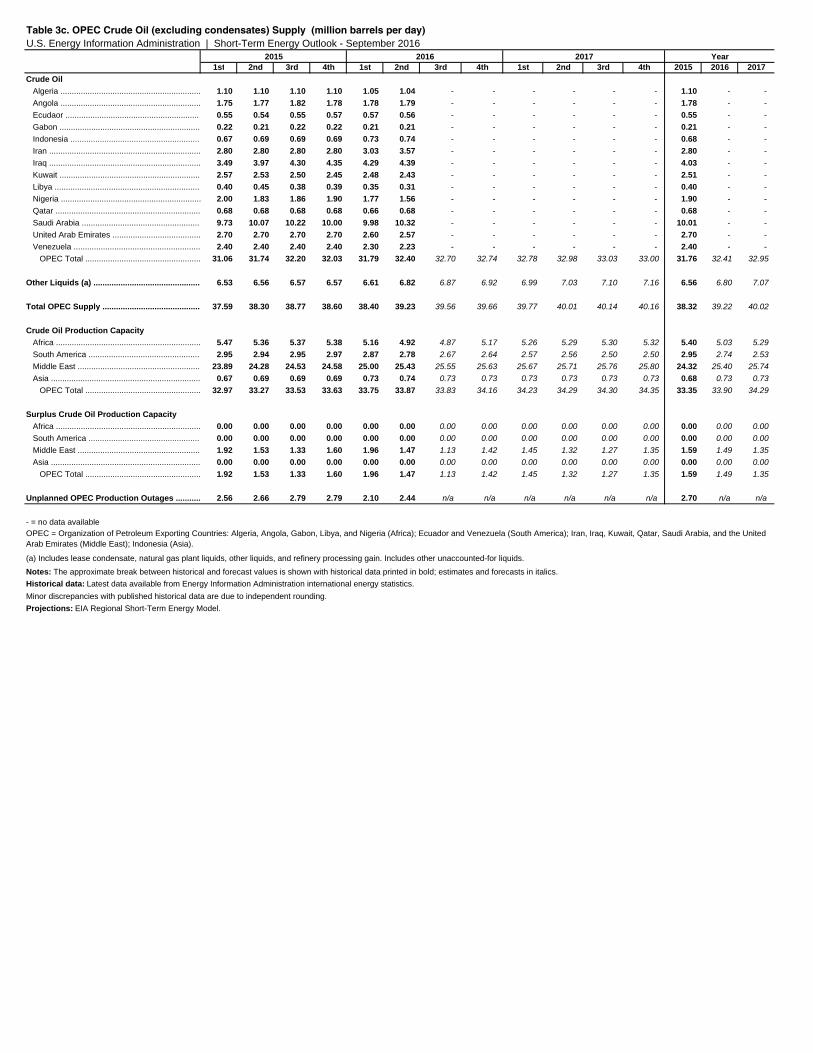
Table 3c. OPEC Crude Oil (excluding condensates) Supply (million barrels per day)U.S. Energy Information Administration | Short-Term Energy Outlook - September 2016
2015 2016 2017 Year
Projections: EIA Regional Short-Term Energy Model.
- = no data availableOPEC = Organization of Petroleum Exporting Countries: Algeria, Angola, Gabon, Libya, and Nigeria (Africa); Ecuador and Venezuela (South America); Iran, Iraq, Kuwait, Qatar, Saudi Arabia, and the United Arab Emirates (Middle East); Indonesia (Asia).
(a) Includes lease condensate, natural gas plant liquids, other liquids, and refinery processing gain. Includes other unaccounted-for liquids.
Notes: The approximate break between historical and forecast values is shown with historical data printed in bold; estimates and forecasts in italics.Historical data: Latest data available from Energy Information Administration international energy statistics.Minor discrepancies with published historical data are due to independent rounding.
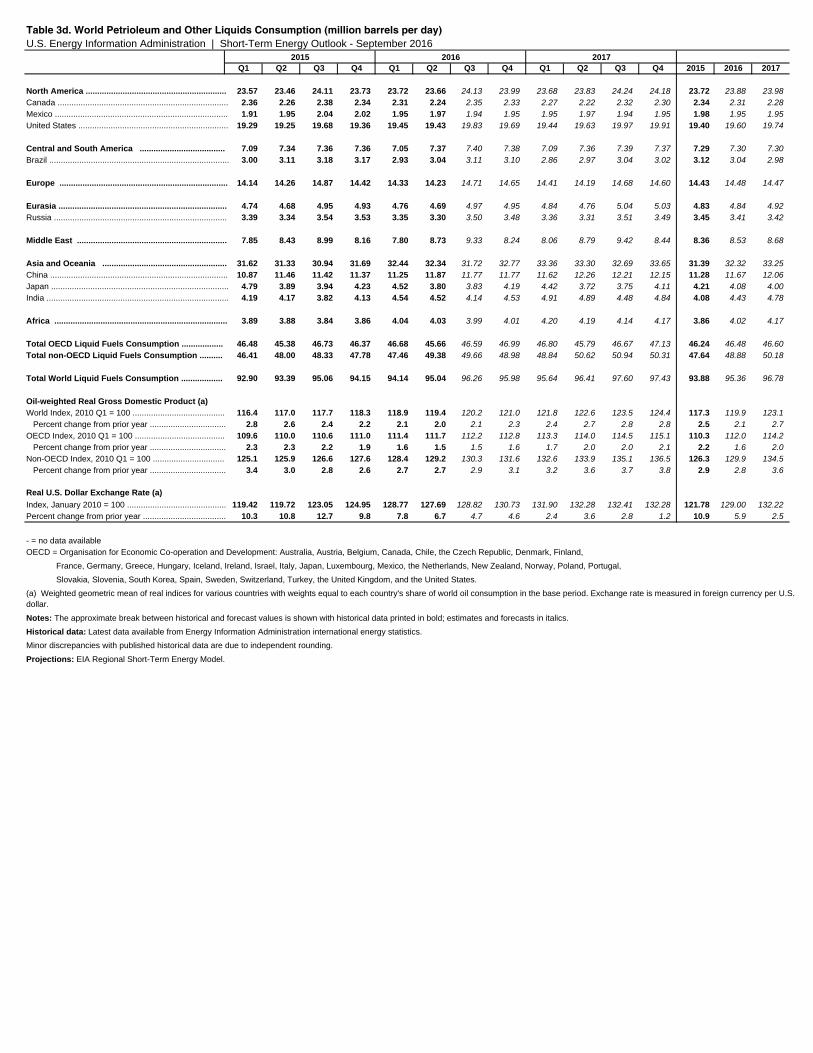
Real U.S. Dollar Exchange Rate (a)Index, January 2010 = 100 ........................................... 119.42 119.72 123.05 124.95 128.77 127.69 128.82 130.73 131.90 132.28 132.41 132.28 121.78 129.00 132.22Percent change from prior year .................................... 10.3 10.8 12.7 9.8 7.8 6.7 4.7 4.6 2.4 3.6 2.8 1.2 10.9 5.9 2.5
Table 3d. World Petrioleum and Other Liquids Consumption (million barrels per day)U.S. Energy Information Administration | Short-Term Energy Outlook - September 2016
2015 2016 2017
Notes: The approximate break between historical and forecast values is shown with historical data printed in bold; estimates and forecasts in italics.Historical data: Latest data available from Energy Information Administration international energy statistics.Minor discrepancies with published historical data are due to independent rounding.
Projections: EIA Regional Short-Term Energy Model.
Oil-weighted Real Gross Domestic Product (a)
- = no data availableOECD = Organisation for Economic Co-operation and Development: Australia, Austria, Belgium, Canada, Chile, the Czech Republic, Denmark, Finland, France, Germany, Greece, Hungary, Iceland, Ireland, Israel, Italy, Japan, Luxembourg, Mexico, the Netherlands, New Zealand, Norway, Poland, Portugal, Slovakia, Slovenia, South Korea, Spain, Sweden, Switzerland, Turkey, the United Kingdom, and the United States.(a) Weighted geometric mean of real indices for various countries with weights equal to each country's share of world oil consumption in the base period. Exchange rate is measured in foreign currency per U.S. dollar.
(e) Renewables and oxygenate production includes pentanes plus, oxygenates (excluding fuel ethanol), and renewable fuels.
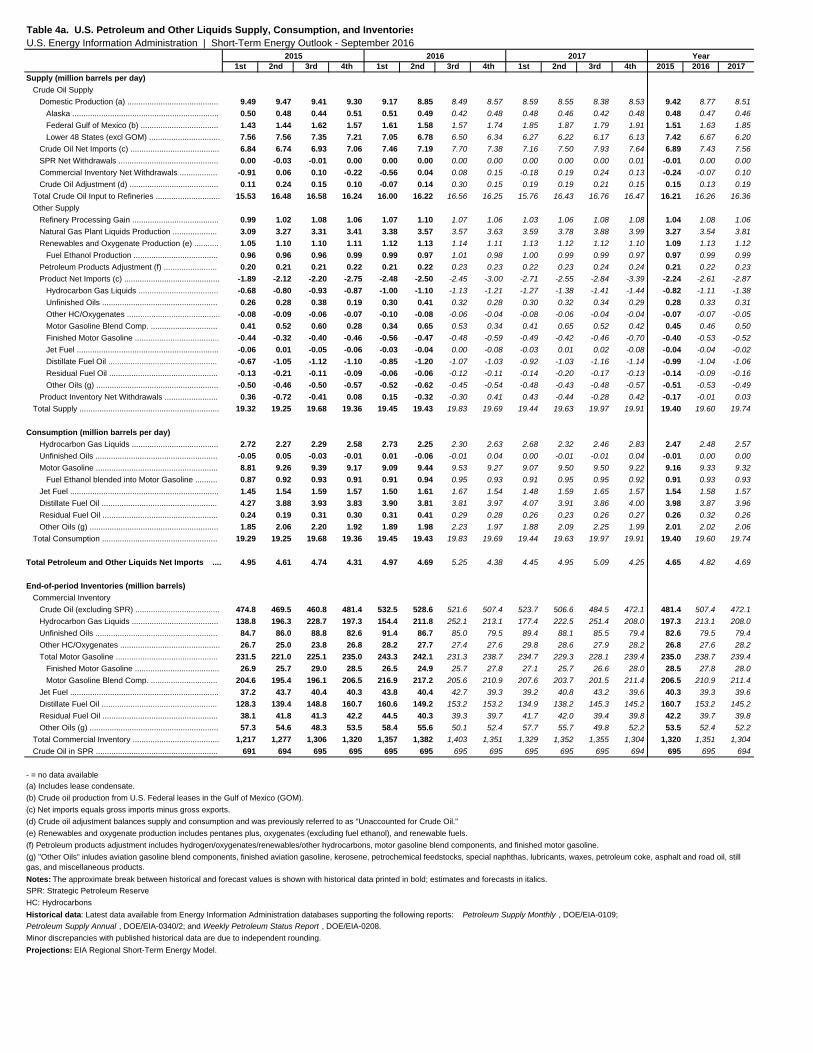
Table 4a. U.S. Petroleum and Other Liquids Supply, Consumption, and InventoriesU.S. Energy Information Administration | Short-Term Energy Outlook - September 2016
2015 2016 2017 Year
- = no data available(a) Includes lease condensate.(b) Crude oil production from U.S. Federal leases in the Gulf of Mexico (GOM).(c) Net imports equals gross imports minus gross exports.(d) Crude oil adjustment balances supply and consumption and was previously referred to as "Unaccounted for Crude Oil."
Petroleum Supply Annual , DOE/EIA-0340/2; and Weekly Petroleum Status Report , DOE/EIA-0208. Minor discrepancies with published historical data are due to independent rounding. Projections: EIA Regional Short-Term Energy Model.
(f) Petroleum products adjustment includes hydrogen/oxygenates/renewables/other hydrocarbons, motor gasoline blend components, and finished motor gasoline.(g) "Other Oils" inludes aviation gasoline blend components, finished aviation gasoline, kerosene, petrochemical feedstocks, special naphthas, lubricants, waxes, petroleum coke, asphalt and road oil, still gas, and miscellaneous products.Notes: The approximate break between historical and forecast values is shown with historical data printed in bold; estimates and forecasts in italics.SPR: Strategic Petroleum ReserveHC: HydrocarbonsHistorical data: Latest data available from Energy Information Administration databases supporting the following reports: Petroleum Supply Monthly , DOE/EIA-0109;
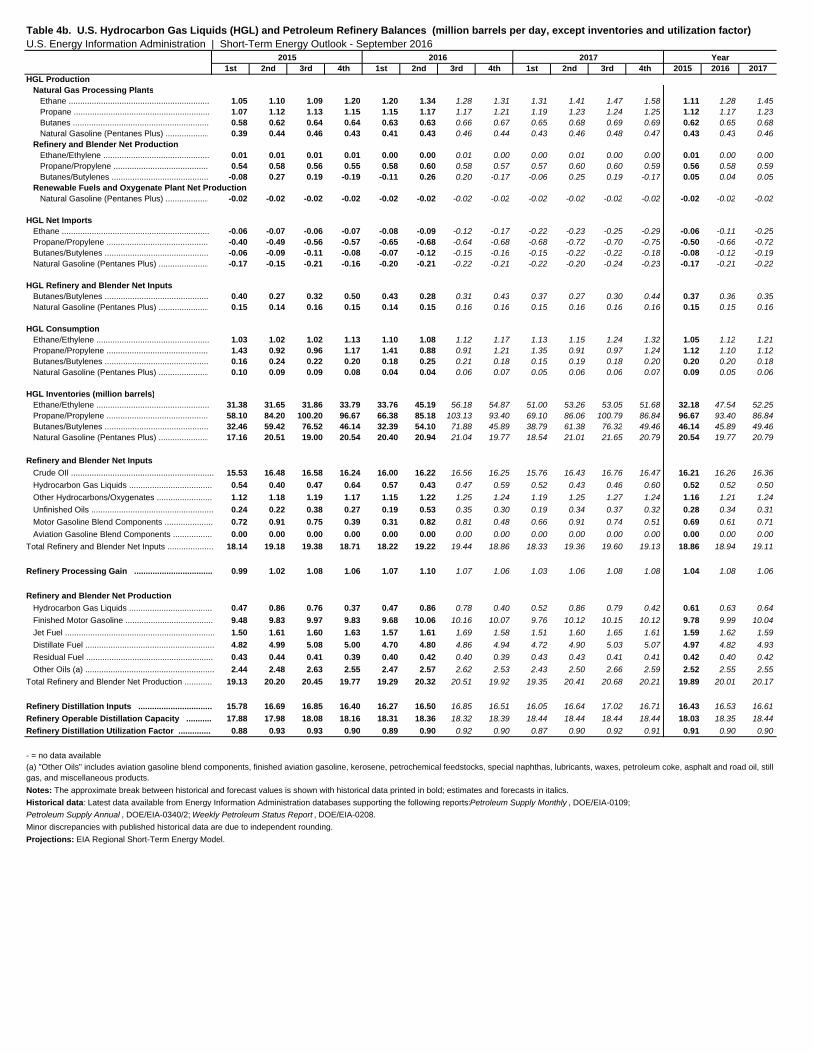
Table 4b. U.S. Hydrocarbon Gas Liquids (HGL) and Petroleum Refinery Balances (million barrels per day, except inventories and utilization factor)U.S. Energy Information Administration | Short-Term Energy Outlook - September 2016
2015 2016 2017 Year
Projections: EIA Regional Short-Term Energy Model.
- = no data available(a) "Other Oils" includes aviation gasoline blend components, finished aviation gasoline, kerosene, petrochemical feedstocks, special naphthas, lubricants, waxes, petroleum coke, asphalt and road oil, still gas, and miscellaneous products.Notes: The approximate break between historical and forecast values is shown with historical data printed in bold; estimates and forecasts in italics.Historical data: Latest data available from Energy Information Administration databases supporting the following reports: Petroleum Supply Monthly , DOE/EIA-0109; Petroleum Supply Annual , DOE/EIA-0340/2; Weekly Petroleum Status Report , DOE/EIA-0208.Minor discrepancies with published historical data are due to independent rounding.
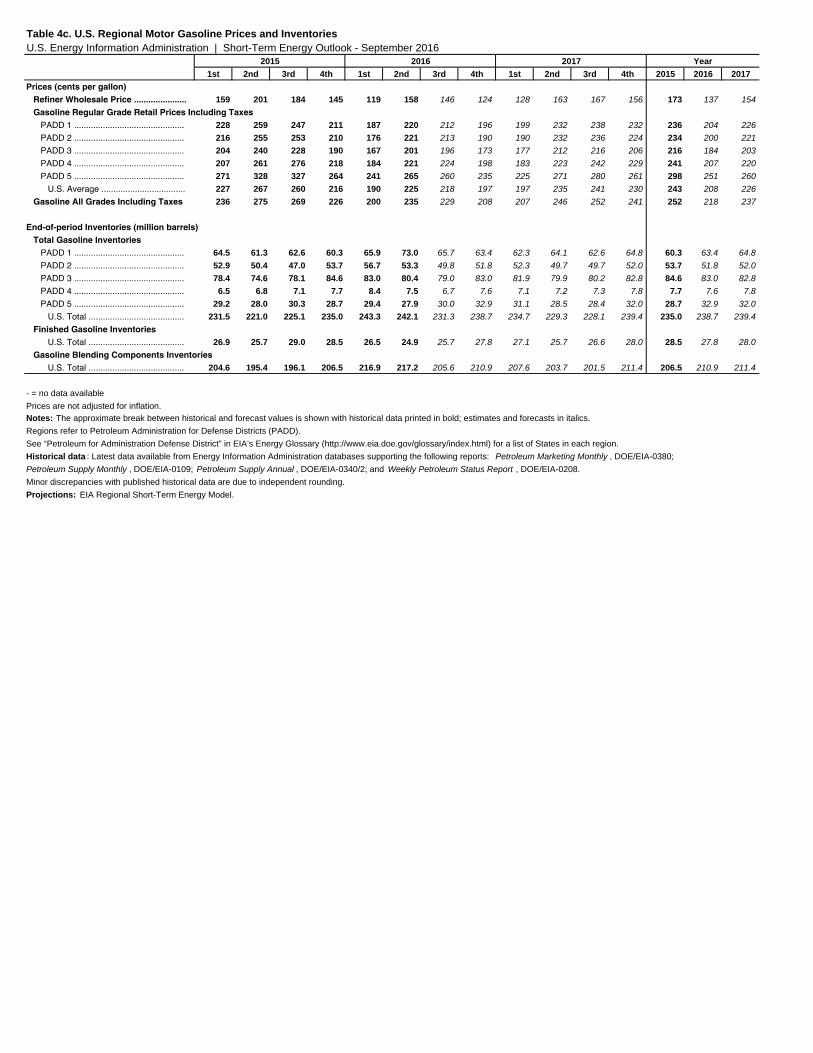
Table 4c. U.S. Regional Motor Gasoline Prices and InventoriesU.S. Energy Information Administration | Short-Term Energy Outlook - September 2016
2015 2016 2017 Year
Petroleum Supply Monthly , DOE/EIA-0109; Petroleum Supply Annual , DOE/EIA-0340/2; and Weekly Petroleum Status Report , DOE/EIA-0208.Minor discrepancies with published historical data are due to independent rounding. Projections: EIA Regional Short-Term Energy Model.
- = no data availablePrices are not adjusted for inflation.Notes: The approximate break between historical and forecast values is shown with historical data printed in bold; estimates and forecasts in italics.Regions refer to Petroleum Administration for Defense Districts (PADD).See “Petroleum for Administration Defense District” in EIA’s Energy Glossary (http://www.eia.doe.gov/glossary/index.html) for a list of States in each region.Historical data : Latest data available from Energy Information Administration databases supporting the following reports: Petroleum Marketing Monthly , DOE/EIA-0380;
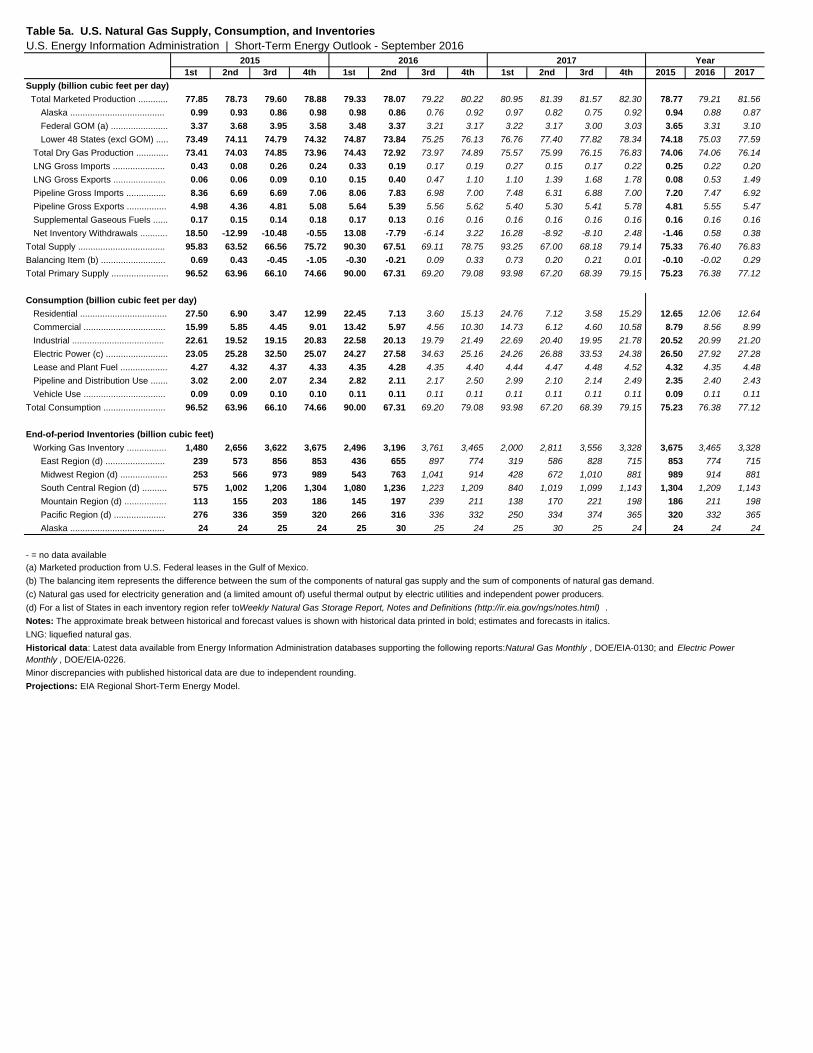
Table 5a. U.S. Natural Gas Supply, Consumption, and InventoriesU.S. Energy Information Administration | Short-Term Energy Outlook - September 2016
2015 2016 2017 Year
LNG: liquefied natural gas.Historical data: Latest data available from Energy Information Administration databases supporting the following reports: Natural Gas Monthly , DOE/EIA-0130; and Electric Power Monthly , DOE/EIA-0226.Minor discrepancies with published historical data are due to independent rounding. Projections: EIA Regional Short-Term Energy Model.
- = no data available(a) Marketed production from U.S. Federal leases in the Gulf of Mexico.(b) The balancing item represents the difference between the sum of the components of natural gas supply and the sum of components of natural gas demand.(c) Natural gas used for electricity generation and (a limited amount of) useful thermal output by electric utilities and independent power producers.(d) For a list of States in each inventory region refer to Weekly Natural Gas Storage Report, Notes and Definitions (http://ir.eia.gov/ngs/notes.html) .Notes: The approximate break between historical and forecast values is shown with historical data printed in bold; estimates and forecasts in italics.
U.S. Average .................. 4.68 3.75 3.72 3.43 3.43 2.93 3.73 4.00 4.47 3.73 3.86 4.22 3.92 3.54 4.08
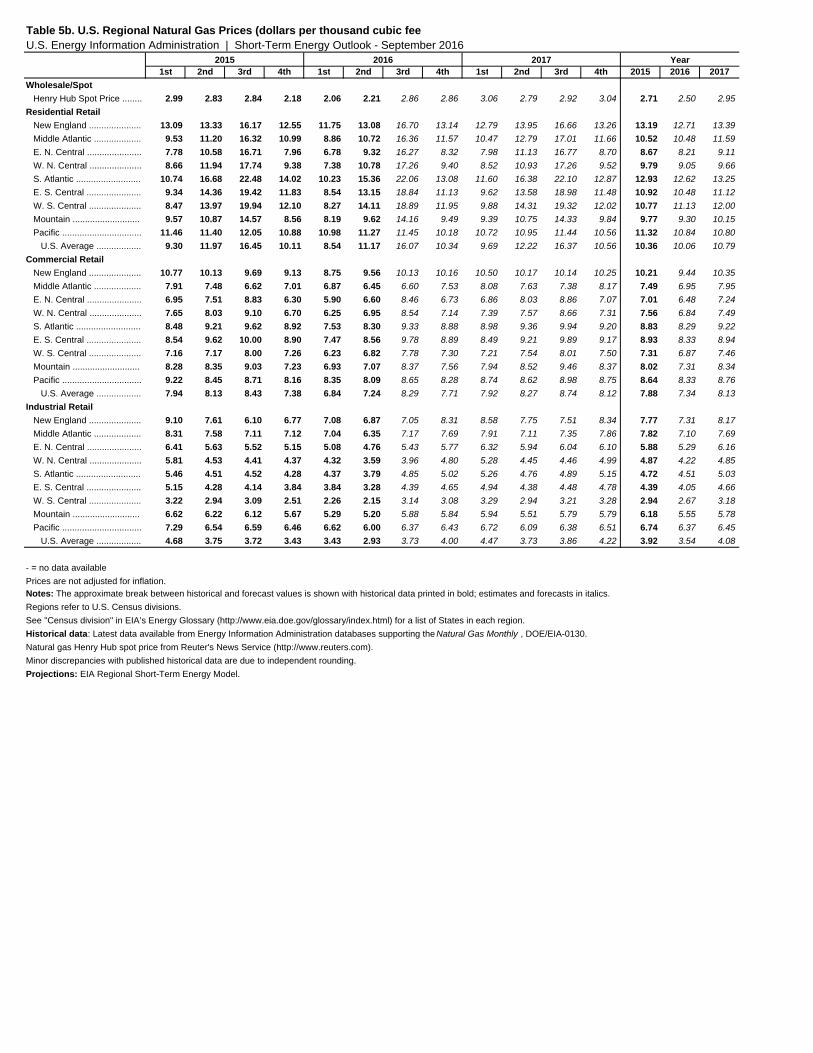
Table 5b. U.S. Regional Natural Gas Prices (dollars per thousand cubic feetU.S. Energy Information Administration | Short-Term Energy Outlook - September 2016
2015 2016 2017 Year
Natural gas Henry Hub spot price from Reuter's News Service (http://www.reuters.com).Minor discrepancies with published historical data are due to independent rounding. Projections: EIA Regional Short-Term Energy Model.
- = no data availablePrices are not adjusted for inflation.Notes: The approximate break between historical and forecast values is shown with historical data printed in bold; estimates and forecasts in italics.Regions refer to U.S. Census divisions. See "Census division" in EIA’s Energy Glossary (http://www.eia.doe.gov/glossary/index.html) for a list of States in each region.Historical data: Latest data available from Energy Information Administration databases supporting the Natural Gas Monthly , DOE/EIA-0130.
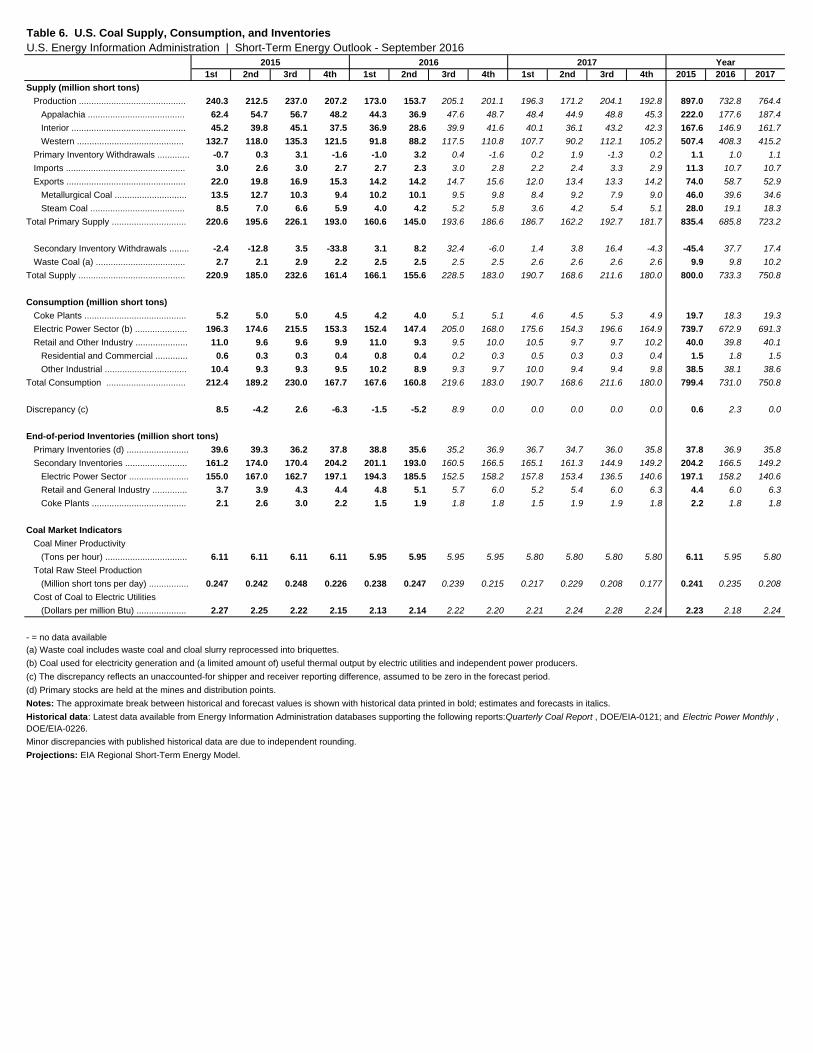
Total Raw Steel Production (Million short tons per day) ................ 0.247 0.242 0.248 0.226 0.238 0.247 0.239 0.215 0.217 0.229 0.208 0.177 0.241 0.235 0.208
Cost of Coal to Electric Utilities (Dollars per million Btu) .................... 2.27 2.25 2.22 2.15 2.13 2.14 2.22 2.20 2.21 2.24 2.28 2.24 2.23 2.18 2.24
Table 6. U.S. Coal Supply, Consumption, and InventoriesU.S. Energy Information Administration | Short-Term Energy Outlook - September 2016
2015 2016 2017 Year
Historical data: Latest data available from Energy Information Administration databases supporting the following reports: Quarterly Coal Report , DOE/EIA-0121; and Electric Power Monthly , DOE/EIA-0226.Minor discrepancies with published historical data are due to independent rounding. Projections: EIA Regional Short-Term Energy Model.
- = no data available(a) Waste coal includes waste coal and cloal slurry reprocessed into briquettes.(b) Coal used for electricity generation and (a limited amount of) useful thermal output by electric utilities and independent power producers.(c) The discrepancy reflects an unaccounted-for shipper and receiver reporting difference, assumed to be zero in the forecast period.(d) Primary stocks are held at the mines and distribution points.Notes: The approximate break between historical and forecast values is shown with historical data printed in bold; estimates and forecasts in italics.
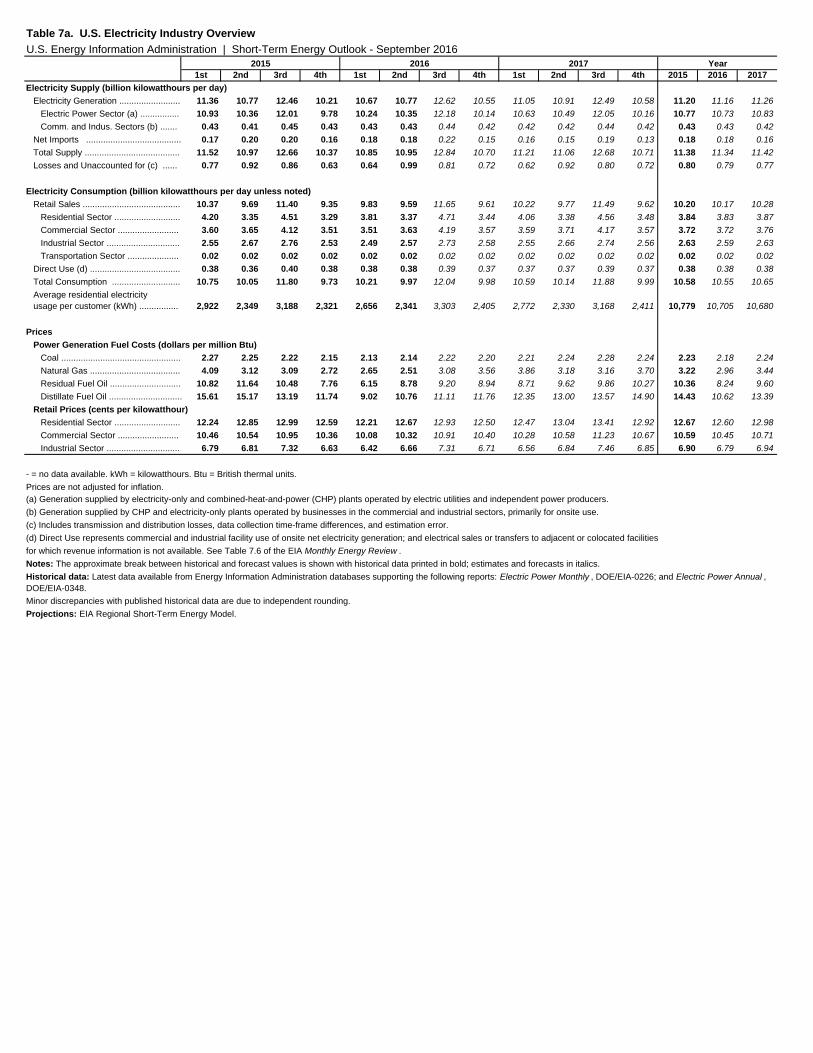
Table 7a. U.S. Electricity Industry OverviewU.S. Energy Information Administration | Short-Term Energy Outlook - September 2016
2015 2016 2017 Year
Electricity Supply (billion kilowatthours per day)
Electricity Consumption (billion kilowatthours per day unless noted)
Power Generation Fuel Costs (dollars per million Btu)
Retail Prices (cents per kilowatthour)
- = no data available. kWh = kilowatthours. Btu = British thermal units.
Historical data: Latest data available from Energy Information Administration databases supporting the following reports: Electric Power Monthly , DOE/EIA-0226; and Electric Power Annual , DOE/EIA-0348.Minor discrepancies with published historical data are due to independent rounding. Projections: EIA Regional Short-Term Energy Model.
(a) Generation supplied by electricity-only and combined-heat-and-power (CHP) plants operated by electric utilities and independent power producers.(b) Generation supplied by CHP and electricity-only plants operated by businesses in the commercial and industrial sectors, primarily for onsite use.(c) Includes transmission and distribution losses, data collection time-frame differences, and estimation error.(d) Direct Use represents commercial and industrial facility use of onsite net electricity generation; and electrical sales or transfers to adjacent or colocated facilities for which revenue information is not available. See Table 7.6 of the EIA Monthly Energy Review .Notes: The approximate break between historical and forecast values is shown with historical data printed in bold; estimates and forecasts in italics.
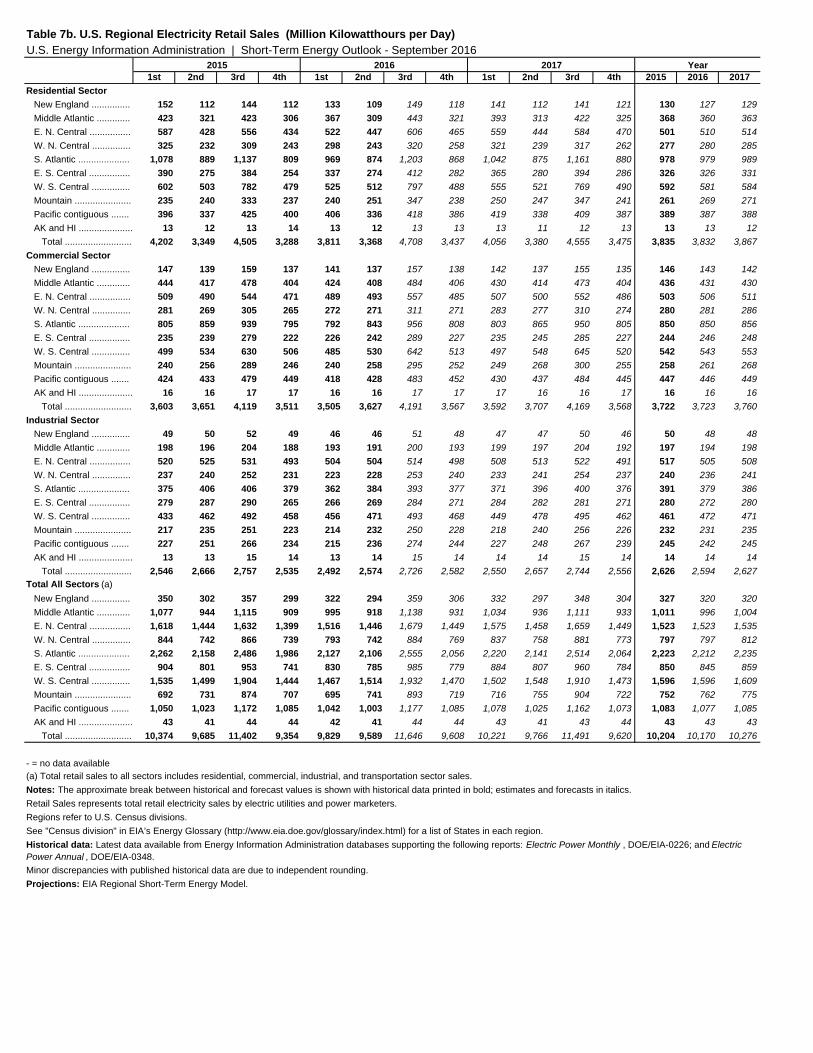
Table 7b. U.S. Regional Electricity Retail Sales (Million Kilowatthours per Day)U.S. Energy Information Administration | Short-Term Energy Outlook - September 2016
2015 2016 2017 Year
Historical data: Latest data available from Energy Information Administration databases supporting the following reports: Electric Power Monthly , DOE/EIA-0226; and Electric Power Annual , DOE/EIA-0348. Minor discrepancies with published historical data are due to independent rounding. Projections: EIA Regional Short-Term Energy Model.
- = no data available(a) Total retail sales to all sectors includes residential, commercial, industrial, and transportation sector sales.Notes: The approximate break between historical and forecast values is shown with historical data printed in bold; estimates and forecasts in italics.Retail Sales represents total retail electricity sales by electric utilities and power marketers. Regions refer to U.S. Census divisions. See "Census division" in EIA’s Energy Glossary (http://www.eia.doe.gov/glossary/index.html) for a list of States in each region.
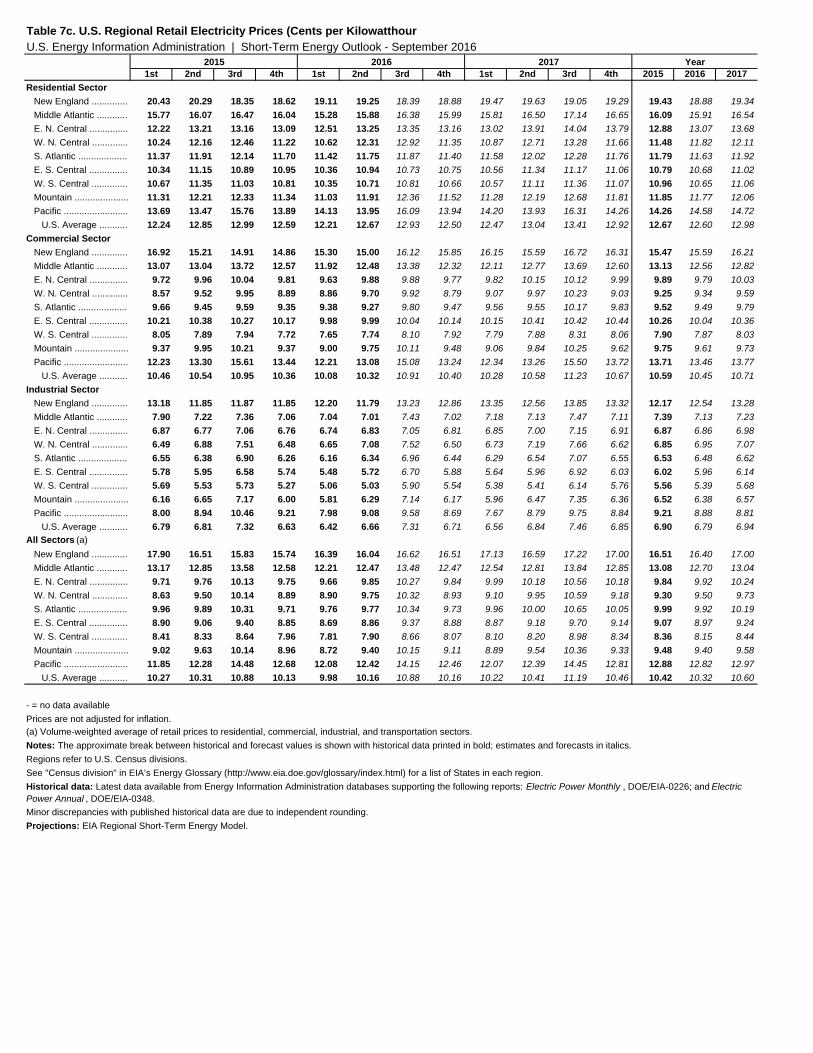
U.S. Average ........... 10.27 10.31 10.88 10.13 9.98 10.16 10.88 10.16 10.22 10.41 11.19 10.46 10.42 10.32 10.60
Table 7c. U.S. Regional Retail Electricity Prices (Cents per KilowatthourU.S. Energy Information Administration | Short-Term Energy Outlook - September 2016
2015 2016 2017 Year
Historical data: Latest data available from Energy Information Administration databases supporting the following reports: Electric Power Monthly , DOE/EIA-0226; and Electric Power Annual , DOE/EIA-0348.Minor discrepancies with published historical data are due to independent rounding. Projections: EIA Regional Short-Term Energy Model.
- = no data availablePrices are not adjusted for inflation.(a) Volume-weighted average of retail prices to residential, commercial, industrial, and transportation sectors.Notes: The approximate break between historical and forecast values is shown with historical data printed in bold; estimates and forecasts in italics.Regions refer to U.S. Census divisions. See "Census division" in EIA’s Energy Glossary (http://www.eia.doe.gov/glossary/index.html) for a list of States in each region.
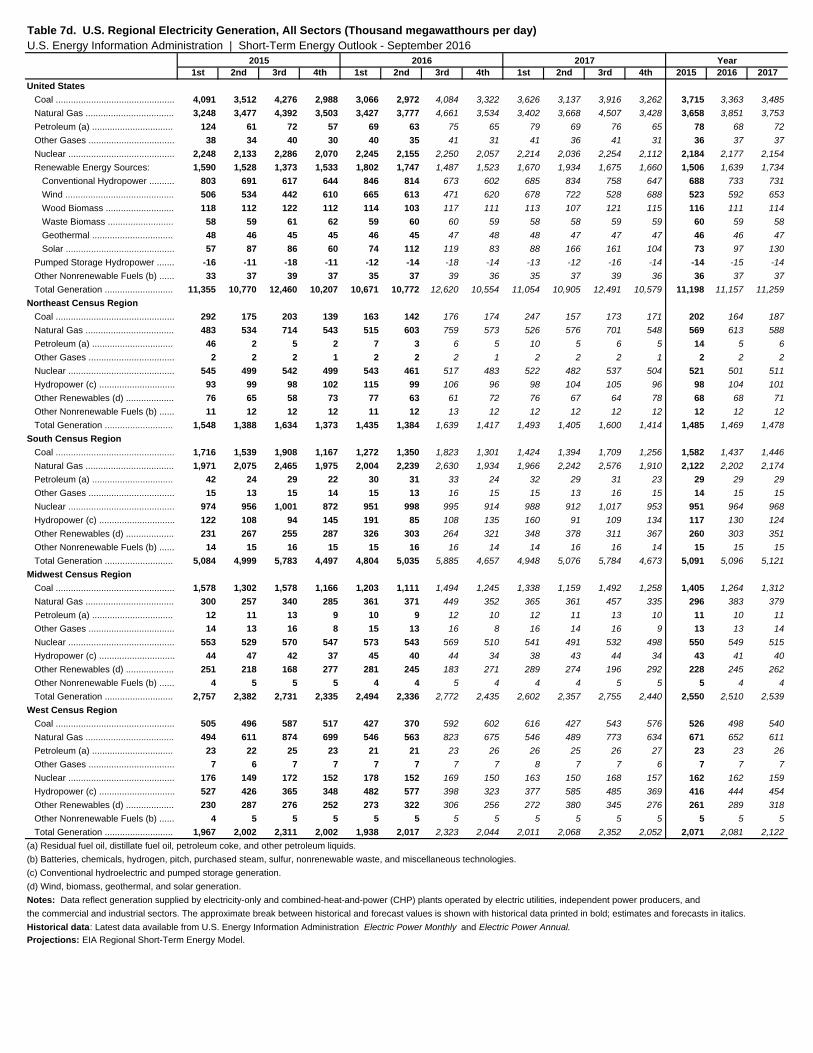
Table 7d. U.S. Regional Electricity Generation, All Sectors (Thousand megawatthours per day) U.S. Energy Information Administration | Short-Term Energy Outlook - September 2016
2015 2016 2017 Year
Historical data: Latest data available from U.S. Energy Information Administration Electric Power Monthly and Electric Power Annual.
Projections: EIA Regional Short-Term Energy Model.
(a) Residual fuel oil, distillate fuel oil, petroleum coke, and other petroleum liquids.(b) Batteries, chemicals, hydrogen, pitch, purchased steam, sulfur, nonrenewable waste, and miscellaneous technologies.(c) Conventional hydroelectric and pumped storage generation.(d) Wind, biomass, geothermal, and solar generation.Notes: Data reflect generation supplied by electricity-only and combined-heat-and-power (CHP) plants operated by electric utilities, independent power producers, andthe commercial and industrial sectors. The approximate break between historical and forecast values is shown with historical data printed in bold; estimates and forecasts in italics.
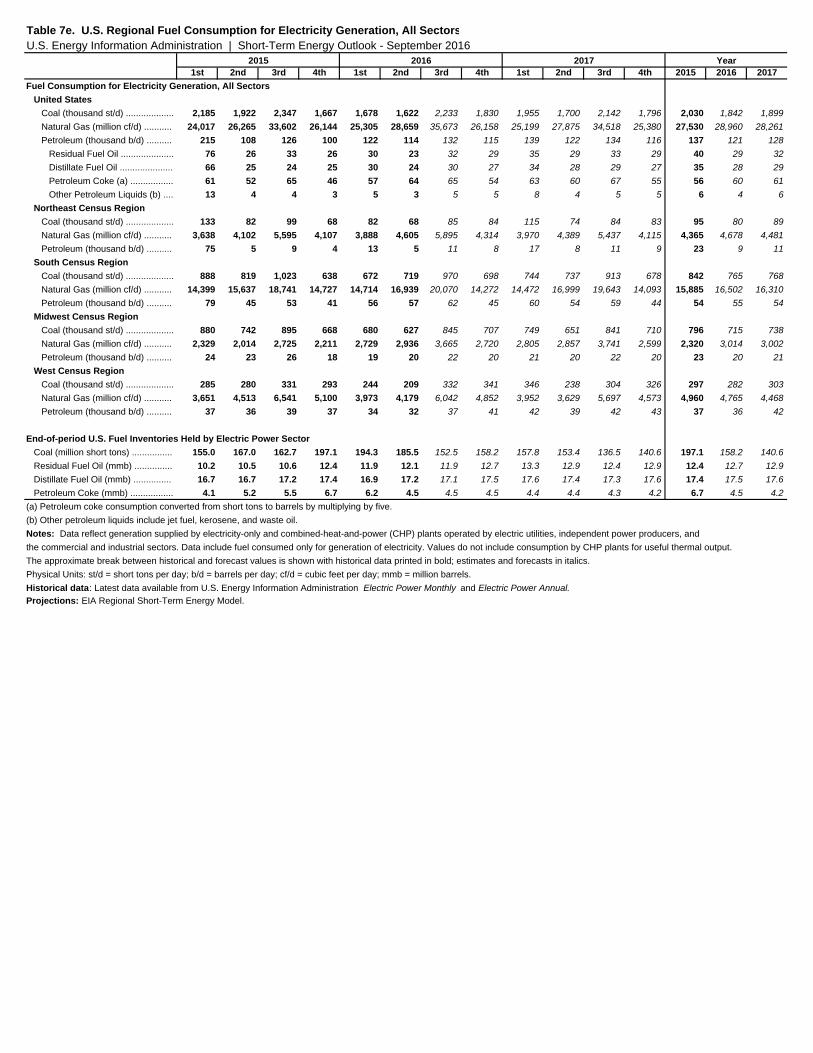
End-of-period U.S. Fuel Inventories Held by Electric Power Sector Coal (million short tons) ................ 155.0 167.0 162.7 197.1 194.3 185.5 152.5 158.2 157.8 153.4 136.5 140.6 197.1 158.2 140.6
Table 7e. U.S. Regional Fuel Consumption for Electricity Generation, All SectorsU.S. Energy Information Administration | Short-Term Energy Outlook - September 2016
2015 2016 2017 Year
Historical data: Latest data available from U.S. Energy Information Administration Electric Power Monthly and Electric Power Annual.
Projections: EIA Regional Short-Term Energy Model.
(a) Petroleum coke consumption converted from short tons to barrels by multiplying by five.(b) Other petroleum liquids include jet fuel, kerosene, and waste oil.Notes: Data reflect generation supplied by electricity-only and combined-heat-and-power (CHP) plants operated by electric utilities, independent power producers, andthe commercial and industrial sectors. Data include fuel consumed only for generation of electricity. Values do not include consumption by CHP plants for useful thermal output.The approximate break between historical and forecast values is shown with historical data printed in bold; estimates and forecasts in italics.Physical Units: st/d = short tons per day; b/d = barrels per day; cf/d = cubic feet per day; mmb = million barrels.
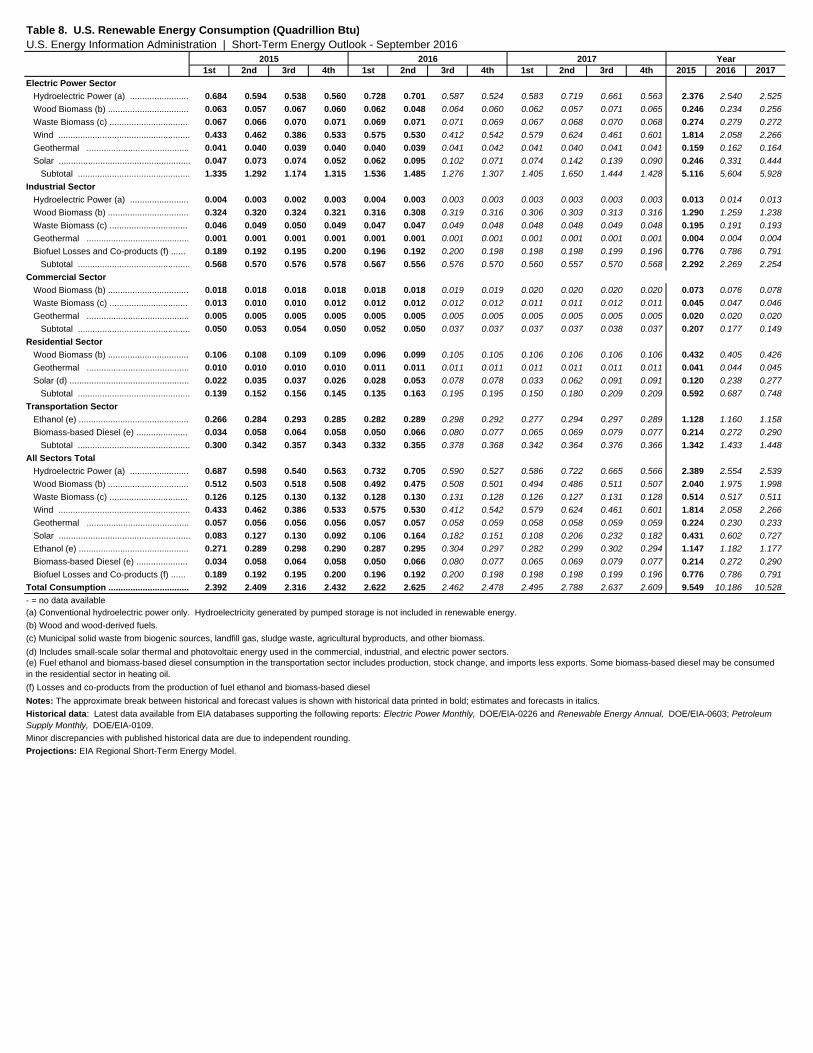
(e) Fuel ethanol and biomass-based diesel consumption in the transportation sector includes production, stock change, and imports less exports. Some biomass-based diesel may be consumed in the residential sector in heating oil.
Table 8. U.S. Renewable Energy Consumption (Quadrillion Btu)U.S. Energy Information Administration | Short-Term Energy Outlook - September 2016
2015 2016 2017 Year
- = no data available(a) Conventional hydroelectric power only. Hydroelectricity generated by pumped storage is not included in renewable energy.(b) Wood and wood-derived fuels.(c) Municipal solid waste from biogenic sources, landfill gas, sludge waste, agricultural byproducts, and other biomass.(d) Includes small-scale solar thermal and photovoltaic energy used in the commercial, industrial, and electric power sectors.
(f) Losses and co-products from the production of fuel ethanol and biomass-based dieselNotes: The approximate break between historical and forecast values is shown with historical data printed in bold; estimates and forecasts in italics.Historical data: Latest data available from EIA databases supporting the following reports: Electric Power Monthly, DOE/EIA-0226 and Renewable Energy Annual, DOE/EIA-0603; Petroleum Supply Monthly, DOE/EIA-0109. Minor discrepancies with published historical data are due to independent rounding. Projections: EIA Regional Short-Term Energy Model.
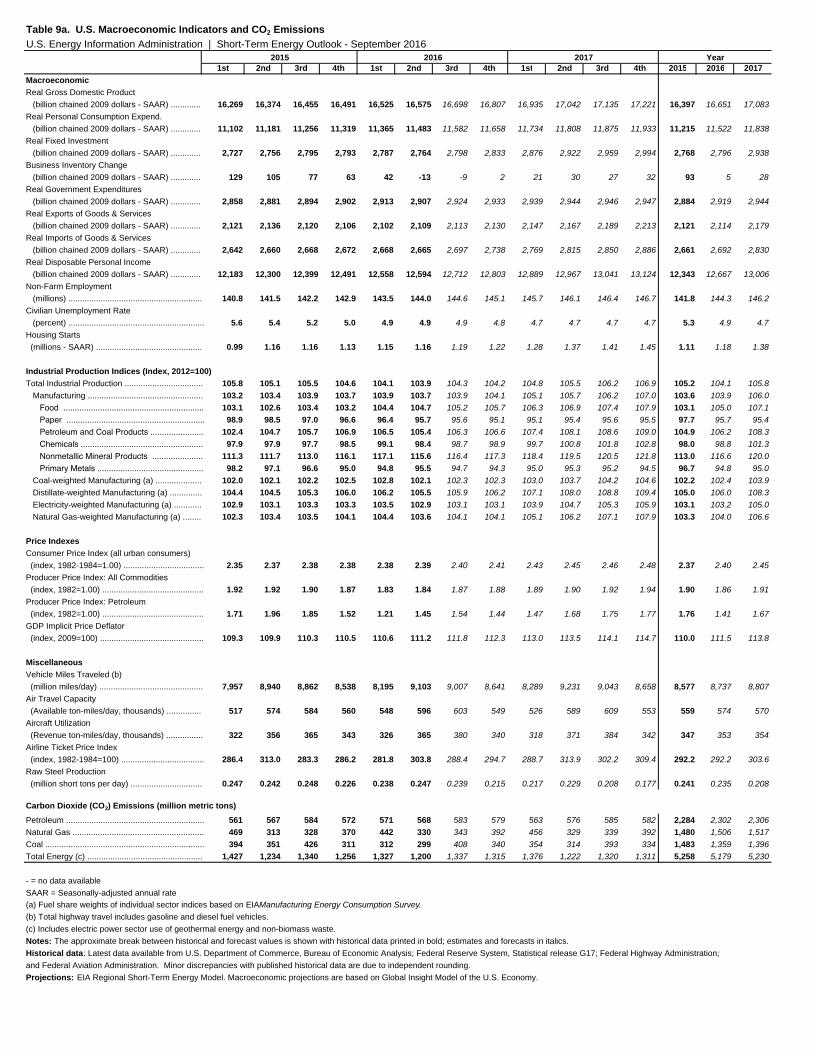
Total Energy (c) .................................................. 1,427 1,234 1,340 1,256 1,327 1,200 1,337 1,315 1,376 1,222 1,320 1,311 5,258 5,179 5,230
SAAR = Seasonally-adjusted annual rate
Table 9a. U.S. Macroeconomic Indicators and CO2 EmissionsU.S. Energy Information Administration | Short-Term Energy Outlook - September 2016
2015 2016 2017 Year
and Federal Aviation Administration. Minor discrepancies with published historical data are due to independent rounding. Projections: EIA Regional Short-Term Energy Model. Macroeconomic projections are based on Global Insight Model of the U.S. Economy.
- = no data available
(a) Fuel share weights of individual sector indices based on EIA Manufacturing Energy Consumption Survey.(b) Total highway travel includes gasoline and diesel fuel vehicles.(c) Includes electric power sector use of geothermal energy and non-biomass waste.Notes: The approximate break between historical and forecast values is shown with historical data printed in bold; estimates and forecasts in italics.Historical data: Latest data available from U.S. Department of Commerce, Bureau of Economic Analysis; Federal Reserve System, Statistical release G17; Federal Highway Administration;
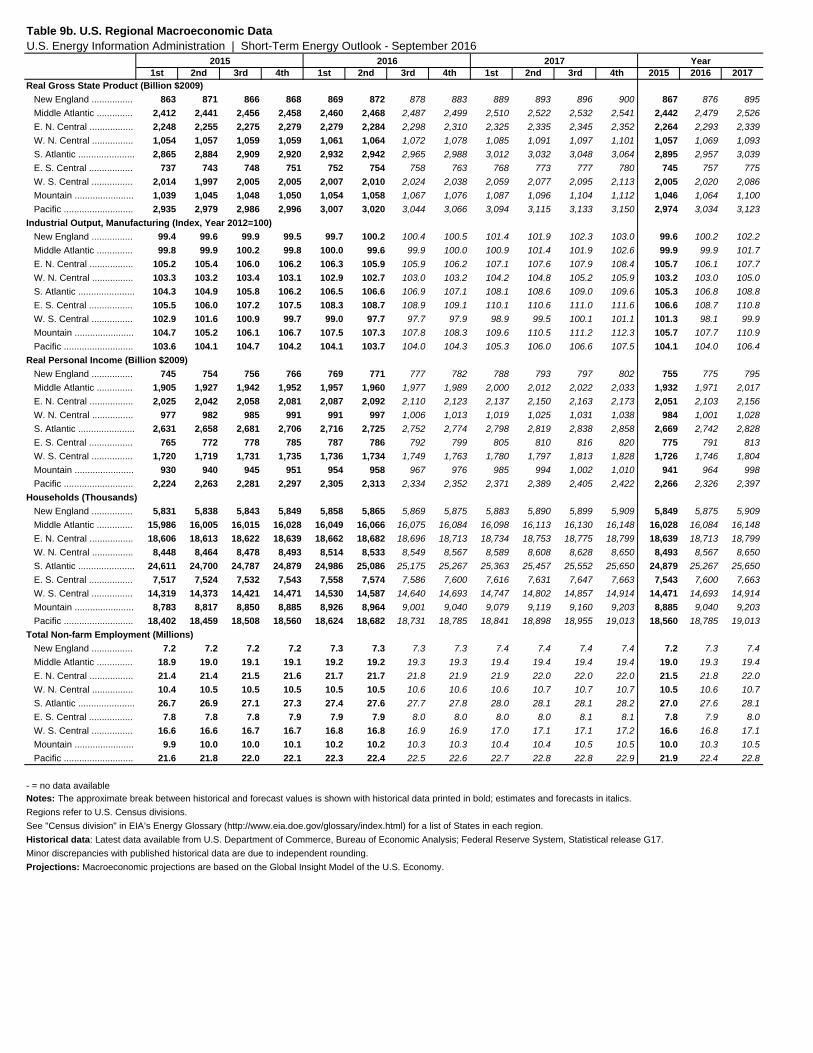
Table 9b. U.S. Regional Macroeconomic DataU.S. Energy Information Administration | Short-Term Energy Outlook - September 2016
2015 2016 2017 Year
Projections: Macroeconomic projections are based on the Global Insight Model of the U.S. Economy.
- = no data availableNotes: The approximate break between historical and forecast values is shown with historical data printed in bold; estimates and forecasts in italics.Regions refer to U.S. Census divisions. See "Census division" in EIA’s Energy Glossary (http://www.eia.doe.gov/glossary/index.html) for a list of States in each region.Historical data: Latest data available from U.S. Department of Commerce, Bureau of Economic Analysis; Federal Reserve System, Statistical release G17.Minor discrepancies with published historical data are due to independent rounding.
U.S. Average ............. 40 396 850 84 42 404 846 89 43 405 854 91 1,370 1,380 1,393
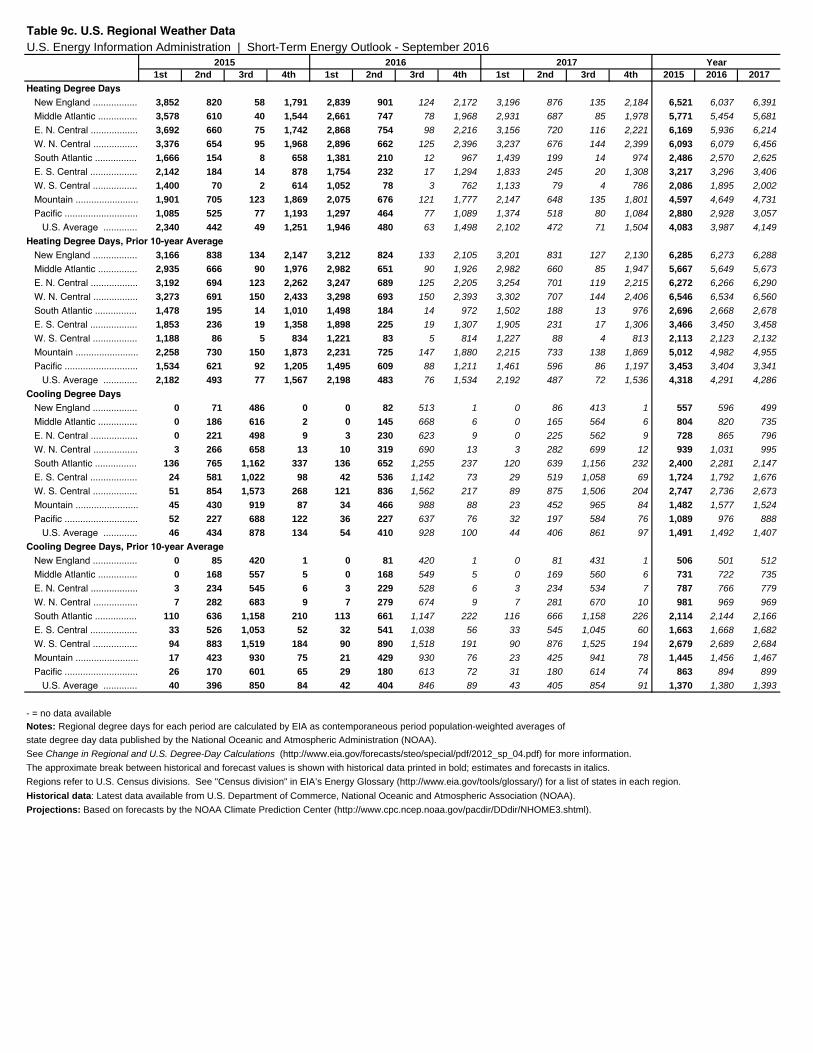
Table 9c. U.S. Regional Weather DataU.S. Energy Information Administration | Short-Term Energy Outlook - September 2016
2015 2016 2017 Year
Historical data: Latest data available from U.S. Department of Commerce, National Oceanic and Atmospheric Association (NOAA).Projections: Based on forecasts by the NOAA Climate Prediction Center (http://www.cpc.ncep.noaa.gov/pacdir/DDdir/NHOME3.shtml).
- = no data availableNotes: Regional degree days for each period are calculated by EIA as contemporaneous period population-weighted averages ofstate degree day data published by the National Oceanic and Atmospheric Administration (NOAA).See Change in Regional and U.S. Degree-Day Calculations (http://www.eia.gov/forecasts/steo/special/pdf/2012_sp_04.pdf) for more information.The approximate break between historical and forecast values is shown with historical data printed in bold; estimates and forecasts in italics.Regions refer to U.S. Census divisions. See "Census division" in EIA’s Energy Glossary (http://www.eia.gov/tools/glossary/) for a list of states in each region.