38
5 Short-Term Financial Decisions Part Chapter 13 Working Capital and Current Assets Management Chapter 14 Current Liabilities Management
5Short-TermFinancialDecisions
Part
Chapter 13
Working Capital and Current Assets Management
Chapter 14
Current Liabilities Management

492
Working Capitaland
Current AssetsManagement
Chapter Across the Disciplines Why This Chapter Matters To You
Accounting: In order to record and reportthe firm’s transactions, you need to under-stand the cash conversion cycle and themanagement of inventory, accountsreceivable, and receipts and disburse-ments of cash.
Information systems: You need to under-stand the cash conversion cycle, inven-tory, accounts receivable, and receiptsand disbursements of cash in order todesign financial information systems thatenhance effective short-term financialmanagement.
Management: You need to understandmanagement of working capital and cur-rent assets so that you can decidewhether to finance the firm’s fundsrequirements aggressively orconservatively.
Marketing: You need to understand creditselection and monitoring because saleswill be affected by the availability of creditto purchasers; sales will also be affectedby inventory management.
Operations: You need to understand thecash conversion cycle because you willbe responsible for reducing the cyclethrough the efficient management ofinventory levels and costs.
13
LEARNING GOALS
Understand short-term financialmanagement, net working capital, and the related tradeoff betweenprofitability and risk.
Describe the cash conversion cycle,its funding requirements, and the keystrategies for managing it.
Discuss inventory management:differing views, common techniques,and international concerns.
Explain the credit selection processand the quantitative procedure forevaluating changes in creditstandards.
Review the procedures forquantitatively considering cashdiscount changes, other aspects ofcredit terms, and credit monitoring.
Understand the management ofreceipts and disbursements, includingfloat, speeding collections, slowingpayments, cash concentration, zero-balance accounts, and investing inmarketable securities.
LG6
LG5
LG4
LG3
LG2
LG1

CHAPTER 13 Working Capital and Current Assets Management 493
Net Working Capital Fundamentals
The firm’s balance sheet provides information about the structure of a firm’sinvestments on the one hand and the structure of its financing sources on theother. The structures chosen should consistently lead to the maximization of thevalue of the owners’ investment in the firm.
Important components of the firm’s financial structure include the level ofinvestment in current assets and the extent of current liability financing. In U.S.manufacturing firms, current assets account for about 40 percent of total assets;current liabilities represent about 26 percent of total financing. Therefore, itshould not be surprising to learn that short-term financial management—manag-ing current assets and current liabilities—is one of the financial manager’s mostimportant and time-consuming activities. A study of Fortune 1000 firms foundthat more than one-third of financial management time is spent managing currentassets and about one-fourth of financial management time is spent managing cur-rent liabilities.
The goal of short-term financial management is to manage each of the firm’scurrent assets (inventory, accounts receivable, cash, and marketable securities)and current liabilities (accounts payable, accruals, and notes payable) to achievea balance between profitability and risk that contributes positively to the firm’svalue. This chapter does not discuss the optimal level of current assets and cur-rent liabilities that a firm should have. That issue is unresolved in the financial lit-erature. Here we first use net working capital to consider the basic relationshipbetween current assets and current liabilities and then use the cash conversioncycle to consider the key aspects of current asset management. In the followingchapter, we consider current liability management.
Net Working CapitalCurrent assets, commonly called working capital, represent the portion of invest-ment that circulates from one form to another in the ordinary conduct of busi-ness. This idea embraces the recurring transition from cash to inventories toreceivables and back to cash. As cash substitutes, marketable securities are con-sidered part of working capital.
Current liabilities represent the firm’s short-term financing, because theyinclude all debts of the firm that come due (must be paid) in 1 year or less. Thesedebts usually include amounts owed to suppliers (accounts payable), employeesand governments (accruals), and banks (notes payable), among others.
An important consideration for all firms is the ability to finance the transitionfrom cash to inventories to receivables and back to cash. Various strategies
exist for managing current assets in order to reduce the amount of financingneeded to support this cycle. In addition to managing cash, firms also must man-age the accounts that typically represent the firm’s largest investment in currentassets—inventories and accounts receivable. This chapter looks at the manage-ment of these various aspects of the firm’s current assets.
short-term financial managementManagement of current assetsand current liabilities.
working capitalCurrent assets, which representthe portion of investment thatcirculates from one form toanother in the ordinary conductof business.
LG1
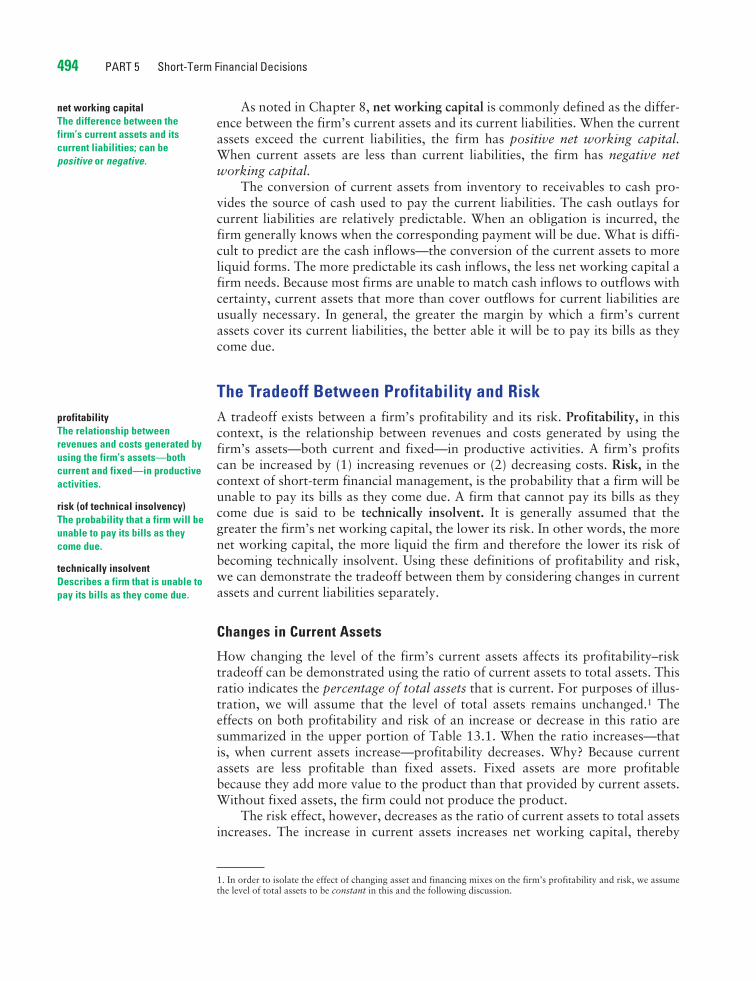
As noted in Chapter 8, net working capital is commonly defined as the differ-ence between the firm’s current assets and its current liabilities. When the currentassets exceed the current liabilities, the firm has positive net working capital.When current assets are less than current liabilities, the firm has negative networking capital.
The conversion of current assets from inventory to receivables to cash pro-vides the source of cash used to pay the current liabilities. The cash outlays forcurrent liabilities are relatively predictable. When an obligation is incurred, thefirm generally knows when the corresponding payment will be due. What is diffi-cult to predict are the cash inflows—the conversion of the current assets to moreliquid forms. The more predictable its cash inflows, the less net working capital afirm needs. Because most firms are unable to match cash inflows to outflows withcertainty, current assets that more than cover outflows for current liabilities areusually necessary. In general, the greater the margin by which a firm’s currentassets cover its current liabilities, the better able it will be to pay its bills as theycome due.
The Tradeoff Between Profitability and RiskA tradeoff exists between a firm’s profitability and its risk. Profitability, in thiscontext, is the relationship between revenues and costs generated by using thefirm’s assets—both current and fixed—in productive activities. A firm’s profitscan be increased by (1) increasing revenues or (2) decreasing costs. Risk, in thecontext of short-term financial management, is the probability that a firm will beunable to pay its bills as they come due. A firm that cannot pay its bills as theycome due is said to be technically insolvent. It is generally assumed that thegreater the firm’s net working capital, the lower its risk. In other words, the morenet working capital, the more liquid the firm and therefore the lower its risk ofbecoming technically insolvent. Using these definitions of profitability and risk,we can demonstrate the tradeoff between them by considering changes in currentassets and current liabilities separately.
Changes in Current Assets
How changing the level of the firm’s current assets affects its profitability–risktradeoff can be demonstrated using the ratio of current assets to total assets. Thisratio indicates the percentage of total assets that is current. For purposes of illus-tration, we will assume that the level of total assets remains unchanged.1 Theeffects on both profitability and risk of an increase or decrease in this ratio aresummarized in the upper portion of Table 13.1. When the ratio increases—thatis, when current assets increase—profitability decreases. Why? Because currentassets are less profitable than fixed assets. Fixed assets are more profitablebecause they add more value to the product than that provided by current assets.Without fixed assets, the firm could not produce the product.
The risk effect, however, decreases as the ratio of current assets to total assetsincreases. The increase in current assets increases net working capital, thereby
494 PART 5 Short-Term Financial Decisions
profitabilityThe relationship betweenrevenues and costs generated byusing the firm’s assets—bothcurrent and fixed—in productiveactivities.
risk (of technical insolvency)The probability that a firm will beunable to pay its bills as theycome due.
1. In order to isolate the effect of changing asset and financing mixes on the firm’s profitability and risk, we assumethe level of total assets to be constant in this and the following discussion.
net working capitalThe difference between thefirm’s current assets and itscurrent liabilities; can bepositive or negative.
technically insolventDescribes a firm that is unable topay its bills as they come due.

CHAPTER 13 Working Capital and Current Assets Management 495
reducing the risk of technical insolvency. In addition, as you go down the assetside of the balance sheet, the risk associated with the assets increases: Investmentin cash and marketable securities is less risky than investment in accounts receiv-able, inventories, and fixed assets. Accounts receivable investment is less riskythan investment in inventories and fixed assets. Investment in inventories is lessrisky than investment in fixed assets. The nearer an asset is to cash, the less riskyit is. The opposite effects on profit and risk result from a decrease in the ratio ofcurrent assets to total assets.
Changes in Current Liabilities
How changing the level of the firm’s current liabilities affects its profitability–risktradeoff can be demonstrated by using the ratio of current liabilities to totalassets. This ratio indicates the percentage of total assets that has been financedwith current liabilities. Again, assuming that total assets remain unchanged, theeffects on both profitability and risk of an increase or decrease in the ratio aresummarized in the lower portion of Table 13.1. When the ratio increases, prof-itability increases. Why? Because the firm uses more of the less expensive currentliabilities financing and less long-term financing. Current liabilities are less expen-sive because only notes payable, which represent about 20 percent of the typicalmanufacturer’s current liabilities, have a cost. The other current liabilities arebasically debts on which the firm pays no charge or interest. However, when theratio of current liabilities to total assets increases, the risk of technical insolvencyalso increases, because the increase in current liabilities in turn decreases networking capital. The opposite effects on profit and risk result from a decrease inthe ratio of current liabilities to total assets.
Review Questions
13–1 Why is short-term financial management one of the most important andtime-consuming activities of the financial manager? What is net workingcapital?
13–2 What is the relationship between the predictability of a firm’s cash inflowsand its required level of net working capital? How are net working capi-tal, liquidity, and risk of technical insolvency related?
T A B L E 1 3 . 1 Effects of Changing Ratioson Profits and Risk
Change Effect Effect Ratio in ratio on profit on risk
Increase Decrease Decrease
Decrease Increase Increase
Increase Increase Increase
Decrease Decrease DecreaseCurrent liabilities��
Total assets
Current assets��
Total assets

13–3 Why does an increase in the ratio of current to total assets decrease bothprofits and risk as measured by net working capital? How do changes inthe ratio of current liabilities to total assets affect profitability and risk?
The Cash Conversion Cycle
Central to short-term financial management is an understanding of the firm’scash conversion cycle.2 This cycle frames discussion of the management of thefirm’s current assets in this chapter and that of the management of current liabili-ties in Chapter 14. Here, we begin by demonstrating the calculation and applica-tion of the cash conversion cycle.
Calculating the Cash Conversion CycleA firm’s operating cycle (OC) is the time from the beginning of the productionprocess to collection of cash from the sale of the finished product. The operatingcycle encompasses two major short-term asset categories: inventory and accountsreceivable. It is measured in elapsed time by summing the average age of inven-tory (AAI) and the average collection period (ACP).
OC�AAI�ACP (13.1)
However, the process of producing and selling a product also includes thepurchase of production inputs (raw materials) on account, which results inaccounts payable. Accounts payable reduce the number of days a firm’s resourcesare tied up in the operating cycle. The time it takes to pay the accounts payable,measured in days, is the average payment period (APP). The operating cycle lessthe average payment period is referred to as the cash conversion cycle (CCC). Itrepresents the amount of time the firm’s resources are tied up. The formula forthe cash conversion cycle is
CCC�OC�APP (13.2)
Substituting the relationship in Equation 13.1 into Equation 13.2, we can seethat the cash conversion cycle has three main components, as shown in Equation13.3: (1) average age of the inventory, (2) average collection period, and (3) aver-age payment period.
CCC�AAI�ACP�APP (13.3)
Clearly, if a firm changes any of these time periods, it changes the amount ofresources tied up in the day-to-day operation of the firm.
496 PART 5 Short-Term Financial Decisions
cash conversion cycle (CCC)The amount of time a firm’sresources are tied up; calculatedby subtracting the averagepayment period from the operat-ing cycle.
2. The conceptual model that is used in this section to demonstrate basic short-term financial management strategieswas developed by Lawrence J. Gitman in “Estimating Corporate Liquidity Requirements: A Simplified Approach,”The Financial Review (1974), pp. 79–88, and refined and operationalized by Lawrence J. Gitman and Kanwal S.Sachdeva in “A Framework for Estimating and Analyzing the Required Working Capital Investment,” Review ofBusiness and Economic Research (Spring 1982), pp 35–44.
LG2
operating cycle (OC)The time from the beginning ofthe production process to thecollection of cash from the saleof the finished product.

CHAPTER 13 Working Capital and Current Assets Management 497
E X A M P L E MAX Company, a producer of paper dinnerware, has annual sales of $10 mil-lion, a cost of goods sold of 75% of sales, and purchases that are 65% of cost ofgoods sold. MAX has an average age of inventory (AAI) of 60 days, an averagecollection period (ACP) of 40 days, and an average payment period (APP) of 35days. Thus the cash conversion cycle for MAX is 65 days (60�40�35). Figure13.1 presents MAX Company’s cash conversion cycle as a time line.
The resources MAX has invested in this cash conversion cycle (assuming a360-day year) are
Inventory �($10,000,000�0.75)� (60/360) � $1,250,000� Accounts receivable � ( 10,000,000�40/360) � 1,111,111� Accounts payable � ( 10,000,000�0.75�0.65)� (35/360) �
���4�7�3�,�9�5�8�
� Resources invested � $��1��,��8��8��7��,��1��5��3��
Changes in any of the time periods will change the resources tied up in opera-tions. For example, if MAX could reduce the average collection period on itsaccounts receivable by 5 days, it would shorten the cash conversion time line andthus reduce the amount of resources MAX has invested in operations. For MAX,a 5-day reduction in the average collection period would reduce the resourcesinvested in the cash conversion cycle by $138,889 [$10,000,000� (5/360)].
Funding Requirements of the Cash Conversion CycleWe can use the cash conversion cycle as a basis for discussing how the firm fundsits required investment in operating assets. We first differentiate between perma-nent and seasonal funding needs and then describe aggressive and conservativeseasonal funding strategies.
FIGURE 13 .1
Time Line for MAX
Company’s Cash
Conversion Cycle
MAX Company’s operatingcycle is 100 days, and itscash conversion cycle is 65days
Time = 0 100 days
Purchase RawMaterials on Account
Average Age of Inventory (AAI)
60 days
Average Collection Period (ACP)
40 days
CollectAccountsReceivable
Sell FinishedGoods onAccount
PayAccountsPayable
AveragePaymentPeriod (APP)
35 days
Cash Conversion Cycle (CCC)
65 days
CashInflow
CashOutflow
Operating Cycle (OC)
Time
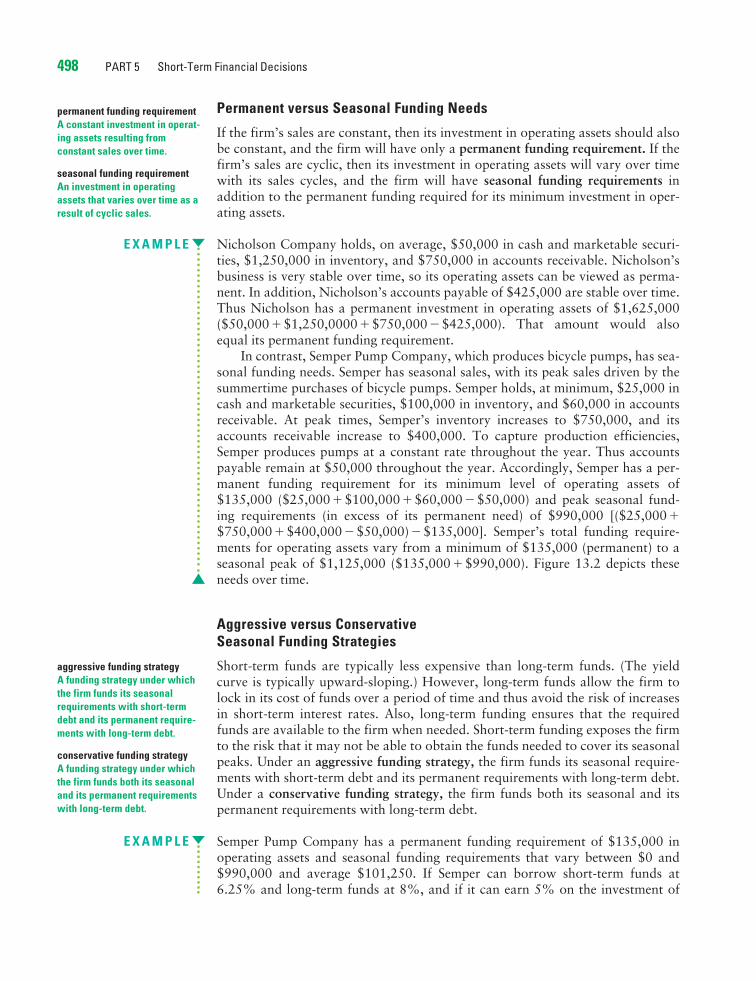
Permanent versus Seasonal Funding Needs
If the firm’s sales are constant, then its investment in operating assets should alsobe constant, and the firm will have only a permanent funding requirement. If thefirm’s sales are cyclic, then its investment in operating assets will vary over timewith its sales cycles, and the firm will have seasonal funding requirements inaddition to the permanent funding required for its minimum investment in oper-ating assets.
E X A M P L E Nicholson Company holds, on average, $50,000 in cash and marketable securi-ties, $1,250,000 in inventory, and $750,000 in accounts receivable. Nicholson’sbusiness is very stable over time, so its operating assets can be viewed as perma-nent. In addition, Nicholson’s accounts payable of $425,000 are stable over time.Thus Nicholson has a permanent investment in operating assets of $1,625,000($50,000�$1,250,0000�$750,000�$425,000). That amount would alsoequal its permanent funding requirement.
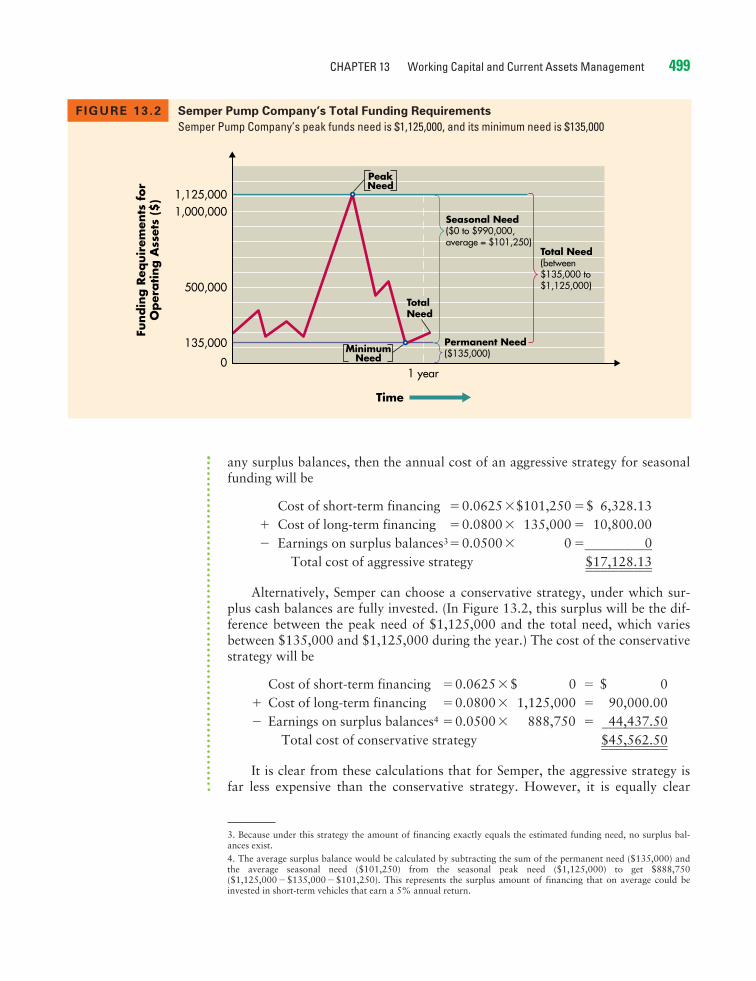
In contrast, Semper Pump Company, which produces bicycle pumps, has sea-sonal funding needs. Semper has seasonal sales, with its peak sales driven by thesummertime purchases of bicycle pumps. Semper holds, at minimum, $25,000 incash and marketable securities, $100,000 in inventory, and $60,000 in accountsreceivable. At peak times, Semper’s inventory increases to $750,000, and itsaccounts receivable increase to $400,000. To capture production efficiencies,Semper produces pumps at a constant rate throughout the year. Thus accountspayable remain at $50,000 throughout the year. Accordingly, Semper has a per-manent funding requirement for its minimum level of operating assets of$135,000 ($25,000�$100,000�$60,000�$50,000) and peak seasonal fund-ing requirements (in excess of its permanent need) of $990,000 [($25,000�$750,000�$400,000�$50,000)�$135,000]. Semper’s total funding require-ments for operating assets vary from a minimum of $135,000 (permanent) to aseasonal peak of $1,125,000 ($135,000�$990,000). Figure 13.2 depicts theseneeds over time.
Aggressive versus Conservative Seasonal Funding Strategies
Short-term funds are typically less expensive than long-term funds. (The yieldcurve is typically upward-sloping.) However, long-term funds allow the firm tolock in its cost of funds over a period of time and thus avoid the risk of increasesin short-term interest rates. Also, long-term funding ensures that the requiredfunds are available to the firm when needed. Short-term funding exposes the firmto the risk that it may not be able to obtain the funds needed to cover its seasonalpeaks. Under an aggressive funding strategy, the firm funds its seasonal require-ments with short-term debt and its permanent requirements with long-term debt.Under a conservative funding strategy, the firm funds both its seasonal and itspermanent requirements with long-term debt.
E X A M P L E Semper Pump Company has a permanent funding requirement of $135,000 inoperating assets and seasonal funding requirements that vary between $0 and$990,000 and average $101,250. If Semper can borrow short-term funds at6.25% and long-term funds at 8%, and if it can earn 5% on the investment of
conservative funding strategyA funding strategy under whichthe firm funds both its seasonaland its permanent requirementswith long-term debt.
498 PART 5 Short-Term Financial Decisions
aggressive funding strategyA funding strategy under whichthe firm funds its seasonalrequirements with short-termdebt and its permanent require-ments with long-term debt.
permanent funding requirementA constant investment in operat-ing assets resulting fromconstant sales over time.
seasonal funding requirementAn investment in operatingassets that varies over time as aresult of cyclic sales.
CHAPTER 13 Working Capital and Current Assets Management 499
any surplus balances, then the annual cost of an aggressive strategy for seasonalfunding will be
Cost of short-term financing �0.0625�$101,250 �$ 6,328.13� Cost of long-term financing �0.0800� 135,000 � 10,800.00� Earnings on surplus balances3�0.0500� 0 �
���������0�
Total cost of aggressive strategy $��1��7��,��1��2��8��.��1��3��
Alternatively, Semper can choose a conservative strategy, under which sur-plus cash balances are fully invested. (In Figure 13.2, this surplus will be the dif-ference between the peak need of $1,125,000 and the total need, which variesbetween $135,000 and $1,125,000 during the year.) The cost of the conservativestrategy will be
Cost of short-term financing �0.0625�$ 0 � $ 0� Cost of long-term financing �0.0800� 1,125,000 � 90,000.00� Earnings on surplus balances4 �0.0500� 888,750 �
�4�4�,�4�3�7�.�5�0�
Total cost of conservative strategy $��4��5��,��5��6��2��.��5��0��
It is clear from these calculations that for Semper, the aggressive strategy isfar less expensive than the conservative strategy. However, it is equally clear
FIGURE 13 .2 Semper Pump Company’s Total Funding Requirements
Semper Pump Company’s peak funds need is $1,125,000, and its minimum need is $135,000
1,000,0001,125,000
500,000
1 year
Total Need(between$135,000 to$1,125,000)
Seasonal Need($0 to $990,000,average = $101,250)
TotalNeed
Permanent Need($135,000)
135,000
Fundin
g R
equir
emen
ts f
or
Oper
ating A
sset
s ($
)
0Minimum
Need
PeakNeed
Time
3. Because under this strategy the amount of financing exactly equals the estimated funding need, no surplus bal-ances exist.4. The average surplus balance would be calculated by subtracting the sum of the permanent need ($135,000) andthe average seasonal need ($101,250) from the seasonal peak need ($1,125,000) to get $888,750($1,125,000�$135,000�$101,250). This represents the surplus amount of financing that on average could beinvested in short-term vehicles that earn a 5% annual return.
500 PART 5 Short-Term Financial Decisions
that Semper has substantial peak-season operating-asset needs and that it musthave adequate funding available to meet the peak needs and ensure ongoingoperations.
Clearly, the aggressive strategy’s heavy reliance on short-term financingmakes it riskier than the conservative strategy because of interest rate swings andpossible difficulties in obtaining needed short-term financing quickly when sea-sonal peaks occur. The conservative strategy avoids these risks through thelocked-in interest rate and long-term financing, but it is more costly because of thenegative spread between the earnings rate on surplus funds (5% in the example)and the cost of the long-term funds that create the surplus (8% in the example).Where the firm operates, between the extremes of the aggressive and conservativeseasonal funding strategies, depends on management’s disposition toward riskand the strength of its banking relationships.
Strategies for Managing the Cash Conversion CycleA positive cash conversion cycle, as we saw for MAX Company in the earlierexample, means the firm must use negotiated liabilities (such as bank loans) to sup-port its operating assets. Negotiated liabilities carry an explicit cost, so the firmbenefits by minimizing their use in supporting operating assets. Minimum negoti-ated liabilities can be realized through application of the following strategies:
1. Turn over inventory as quickly as possible without stockouts that result inlost sales.
2. Collect accounts receivable as quickly as possible without losing sales fromhigh-pressure collection techniques.
3. Manage mail, processing, and clearing time to reduce them when collectingfrom customers and to increase them when paying suppliers.
4. Pay accounts payable as slowly as possible without damaging the firm’scredit rating.
Techniques for implementing these four strategies are the focus of the remainderof this chapter and the following chapter.
Review Questions
13–4 What is the difference between the firm’s operating cycle and its cash con-version cycle?
13–5 Why is it helpful to divide the funding needs of a seasonal business into itspermanent and seasonal funding requirements when developing a fundingstrategy?
13–6 What are the benefits, costs, and risks of an aggressive funding strategyand of a conservative funding strategy? Under which strategy is the bor-rowing often in excess of the actual need?
13–7 Why is it important for a firm to minimize the length of its cash conver-sion cycle?
CHAPTER 13 Working Capital and Current Assets Management 501
Inventory Management
The first component of the cash conversion cycle is the average age of inventory.The objective for managing inventory, as noted above, is to turn over inventoryas quickly as possible without losing sales from stockouts. The financial managertends to act as an advisor or “watchdog” in matters concerning inventory; he orshe does not have direct control over inventory but does provide input to theinventory management process.
Differing Viewpoints About Inventory LevelDiffering viewpoints about appropriate inventory levels commonly exist among afirm’s finance, marketing, manufacturing, and purchasing managers. Each viewsinventory levels in light of his or her own objectives. The financial manager’sgeneral disposition toward inventory levels is to keep them low, to ensure thatthe firm’s money is not being unwisely invested in excess resources. The market-ing manager, on the other hand, would like to have large inventories of the firm’sfinished products. This would ensure that all orders could be filled quickly, elim-inating the need for backorders due to stockouts.
The manufacturing manager’s major responsibility is to implement the pro-duction plan so that it results in the desired amount of finished goods of acceptablequality at a low cost. In fulfilling this role, the manufacturing manager would keepraw materials inventories high to avoid production delays. He or she also wouldfavor large production runs for the sake of lower unit production costs, whichwould result in high finished goods inventories.
The purchasing manager is concerned solely with the raw materials invento-ries. He or she must have on hand, in the correct quantities at the desired timesand at a favorable price, whatever raw materials are required by production.Without proper control, in order to get quantity discounts or in anticipation ofrising prices or a shortage of certain materials, the purchasing manager may pur-chase larger quantities of resources than are actually needed at the time.
Common Techniques for Managing InventoryNumerous techniques are available for effectively managing the firm’s inventory.Here we briefly consider four commonly used techniques.
The ABC System
A firm using the ABC inventory system divides its inventory into three groups: A,B, and C. The A group includes those items with the largest dollar investment.Typically, this group consists of 20 percent of the firm’s inventory items but 80percent of its investment in inventory. The B group consists of items that accountfor the next largest investment in inventory. The C group consists of a large num-ber of items that require a relatively small investment.
The inventory group of each item determines the item’s level of monitoring.The A group items receive the most intense monitoring because of the high dollarinvestment. Typically, A group items are tracked on a perpetual inventory system
ABC inventory systemInventory management techniquethat divides inventory into threegroups—A, B, and C, in descend-ing order of importance and levelof monitoring, on the basis of thedollar investment in each.
LG3
that allows daily verification of each item’s inventory level. B group items are fre-quently controlled through periodic, perhaps weekly, checking of their levels. Cgroup items are monitored with unsophisticated techniques, such as the two-binmethod. With the two-bin method, the item is stored in two bins. As an item isneeded, inventory is removed from the first bin. When that bin is empty, an orderis placed to refill the first bin while inventory is drawn from the second bin. Thesecond bin is used until empty, and so on.
The large dollar investment in A and B group items suggests the need for a bet-ter method of inventory management than the ABC system. The EOQ model, dis-cussed next, is an appropriate model for the management of A and B group items.
The Economic Order Quantity (EOQ) Model
One of the most common techniques for determining the optimal order size forinventory items is the economic order quantity (EOQ) model. The EOQ modelconsiders various costs of inventory and then determines what order size mini-mizes total inventory cost. EOQ assumes that the relevant costs of inventory can bedivided into order costs and carrying costs. (The model excludes the actual cost ofthe inventory item.) Each of them has certain key components and characteristics.
Order costs include the fixed clerical costs of placing and receiving orders: thecost of writing a purchase order, of processing the resulting paperwork, and ofreceiving an order and checking it against the invoice. Order costs are stated indollars per order.
Carrying costs are the variable costs per unit of holding an item of inventoryfor a specific period of time. Carrying costs include storage costs, insurance costs,the costs of deterioration and obsolescence, and the opportunity or financial costof having funds invested in inventory. These costs are stated in dollars per unit perperiod.
Order costs decrease as the size of the order increases. Carrying costs, how-ever, increase with increases in the order size. The EOQ model analyzes the trade-off between order costs and carrying costs to determine the order quantity thatminimizes the total inventory cost.
Mathematical Development of EOQ A formula can be developed for deter-mining the firm’s EOQ for a given inventory item, where
S�usage in units per periodO�order cost per orderC�carrying cost per unit per periodQ�order quantity in units
The first step is to derive the cost functions for order cost and carrying cost. Theorder cost can be expressed as the product of the cost per order and the numberof orders. Because the number of orders equals the usage during the perioddivided by the order quantity (S/Q), the order cost can be expressed as follows:
Order cost�O�S/Q (13.4)
The carrying cost is defined as the cost of carrying a unit of inventory per periodmultiplied by the firm’s average inventory. The average inventory is the order
502 PART 5 Short-Term Financial Decisions
economic order quantity (EOQ) modelInventory management techniquefor determining an item’s optimalorder size, which is the size thatminimizes the total of its ordercosts and carrying costs.
order costsThe fixed clerical costs ofplacing and receiving aninventory order.
carrying costsThe variable costs per unit ofholding an item in inventory for aspecific period of time.
two-bin methodUnsophisticated inventory-monitoring technique that istypically applied to C group itemsand involves reorderinginventory when one of two binsis empty.
CHAPTER 13 Working Capital and Current Assets Management 503
quantity divided by 2 (Q/2), because inventory is assumed to be depleted at aconstant rate. Thus carrying cost can be expressed as follows:
Carrying cost�C�Q/2 (13.5)
The firm’s total cost of inventory is found by summing the order cost and thecarrying cost. Thus the total cost function is
Total cost� (O�S/Q)� (C�Q/2) (13.6)
Because the EOQ is defined as the order quantity that minimizes the total costfunction, we must solve the total cost function for the EOQ. The resulting equa-tion is
EOQ��� (13.7)
Although the EOQ model has weaknesses, it is certainly better than subjec-tive decision making. Despite the fact that the use of the EOQ model is outsidethe control of the financial manager, the financial manager must be aware of itsutility and must provide certain inputs, specifically with respect to inventory car-rying costs.
Reorder Point Once the firm has determined its economic order quantity, itmust determine when to place an order. The reorder point reflects the firm’s dailyusage of the inventory item and the number of days needed to place and receivean order. Assuming that inventory is used at a constant rate, the formula for thereorder point is
Reorder point�Days of lead time�Daily usage (13.8)
For example, if a firm knows it takes 3 days to place and receive an order, and ifit uses 15 units per day of the inventory item, then the reorder point is 45 units ofinventory (3 days�15 units/day). Thus, as soon as the item’s inventory level fallsto the reorder point (45 units, in this case) an order will be placed at the item’sEOQ. If the estimates of lead time and usage are correct, then the order willarrive exactly as the inventory level reaches zero. However, lead times and usagerates are not precise, so most firms hold safety stock (extra inventory) to preventstockouts of important items.
E X A M P L E MAX Company has an A group inventory item that is vital to the productionprocess. This item costs $1,500, and MAX uses 1,100 units of the item per year.MAX wants to determine its optimal order strategy for the item. To calculate theEOQ, we need the following inputs:
Order cost per order�$150Carrying cost per unit per year�$200
Substituting into Equation 13.7, we get
EOQ�����4��1��
units2�1,100�$150��
$200
2�S�O��
C
reorder pointThe point at which to reorderinventory, expressed as days oflead time � daily usage.
safety stockExtra inventory that is held toprevent stockouts of importantitems.
total cost of inventoryThe sum of order costs andcarrying costs of inventory.
504 PART 5 Short-Term Financial Decisions
The reorder point for MAX depends on the number of days MAX operatesper year. Assuming that MAX operates 250 days per year and uses 1,100 units ofthis item, its daily usage is 4.4 units (1,100�250). If its lead time is 2 days andMAX wants to maintain a safety stock of 4 units, the reorder point for this itemis 12.8 units [(2�4.4)�4]. However, orders are made only in whole units, so theorder is placed when the inventory falls to 13 units.
The firm’s goal for inventory is to turn it over as quickly as possible withoutstockouts. Inventory turnover is best calculated by dividing cost of goods sold byaverage inventory. The EOQ model determines the optimal order size and, indi-rectly, through the assumption of constant usage, the average inventory. Thus theEOQ model determines the firm’s optimal inventory turnover rate, given thefirm’s specific costs of inventory.
Just-in-Time (JIT) System
The just-in-time (JIT) system is used to minimize inventory investment. The phi-losophy is that materials should arrive at exactly the time they are needed for pro-duction. Ideally, the firm would have only work-in-process inventory. Because itsobjective is to minimize inventory investment, a JIT system uses no (or very little)safety stock. Extensive coordination among the firm’s employees, its suppliers,and shipping companies must exist to ensure that material inputs arrive on time.Failure of materials to arrive on time results in a shutdown of the production lineuntil the materials arrive. Likewise, a JIT system requires high-quality parts fromsuppliers. When quality problems arise, production must be stopped until theproblems are resolved.
The goal of the JIT system is manufacturing efficiency. It uses inventory as atool for attaining efficiency by emphasizing quality of the materials used andtheir timely delivery. When JIT is working properly, it forces process inefficien-cies to surface.
Materials Requirement Planning (MRP) System
Many companies use a materials requirement planning (MRP) system to deter-mine what materials to order and when to order them. MRP applies EOQ con-cepts to determine how much to order. By means of a computer, it simulates eachproduct’s bill of materials, inventory status, and manufacturing process. The billof materials is simply a list of all the parts and materials that go into making thefinished product. For a given production plan, the computer simulates materialsrequirements by comparing production needs to available inventory balances. Onthe basis of the time it takes for a product that is in process to move through thevarious production stages and the lead time required to get materials, the MRPsystem determines when orders should be placed for the various items on the billof materials.
The advantage of the MRP system is that it forces the firm to consider itsinventory needs more carefully. The objective is to lower the firm’s inventoryinvestment without impairing production. If the firm’s opportunity cost of capital
just-in-time (JIT) systemInventory management techniquethat minimizes inventory invest-ment by having materials arriveat exactly the time they areneeded for production.
materials requirement planning (MRP) systemInventory management techniquethat applies EOQ concepts and acomputer to compare productionneeds to available inventorybalances and determine whenorders should be placed forvarious items on a product’s billof materials.
CHAPTER 13 Working Capital and Current Assets Management 505
for investments of equal risk is 15 percent, every dollar of investment releasedfrom inventory increases before-tax profits by $0.15.
International Inventory ManagementInternational inventory management is typically much more complicated forexporters in general, and for multinational companies in particular, than forpurely domestic firms. The production and manufacturing economies of scalethat might be expected from selling products globally may prove elusive if prod-ucts must be tailored for individual local markets, as very frequently happens, orif actual production takes place in factories around the world. When raw materi-als, intermediate goods, or finished products must be transported long dis-tances—particularly by ocean shipping—there will inevitably be more delays,confusion, damage, theft, and other difficulties than occur in a one-country oper-ation. The international inventory manager therefore puts a premium on flexibil-ity. He or she is usually less concerned about ordering the economically optimalquantity of inventory than about making sure that sufficient quantities of inven-tory are delivered where they are needed, when they are needed, and in a condi-tion to be used as planned.
Review Questions
13–8 What are likely to be the viewpoints of each of the following managersabout the levels of the various types of inventory: finance, marketing,manufacturing, and purchasing? Why is inventory an investment?
13–9 Briefly describe each of the following techniques for managing inventory:ABC system, economic order quantity (EOQ) model, just-in-time (JIT)system, and materials requirement planning (MRP) system.
13–10 What factors make managing inventory more difficult for exporters andmultinational companies?
Accounts Receivable Management
The second component of the cash conversion cycle is the average collectionperiod. This period is the average length of time from a sale on credit until thepayment becomes usable funds for the firm. The average collection period hastwo parts. The first part is the time from the sale until the customer mails the pay-ment. The second part is the time from when the payment is mailed until the firmhas the collected funds in its bank account. The first part of the average collectionperiod involves managing the credit available to the firm’s customers, and thesecond part involves collecting and processing payments. This section of thechapter discusses the firm’s accounts receivable credit management.
The objective for managing accounts receivable is to collect accounts receiv-able as quickly as possible without losing sales from high-pressure collection
LG4
506 PART 5 Short-Term Financial Decisions
techniques. Accomplishing this goal encompasses three topics: (1) credit selectionand standards, (2) credit terms, and (3) credit monitoring.
Credit Selection and StandardsCredit selection involves application of techniques for determining which cus-tomers should receive credit. This process involves evaluating the customer’screditworthiness and comparing it to the firm’s credit standards, its minimumrequirements for extending credit to a customer.
Five C’s of Credit
One popular credit selection technique is the five C’s of credit, which provides aframework for in-depth credit analysis. Because of the time and expenseinvolved, this credit selection method is used for large-dollar credit requests. Thefive C’s are
1. Character: The applicant’s record of meeting past obligations.2. Capacity: The applicant’s ability to repay the requested credit, as judged in
terms of financial statement analysis focused on cash flows available to repaydebt obligations.
3. Capital: The applicant’s debt relative to equity.4. Collateral: The amount of assets the applicant has available for use in secur-
ing the credit. The larger the amount of available assets, the greater thechance that a firm will recover funds if the applicant defaults.
5. Conditions: Current general and industry-specific economic conditions, andany unique conditions surrounding a specific transaction.
Analysis via the five C’s of credit does not yield a specific accept/reject deci-sion, so its use requires an analyst experienced in reviewing and granting creditrequests. Application of this framework tends to ensure that the firm’s credit cus-tomers will pay, without being pressured, within the stated credit terms.
Credit Scoring
Credit scoring is a method of credit selection that is commonly used with high-volume/small-dollar credit requests. Credit scoring applies statistically derivedweights for key financial and credit characteristics to predict whether a creditapplicant will pay the requested credit in a timely fashion. Simply stated, the pro-cedure results in a score that measures the applicant’s overall credit strength, andthe score is used to make the accept/reject decision for granting the applicantcredit. Credit scoring is most commonly used by large credit card operations,such as those of banks, oil companies, and department stores. The purpose ofcredit scoring is to make a relatively informed credit decision quickly and inex-pensively, recognizing that the cost of a single bad scoring decision is small. How-ever, if bad debts from scoring decisions increase, then the scoring system must bere-evaluated. For a demonstration of credit scoring, including use of a spread-sheet for that purpose, see the book’s Web site at www.aw.com/gitman.
credit standardsThe firm’s minimum requirementsfor extending credit to acustomer.
five C’s of creditThe five key dimensions—character, capacity, capital,collateral, and conditions—usedby credit analysts to provide aframework for in-depth creditanalysis.
credit scoringA credit selection methodcommonly used with high-volume/small-dollar creditrequests; relies on a credit scoredetermined by applying statisti-cally derived weights to a creditapplicant’s scores on keyfinancial and creditcharacteristics.
WWW
CHAPTER 13 Working Capital and Current Assets Management 507
Changing Credit Standards
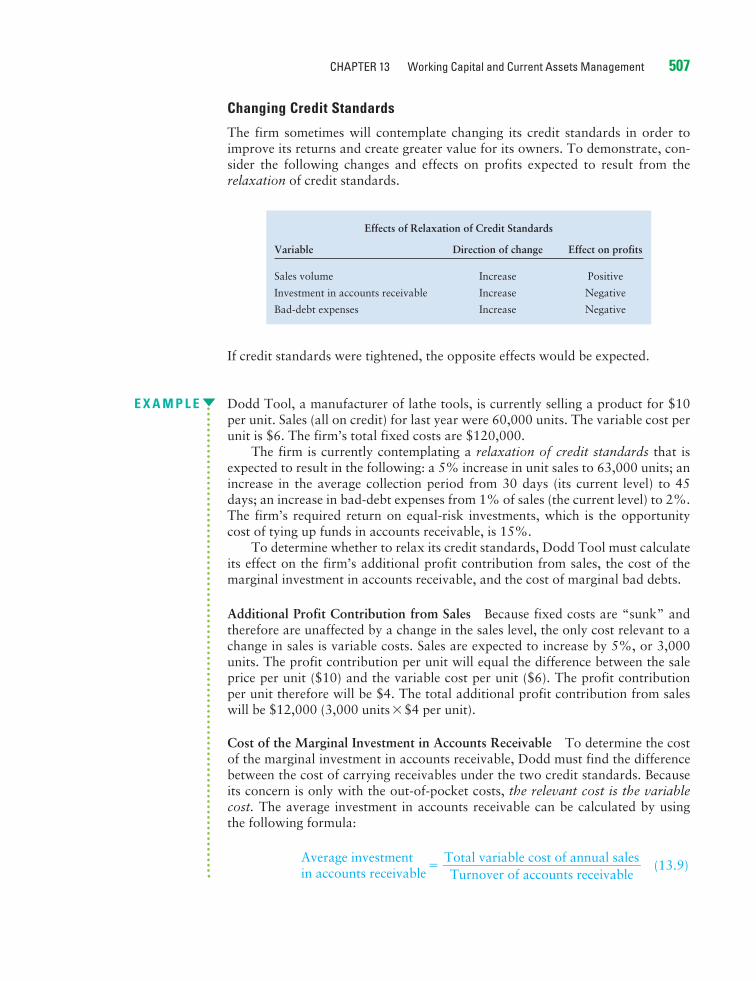
The firm sometimes will contemplate changing its credit standards in order toimprove its returns and create greater value for its owners. To demonstrate, con-sider the following changes and effects on profits expected to result from therelaxation of credit standards.
If credit standards were tightened, the opposite effects would be expected.
E X A M P L E Dodd Tool, a manufacturer of lathe tools, is currently selling a product for $10per unit. Sales (all on credit) for last year were 60,000 units. The variable cost perunit is $6. The firm’s total fixed costs are $120,000.
The firm is currently contemplating a relaxation of credit standards that isexpected to result in the following: a 5% increase in unit sales to 63,000 units; anincrease in the average collection period from 30 days (its current level) to 45days; an increase in bad-debt expenses from 1% of sales (the current level) to 2%.The firm’s required return on equal-risk investments, which is the opportunitycost of tying up funds in accounts receivable, is 15%.
To determine whether to relax its credit standards, Dodd Tool must calculateits effect on the firm’s additional profit contribution from sales, the cost of themarginal investment in accounts receivable, and the cost of marginal bad debts.
Additional Profit Contribution from Sales Because fixed costs are “sunk” andtherefore are unaffected by a change in the sales level, the only cost relevant to achange in sales is variable costs. Sales are expected to increase by 5%, or 3,000units. The profit contribution per unit will equal the difference between the saleprice per unit ($10) and the variable cost per unit ($6). The profit contributionper unit therefore will be $4. The total additional profit contribution from saleswill be $12,000 (3,000 units�$4 per unit).
Cost of the Marginal Investment in Accounts Receivable To determine the costof the marginal investment in accounts receivable, Dodd must find the differencebetween the cost of carrying receivables under the two credit standards. Becauseits concern is only with the out-of-pocket costs, the relevant cost is the variablecost. The average investment in accounts receivable can be calculated by usingthe following formula:
Average investmentin accounts receivable
� (13.9)Total variable cost of annual sales����Turnover of accounts receivable
Effects of Relaxation of Credit Standards
Variable Direction of change Effect on profits
Sales volume Increase Positive
Investment in accounts receivable Increase Negative
Bad-debt expenses Increase Negative
508 PART 5 Short-Term Financial Decisions
where
Turnover of accounts receivable�
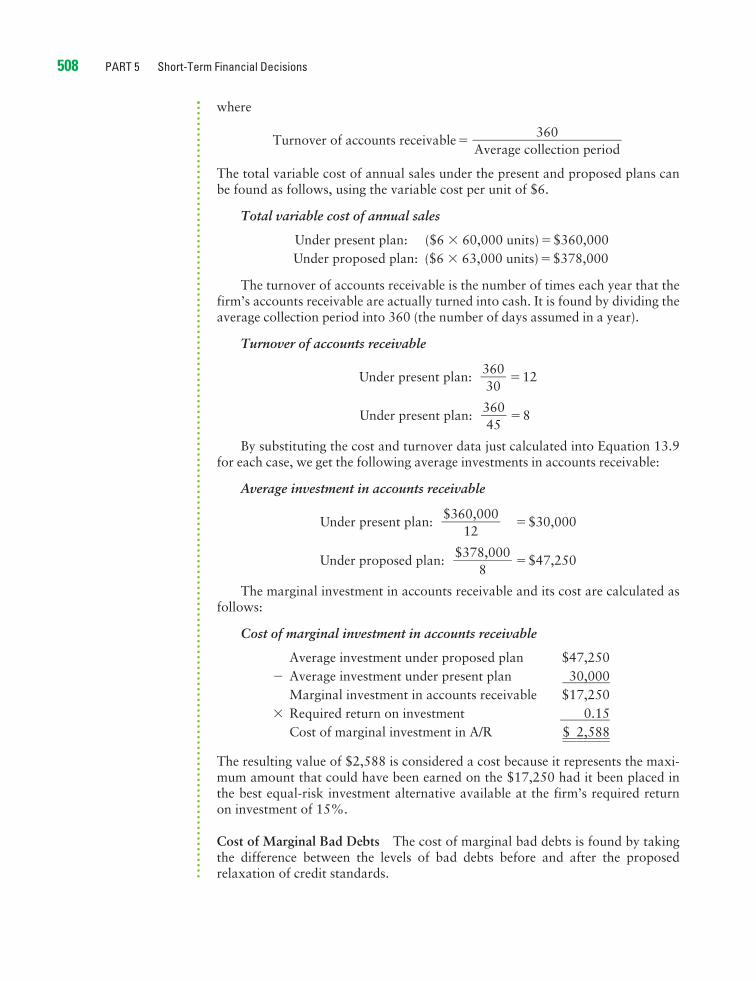
The total variable cost of annual sales under the present and proposed plans canbe found as follows, using the variable cost per unit of $6.
Total variable cost of annual sales
Under present plan: ($6 � 60,000 units)�$360,000Under proposed plan: ($6 � 63,000 units)�$378,000
The turnover of accounts receivable is the number of times each year that thefirm’s accounts receivable are actually turned into cash. It is found by dividing theaverage collection period into 360 (the number of days assumed in a year).
Turnover of accounts receivable
Under present plan: �12
Under present plan: �8
By substituting the cost and turnover data just calculated into Equation 13.9for each case, we get the following average investments in accounts receivable:
Average investment in accounts receivable
Under present plan: �$30,000
Under proposed plan: �$47,250
The marginal investment in accounts receivable and its cost are calculated asfollows:
Cost of marginal investment in accounts receivable
Average investment under proposed plan $47,250� Average investment under present plan
�3�0�,�0�0�0�
Marginal investment in accounts receivable $17,250� Required return on investment
����0�.�1�5�
Cost of marginal investment in A/R $����
2��,��5��8��8��
The resulting value of $2,588 is considered a cost because it represents the maxi-mum amount that could have been earned on the $17,250 had it been placed inthe best equal-risk investment alternative available at the firm’s required returnon investment of 15%.
Cost of Marginal Bad Debts The cost of marginal bad debts is found by takingthe difference between the levels of bad debts before and after the proposedrelaxation of credit standards.
$378,000��
8
$360,000��
12
360�45
360�30
360���Average collection period
CHAPTER 13 Working Capital and Current Assets Management 509
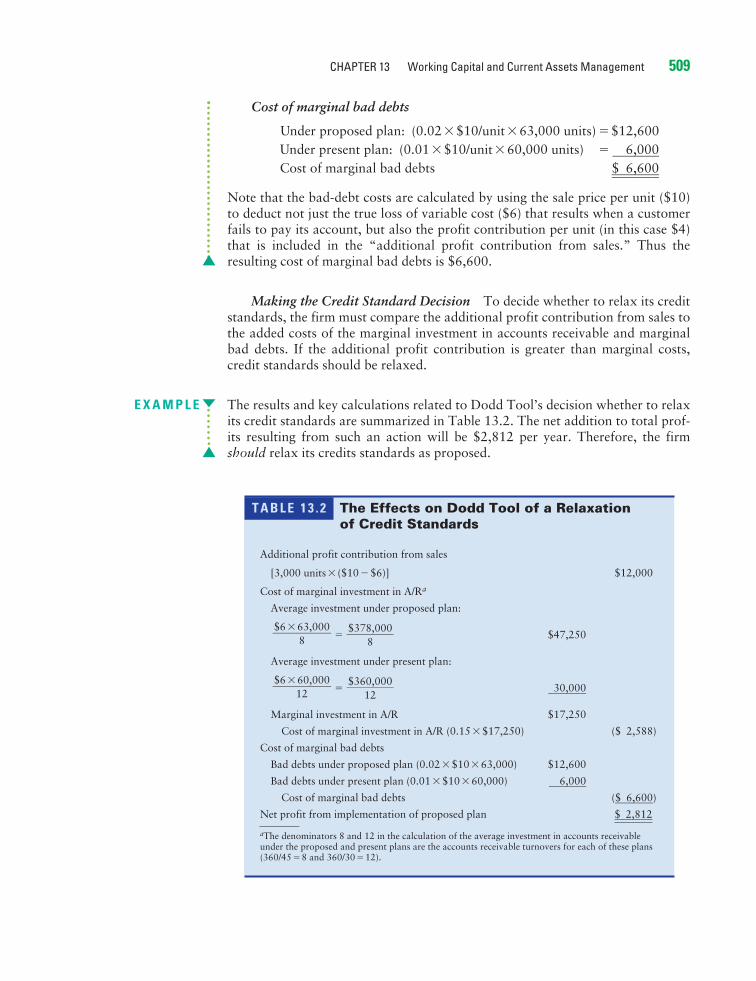
Cost of marginal bad debts
Under proposed plan: (0.02�$10/unit�63,000 units) �$12,600Under present plan: (0.01�$10/unit�60,000 units) �
��6�,�0�0�0�
Cost of marginal bad debts $����
6��,��6��0��0��
Note that the bad-debt costs are calculated by using the sale price per unit ($10)to deduct not just the true loss of variable cost ($6) that results when a customerfails to pay its account, but also the profit contribution per unit (in this case $4)that is included in the “additional profit contribution from sales.” Thus theresulting cost of marginal bad debts is $6,600.
Making the Credit Standard Decision To decide whether to relax its creditstandards, the firm must compare the additional profit contribution from sales tothe added costs of the marginal investment in accounts receivable and marginalbad debts. If the additional profit contribution is greater than marginal costs,credit standards should be relaxed.
E X A M P L E The results and key calculations related to Dodd Tool’s decision whether to relaxits credit standards are summarized in Table 13.2. The net addition to total prof-its resulting from such an action will be $2,812 per year. Therefore, the firmshould relax its credits standards as proposed.
T A B L E 1 3 . 2 The Effects on Dodd Tool of a Relaxation of Credit Standards
Additional profit contribution from sales
[3,000 units� ($10�$6)] $12,000
Cost of marginal investment in A/Ra
Average investment under proposed plan:
� $47,250
Average investment under present plan:
��3�0�,�0�0�0�
Marginal investment in A/R $17,250
Cost of marginal investment in A/R (0.15�$17,250) ($ 2,588)
Cost of marginal bad debts
Bad debts under proposed plan (0.02�$10�63,000) $12,600
Bad debts under present plan (0.01�$10�60,000)��
6�,�0�0�0�
Cost of marginal bad debts ($��
6�,�6�0�0�)
Net profit from implementation of proposed plan $����
2��,��8��1��2��
aThe denominators 8 and 12 in the calculation of the average investment in accounts receivableunder the proposed and present plans are the accounts receivable turnovers for each of these plans(360/45�8 and 360/30�12).
$360,000��
12$6�60,000��
12
$378,000��
8$6�63,000��
8
510 PART 5 Short-Term Financial Decisions
The procedure described here for evaluating a proposed change in creditstandards is also commonly used to evaluate other changes in the management ofaccounts receivable. If Dodd Tool had been contemplating tightening its creditstandards, for example, the cost would have been a reduction in the profit contri-bution from sales, and the return would have been from reductions in the cost ofthe investment in accounts receivable and in the cost of bad debts. Another appli-cation of this procedure is demonstrated later in the chapter.
Managing International Credit
Credit management is difficult enough for managers of purely domestic compa-nies, and these tasks become much more complex for companies that operateinternationally. This is partly because (as we have seen before) internationaloperations typically expose a firm to exchange rate risk. It is also due to the dan-gers and delays involved in shipping goods long distances and in having to crossat least two international borders.
Exports of finished goods are usually priced in the currency of the importer’slocal market; most commodities, on the other hand, are priced in dollars. There-fore, a U.S. company that sells a product in Japan, for example, would have toprice that product in Japanese yen and extend credit to a Japanese wholesaler inthe local currency (yen). If the yen depreciates against the dollar before the U.S.exporter collects on its account receivable, the U.S. company experiences anexchange rate loss; the yen collected are worth fewer dollars than expected at thetime the sale was made. Of course, the dollar could just as easily depreciateagainst the yen, yielding an exchange rate gain to the U.S. exporter. Most compa-nies fear the loss more than they welcome the gain.
For a major currency such as the Japanese yen, the exporter can hedgeagainst this risk by using the currency futures, forward, or options markets, but itis costly to do so, particularly for relatively small amounts. If the exporter is sell-ing to a customer in a developing country—where 40 percent of U.S. exports arenow sold—there will probably be no effective instrument available for protectingagainst exchange rate risk at any price. This risk may be further magnifiedbecause credit standards may be much lower (and acceptable collection tech-niques much different) in developing countries than in the United States.Although it may seem tempting just “not to bother” with exporting, U.S. compa-nies no longer can concede foreign markets to international rivals. These exportsales, if carefully monitored and (where possible) effectively hedged againstexchange rate risk, often prove to be very profitable.
Credit TermsCredit terms are the terms of sale for customers who have been extended creditby the firm. Terms of net 30 mean the customer has 30 days from the beginningof the credit period (typically end of month or date of invoice) to pay the fullinvoice amount. Some firms offer cash discounts, percentage deductions from thepurchase price for paying within a specified time. For example, terms of 2/10 net
credit termsThe terms of sale for customerswho have been extended creditby the firm.
cash discountA percentage deduction from thepurchase price; available to thecredit customer who pays itsaccount within a specified time.

CHAPTER 13 Working Capital and Current Assets Management 511
30 mean the customer can take a 2 percent discount from the invoice amount ifthe payment is made within 10 days of the beginning of the credit period or canpay the full amount of the invoice within 30 days.
A firm’s regular credit terms are strongly influenced by the firm’s business.For example, a firm selling perishable items will have very short credit terms,because its items have little long-term collateral value; a firm in a seasonal busi-ness may tailor its terms to fit the industry cycles. A firm wants its regular creditterms to conform to its industry’s standards. If its terms are more restrictive thanits competitors’, it will lose business; if its terms are less restrictive than its com-petitors’, it will attract poor-quality customers that probably could not payunder the standard industry terms. The bottom line is that a firm should com-pete on the basis of quality and price of its product and service offerings, not itscredit terms. Accordingly, the firm’s regular credit terms should match theindustry standards, but individual customer terms should reflect the riskiness ofthe customer.
Cash Discount
Including a cash discount in the credit terms is a popular way to achieve the goalof speeding up collections without putting pressure on customers. The cash dis-count provides an incentive for customers to pay sooner. By speeding collections,the discount decreases the firm’s investment in accounts receivable (which is theobjective), but it also decreases the per-unit profit. Additionally, initiating a cashdiscount should reduce bad debts because customers will pay sooner, and itshould increase sales volume because customers who take the discount pay alower price for the product. Accordingly, firms that consider offering a cash dis-count must perform a benefit–cost analysis to determine whether extending acash discount is profitable.
E X A M P L E MAX Company has an average collection period of 40 days (turnover�360/40�9). In accordance with the firm’s credit terms of net 30, this period isdivided into 32 days until the customers place their payments in the mail (noteveryone pays within 30 days) and 8 days to receive, process, and collect pay-ments once they are mailed. MAX is considering initiating a cash discount bychanging its credit terms from net 30 to 2/10 net 30. The firm expects this changeto reduce the amount of time until the payments are placed in the mail, resultingin an average collection period of 25 days (turnover�360/25�14.4).
As noted earlier in the EOQ example (page 503), MAX has a raw materialwith current annual usage of 1,100 units. Each finished product produced requires1 unit of this raw material at a variable cost of $1,500 per unit, incurs another$800 of variable cost in the production process, and sells for $3,000 on terms ofnet 30. MAX estimates that 80% of its customers will take the 2% discount andthat offering the discount will increase sales of the finished product by 50 units(from 1,100 to 1,150 units) per year but will not alter its bad-debt percentage.MAX’s opportunity cost of funds invested in accounts receivable is 14%. ShouldMAX offer the proposed cash discount? An analysis similar to that demonstratedearlier for the credit standard decision, presented in Table 13.3, shows a net loss

512 PART 5 Short-Term Financial Decisions
from the cash discount of $6,560. Thus MAX should not initiate the proposedcash discount. However, other discounts may be advantageous.
Cash Discount Period
The cash discount period, the number of days after the beginning of the creditperiod during which the cash discount is available, can be changed by the finan-cial manager. The net effect of changes in this period is difficult to analyzebecause of the nature of the forces involved. For example, if a firm were toincrease its cash discount period by 10 days (for example, changing its creditterms from 2/10 net 30 to 2/20 net 30), the following changes would be expectedto occur: (1) Sales would increase, positively affecting profit. (2) Bad-debtexpenses would decrease, positively affecting profit. (3) The profit per unit woulddecrease as a result of more people taking the discount, negatively affectingprofit. The difficulty for the financial manager lies in assessing what impact anincrease in the cash discount period would have on the firm’s investment inaccounts receivable. This investment will decrease because of non–discount tak-ers now paying earlier. However, the investment in accounts receivable willincrease for two reasons: (1) Discount takers will still get the discount but willpay later, and (2) new customers attracted by the new policy will result in newaccounts receivable. If the firm were to decrease the cash discount period, theeffects would be the opposite of those just described.
T A B L E 1 3 . 3 Analysis of Initiating a Cash Discount for MAX Company
Additional profit contribution from sales
[50 units� ($3,000�$2,300)] $35,000
Cost of marginal investment in A/Ra
Average investment presently (w/o discount):
� $281,111
Average investment with proposed cash discount:b
��1�8�3�,�6�8�1�
Reduction in accounts receivable investment $ 97,430
Cost savings from reduced investments inaccounts receivable (0.14�$97,430)c $13,640
Cost of cash discount (0.02�0.80�1,150�$3,000) ($�5�5�,�2�0�0�)
Net profit from initiation of proposed cash discount ($����
6��,��5��6��0��)
aIn analyzing the investment in accounts receivable, we use the variable cost of the product sold($1,500 raw materials cost�$800 production cost�$2,300 unit variable cost) instead of thesale price, because the variable cost is a better indicator of the firm’s investment.bThe average investment in accounts receivable with the proposed cash discount is estimated tobe tied up for an average of 25 days instead of the 40 days under the original terms.cMAX’s opportunity cost of funds is 14%.
$2,645,000��
14.4$2,300�1,150 units���
14.4
$2,530,000��
9$2,300�1,100 units���
9
cash discount periodThe number of days after thebeginning of the credit periodduring which the cash discountis available.

CHAPTER 13 Working Capital and Current Assets Management 513
credit monitoringThe ongoing review of a firm’saccounts receivable todetermine whether customersare paying according to thestated credit terms.
Credit Period
Changes in the credit period, the number of days after the beginning of the creditperiod until full payment of the account is due, also affect a firm’s profitability.For example, increasing a firm’s credit period from net 30 days to net 45 daysshould increase sales, positively affecting profit. But both the investment inaccounts receivable and bad-debt expenses would also increase, negatively affect-ing profit. The increased investment in accounts receivable would result fromboth more sales and generally slower pay, on average, as a result of the longercredit period. The increase in bad-debt expenses results from the fact that thelonger the credit period, the more time available for a firm to fail, making itunable to pay its accounts payable. A decrease in the length of the credit period islikely to have the opposite effects. Note that the variables affected by an increasein the credit period behave in the same way they would have if the credit stan-dards had been relaxed, as demonstrated earlier in Table 13.2.
Credit MonitoringThe final issue a firm should consider in its accounts receivable management iscredit monitoring. Credit monitoring is an ongoing review of the firm’s accountsreceivable to determine whether customers are paying according to the statedcredit terms. If they are not paying in a timely manner, credit monitoring willalert the firm to the problem. Slow payments are costly to a firm because theylengthen the average collection period and thus increase the firm’s investment inaccounts receivable. Two frequently cited techniques for credit monitoring areaverage collection period and aging of accounts receivable. In addition, a numberof popular collection techniques are used by firms.
Average Collection Period
The average collection period is the second component of the cash conversioncycle. As noted in Chapter 2, it is the average number of days that credit sales areoutstanding. The average collection period has two components: (1) the timefrom sale until the customer places the payment in the mail and (2) the time toreceive, process, and collect the payment once it has been mailed by the customer.The formula for finding the average collection period is
Average collection period� (13.10)
Assuming receipt, processing, and collection time is constant, the average collec-tion period tells the firm, on average, when its customers pay their accounts.
Knowing its average collection period enables the firm to determine whetherthere is a general problem with accounts receivable. For example, a firm that hascredit terms of net 30 would expect its average collection period (minus receipt,processing, and collection time) to equal about 30 days. If the actual collectionperiod is significantly greater than 30 days, the firm has reason to review itscredit operations. If the firm’s average collection period is increasing over time, ithas cause for concern about its accounts receivable management. A first step inanalyzing an accounts receivable problem is to “age” the accounts receivable. By
Accounts receivable���Average sales per day
credit periodThe number of days after thebeginning of the credit perioduntil full payment of the accountis due.

514 PART 5 Short-Term Financial Decisions
this process the firm can determine whether the problem exists in its accountsreceivable in general or is attributable to a few specific accounts.
Aging of Accounts Receivable
The aging of accounts receivable requires the firm’s accounts receivable to bebroken down into groups on the basis of the time of origin. The breakdown istypically made on a month-by-month basis, going back 3 or 4 months. The resultis a schedule that indicates the percentages of the total accounts receivable bal-ance that have been outstanding for specified periods of time. Its purpose is toenable the firm to pinpoint problems.
If a firm with terms of net 30 has an average collection period (minus receipt,processing, and collection time) of 50 days, the firm will want to age its accountsreceivable. If the majority of accounts are 2 months old, then the firm has a gen-eral problem and should review its accounts receivable operations. If the agingshows that most accounts are collected in about 35 days and a few accounts areway past due, then the firm should analyze and pursue collection of those specificpast-due accounts.
Popular Collection Techniques
A number of collection techniques, ranging from letters to legal action, areemployed. As an account becomes more and more overdue, the collection effortbecomes more personal and more intense. In Table 13.4 the popular collection
T A B L E 1 3 . 4 Popular Collection Techniques
Techniquea Brief description
Letters After a certain number of days, the firm sends a polite letter remind-ing the customer of the overdue account. If the account is not paidwithin a certain period after this letter has been sent, a second, moredemanding letter is sent.
Telephone calls If letters prove unsuccessful, a telephone call may be made to the customer to request immediate payment. If the customer has a rea-sonable excuse, arrangements may be made to extend the paymentperiod. A call from the seller’s attorney may be used.
Personal visits This technique is much more common at the consumer credit level, but it may also be effectively employed by industrial suppliers. Send-ing a local salesperson or a collection person to confront the cus-tomer can be very effective. Payment may be made on the spot.
Collection agencies A firm can turn uncollectible accounts over to a collection agency or an attorney for collection. The fees for this service are typically quitehigh; the firm may receive less than 50 cents on the dollar fromaccounts collected in this way.
Legal action Legal action is the most stringent step, an alternative to the use of acollection agency. Not only is direct legal action expensive, but itmay force the debtor into bankruptcy without guaranteeing the ulti-mate receipt of the overdue amount.
aThe techniques are listed in the order in which they are typically followed in the collection process.
aging of accounts receivableA credit-monitoring techniquethat uses a schedule thatindicates the percentages of thetotal accounts receivablebalance that have been outstand-ing for specified periods of time.
CHAPTER 13 Working Capital and Current Assets Management 515
techniques are listed, and briefly described, in the order typically followed in thecollection process.
Review Questions
13–11 What is the role of the five C’s of credit in the credit selection activity?13–12 Explain why credit scoring is typically applied to consumer credit deci-
sions rather than to mercantile credit decisions.13–13 What are the basic tradeoffs in a tightening of credit standards?13–14 Why are the risks involved in international credit management more
complex than those associated with purely domestic credit sales?13–15 Why do a firm’s regular credit terms typically conform to those of its
industry? 13–16 Why should a firm actively monitor the accounts receivable of its credit
customers? How do the techniques of average collection period andaging of accounts receivable work?
Management of Receipts and Disbursements
As discussed in the previous section, the average collection period (the secondcomponent of the cash conversion cycle) has two parts: (1) the time from saleuntil the customer mails the payment and (2) the receipt, processing, and collec-tion time. The third component of the cash conversion cycle, the average pay-ment period, also has two parts: (1) the time from purchase of goods on accountuntil the firm mails its payment and (2) the receipt, processing, and collectiontime required by the firm’s suppliers. The receipt, processing, and collection timefor the firm, both from its customers and to its suppliers, is the focus of receiptsand disbursements management.
FloatFloat refers to funds that have been sent by the payer but are not yet usable fundsto the payee. Float is important in the cash conversion cycle because its presencelengthens both the firm’s average collection period and its average paymentperiod. However, the goal of the firm should be to shorten its average collectionperiod and lengthen its average payment period. Both can be accomplished bymanaging float.
Float has three component parts:
1. Mail float is the time delay between when payment is placed in the mail andwhen it is received.
2. Processing float is the time between receipt of the payment and its depositinto the firm’s account.
3. Clearing float is the time between deposit of the payment and when spend-able funds become available to the firm. This component of float is attribut-able to the time required for a check to clear the banking system.
processing floatThe time between receipt of apayment and its deposit into thefirm’s account.
clearing floatThe time between deposit of apayment and when spendablefunds become available to thefirm.
LG6
floatFunds that have been sent by thepayer but are not yet usablefunds to the payee.
mail floatThe time delay between whenpayment is placed in the mail andwhen it is received.

516 PART 5 Short-Term Financial Decisions
Figure 13.3 illustrates the key components of float resulting from the issuanceand mailing of a check by the payer company to the payee company on day zero.The entire process required a total of 9 days: 3 days’ mail float, 2 days’ processingfloat, and 4 days’ clearing float. To the payer company, the delay is disbursementfloat; to the payee company, the delay is collection float.
Some popular techniques for managing the component parts of float to speedup collections and slow down payments are described here.
Speeding Up CollectionsSpeeding up collections reduces customer collection float time and thus reducesthe firm’s average collection period, which reduces the investment the firm mustmake in its cash conversion cycle. In our earlier examples, MAX Company hadannual sales of $10 million and 8 days of total collection float (receipt, process-ing, and collection time). If MAX can reduce its float time to 5 days, it will reduceits investment in the cash conversion cycle by $83,333 ([$10,000,000/360days]�3 days).
A popular technique for speeding up collections is a lockbox system. A lock-box system works as follows: Instead of mailing payments to the company, cus-tomers mail payments to a post office box. The firm’s bank empties the postoffice box regularly, processes each payment, and deposits the payments in thefirm’s account. Deposit slips, along with payment enclosures, are sent (or trans-mitted electronically) to the firm by the bank so that the firm can properly creditcustomers’ accounts. Lockboxes are geographically dispersed to match the loca-tions of the firm’s customers. A lockbox system affects all three components offloat. Lockboxes reduce mail time and often clearing time by being near the firm’scustomers. Lockboxes reduce processing time to nearly zero because the bankdeposits payments before the firm processes them. Obviously a lockbox systemreduces collection float time, but not without a cost; therefore, a firm must per-form an economic analysis to determine whether to implement a lockbox system.
Lockbox systems are commonly used by large firms whose customers aregeographically dispersed. However, a firm does not have to be large to benefit
Check Issuedand Mailed by
the PayerCompany
MailFloat
(3 days)
0
Check Clears
9
Time(days)
BookkeepingEntries Madeand CheckDeposited
5
Total Float (9 days)
Check Receivedby the Payee
Company
3
ProcessingFloat
(2 days)
ClearingFloat
(4 days)
FIGURE 13 .3
Float Time Line
Float resulting from a checkissued and mailed by thepayer company to the payeecompany
lockbox systemA collection procedure in whichcustomers mail payments to apost office box that is emptiedregularly by the firm’s bank, whoprocesses the payments anddeposits them in the firm’saccount. This system speeds upcollection time by reducingprocessing time as well as mailand clearing time.

CHAPTER 13 Working Capital and Current Assets Management 517
from a lockbox. Smaller firms can also benefit from a lockbox system. The bene-fit to small firms often comes primarily from transferring the processing of pay-ments to the bank.
Slowing Down PaymentsFloat is also a component of the firm’s average payment period. In this case, thefloat is in the favor of the firm. The firm may benefit by increasing all three of thecomponents of its payment float. One popular technique for increasing paymentfloat is controlled disbursing, which involves the strategic use of mailing pointsand bank accounts to lengthen mail float and clearing float, respectively. Thisapproach should be used carefully, though, because longer payment periods maystrain supplier relations.
In summary, a reasonable overall policy for float management is (1) to collectpayments as quickly as possible, because once the payment is in the mail, the
controlled disbursingThe strategic use of mailingpoints and bank accounts tolengthen mail float and clearingfloat, respectively.
In Practice
Lake Lillian, Minnesota, gained amention in a Chicago-area mediaoutlet, but not for being a hot fish-ing spot in this state of 10,000lakes. An eagle-eyed Chicago con-sumer wondered why his 25-centrebate check from Illinois Bellwas drawn on a bank in Lake Lil-lian. He was told by a media inves-tigator that many large corpora-tions issued rebate checks drawnon a bank there in order to getmore “float”—the time betweenwhen checks were issued andwhen the funds were deductedfrom their accounts. In reply, theparticular bank justifiably insistedthere was more to the story, notingits expertise in processing manysmall-dollar checks.
The cash management prac-tice of “remote disbursing”—writ-ing checks on banks located ingeographically isolated locationsto take advantage of the difficultyof presenting checks to them in atimely manner was commonbefore the Federal Reserve issueda policy statement in 1979 to dis-
courage the practice. Cash man-agers overlooked the fact thatputting money in one’s own pockettook it out of someone else’s.
E.F. Hutton, at the time one ofthe most prominent stock brokersin the United States, took advan-tage of banks’ inability to trackdeposits and transfers and gainedinterest-free use of multiple mil-lions of dollars each day. Thoughmany saw this as just “aggressivecash management,” a 1985 U.S.Justice Department ruling saw itas fraud (because Hutton wasusing money that its banks had notyet collected from the check writerand without the bank’s knowl-edge). Attorneys writing inBankers Magazine urged cashmanagers not to use any type ofremote disbursement in which thesole purpose is to increase checkcollection delays, thereby creatingfloat. That float causes a “hold” tobe placed on the funds so that thedepositor cannot use them.
In response to E.F. Hutton’saggressive practices, the profes-
sional association to which manycash managers and treasurersbelong implemented an ethicalcode. Anyone who is designated a“Certified Cash Manager” by theAssociation for Financial Profes-sionals must agree to maintain thehighest standards of conduct,including the standard to “refrainfrom intentional abuses of finan-cial systems and markets.”
Remote disbursing has largelydisappeared. However, the factthat many cash managers still seenothing wrong with sending checksto the wrong address or changingdisbursement banks to add a littlemore float shows that ethical codesdo not guarantee ethical behavior.The odd locations of some “con-trolled disbursement accounts”today indicate that financial man-agers need one more reminder: Themere fact that something is legaldoes not necessarily make it moralor ethical. The Golden Rule—do toothers as you would have them doto you—shows the inadvisability ofremote disbursing.
FOCUS ON ETHICS What Does It Do for You?

funds belong to the firm, and (2) to delay making payment to suppliers, becauseonce the payment is mailed, the funds belong to the supplier.
Cash ConcentrationCash concentration is the process used by the firm to bring lockbox and otherdeposits together into one bank, often called the concentration bank. Cash con-centration has three main advantages. First, it creates a large pool of funds foruse in making short-term cash investments. Because there is a fixed-cost compo-nent in the transaction cost associated with such investments, investing a singlepool of funds reduces the firm’s transaction costs. The larger investment poolalso allows the firm to choose from a greater variety of short-term investmentvehicles. Second, concentrating the firm’s cash in one account improves thetracking and internal control of the firm’s cash. Third, having one concentra-tion bank enables the firm to implement payment strategies that reduce idlecash balances.
There are a variety of mechanisms for transferring cash from the lockboxbank and other collecting banks to the concentration bank. One mechanism is adepository transfer check (DTC), which is an unsigned check drawn on one ofthe firm’s bank accounts and deposited in another. For cash concentration, aDTC is drawn on each lockbox or other collecting bank account and deposited inthe concentration bank account. Once the DTC has cleared the bank on which itis drawn (which may take several days), the transfer of funds is completed. Mostfirms currently provide deposit information by telephone to the concentrationbank, which then prepares and deposits into its account the DTC drawn on thelockbox or other collecting bank account.
A second mechanism is an ACH (automated clearinghouse) transfer, which isa preauthorized electronic withdrawal from the payer’s account. A computerizedclearing facility (called the automated clearinghouse, or ACH) makes a paperlesstransfer of funds between the payer and payee banks. An ACH settles accountsamong participating banks. Individual accounts are settled by respective bankbalance adjustments. ACH transfers clear in one day. For cash concentration, anACH transfer is made from each lockbox bank or other collecting bank to theconcentration bank. An ACH transfer can be thought of as an electronic DTC,but because the ACH transfer clears in one day, it provides benefits over a DTC;however, both banks in the ACH transfer must be members of the clearinghouse.
A third cash concentration mechanism is a wire transfer. A wire transfer is anelectronic communication that, via bookkeeping entries, removes funds from thepayer’s bank and deposits them in the payee’s bank. Wire transfers can eliminatemail and clearing float and may reduce processing float as well. For cash concen-tration, the firm moves funds using a wire transfer from each lockbox or othercollecting account to its concentration account. Wire transfers are a substitute forDTC and ACH transfers, but they are more expensive.
It is clear that the firm must balance the costs and benefits of concentratingcash to determine the type and timing of transfers from its lockbox and other col-lecting accounts to its concentration account. The transfer mechanism selectedshould be the one that is most profitable. (The profit per period of any transfermechanism equals earnings on the increased availability of funds minus the costof the transfer system.)
518 PART 5 Short-Term Financial Decisions
ACH (automated clearinghouse)transferPreauthorized electronicwithdrawal from the payer’saccount and deposit into thepayee’s account via a settlementamong banks by the automatedclearinghouse, or ACH.
wire transferAn electronic communicationthat, via bookkeeping entries,removes funds from the payer’sbank and deposits them in thepayee’s bank.
cash concentrationThe process used by the firm tobring lockbox and other depositstogether into one bank, oftencalled the concentration bank.
depository transfer check (DTC)An unsigned check drawn on oneof a firm’s bank accounts anddeposited in another.

CHAPTER 13 Working Capital and Current Assets Management 519
Zero-Balance AccountsZero-balance accounts (ZBAs) are disbursement accounts that always have anend-of-day balance of zero. The purpose is to eliminate nonearning cash balancesin corporate checking accounts. A ZBA works well as a disbursement accountunder a cash concentration system.
ZBAs work as follows: Once all of a given day’s checks are presented for pay-ment from the firm’s ZBA, the bank notifies the firm of the total amount of checks,and the firm transfers funds into the account to cover the amount of that day’schecks. This leaves an end-of-day balance of $0 (zero dollars). The ZBA enablesthe firm to keep all of its operating cash in an interest-earning account, therebyeliminating idle cash balances. Thus a firm that used a ZBA in conjunction with acash concentration system would need two accounts. The firm would concentrateits cash from the lockboxes and other collecting banks into an interest-earningaccount and would write checks against its ZBA. The firm would cover the exactdollar amount of checks presented against the ZBA with transfers from theinterest-earning account, leaving the end-of-day balance in the ZBA at $0.
A ZBA is a disbursement management tool. As we discussed earlier, the firmwould prefer to maximize its payment float. However, some cash managers feelthat actively attempting to increase float time on payments is unethical. A ZBAenables the firm to maximize the use of float on each check without altering thefloat time of payments to its suppliers. Keeping all the firm’s cash in an interest-earning account enables the firm to maximize earnings on its cash balances bycapturing the full float time on each check it writes.
Investing in Marketable SecuritiesMarketable securities are short-term, interest-earning, money market instrumentsthat can easily be converted into cash.5 Marketable securities are classified as partof the firm’s liquid assets. The firm uses them to earn a return on temporarily idlefunds. To be truly marketable, a security must have (1) a ready market in order tominimize the amount of time required to convert it into cash, and (2) safety ofprincipal, which means that it experiences little or no loss in value over time.
The securities that are most commonly held as part of the firm’s marketable-securities portfolio are divided into two groups: (1) government issues, whichhave relatively low yields as a consequence of their low risk, and (2) nongovern-ment issues, which have slightly higher yields than government issues with similarmaturities because of the slightly higher risk associated with them. Table 13.5summarizes the key features and recent (May 1, 2002) yields for popular mar-ketable securities.
Review Questions
13–17 What is float and what are its three components?
zero-balance account (ZBA)A disbursement account thatalways has an end-of-daybalance of zero because the firmdeposits money to cover checksdrawn on the account only asthey are presented for paymenteach day.
5. As explained in Chapter 1, the money market results from a financial relationship between the suppliers anddemanders of short-term funds, that is, marketable securities.
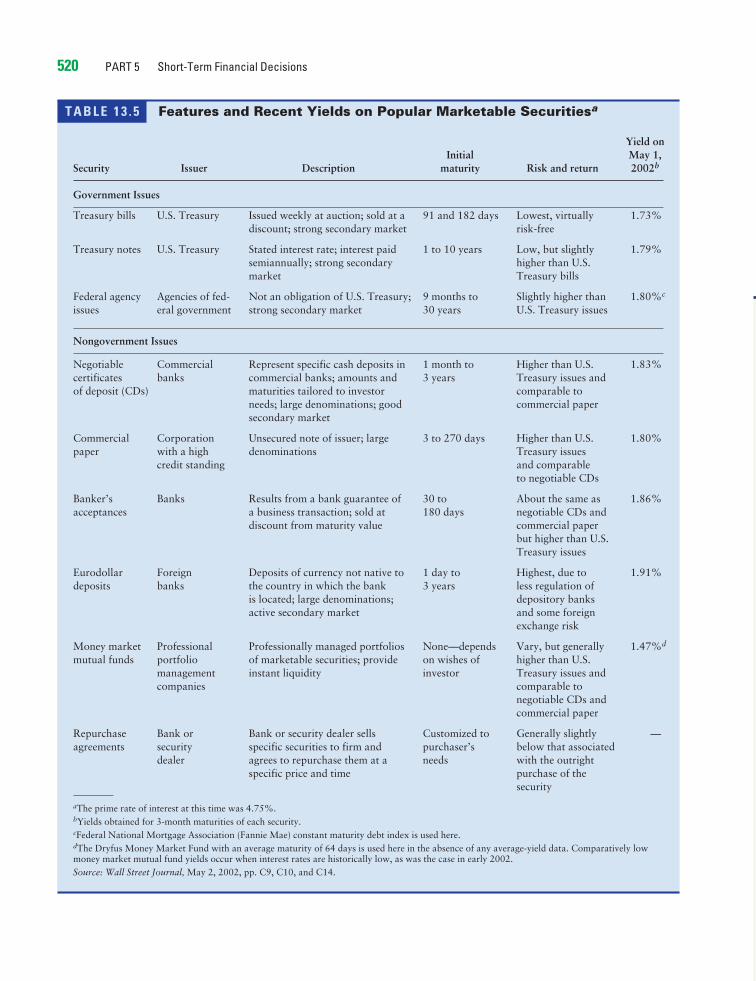
520 PART 5 Short-Term Financial Decisions
T A B L E 1 3 . 5 Features and Recent Yields on Popular Marketable Securitiesa
Yield onInitial May 1,
Security Issuer Description maturity Risk and return 2002b
Government Issues
Treasury bills U.S. Treasury Issued weekly at auction; sold at a 91 and 182 days Lowest, virtually 1.73%discount; strong secondary market risk-free
Treasury notes U.S. Treasury Stated interest rate; interest paid 1 to 10 years Low, but slightly 1.79%semiannually; strong secondary higher than U.S. market Treasury bills
Federal agency Agencies of fed- Not an obligation of U.S. Treasury; 9 months to Slightly higher than 1.80%c
issues eral government strong secondary market 30 years U.S. Treasury issues
Nongovernment Issues
Negotiable Commercial Represent specific cash deposits in 1 month to Higher than U.S. 1.83%certificates banks commercial banks; amounts and 3 years Treasury issues and of deposit (CDs) maturities tailored to investor comparable to
needs; large denominations; good commercial papersecondary market
Commercial Corporation Unsecured note of issuer; large 3 to 270 days Higher than U.S. 1.80%paper with a high denominations Treasury issues
credit standing and comparableto negotiable CDs
Banker’s Banks Results from a bank guarantee of 30 to About the same as 1.86%acceptances a business transaction; sold at 180 days negotiable CDs and
discount from maturity value commercial paperbut higher than U.S. Treasury issues
Eurodollar Foreign Deposits of currency not native to 1 day to Highest, due to 1.91%deposits banks the country in which the bank 3 years less regulation of
is located; large denominations; depository banksactive secondary market and some foreign
exchange risk
Money market Professional Professionally managed portfolios None—depends Vary, but generally 1.47%d
mutual funds portfolio of marketable securities; provide on wishes of higher than U.S.management instant liquidity investor Treasury issues andcompanies comparable to
negotiable CDs and commercial paper
Repurchase Bank or Bank or security dealer sells Customized to Generally slightly —agreements security specific securities to firm and purchaser’s below that associated
dealer agrees to repurchase them at a needs with the outrightspecific price and time purchase of the
security
aThe prime rate of interest at this time was 4.75%.bYields obtained for 3-month maturities of each security.cFederal National Mortgage Association (Fannie Mae) constant maturity debt index is used here.dThe Dryfus Money Market Fund with an average maturity of 64 days is used here in the absence of any average-yield data. Comparatively lowmoney market mutual fund yields occur when interest rates are historically low, as was the case in early 2002.Source: Wall Street Journal, May 2, 2002, pp. C9, C10, and C14.
CHAPTER 13 Working Capital and Current Assets Management 521
S U M M A RYFOCUS ON VALUE
It is important for a firm to maintain a reasonable level of net working capital. To do this, itmust balance the high profit and high risk associated with low levels of current assets andhigh levels of current liabilities against the low profit and low risk that result from high levelsof current assets and low levels of current liabilities. A strategy that achieves a reasonablebalance between profits and liquidity should positively contribute to the firm’s value.
Similarly, the firm should manage its cash conversion cycle by turning inventoryquickly; collecting accounts receivable quickly; managing mail, processing, and clearingtime; and paying accounts payable slowly. These strategies should enable the firm to man-age its current accounts efficiently and to minimize the amount of required investment inoperating assets.
The financial manager can use various techniques to manage inventory, accountsreceivable, and cash receipts to reduce the amount of resources needed to support the busi-ness. Employing these strategies, and using various techniques to manage accounts payableand cash disbursements to shorten the cash conversion cycle, should minimize the firm’scash requirements, thereby positively contributing to its value. Clearly, active managementof the firm’s working capital and current assets should positively contribute to the firm’sgoal of maximizing its stock price.
REVIEW OF LEARNING GOALS
Understand short-term financial management,net working capital, and the related tradeoff
between profitability and risk. Short-term financialmanagement is focused on managing each of thefirm’s current assets (inventory, accounts receivable,cash, and marketable securities) and current liabili-ties (accounts payable, accruals, and notes payable)in a manner that positively contributes to the firm’svalue. Net working capital is the difference between
LG1 current assets and current liabilities. Profitability isthe relationship between revenues and costs. Risk,in the context of short-term financial decisions, isthe probability that a firm will become technicallyinsolvent—unable to pay its bills as they come due.Assuming a constant level of total assets, the highera firm’s ratio of current assets to total assets, theless profitable the firm, and the less risky it is. Theconverse is also true. With constant total assets, the
13–18 What are the firm’s objectives with regard to collection float and to pay-ment float?
13–19 What are the three main advantages of cash concentration?13–20 What are three mechanisms of cash concentration? What is the objective
of using a zero-balance account (ZBA) in a cash concentration system?13–21 What two characteristics make a security marketable? Why are the yields
on nongovernment marketable securities generally higher than the yieldson government issues with similar maturities?

522 PART 5 Short-Term Financial Decisions
higher a firm’s ratio of current liabilities to totalassets, the more profitable and the more risky thefirm is. The converse of this statement is also true.
Describe the cash conversion cycle, its fundingrequirements, and the key strategies for manag-
ing it. The cash conversion cycle represents theamount of time a firm’s resources are tied up. It hasthree components: (1) average age of inventory, (2)average collection period, and (3) average paymentperiod. The length of the cash conversion cycledetermines the amount of time resources are tied upin the firm’s day-to-day operations. The firm’sinvestment in short-term assets often consists ofboth permanent and seasonal funding requirements.The seasonal requirements can be financed usingeither a low-cost, high-risk, aggressive financingstrategy or a high-cost, low-risk, conservativefinancing strategy. The firm’s funding decision forits cash conversion cycle ultimately depends onmanagement’s disposition toward risk and thestrength of the firm’s banking relationships. Tominimize its reliance on negotiated liabilities, thefinancial manager seeks to (1) turn over inventoryas quickly as possible, (2) collect accounts receiv-able as quickly as possible, (3) manage mail, pro-cessing, and clearing time, and (4) pay accountspayable as slowly as possible. Use of these strategiesshould minimize the cash conversion cycle.
Discuss inventory management: differing views,common techniques, and international con-
cerns. The viewpoints of marketing, manufacturing,and purchasing managers about the appropriate lev-els of inventory tend to cause higher inventories thanthose deemed appropriate by the financial manager.Four commonly used techniques for effectively man-aging inventory to keep its level low are (1) the ABCsystem, (2) the economic order quantity (EOQ)model, (3) the just-in-time (JIT) system, and (4) thematerials requirement planning (MRP) system.International inventory managers place greateremphasis on making sure that sufficient quantities ofinventory are delivered where they are needed, whenthey are needed, and in the right condition, than onordering the economically optimal quantities.
Explain the credit selection process and thequantitative procedure for evaluating changes
in credit standards. Credit selection and standards
LG4
LG3
LG2
are concerned with applying techniques for deter-mining which customers’ creditworthiness is consis-tent with the firm’s credit standards. Two popularcredit selection techniques are the five C’s of creditand credit scoring. Changes in credit standards canbe evaluated mathematically by assessing the effectsof a proposed change in profits on sales, the cost ofaccounts receivable investment, and bad-debt costs.
Review the procedures for quantitatively con-sidering cash discount changes, other aspects of
credit terms, and credit monitoring. Changes incredit terms (particularly the initiation of, or achange in, the cash discount) can be quantified in away similar to that for changes in credit standards.Changes in the cash discount period can also beevaluated using similar methods. Credit monitoring,the ongoing review of customer payment ofaccounts receivable, frequently involves use of theaverage collection period and the aging of accountsreceivable. A number of popular collection tech-niques are used by firms.
Understand the management of receipts anddisbursements, including float, speeding col-
lections, slowing payments, cash concentration,zero-balance accounts, and investing in marketablesecurities. Float refers to funds that have been sentby the payer but are not yet usable funds to thepayee. The components of float are mail time, proc-essing time, and clearing time. Float occurs in boththe average collection period and the average pay-ment period. One technique for speeding up collec-tions to reduce collection float is a lockbox system.A popular technique for slowing payments toincrease payment float is controlled disbursing,which involves strategic use of mailing points andbank accounts. The goal for managing operatingcash is to balance the opportunity cost of nonearningbalances against the transaction cost of temporaryinvestments. Firms commonly use depository trans-fer checks (DTCs), ACH transfers, and wire trans-fers to transfer lockbox receipts to their concentra-tion banks quickly. Zero-balance accounts (ZBAs)can be used to eliminate nonearning cash balances incorporate checking accounts. Marketable securitiesare short-term, interest-earning, money marketinstruments used by the firm to earn a return ontemporarily idle funds. They may be government ornongovernment issues.
LG6
LG5
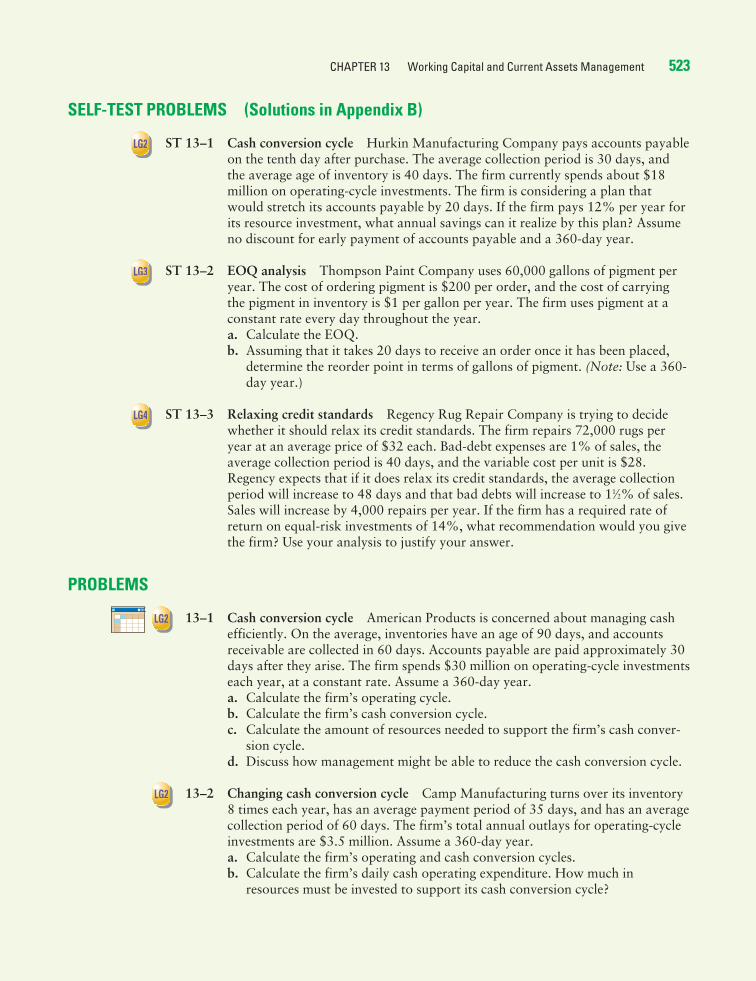
CHAPTER 13 Working Capital and Current Assets Management 523
SELF-TEST PROBLEMS (Solutions in Appendix B)
ST 13–1 Cash conversion cycle Hurkin Manufacturing Company pays accounts payableon the tenth day after purchase. The average collection period is 30 days, andthe average age of inventory is 40 days. The firm currently spends about $18million on operating-cycle investments. The firm is considering a plan thatwould stretch its accounts payable by 20 days. If the firm pays 12% per year forits resource investment, what annual savings can it realize by this plan? Assumeno discount for early payment of accounts payable and a 360-day year.
ST 13–2 EOQ analysis Thompson Paint Company uses 60,000 gallons of pigment peryear. The cost of ordering pigment is $200 per order, and the cost of carryingthe pigment in inventory is $1 per gallon per year. The firm uses pigment at aconstant rate every day throughout the year.a. Calculate the EOQ.b. Assuming that it takes 20 days to receive an order once it has been placed,
determine the reorder point in terms of gallons of pigment. (Note: Use a 360-day year.)
ST 13–3 Relaxing credit standards Regency Rug Repair Company is trying to decidewhether it should relax its credit standards. The firm repairs 72,000 rugs peryear at an average price of $32 each. Bad-debt expenses are 1% of sales, theaverage collection period is 40 days, and the variable cost per unit is $28.Regency expects that if it does relax its credit standards, the average collectionperiod will increase to 48 days and that bad debts will increase to 11⁄2% of sales.Sales will increase by 4,000 repairs per year. If the firm has a required rate ofreturn on equal-risk investments of 14%, what recommendation would you givethe firm? Use your analysis to justify your answer.
PROBLEMS
13–1 Cash conversion cycle American Products is concerned about managing cashefficiently. On the average, inventories have an age of 90 days, and accountsreceivable are collected in 60 days. Accounts payable are paid approximately 30days after they arise. The firm spends $30 million on operating-cycle investmentseach year, at a constant rate. Assume a 360-day year.a. Calculate the firm’s operating cycle.b. Calculate the firm’s cash conversion cycle.c. Calculate the amount of resources needed to support the firm’s cash conver-
sion cycle.d. Discuss how management might be able to reduce the cash conversion cycle.
13–2 Changing cash conversion cycle Camp Manufacturing turns over its inventory8 times each year, has an average payment period of 35 days, and has an averagecollection period of 60 days. The firm’s total annual outlays for operating-cycleinvestments are $3.5 million. Assume a 360-day year.a. Calculate the firm’s operating and cash conversion cycles.b. Calculate the firm’s daily cash operating expenditure. How much in
resources must be invested to support its cash conversion cycle?
LG2
LG3
LG4
LG2
LG2
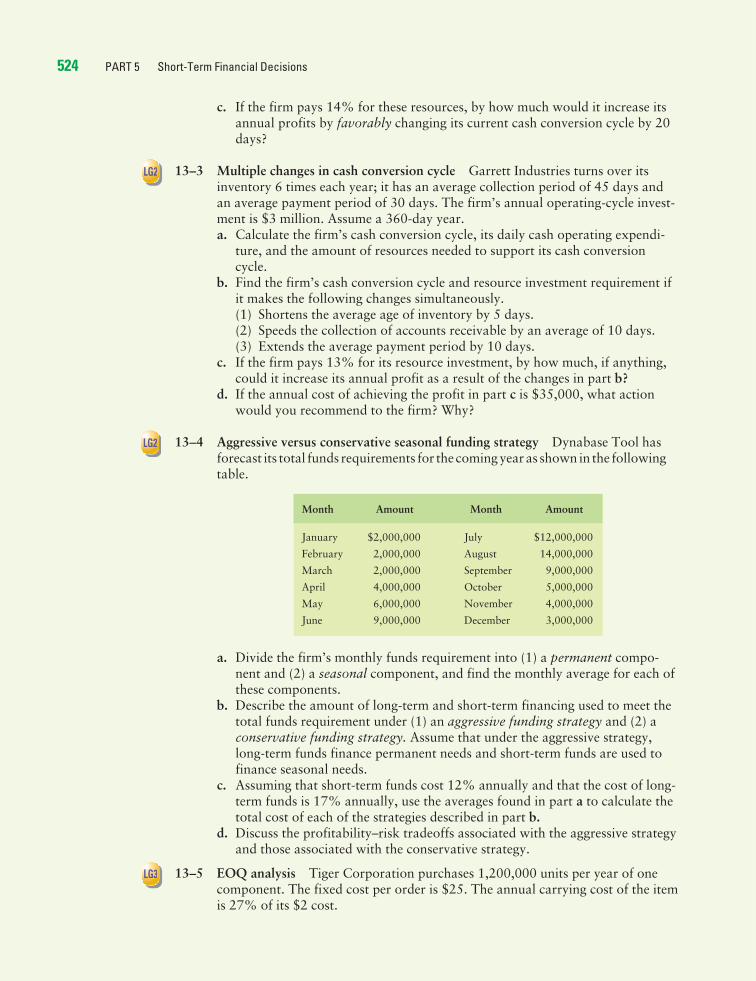
c. If the firm pays 14% for these resources, by how much would it increase itsannual profits by favorably changing its current cash conversion cycle by 20days?
13–3 Multiple changes in cash conversion cycle Garrett Industries turns over itsinventory 6 times each year; it has an average collection period of 45 days andan average payment period of 30 days. The firm’s annual operating-cycle invest-ment is $3 million. Assume a 360-day year.a. Calculate the firm’s cash conversion cycle, its daily cash operating expendi-
ture, and the amount of resources needed to support its cash conversioncycle.
b. Find the firm’s cash conversion cycle and resource investment requirement ifit makes the following changes simultaneously.(1) Shortens the average age of inventory by 5 days.(2) Speeds the collection of accounts receivable by an average of 10 days.(3) Extends the average payment period by 10 days.
c. If the firm pays 13% for its resource investment, by how much, if anything,could it increase its annual profit as a result of the changes in part b?
d. If the annual cost of achieving the profit in part c is $35,000, what actionwould you recommend to the firm? Why?
13–4 Aggressive versus conservative seasonal funding strategy Dynabase Tool hasforecast its total funds requirements for the comingyearas shown in the followingtable.
a. Divide the firm’s monthly funds requirement into (1) a permanent compo-nent and (2) a seasonal component, and find the monthly average for each ofthese components.
b. Describe the amount of long-term and short-term financing used to meet thetotal funds requirement under (1) an aggressive funding strategy and (2) aconservative funding strategy. Assume that under the aggressive strategy,long-term funds finance permanent needs and short-term funds are used tofinance seasonal needs.
c. Assuming that short-term funds cost 12% annually and that the cost of long-term funds is 17% annually, use the averages found in part a to calculate thetotal cost of each of the strategies described in part b.
d. Discuss the profitability–risk tradeoffs associated with the aggressive strategyand those associated with the conservative strategy.
13–5 EOQ analysis Tiger Corporation purchases 1,200,000 units per year of onecomponent. The fixed cost per order is $25. The annual carrying cost of the itemis 27% of its $2 cost.
Month Amount Month Amount
January $2,000,000 July $12,000,000
February 2,000,000 August 14,000,000
March 2,000,000 September 9,000,000
April 4,000,000 October 5,000,000
May 6,000,000 November 4,000,000
June 9,000,000 December 3,000,000
524 PART 5 Short-Term Financial Decisions
LG2
LG2
LG3

CHAPTER 13 Working Capital and Current Assets Management 525
a. Determine the EOQ under the following conditions: (1) no changes, (2) ordercost of zero, and (3) carrying cost of zero.
b. What do your answers illustrate about the EOQ model? Explain.
13–6 EOQ, reorder point, and safety stock Alexis Company uses 800 units of aproduct per year on a continuous basis. The product has a fixed cost of $50 perorder, and its carrying cost is $2 per unit per year. It takes 5 days to receive ashipment after an order is placed, and the firm wishes to hold 10 days’ usage ininventory as a safety stock.a. Calculate the EOQ.b. Determine the average level of inventory. (Note: Use a 360-day year to calcu-
late daily usage.)c. Determine the reorder point.d. Indicate which of the following variables change if the firm does not hold the
safety stock: (1) order cost, (2) carrying cost, (3) total inventory cost, (4)reorder point, (5) economic order quantity. Explain.
13–7 Accounts receivable changes without bad debts Tara’s Textiles currently hascredit sales of $360 million per year and an average collection period of 60 days.Assume that the price of Tara’s products is $60 per unit and that the variablecosts are $55 per unit. The firm is considering an accounts receivable changethat will result in a 20% increase in sales and a 20% increase in the average col-lection period. No change in bad debts is expected. The firm’s equal-risk oppor-tunity cost on its investment in accounts receivable is 14%.a. Calculate the additional profit contribution from new sales that the firm will
realize if it makes the proposed change.b. What marginal investment in accounts receivable will result?c. Calculate the cost of the marginal investment in accounts receivable.d. Should the firm implement the proposed change? What other information
would be helpful in your analysis?
13–8 Accounts receivable changes with bad debts A firm is evaluating an accountsreceivable change that would increase bad debts from 2% to 4% of sales. Salesare currently 50,000 units, the selling price is $20 per unit, and the variable costper unit is $15. As a result of the proposed change, sales are forecast to increaseto 60,000 units.a. What are bad debts in dollars currently and under the proposed change?b. Calculate the cost of the marginal bad debts to the firm.c. Ignoring the additional profit contribution from increased sales, if the pro-
posed change saves $3,500 and causes no change in the average investment inaccounts receivable, would you recommend it? Explain.
d. Considering all changes in costs and benefits, would you recommend the pro-posed change? Explain.
e. Compare and discuss your answers in parts c and d.
13–9 Relaxation of credit standards Lewis Enterprises is considering relaxing itscredit standards to increase its currently sagging sales. As a result of the pro-posed relaxation, sales are expected to increase by 10% from 10,000 to 11,000units during the coming year; the average collection period is expected toincrease from 45 to 60 days; and bad debts are expected to increase from 1% to3% of sales. The sale price per unit is $40, and the variable cost per unit is $31.
LG3
LG4
LG4
LG4

The firm’s required return on equal-risk investments is 25%. Evaluate the pro-posed relaxation, and make a recommendation to the firm.
13–10 Initiating a cash discount Gardner Company currently makes all sales on creditand offers no cash discount. The firm is considering offering a 2% cash discountfor payment within 15 days. The firm’s current average collection period is 60days, sales are 40,000 units, selling price is $45 per unit, and variable cost perunit is $36. The firm expects that the change in credit terms will result in anincrease in sales to 42,000 units, that 70% of the sales will take the discount,and that the average collection period will fall to 30 days. If the firm’s requiredrate of return on equal-risk investments is 25%, should the proposed discount beoffered?
13–11 Shortening the credit period A firm is contemplating shortening its creditperiod from 40 to 30 days and believes that as a result of this change, its averagecollection period will decline from 45 to 36 days. Bad-debt expenses areexpected to decrease from 1.5% to 1% of sales. The firm is currently selling12,000 units but believes that as a result of the proposed change, sales willdecline to 10,000 units. The sale price per unit is $56, and the variable cost perunit is $45. The firm has a required return on equal-risk investments of 25%.Evaluate this decision, and make a recommendation to the firm.
13–12 Lengthening the credit period Parker Tool is considering lengthening its creditperiod from 30 to 60 days. All customers will continue to pay on the net date.The firm currently bills $450,000 for sales and has $345,000 in variable costs.The change in credit terms is expected to increase sales to $510,000. Bad-debtexpenses will increase from 1% to 1.5% of sales. The firm has a required rate ofreturn on equal-risk investments of 20%.a. What additional profit contribution from sales will be realized from the pro-
posed change?b. What is the cost of the marginal investment in accounts receivable?c. What is the cost of the marginal bad debts?d. Do you recommend this change in credit terms? Why or why not?
13–13 Float Simon Corporation has daily cash receipts of $65,000. A recent analysisof its collections indicated that customers’ payments were in the mail an averageof 2.5 days. Once received, the payments are processed in 1.5 days. After pay-ments are deposited, it takes an average of 3 days for these receipts to clear thebanking system.a. How much collection float (in days) does the firm currently have?b. If the firm’s opportunity cost is 11%, would it be economically advisable for
the firm to pay an annual fee of $16,500 to reduce collection float by 3 days?Explain why or why not.
13–14 Lockbox system Eagle Industries feels that a lockbox system can shorten itsaccounts receivable collection period by 3 days. Credit sales are $3,240,000 peryear, billed on a continuous basis. The firm has other equally risky investmentswith a return of 15%. The cost of the lockbox system is $9,000 per year.a. What amount of cash will be made available for other uses under the lockbox
system?
526 PART 5 Short-Term Financial Decisions
LG5
LG5
LG5
LG6
LG6
CHAPTER 13 Working Capital and Current Assets Management 527
b. What net benefit (cost) will the firm realize if it adopts the lockbox system?Should it adopt the proposed lockbox system?
13–15 Zero-balance account Union Company is considering establishment of a zero-balance account. The firm currently maintains an average balance of $420,000 inits disbursement account. As compensation to the bank for maintaining the zero-balance account, the firm will have to pay a monthly fee of $1,000 and maintain a$300,000 non-interest-earning deposit in the bank. The firm currently has noother deposits in the bank. Evaluate the proposed zero-balance account, and makea recommendation to the firm, assuming that it has a 12% opportunity cost.
CHAPTER 13 CASE Assessing Roche Publishing Company’s Cash Management Efficiency
Lisa Pinto, vice president of finance at Roche Publishing Company, a rapidlygrowing publisher of college texts, is concerned about the firm’s high level
of short-term resource investment. She believes that the firm can improve themanagement of its cash and, as a result, reduce this investment. In this regard,she charged Arlene Bessenoff, the treasurer, with assessing the firm’s cash man-agement efficiency. Arlene decided to begin her investigation by studying thefirm’s operating and cash conversion cycles.
Arlene found that Roche’s average payment period was 25 days. She con-sulted industry data, which showed that the average payment period for theindustry was 40 days. Investigation of three similar publishing companiesrevealed that their average payment period was also 40 days. She estimated theannual cost of achieving a 40-day payment period to be $53,000.
Next, Arlene studied the production cycle and inventory policies. The aver-age age of inventory was 120 days. She determined that the industry standard asreported in a survey done by Publishing World, the trade association journal,was 85 days. She estimated the annual cost of achieving an 85-day average ageof inventory to be $150,000.
Further analysis showed Arlene that the firm’s average collection period was60 days. The industry average, derived from the trade association data and infor-mation on three similar publishing companies, was found to be 42 days—30%lower than Roche’s. Arlene estimated that if Roche initiated a 2% cash discountfor payment within 10 days of the beginning of the credit period, the firm’s aver-age collection period would drop from 60 days to the 42-day industry average.She also expected the following to occur as a result of the discount: Annual saleswould increase from $13,750,000 to $15,000,000; bad debts would remain un-changed; and the 2% cash discount would be applied to 75% of the firm’s sales.The firm’s variable costs equal 80% of sales.
Roche Publishing Company is currently spending $12,000,000 per year on itsoperating-cycle investment, but it expects that initiating a cash discount willincrease its operating-cycle investment to $13,100,000 per year. Arlene’s concernwas whether the firm’s cash management was as efficient as it could be. Arleneknew that the company paid 12% annual interest for its resource investment andtherefore viewed this value as the firm’s required return. For this reason, she wasconcerned about the resource investment cost resulting from any inefficiencies inthe management of Roche’s cash conversion cycle.
LG6

Required
a. Assuming a constant rate for purchases, production, and sales throughout theyear, what are Roche’s existing operating cycle (OC), cash conversion cycle(CCC), and resource investment need?
b. If Roche can optimize operations according to industry standards, whatwould its operating cycle (OC), cash conversion cycle (CCC), and resourceinvestment need be under these more efficient conditions?
c. In terms of resource investment requirements, what is the annual cost ofRoche Publishing Company’s operational inefficiency?
d. Evaluate whether Roche’s strategy for speeding its collection of accountsreceivable would be acceptable. What annual net profit or loss would resultfrom implementation of the cash discount?
e. Use your finding in part d, along with the payables and inventory costs given,to determine the total annual cost the firm would incur to achieve the indus-try level of operational efficiency.
f. Judging on the basis of your findings in parts c and e, should the firm incurthe annual cost to achieve the industry level of operational efficiency?Explain why or why not.
WEB EXERCISE Go to the Web site www.bankone.com. Click on Commercial in the left column.
1. What are the general categories of business services that Bank One offers?(They are listed in the left column.)
Click on Manage Cash.
2. What cash management services does the bank offer? What are MerchantServices and Stored-Value Cards, and how do they help businesses managecash?
Click on Treasury Management Services and then on Products and Services toget a list of seven different areas. Click on the appropriate area to answer the fol-lowing questions.
3. Describe the services for the following areas and explain how they increase afirm’s efficiency in managing its cash: (a) Collections and Deposits, (b) Dis-bursements and Payments, and (c) E-Commerce.
In one of the above areas, click on ACH Services and then on What is ACH.
4. Discuss the role of the ACH network, the process by which payments aremade, and describe two types of electronic payment options.
5. Navigate the International Banking page and click on Products and Servicesand then on Treasury. What services does Bank One offer for Collection, Dis-bursements, and Electronic Banking? How do these offerings differ from itsdomestic services, and why?
528 PART 5 Short-Term Financial Decisions
Remember to check the book’s Web site at
www.aw.com/gitman
for additional resources, including additional Web exercises.
WWW


