Page 1
1
Short Term Scientific Mission Report
COST Action OPTIMISE: ES1309
STSM Applicant: Karolina Sakowska, [email protected]
Meteorology Department, Poznan University of Life Sciences,
Piatkowska Street, 94B
60-649 Poznan, Poland
STSM topic: Assessing the link between sun-induced fluorescence, optical properties and
photosynthesis in crop canopies.
STSM reference code: COST-STSM-ES1309-34429
STSM type: Regular (from Poland to Germany)
Period: from 2016-07-03 to 2016-08-06
Host: Dr. Maria Pilar Cendrero-Mateo, [email protected]
Forschungszentrum Jülich, IBG-2
Wilhelm-Johnen-Straße
52428 Jülich Germany
1. Purpose of the STSM
The primary aim of the STMS was to continue the work carried out during FLEX field
campaigns aiming at understanding the link between sun-induced chlorophyll fluorescence
(SIF) and plants photosynthesis, and more in the specific, to analyze photosynthetic capacity,
SIF and optical properties of the chlorophyll-deficient mutant leaves and canopies in
comparison with a green soybean accession (Eiko). The soybean mutant (Minngold) was
recently isolated and cloned at the University of Minnesota (USA). The mutation is the result
of a nonsynonymous substitution in a Magnesium chelatase ChlI subunit leading to plants with
a “yellow” or “golden” phenotype that have approximately 80% less chlorophyll than the Eiko
(Campbell et al., 2014).
The above mentioned primary objective was preceded by training the STSM grant
holder in SIF measurements and data processing. The training phase took place through:
i) participation in another field campaign aiming at understanding how SIF changes within the
vertical profile of corn canopies (Zea mays L., Ricardinho variety) grown at two different
densities (normal density - 3 plants/m2 ; reduced plant density - 1 plant/m2) (details regarding
this field campaign activities can be found in the STSM report of dr Chiara Torresan, reference
number: COST-STSM-ES1309-34331) and ii) participation in the laboratory activities aiming
at HyScreen imaging system setup and testing.
Page 2
2
2. Description of the work carried out during the STSM
Main field experiment (Minngold and Eiko soybean accessions)
At the leaf scale:
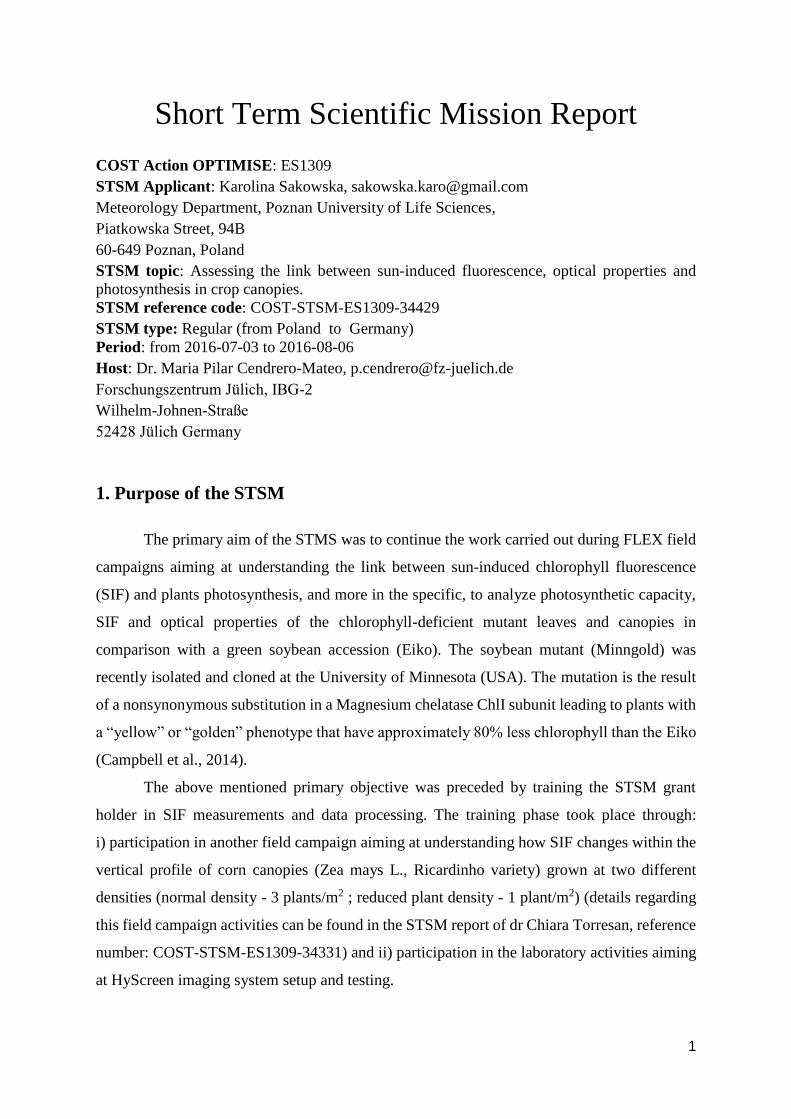
- the optical properties of Minngold and Eiko leaves were measured by means of the
ASD FieldSpec 3 Hi-Res spectrometer (ASD, Colorado, USA), coupled with a FluoWat
leaf clip. This portable leaf clip allowed to measure real leaf reflectance, transmittance
(without fluorescence contribution) and fluorescence emission under both artificial
(active measurements) and natural light conditions (passive measurements). The
fluorescence signal measuring principle is based on cutting off the incoming light
spectrum above 650 nm with a short-pass filter, which allows recording only the
fluorescence emission (650-850 nm), since in this way the measured signal does not
originate from reflection (Van Wittenberghe et al., 2013). Upward and downward
steady-state fluorescence (F↑, F↓; when the adaxial leaf side was illuminated) were
measured by placing the fiber optic into the upper or lower leaf clip opening,
respectively. As fluorescence emission is highly dependent on the intensity of incoming
photosynthetically active radiation – PARleaf (400-700 nm, Wm-2) (Meroni et al., 2009),
the F signal was normalized for the absorbed PARleaf (APARleaf=PARleaf*FAPARleaf)
during the data processing phase. Incoming PARleaf was measured as the reflected
radiance of a white reference, with and without filter, while leaf reflectance and
transmittance integrated over the PAR region were used to derive light absorbance and
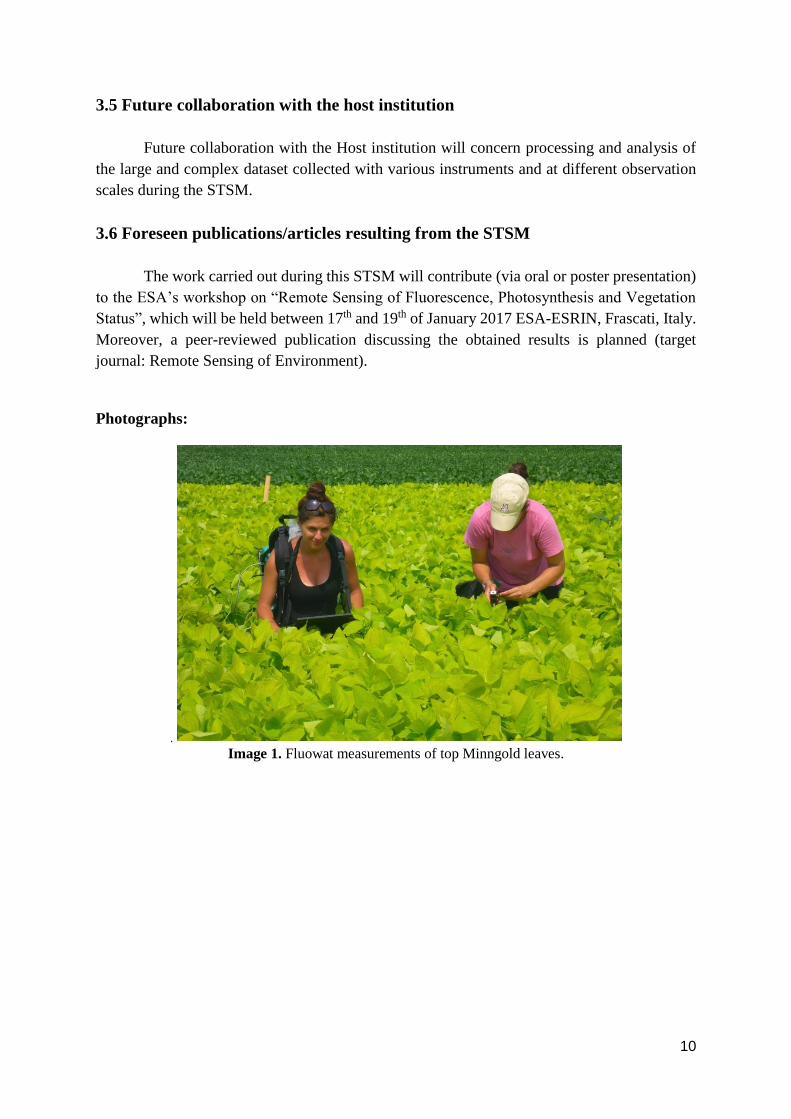
hence fraction of absorbed radiation (FAPARleaf). In our study, active measurements
were carried out by means of two types of artificial LED light sources characterized by
different emission spectra (LED1 - producing white light, LED2 – producing solely
blue peak). Active measurements were performed at leaves located at three different
canopy layers (bottom, middle, top), while passive measurements were conducted on
fully developed, sun exposed top-canopy leaves (Image 1);
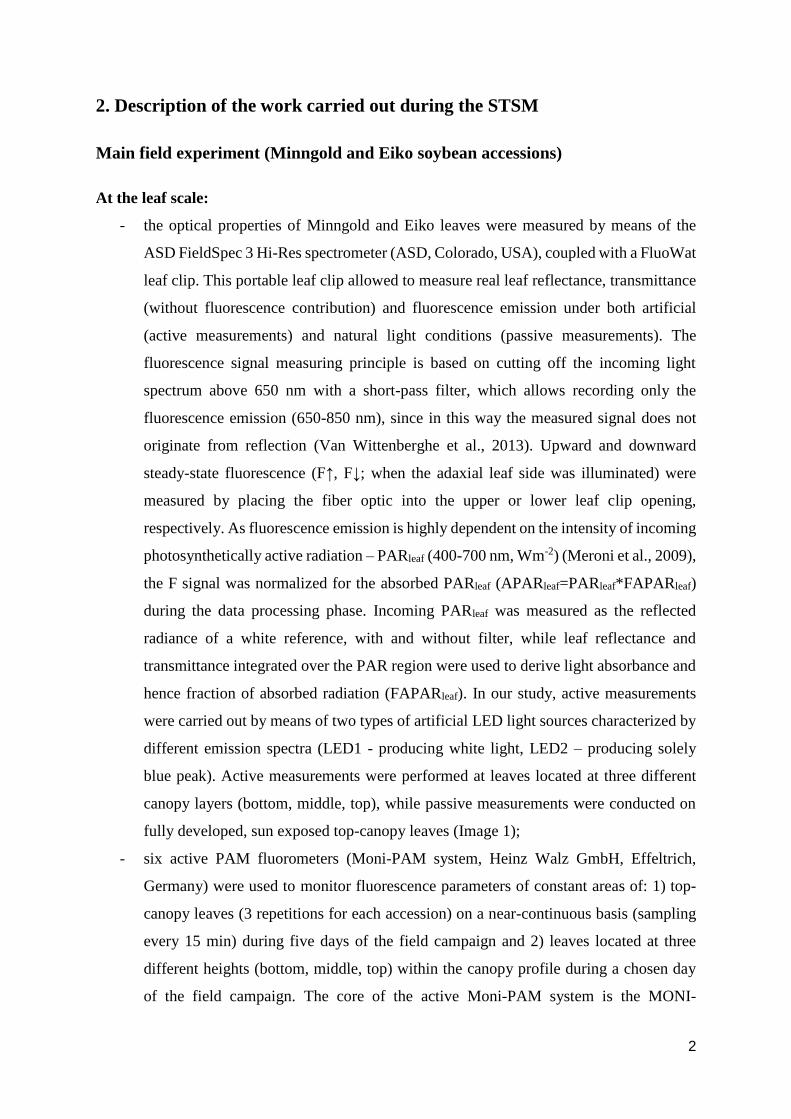
- six active PAM fluorometers (Moni-PAM system, Heinz Walz GmbH, Effeltrich,
Germany) were used to monitor fluorescence parameters of constant areas of: 1) top-
canopy leaves (3 repetitions for each accession) on a near-continuous basis (sampling
every 15 min) during five days of the field campaign and 2) leaves located at three
different heights (bottom, middle, top) within the canopy profile during a chosen day
of the field campaign. The core of the active Moni-PAM system is the MONI-
Page 3
3
HEAD/485 which delivers measuring and actinic light to the leaf through a window
that transmits radiation in the range of 400–750 nm, situated at one end of the cylinder.
The same blue LED emits actinic light and saturating flashes as well as measuring light:
the LED emission maximum and full width at half maximum is 455 nm and 18 nm,
respectively. Measuring pulses to excite modulated fluorescence are provided at
frequencies of 5 and 100 Hz for measurements of fluorescence under dark and light
conditions, respectively. The ambient light reflected from the Teflon sheet is measured
with a PAR sensor incorporated inside the measuring head (Porcar-Castell et al., 2007)
(Image 2);
- additionally, Minngold and Eiko leaf samples (discs of 1 cm2) corresponding to
different canopy layers (n=23 for each layer and accession) were collected (and stored
in liquid nitrogen) and will be used for chlorophyll and xanthophyll cycle pigments
measurement and characterization by UV-VIS spectroscopy (Lichtenthaler and
Buschmann, 2001) and high-performance liquid chromatography (Thayer and
Bjorkman, 1990), respectively.
At the canopy scale:
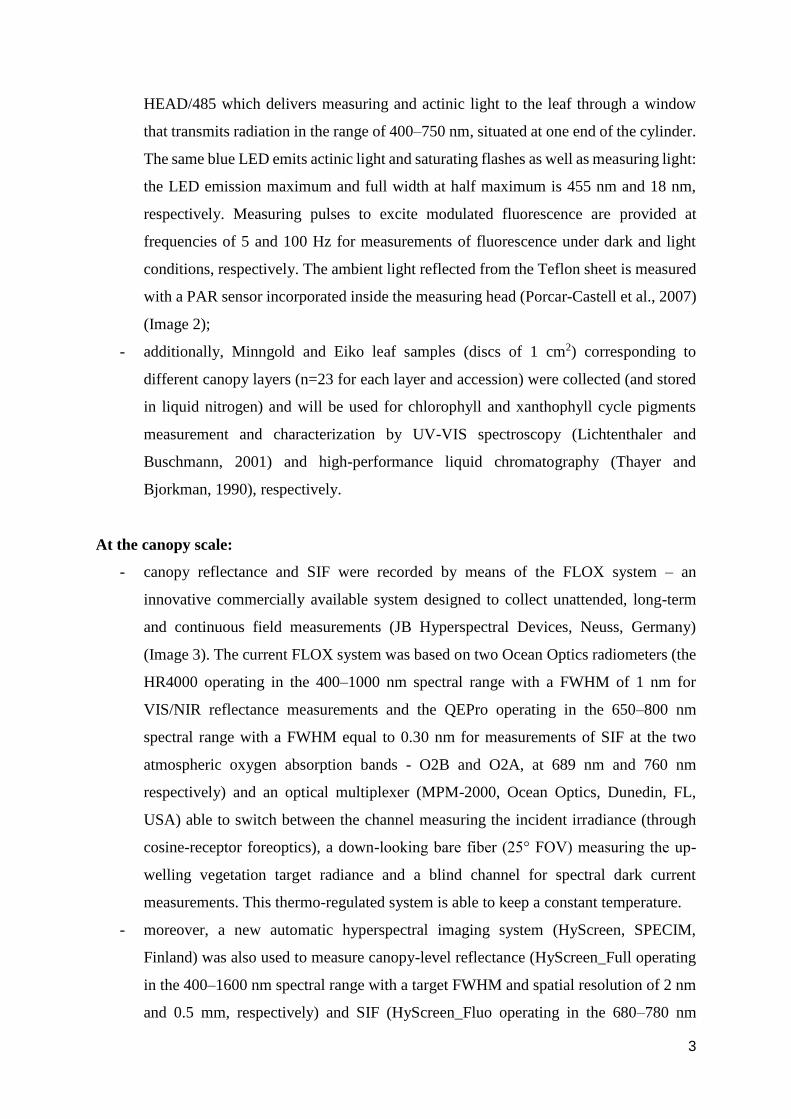
- canopy reflectance and SIF were recorded by means of the FLOX system – an
innovative commercially available system designed to collect unattended, long-term
and continuous field measurements (JB Hyperspectral Devices, Neuss, Germany)
(Image 3). The current FLOX system was based on two Ocean Optics radiometers (the
HR4000 operating in the 400–1000 nm spectral range with a FWHM of 1 nm for
VIS/NIR reflectance measurements and the QEPro operating in the 650–800 nm
spectral range with a FWHM equal to 0.30 nm for measurements of SIF at the two
atmospheric oxygen absorption bands - O2B and O2A, at 689 nm and 760 nm
respectively) and an optical multiplexer (MPM-2000, Ocean Optics, Dunedin, FL,
USA) able to switch between the channel measuring the incident irradiance (through
cosine-receptor foreoptics), a down-looking bare fiber (25° FOV) measuring the up-
welling vegetation target radiance and a blind channel for spectral dark current
measurements. This thermo-regulated system is able to keep a constant temperature.
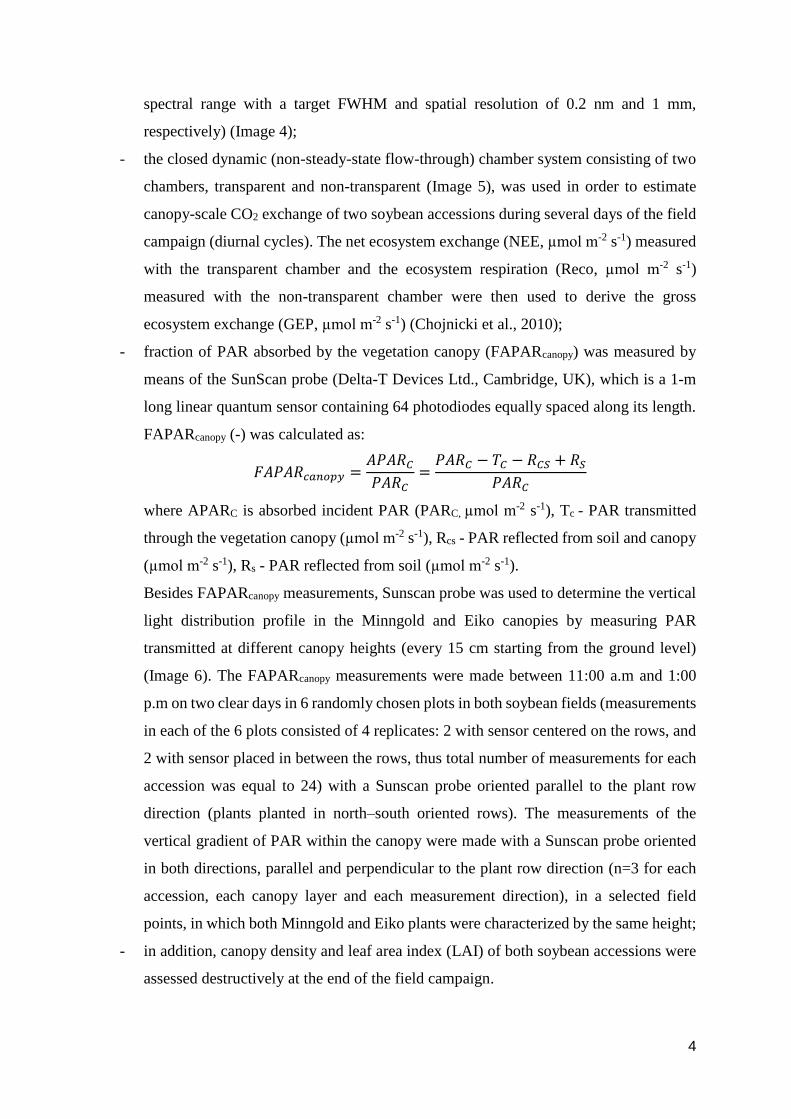
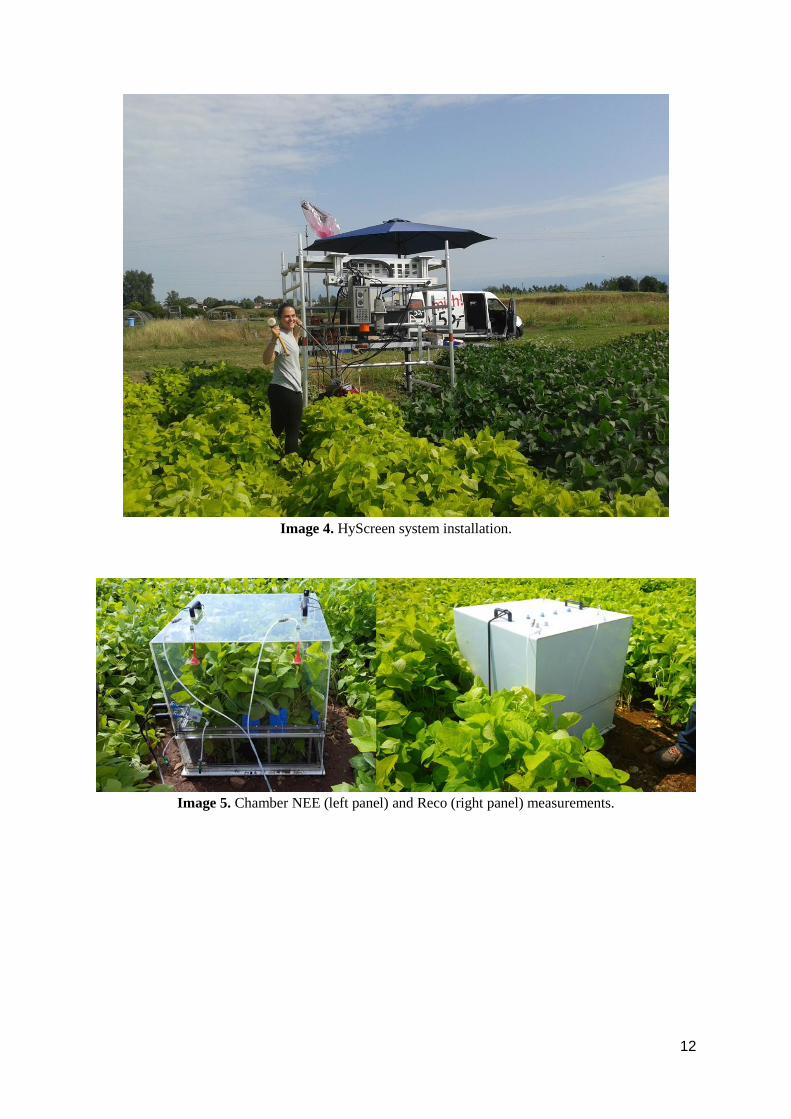
- moreover, a new automatic hyperspectral imaging system (HyScreen, SPECIM,
Finland) was also used to measure canopy-level reflectance (HyScreen_Full operating
in the 400–1600 nm spectral range with a target FWHM and spatial resolution of 2 nm
and 0.5 mm, respectively) and SIF (HyScreen_Fluo operating in the 680–780 nm
Page 4
4
spectral range with a target FWHM and spatial resolution of 0.2 nm and 1 mm,
respectively) (Image 4);
- the closed dynamic (non-steady-state flow-through) chamber system consisting of two
chambers, transparent and non-transparent (Image 5), was used in order to estimate
canopy-scale CO2 exchange of two soybean accessions during several days of the field
campaign (diurnal cycles). The net ecosystem exchange (NEE, µmol m-2 s-1) measured
with the transparent chamber and the ecosystem respiration (Reco, µmol m-2 s-1)
measured with the non-transparent chamber were then used to derive the gross
ecosystem exchange (GEP, µmol m-2 s-1) (Chojnicki et al., 2010);
- fraction of PAR absorbed by the vegetation canopy (FAPARcanopy) was measured by
means of the SunScan probe (Delta-T Devices Ltd., Cambridge, UK), which is a 1-m
long linear quantum sensor containing 64 photodiodes equally spaced along its length.
FAPARcanopy (-) was calculated as:
𝐹𝐴𝑃𝐴𝑅𝑐𝑎𝑛𝑜𝑝𝑦 =𝐴𝑃𝐴𝑅𝐶𝑃𝐴𝑅𝐶
=𝑃𝐴𝑅𝐶 − 𝑇𝐶 − 𝑅𝐶𝑆 + 𝑅𝑆
𝑃𝐴𝑅𝐶
where APARC is absorbed incident PAR (PARC, µmol m-2 s-1), Tc - PAR transmitted
through the vegetation canopy (µmol m-2 s-1), Rcs - PAR reflected from soil and canopy
(µmol m-2 s-1), Rs - PAR reflected from soil (µmol m-2 s-1).
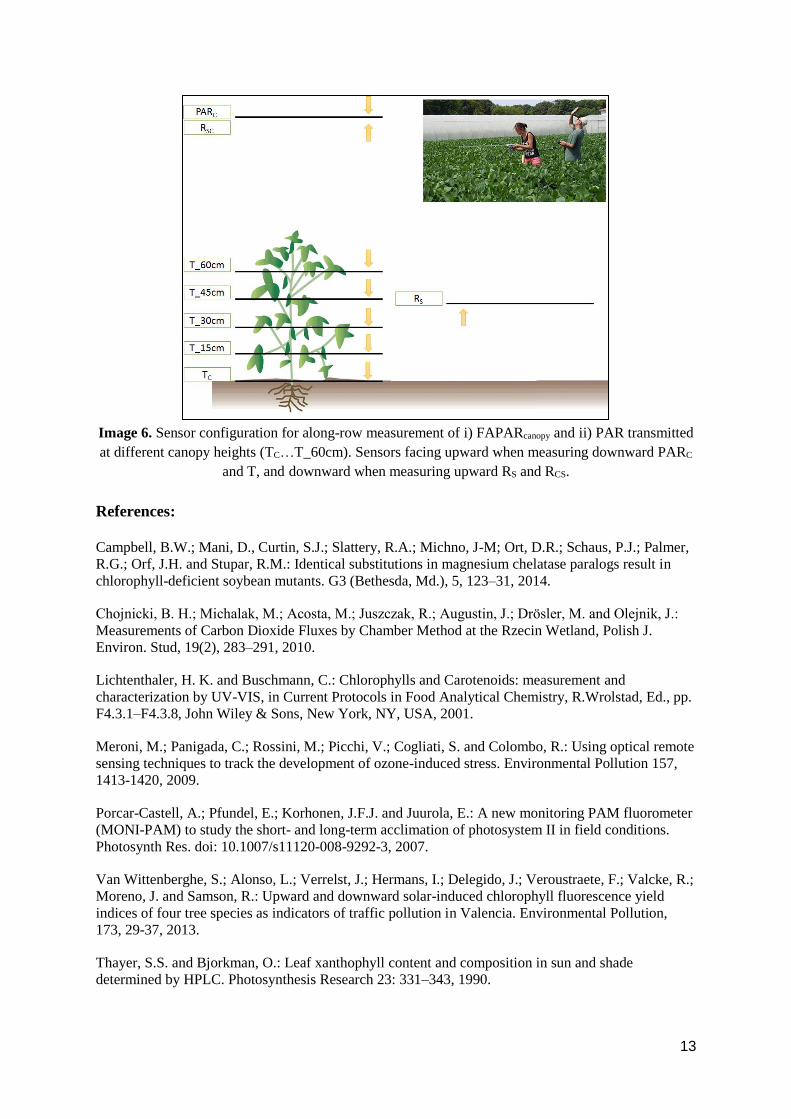
Besides FAPARcanopy measurements, Sunscan probe was used to determine the vertical
light distribution profile in the Minngold and Eiko canopies by measuring PAR
transmitted at different canopy heights (every 15 cm starting from the ground level)
(Image 6). The FAPARcanopy measurements were made between 11:00 a.m and 1:00
p.m on two clear days in 6 randomly chosen plots in both soybean fields (measurements
in each of the 6 plots consisted of 4 replicates: 2 with sensor centered on the rows, and
2 with sensor placed in between the rows, thus total number of measurements for each
accession was equal to 24) with a Sunscan probe oriented parallel to the plant row
direction (plants planted in north–south oriented rows). The measurements of the
vertical gradient of PAR within the canopy were made with a Sunscan probe oriented
in both directions, parallel and perpendicular to the plant row direction (n=3 for each
accession, each canopy layer and each measurement direction), in a selected field
points, in which both Minngold and Eiko plants were characterized by the same height;
- in addition, canopy density and leaf area index (LAI) of both soybean accessions were
assessed destructively at the end of the field campaign.
Page 5
5
3. Description of the main results obtained
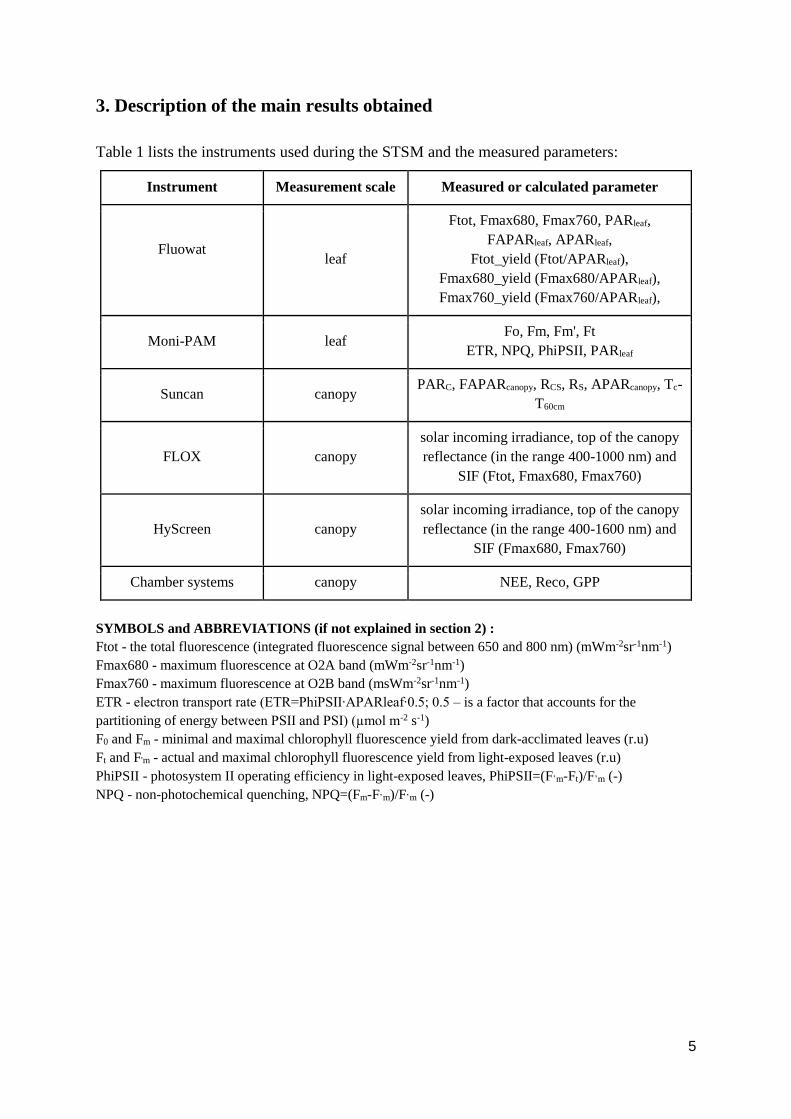
Table 1 lists the instruments used during the STSM and the measured parameters:
Instrument Measurement scale Measured or calculated parameter
Fluowat
leaf
Ftot, Fmax680, Fmax760, PARleaf,
FAPARleaf, APARleaf,
Ftot_yield (Ftot/APARleaf),
Fmax680_yield (Fmax680/APARleaf),
Fmax760_yield (Fmax760/APARleaf),
Moni-PAM leaf Fo, Fm, Fm', Ft
ETR, NPQ, PhiPSII, PARleaf
Suncan canopy PARC, FAPARcanopy, RCS, RS, APARcanopy, Tc-
T60cm
FLOX canopy
solar incoming irradiance, top of the canopy
reflectance (in the range 400-1000 nm) and
SIF (Ftot, Fmax680, Fmax760)
HyScreen canopy
solar incoming irradiance, top of the canopy
reflectance (in the range 400-1600 nm) and
SIF (Fmax680, Fmax760)
Chamber systems canopy NEE, Reco, GPP
SYMBOLS and ABBREVIATIONS (if not explained in section 2) :
Ftot - the total fluorescence (integrated fluorescence signal between 650 and 800 nm) (mWm-2sr-1nm-1)
Fmax680 - maximum fluorescence at O2A band (mWm-2sr-1nm-1)
Fmax760 - maximum fluorescence at O2B band (msWm-2sr-1nm-1)
ETR - electron transport rate (ETR=PhiPSII∙APARleaf∙0.5; 0.5 – is a factor that accounts for the
partitioning of energy between PSII and PSI) (µmol m-2 s-1)
F0 and Fm - minimal and maximal chlorophyll fluorescence yield from dark-acclimated leaves (r.u)
Ft and F'm - actual and maximal chlorophyll fluorescence yield from light-exposed leaves (r.u)
PhiPSII - photosystem II operating efficiency in light-exposed leaves, PhiPSII=(F’m-Ft)/F’m (-)
NPQ - non-photochemical quenching, NPQ=(Fm-F’m)/F’m (-)
Page 6
6
3.1 Fluowat
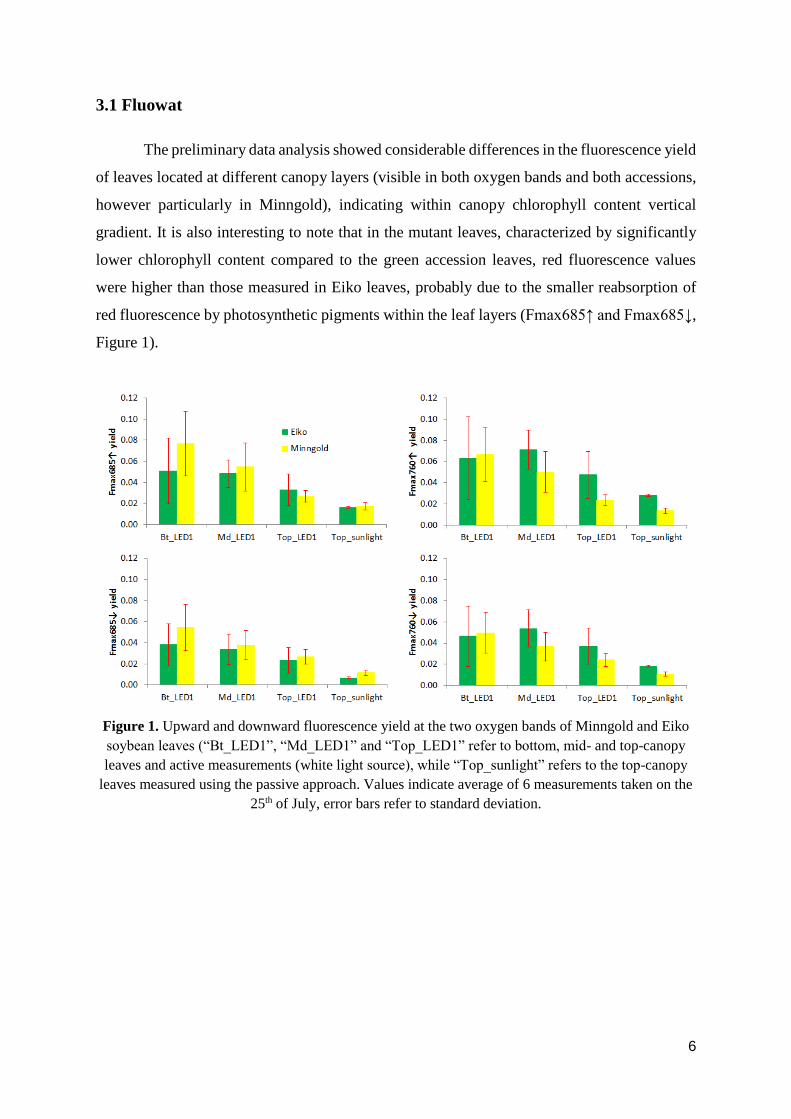
The preliminary data analysis showed considerable differences in the fluorescence yield
of leaves located at different canopy layers (visible in both oxygen bands and both accessions,
however particularly in Minngold), indicating within canopy chlorophyll content vertical
gradient. It is also interesting to note that in the mutant leaves, characterized by significantly
lower chlorophyll content compared to the green accession leaves, red fluorescence values
were higher than those measured in Eiko leaves, probably due to the smaller reabsorption of
red fluorescence by photosynthetic pigments within the leaf layers (Fmax685↑ and Fmax685↓,
Figure 1).
Figure 1. Upward and downward fluorescence yield at the two oxygen bands of Minngold and Eiko
soybean leaves (“Bt_LED1”, “Md_LED1” and “Top_LED1” refer to bottom, mid- and top-canopy
leaves and active measurements (white light source), while “Top_sunlight” refers to the top-canopy
leaves measured using the passive approach. Values indicate average of 6 measurements taken on the
25th of July, error bars refer to standard deviation.
Page 7
7
3.2 Moni-PAM
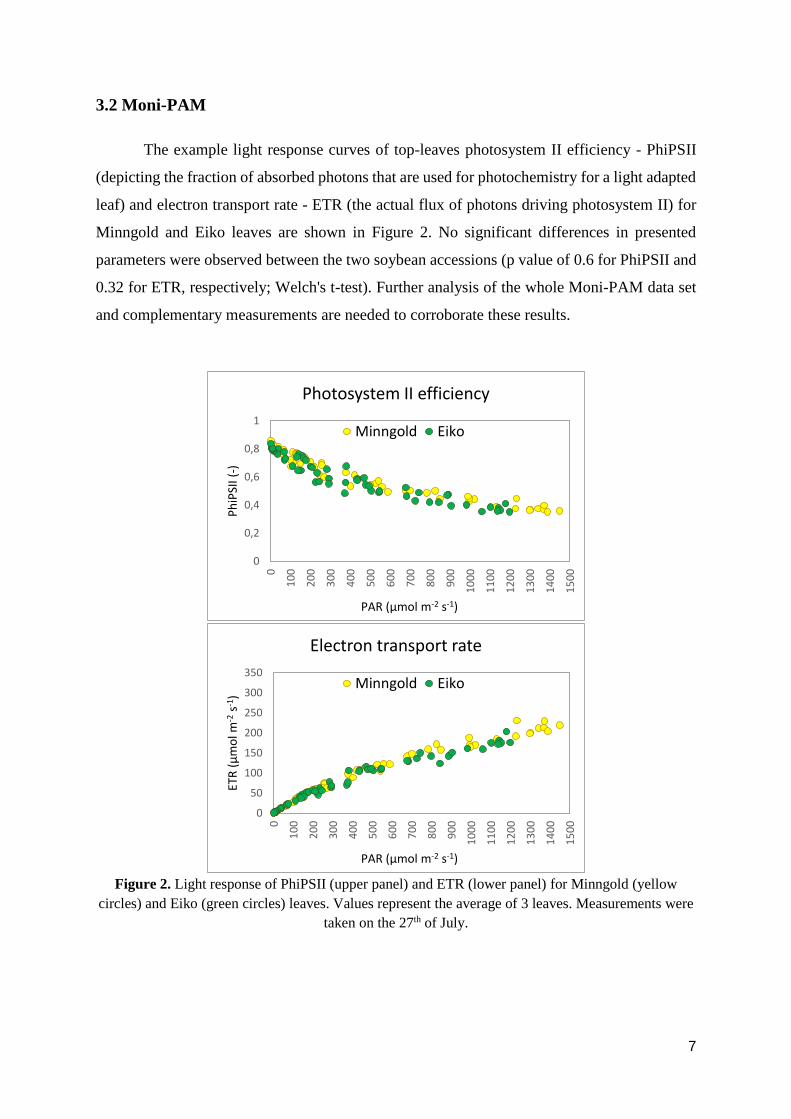
The example light response curves of top-leaves photosystem II efficiency - PhiPSII
(depicting the fraction of absorbed photons that are used for photochemistry for a light adapted
leaf) and electron transport rate - ETR (the actual flux of photons driving photosystem II) for
Minngold and Eiko leaves are shown in Figure 2. No significant differences in presented
parameters were observed between the two soybean accessions (p value of 0.6 for PhiPSII and
0.32 for ETR, respectively; Welch's t-test). Further analysis of the whole Moni-PAM data set
and complementary measurements are needed to corroborate these results.
Figure 2. Light response of PhiPSII (upper panel) and ETR (lower panel) for Minngold (yellow
circles) and Eiko (green circles) leaves. Values represent the average of 3 leaves. Measurements were
taken on the 27th of July.
0
0,2
0,4
0,6
0,8
1
0
10
0
20
0
30
0
40
0
50
0
60
0
70
0
80
0
90
0
10
00
11
00
12
00
13
00
14
00
15
00
Ph
iPSI
I (-)
PAR (µmol m-2 s-1)
Photosystem II efficiency
Minngold Eiko
0
50
100
150
200
250
300
350
0
10
0
20
0
30
0
40
0
50
0
60
0
70
0
80
0
90
0
10
00
11
00
12
00
13
00
14
00
15
00
ETR
(µ
mo
l m-2
s-1)
PAR (µmol m-2 s-1)
Electron transport rate
Minngold Eiko
Page 8
8
3.3 FAPAR
The fraction of absorbed photosynthetically active radiation (FAPARcanopy) of Eiko
soybean accession was approximately 7% higher than FAPARcanopy of the Minngold
chlorophyll deficient mutant (p value <0.001; Welch's t-test, Figure 3).
Figure 3. Fraction of absorbed photosynthetically active radiation (FAPARcanopy) measured on the
22nd of July in the two investigated soybean accession fields. The values are averages of 24
measurements taken in six randomly chosen field locations. Error bars represent standard deviation.
Figure 4. Vertical distribution of incoming photosynthetically active radiation (measured on the 22nd
of July) in Minngold and Eiko soybean canopies. The values are averages of 3 measurements, error
bars represent standard deviation.
0,89
0,95
0,8
0,82
0,84
0,86
0,88
0,9
0,92
0,94
0,96
0,98
1
FAPA
Rca
no
py
(-)
Minngold
Eiko
0 100 200 300 400 500 600 700
0
15
30
45
60
PAR (µmol m-2s-1)
Hei
ght
(cm
)
PAR profile within the canopy
Minngold Eiko
Page 9
9
3.4 Chamber CO2 exchange measurements
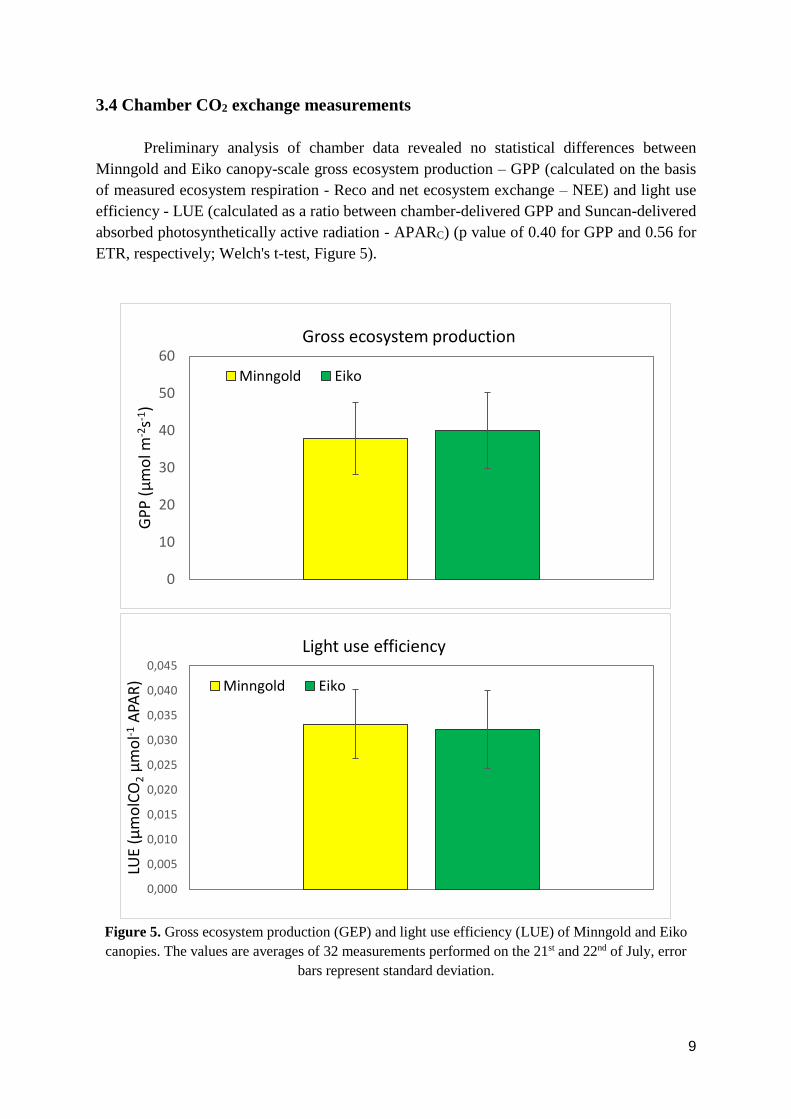
Preliminary analysis of chamber data revealed no statistical differences between
Minngold and Eiko canopy-scale gross ecosystem production – GPP (calculated on the basis
of measured ecosystem respiration - Reco and net ecosystem exchange – NEE) and light use
efficiency - LUE (calculated as a ratio between chamber-delivered GPP and Suncan-delivered
absorbed photosynthetically active radiation - APARC) (p value of 0.40 for GPP and 0.56 for
ETR, respectively; Welch's t-test, Figure 5).
Figure 5. Gross ecosystem production (GEP) and light use efficiency (LUE) of Minngold and Eiko
canopies. The values are averages of 32 measurements performed on the 21st and 22nd of July, error
bars represent standard deviation.
0
10
20
30
40
50
60
GP
P (
µm
ol m
-2s-1
)
Gross ecosystem production
Minngold Eiko
0,000
0,005
0,010
0,015
0,020
0,025
0,030
0,035
0,040
0,045
LUE
(µm
olC
O2
µm
ol-1
APA
R)
Light use efficiency
Minngold Eiko
Page 10
10
3.5 Future collaboration with the host institution
Future collaboration with the Host institution will concern processing and analysis of
the large and complex dataset collected with various instruments and at different observation
scales during the STSM.
3.6 Foreseen publications/articles resulting from the STSM
The work carried out during this STSM will contribute (via oral or poster presentation)
to the ESA’s workshop on “Remote Sensing of Fluorescence, Photosynthesis and Vegetation
Status”, which will be held between 17th and 19th of January 2017 ESA-ESRIN, Frascati, Italy.
Moreover, a peer-reviewed publication discussing the obtained results is planned (target
journal: Remote Sensing of Environment).
Photographs:
.
Image 1. Fluowat measurements of top Minngold leaves.
Page 11
11
Image 2. Moni-PAM head emitter-detector unit sampling the top leaves of Eiko (left) and Minngold
(right) soybean plants.
Image 3. FLOX system installation on a mobile platform.
Page 12
12
Image 4. HyScreen system installation.
Image 5. Chamber NEE (left panel) and Reco (right panel) measurements.
Page 13
13
Image 6. Sensor configuration for along-row measurement of i) FAPARcanopy and ii) PAR transmitted
at different canopy heights (TC…T_60cm). Sensors facing upward when measuring downward PARC
and T, and downward when measuring upward RS and RCS.
References:
Campbell, B.W.; Mani, D., Curtin, S.J.; Slattery, R.A.; Michno, J-M; Ort, D.R.; Schaus, P.J.; Palmer,
R.G.; Orf, J.H. and Stupar, R.M.: Identical substitutions in magnesium chelatase paralogs result in
chlorophyll-deficient soybean mutants. G3 (Bethesda, Md.), 5, 123–31, 2014.
Chojnicki, B. H.; Michalak, M.; Acosta, M.; Juszczak, R.; Augustin, J.; Drösler, M. and Olejnik, J.:
Measurements of Carbon Dioxide Fluxes by Chamber Method at the Rzecin Wetland, Polish J.
Environ. Stud, 19(2), 283–291, 2010.
Lichtenthaler, H. K. and Buschmann, C.: Chlorophylls and Carotenoids: measurement and
characterization by UV-VIS, in Current Protocols in Food Analytical Chemistry, R.Wrolstad, Ed., pp.
F4.3.1–F4.3.8, John Wiley & Sons, New York, NY, USA, 2001.
Meroni, M.; Panigada, C.; Rossini, M.; Picchi, V.; Cogliati, S. and Colombo, R.: Using optical remote
sensing techniques to track the development of ozone-induced stress. Environmental Pollution 157,
1413-1420, 2009.
Porcar-Castell, A.; Pfundel, E.; Korhonen, J.F.J. and Juurola, E.: A new monitoring PAM fluorometer
(MONI-PAM) to study the short- and long-term acclimation of photosystem II in field conditions.
Photosynth Res. doi: 10.1007/s11120-008-9292-3, 2007.
Van Wittenberghe, S.; Alonso, L.; Verrelst, J.; Hermans, I.; Delegido, J.; Veroustraete, F.; Valcke, R.;
Moreno, J. and Samson, R.: Upward and downward solar-induced chlorophyll fluorescence yield
indices of four tree species as indicators of traffic pollution in Valencia. Environmental Pollution,
173, 29-37, 2013.
Thayer, S.S. and Bjorkman, O.: Leaf xanthophyll content and composition in sun and shade
determined by HPLC. Photosynthesis Research 23: 331–343, 1990.