Page 1
Short-term trading strategy using
filtered share buyback signal
COMP 4971C (2019 Spring)
Amanda Alodia Guito YEAR 1 TECHNOLOGY & MANAGEMENT DUAL DEGREE PROGRAM
Supervised by Dr. David Rossiter
Page 2
Short-term trading strategy using filtered share buyback signal
1. Introduction Share buyback, which refers to a company’s repurchase of its own stocks that have previously
been sold to the market, is known to be one of the indicators that could be used by the inside
managers to signal to the public that the company’s share is undervalued and therefore induce
confidence that encourages people to buy. Compared to other indicators, share buyback signal
seems to be a more straightforward guide for trading decisions. As such, some traders rely on the
signal as a prompt to make their decision to buy. It is largely agreeable that should the stock be
held for long-term trading, the price would eventually appreciate. Nevertheless, the optimal selling
time is not as clear cut should a short-term strategy be adopted. Therefore, in response to this
niche, this report shall explore share buyback as a signal in short-term trading within 14 days and
how its holding period could be optimised to maximise profit.
2. Methodology
2.1 Approach
The strategy shall be tested with regards to the Standard and Poor’s (S&P) 500 Companies due to
their relatively accessible and comprehensive data, as well as the availability of benchmark, to
account for market trends, which is the index itself. This is especially crucial to avoid the false
premise that changes in the price of the stock may be a result of the whole market movement as
opposed to the share buyback effect, which is why the profit obtained is subtracted with the S&P
500 Index during the same period using this formula:
% Benchmarked Profit = % Profit of Stock - % Benchmark of S&P 500 Index
whereby % Profit refers to the change in price if sold in Day X over the initial price paid and %
Benchmark denotes the change in S&P 500 index in the same period divided by its starting price.
For instance, the day when buyback is issued, Stock Y has a closing price of $5.00, then after 1
day the price increases to $5.15. During the same period, the S&P 500 Index rises from $4.00 to
$4.01. As such the % Benchmarked Profit can be calculated as follows:
! % (5.15 − 5.00)/5.00 − (4.01 − 4.00)/4.00) * 100 = 2.75
Page � of �2 15
Page 3
Short-term trading strategy using filtered share buyback signal
Additionally, backtesting of the strategy is assisted by the stock analysis software, Stoxy, which is
provided by Dr. David Rossiter. In particular, using the Events feature whereby certain happenings
around the company such as share buyback may be included in the graph of its historical data.
This program is complemented with the existing data crunching and visualisation packages such
as Pandas, Matplotlib, and Seaborn to perform analysis.
2.2 Data Collection & Cleaning
Relevant data that need to be collected include dates of share buyback issuance and the amount
as a percentage to the outstanding shares, for each of the company, and these were gathered
from the Bloomberg terminal to ensure its reliability. After conducting minor cleaning of the data
including date and number formats, not all companies that have issued buybacks will be tested
upon. To allow more focused and credible analysis to be carried out, there are two criteria that
need to be considered:
• The number of shares buyback that has been issued, as this indicates the potential
frequency of buybacks in the near future. Thus, a company must have issued at least 10
buybacks.
• The amount of shares that has been bought back is relevant because the company must
issue enough share buyback to induce the confidence in traders. Hence, a company must
have bought back at least 50% of its outstanding shares.
Proceeding with these constraints, the resulting dataset contains 30 companies (Appendix A) and
for each, two .csv files are required to be fed into Stoxy:
• historical data containing daily prices obtained from Yahoo finance under Stocks directory
• the dates of buyback generated by a Python script under Events directory
To aid analysis, each available stock is classified according to the sector that the company is in,
as the nature of business may usually affect the behaviour of the stock price of the company. Of
the 30 companies, there are 5 sectors including: Information Technology, Health Care, Consumer
Discretionary, Financials, and Industrials — obtained from S&P classification.
Page � of �3 15
Page 4
Short-term trading strategy using filtered share buyback signal
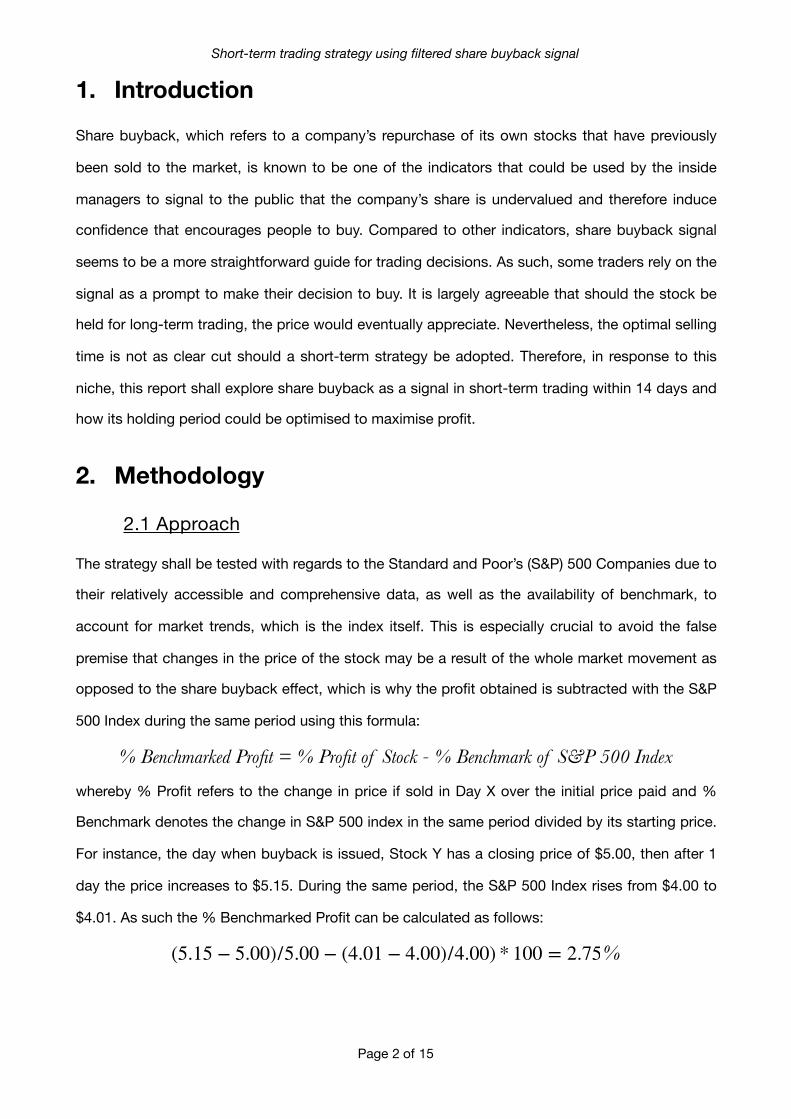
2.3 Implementation
The backtesting function within Stoxy is illustrated by the following flowchart:
2.4 Data Interpretation
All obtained data is presented in violin plots. The coloured part of the plot represents the overall
distribution of the data. A minor disclaimer that colour only serves as a visual aid, and therefore
does not contain any significant statistical meaning. The box-and-whiskers plot within show the
50% of the most commonly occurring data, with the whit dot being the median, the box as the
Interquartile Range, and the whiskers as the 1.5x Interquartile Range. The statistical validity of the
sector plots that come in the next section is to be taken with a pinch of salt as heavy filtering was
used to sieve out the companies that frequently bought stocks and do so in large amount. The
table below summaries how many companies there are for each of the sector. Also, the first
holding day result may not be a good estimate as data regarding the timing of the buyback
announcement could not be obtained.
Page � of �4 15
FIG 2. THE ANATOMY OF A VIOLIN PLOT, MODE.COM
For all the stocks, plot the graphFor each of the available stock
Iterate through the daily
data & filter Buyback
events
Obtain the closing prices
of the day and the
following 14 days
Perform calculation of
% Benchmarked Profit
Compile data into an
intermediate pandas
DataFrame
Obtain the mean %
Benchmarked Profit of
Day X
Compile this data into a
final DataFrame with
companies &
% Benchmarked Profit
FIG 1. BACKTESTING FUNCTION FLOWCHART
Sectors Number of Companies
Information Technology 9
Health Care 5
Consumer Discretionary 7
Financials 2
Industrials 6
Page 5
Short-term trading strategy using filtered share buyback signal
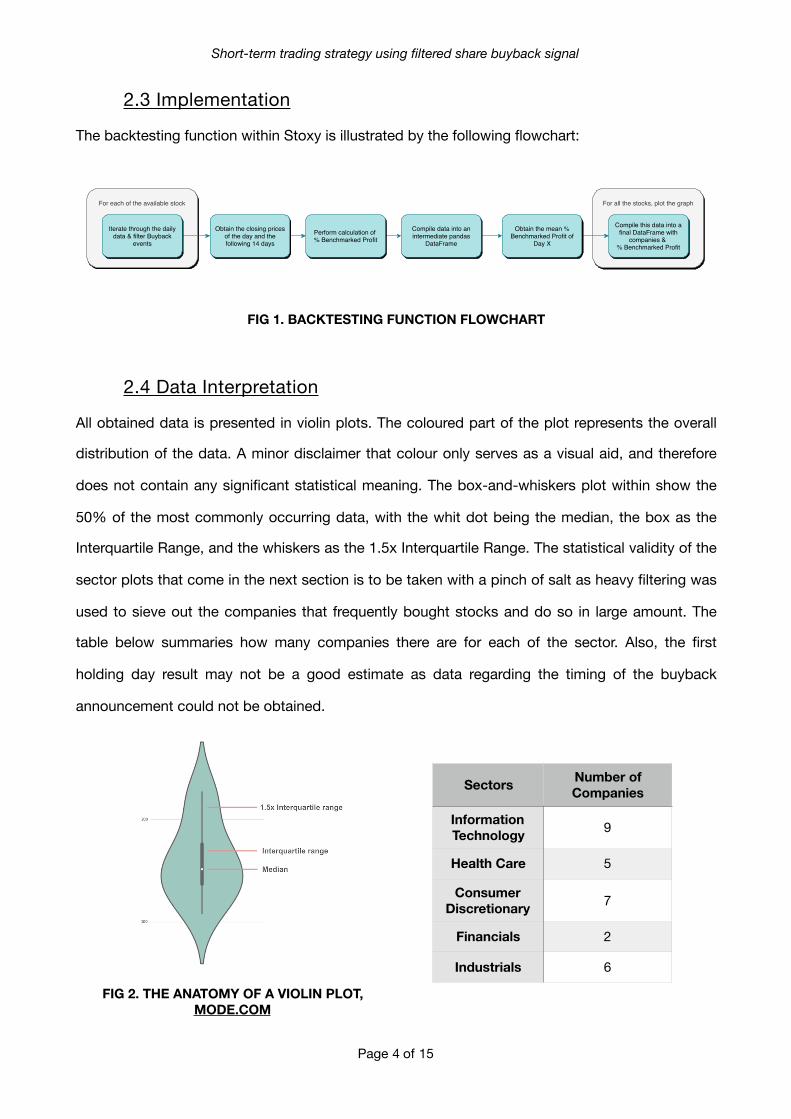
3. Results The results, attached in Appendix B, of the model is summarised by the following violin plots.
A. Master Plot
The overall results for all 30 companies show that the most ideal holding period is 5 or 7 days with
a median benchmarked profit of 1.6%. Throughout the 14 days, the benchmarked profit remain
positive, and therefore an indication of continual purchase of stock by other traders, regardless of
market trend which is subtracted by the S&P 500 Index. The distribution becomes flatter in about
1 week after the issuance of the share buyback.
Page � of �5 15
FIG 3. % BENCHMARKED PROFIT FOR ALL 30 COMPANIES
Page 6
Short-term trading strategy using filtered share buyback signal
B. Sector Plots
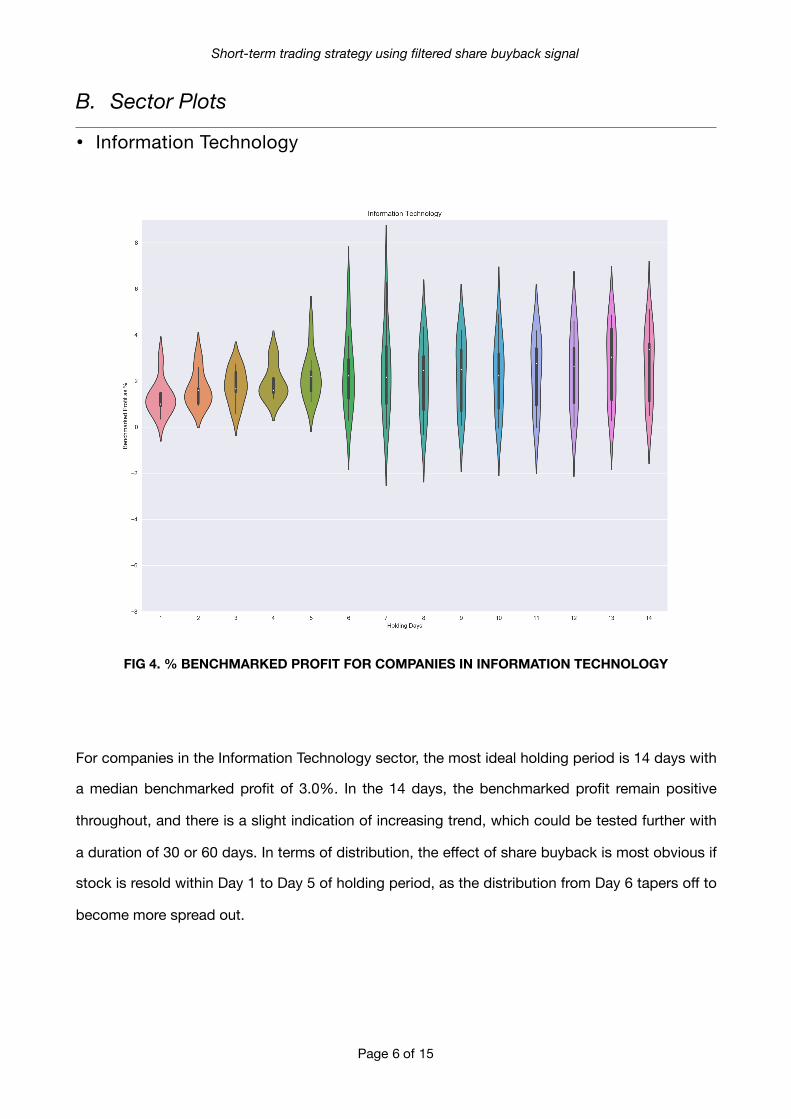
• Information Technology
For companies in the Information Technology sector, the most ideal holding period is 14 days with
a median benchmarked profit of 3.0%. In the 14 days, the benchmarked profit remain positive
throughout, and there is a slight indication of increasing trend, which could be tested further with
a duration of 30 or 60 days. In terms of distribution, the effect of share buyback is most obvious if
stock is resold within Day 1 to Day 5 of holding period, as the distribution from Day 6 tapers off to
become more spread out.
Page � of �6 15
FIG 4. % BENCHMARKED PROFIT FOR COMPANIES IN INFORMATION TECHNOLOGY
Page 7
Short-term trading strategy using filtered share buyback signal
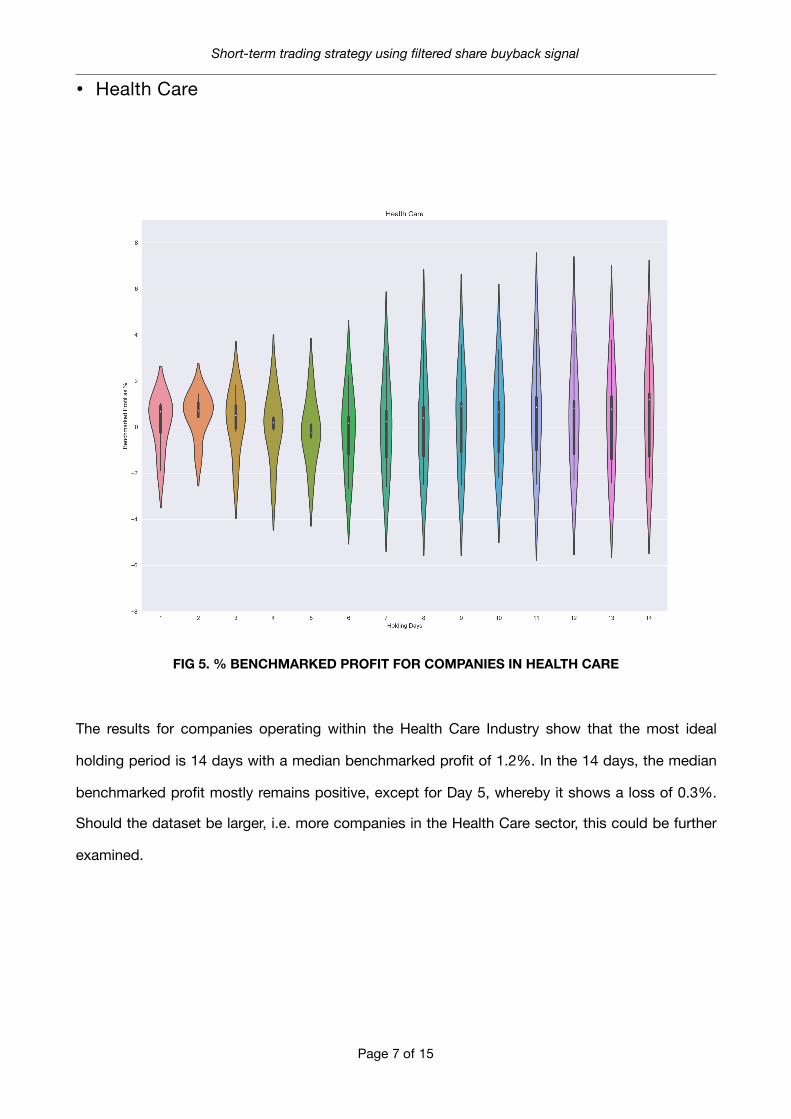
• Health Care
The results for companies operating within the Health Care Industry show that the most ideal
holding period is 14 days with a median benchmarked profit of 1.2%. In the 14 days, the median
benchmarked profit mostly remains positive, except for Day 5, whereby it shows a loss of 0.3%.
Should the dataset be larger, i.e. more companies in the Health Care sector, this could be further
examined.
Page � of �7 15
FIG 5. % BENCHMARKED PROFIT FOR COMPANIES IN HEALTH CARE
Page 8
Short-term trading strategy using filtered share buyback signal
• Consumer Discretionary
The Consumer Discretionary companies show that the most ideal holding period is 7, 9 or 10 days
with a median benchmarked profit of 2.0%. In the 14 days, the median benchmarked profit
remains positive, with a slight dip in Day 11 showing a median benchmark of 1.5%. The
distribution is less tapered off compared with other sectors which may be due to the nature of the
industry.
Page � of �8 15
FIG 6. % BENCHMARKED PROFIT FOR COMPANIES IN CONSUMER DISCRETIONARY
Page 9
Short-term trading strategy using filtered share buyback signal
• Financials
For companies in the Financials sector, the most ideal holding period is 6 days with a median
benchmarked profit of 1.8%. In the 14 days, the benchmarked profit remain positive throughout,
In terms of distribution, data is slightly different from the rest as they come only from 2
companies, as such this finding is perhaps the most statistically insignificant.
Page � of �9 15
FIG 7. % BENCHMARKED PROFIT FOR COMPANIES IN FINANCIALS
Page 10
Short-term trading strategy using filtered share buyback signal
• Industrials
The results of companies in the Industrials sector show that the most ideal holding period is 7
days with a median benchmarked profit of 1.7%. In the 14 days, the benchmarked profit remain
positive mostly, despite showing a loss of 0.5% in Day 12. In terms of distribution, the spread
slowly tapers off but has no significant holding period in which it drastically changes.
Page � of �10 15
FIG 8. % BENCHMARKED PROFIT FOR COMPANIES IN INDUSTRIALS
Page 11
Short-term trading strategy using filtered share buyback signal
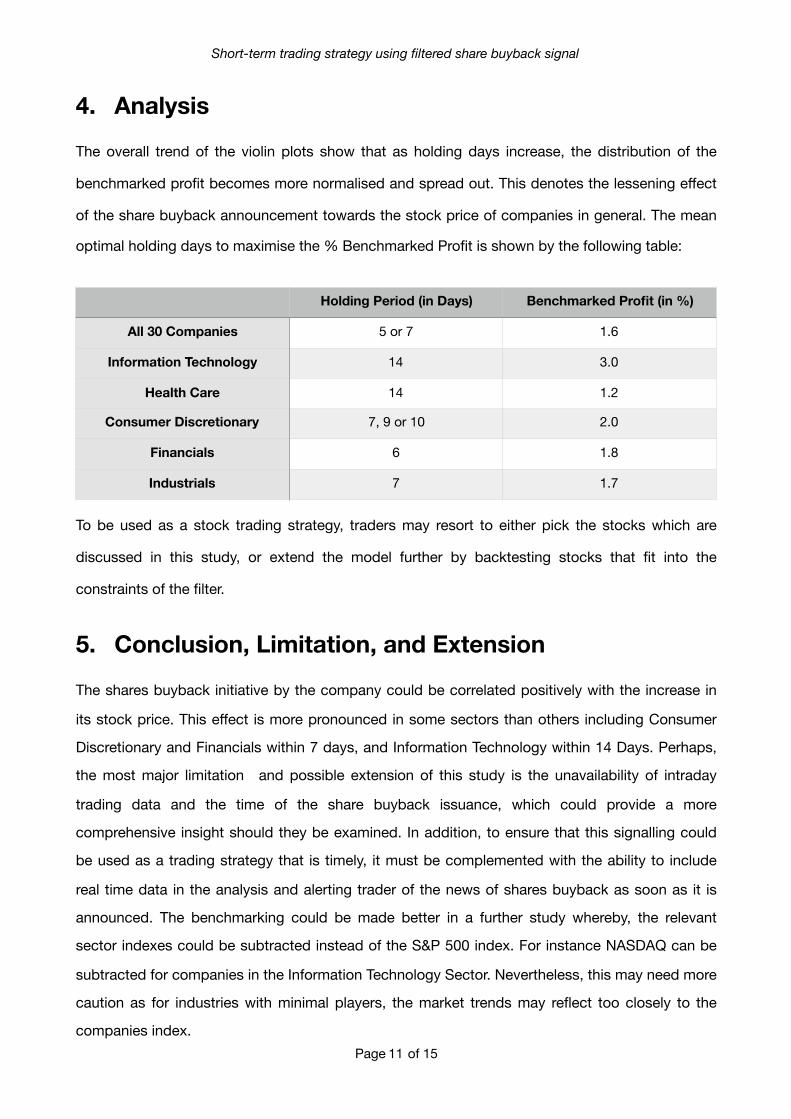
4. Analysis The overall trend of the violin plots show that as holding days increase, the distribution of the
benchmarked profit becomes more normalised and spread out. This denotes the lessening effect
of the share buyback announcement towards the stock price of companies in general. The mean
optimal holding days to maximise the % Benchmarked Profit is shown by the following table:
To be used as a stock trading strategy, traders may resort to either pick the stocks which are
discussed in this study, or extend the model further by backtesting stocks that fit into the
constraints of the filter.
5. Conclusion, Limitation, and Extension The shares buyback initiative by the company could be correlated positively with the increase in
its stock price. This effect is more pronounced in some sectors than others including Consumer
Discretionary and Financials within 7 days, and Information Technology within 14 Days. Perhaps,
the most major limitation and possible extension of this study is the unavailability of intraday
trading data and the time of the share buyback issuance, which could provide a more
comprehensive insight should they be examined. In addition, to ensure that this signalling could
be used as a trading strategy that is timely, it must be complemented with the ability to include
real time data in the analysis and alerting trader of the news of shares buyback as soon as it is
announced. The benchmarking could be made better in a further study whereby, the relevant
sector indexes could be subtracted instead of the S&P 500 index. For instance NASDAQ can be
subtracted for companies in the Information Technology Sector. Nevertheless, this may need more
caution as for industries with minimal players, the market trends may reflect too closely to the
companies index.Page � of �11 15
Holding Period (in Days) Benchmarked Profit (in %)
All 30 Companies 5 or 7 1.6
Information Technology 14 3.0
Health Care 14 1.2
Consumer Discretionary 7, 9 or 10 2.0
Financials 6 1.8
Industrials 7 1.7
Page 12
Short-term trading strategy using filtered share buyback signal
6. Appendix
A. Stock List
Page � of �12 15
Ticker Company Sector
V Visa Inc. Information Technology
WU Western Union Company Information Technology
VRSN VeriSign Inc. Information Technology
IBM International Business Machines Information Technology
FFIV F5 Networks Inc. Information Technology
QCOM QUALCOMM Incorporated Information Technology
ADS Alliance Data Systems Corp. Information Technology
MA Mastercard Inc. Information Technology
LRCX Lam Research Corporation Information Technology
NOC Northrop Grumman Corp. Industrials
MMM 3M Company Industrials
ROK Rockwell Automation Inc. Industrials
CSX CSX Corporation Industrials
LMT Lockheed Martin Corp. Industrials
LH Laboratory Corporation of America Health Care
CELG Celgene Corporation Health Care
ABC Amerisourcebergen Corp. Health Care
MCK McKesson Corp. Health Care
ANTM Anthem Inc. Health Care
WAT Waters Corp. Health Care
AIZ Assurant Inc. Financials
ALL Allstate Corp. Financials
LOW Lowe’s Companies Consumer Discretionary
RL Ralph Lauren Corp. Consumer Discretionary
CMG Chipotle Mexican Grill Consumer Discretionary
HD Home Depot Consumer Discretionary
AZO Autozone Consumer Discretionary
ORLY O’Reilly Automotive Inc. Consumer Discretionary
YUM Yum! Brands Consumer Discretionary
JWN Nordstrom Consumer Discretionary
Page 13
Short-term trading strategy using filtered share buyback signal
B. Master Data of Tickers % Benchmarked Profit
Page � of �13 15
Day 1 2 3 4 5 6 7 8 9 10 11 12 13 14
ABC 0.62 0.92 0.64 0.215 -0.3 0.23 0.45 0.88 0.8 1.055 1.34 1.05 1.175 1.43
ADS 0.347 0.959 0.6 1.347 1.571 1.1 0.653 0.571 0.712 0.547 0.959 1.053 1.106 0.741
AIZ 1.07 1.02 1.49 1.94 1.84 1.66 1.37 1.18 0.84 0.72 0.25 0.7 0.39 0.68
ALL 0.838 0.823 0.862 1.246 1.538 1.762 1.131 0.9 0.9 1.215 1.315 1.331 1.523 1.462
ANTM 1.011 1.439 1.839 2.006 1.922 2.233 3.072 3.756 3.578 3.383 4.256 4.161 3.789 3.972
AZO 0.354 0.429 0.646 0.764 0.339 0.504 0.686 0.779 0.293 0.021 -0.193 -0.239 -0.457 -0.611
CELG 1.027 1.118 1.045 0.445 -0.482 -1.618 -1.764 -1.682 -1.691 -1.509 -1.509 -1.7 -1.964 -2
CMG 0.894 1.061 0.944 1.217 1.867 1.35 1.85 1.989 3.078 2.917 2.956 2.561 2.333 2.461
CSX -0.942 -1.633 -1.375 -1.017 -0.917 -1.225 -1.617 -2.1 -2.808 -3.617 -3.6 -3.45 -3.417 -3.592
FFIV 2.975 3.142 2.742 3.117 4.4 5.7 6.283 4.35 4.2 3.067 3.425 4.608 3.2 3.375
HD 0.761 1.106 1.089 1.339 1.883 1.95 2.161 2.206 2.578 2.6 2.561 2.639 2.878 2.578
IBM 0.93 1.261 0.874 1.243 1.109 1.243 1.022 0.757 0.687 0.817 0.53 0.626 1.191 1.139
JWN 1.638 2.2 1.777 1.762 2.623 2.931 2.546 2.623 3.069 4.615 3.869 4.577 4.323 3.762
LH 0.721 0.5 0.386 0.164 0.179 0.514 0.779 0.836 1.036 1.114 0.579 0.55 0.386 0.95
LMT 0.133 0.16 0.1 -0.167 -0.733 -0.52 -0.64 -1.113 -1.733 -1.793 -1.693 -1.76 -1.427 -2.3
LOW -0.131 -0.969 -1.785 -1.669 -0.5 -0.669 -0.392 -0.715 -0.608 0.015 0.046 0.2 0.208 0.108
LRCX 1 1.658 1.65 1.875 2.342 2.483 2.167 2.458 3.342 3.475 3.058 2.767 4.292 4.05
MA 1.475 2.608 2.392 2.117 2.2 2.942 3.692 2.658 3.208 2.233 2.767 2.65 3.033 3.392
MCK -1.888 -1.231 -2.094 -2.456 -2.369 -2.662 -2.588 -2.481 -2.512 -2.2 -2.463 -2.294 -2.419 -2.2
MMM 1.09 1.68 1.95 1.9 1.67 1.5 1.81 2.16 2.58 1.75 1.89 2.3 2.53 2.52
NOC 1.754 1.808 2.615 1.815 2.131 1.985 1.923 1.762 1.477 1.308 1.777 2.315 1.754 2.146
ORLY 1.958 1.842 2.492 2.258 1.825 2.608 2.883 3.083 2.383 2.408 2.183 2.283 2.292 2.908
QCOM 0.877 0.992 1.892 1.554 1.685 0.3 -0.054 -0.331 0.077 -0.038 -0.015 0.008 0.277 0.508
RL 1.608 2.05 1.825 1.175 1.483 1.808 2.45 1.767 1.658 1.542 0.85 0.708 1.367 0.742
ROK 0.769 1.123 0.862 1.285 1.969 2.731 2.262 1.146 0.746 0.538 0.115 -0.431 0.054 0.123
V 1.476 1.676 1.665 1.488 1.359 1.494 1.935 1.629 1.888 1.982 2.041 1.635 1.835 2.059
VRSN 0.933 1.608 1.533 1.6 2.417 3.958 3.508 3.95 4.15 4.9 4.183 4.558 4.867 5.117
WAT -0.52 0.43 -0.19 -0.12 -0.19 0.14 0.07 -0.02 1.06 0.26 1.16 1.16 1.39 1.45
WU 1.513 1.025 2.675 3.225 2.9 2.225 2.8 3.075 2.512 3.188 4.15 3.437 4.262 3.613
YUM -0.009 -0.032 0.491 0.618 0.618 0.832 1.014 0.859 0.414 0.745 0.614 1.068 1.114 1.191
Page 14
Short-term trading strategy using filtered share buyback signal
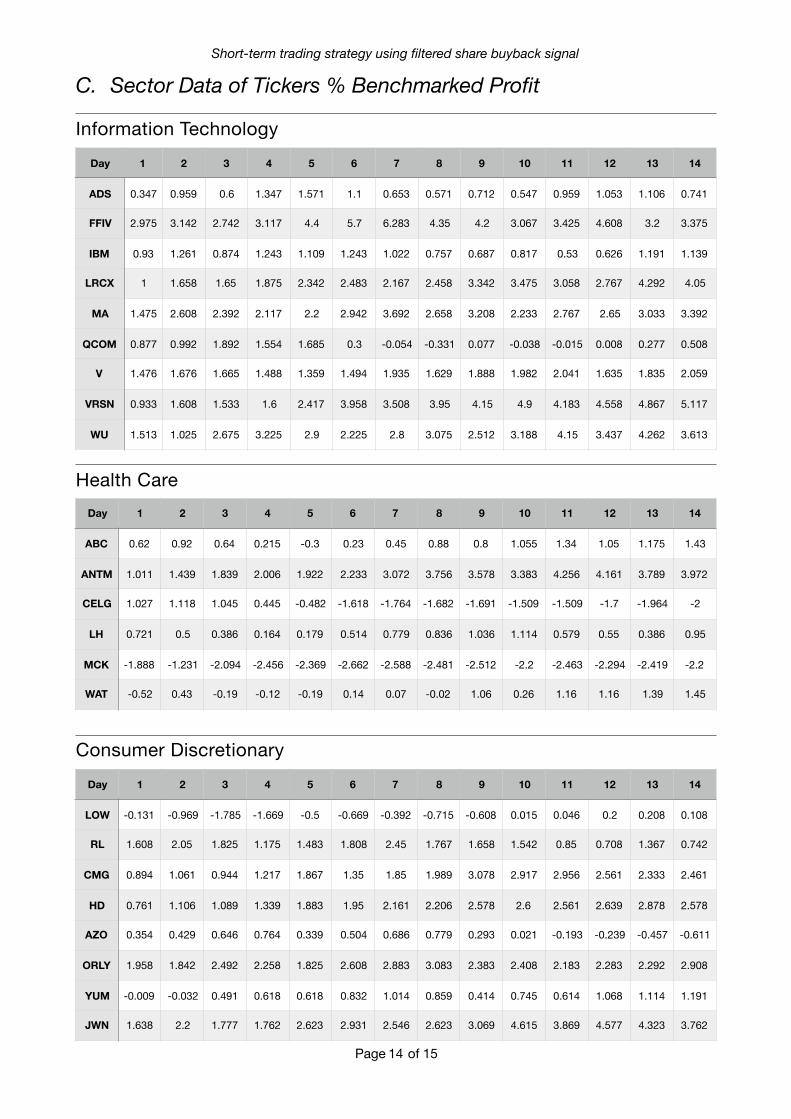
C. Sector Data of Tickers % Benchmarked Profit
Information Technology
Health Care
Consumer Discretionary
Day 1 2 3 4 5 6 7 8 9 10 11 12 13 14
ADS 0.347 0.959 0.6 1.347 1.571 1.1 0.653 0.571 0.712 0.547 0.959 1.053 1.106 0.741
FFIV 2.975 3.142 2.742 3.117 4.4 5.7 6.283 4.35 4.2 3.067 3.425 4.608 3.2 3.375
IBM 0.93 1.261 0.874 1.243 1.109 1.243 1.022 0.757 0.687 0.817 0.53 0.626 1.191 1.139
LRCX 1 1.658 1.65 1.875 2.342 2.483 2.167 2.458 3.342 3.475 3.058 2.767 4.292 4.05
MA 1.475 2.608 2.392 2.117 2.2 2.942 3.692 2.658 3.208 2.233 2.767 2.65 3.033 3.392
QCOM 0.877 0.992 1.892 1.554 1.685 0.3 -0.054 -0.331 0.077 -0.038 -0.015 0.008 0.277 0.508
V 1.476 1.676 1.665 1.488 1.359 1.494 1.935 1.629 1.888 1.982 2.041 1.635 1.835 2.059
VRSN 0.933 1.608 1.533 1.6 2.417 3.958 3.508 3.95 4.15 4.9 4.183 4.558 4.867 5.117
WU 1.513 1.025 2.675 3.225 2.9 2.225 2.8 3.075 2.512 3.188 4.15 3.437 4.262 3.613
Day 1 2 3 4 5 6 7 8 9 10 11 12 13 14
ABC 0.62 0.92 0.64 0.215 -0.3 0.23 0.45 0.88 0.8 1.055 1.34 1.05 1.175 1.43
ANTM 1.011 1.439 1.839 2.006 1.922 2.233 3.072 3.756 3.578 3.383 4.256 4.161 3.789 3.972
CELG 1.027 1.118 1.045 0.445 -0.482 -1.618 -1.764 -1.682 -1.691 -1.509 -1.509 -1.7 -1.964 -2
LH 0.721 0.5 0.386 0.164 0.179 0.514 0.779 0.836 1.036 1.114 0.579 0.55 0.386 0.95
MCK -1.888 -1.231 -2.094 -2.456 -2.369 -2.662 -2.588 -2.481 -2.512 -2.2 -2.463 -2.294 -2.419 -2.2
WAT -0.52 0.43 -0.19 -0.12 -0.19 0.14 0.07 -0.02 1.06 0.26 1.16 1.16 1.39 1.45
Day 1 2 3 4 5 6 7 8 9 10 11 12 13 14
LOW -0.131 -0.969 -1.785 -1.669 -0.5 -0.669 -0.392 -0.715 -0.608 0.015 0.046 0.2 0.208 0.108
RL 1.608 2.05 1.825 1.175 1.483 1.808 2.45 1.767 1.658 1.542 0.85 0.708 1.367 0.742
CMG 0.894 1.061 0.944 1.217 1.867 1.35 1.85 1.989 3.078 2.917 2.956 2.561 2.333 2.461
HD 0.761 1.106 1.089 1.339 1.883 1.95 2.161 2.206 2.578 2.6 2.561 2.639 2.878 2.578
AZO 0.354 0.429 0.646 0.764 0.339 0.504 0.686 0.779 0.293 0.021 -0.193 -0.239 -0.457 -0.611
ORLY 1.958 1.842 2.492 2.258 1.825 2.608 2.883 3.083 2.383 2.408 2.183 2.283 2.292 2.908
YUM -0.009 -0.032 0.491 0.618 0.618 0.832 1.014 0.859 0.414 0.745 0.614 1.068 1.114 1.191
JWN 1.638 2.2 1.777 1.762 2.623 2.931 2.546 2.623 3.069 4.615 3.869 4.577 4.323 3.762
Page � of �14 15
Page 15
Short-term trading strategy using filtered share buyback signal
Financials
Industrials
7. References
• Kenton, W. (2019, March 12). Buyback Ratio. Retrieved from https://www.investopedia.com/
terms/b/buyback-ratio.asp
• List of S&P 500 companies. (2019, May 25). Retrieved from https://en.wikipedia.org/wiki/
List_of_S&P_500_companies
• The Ultimate Python Seaborn Tutorial: Gotta Catch 'Em All. (2018, February 08). Retrieved
from https://elitedatascience.com/python-seaborn-tutorial#step-4
• Violin Plots 101: Visualizing Distribution and Probability Density. (n.d.). Retrieved from
https://mode.com/blog/violin-plot-examples
• Why Should Smaller Investors Care About Stock Buybacks? (2019, April 10). Retrieved from
https://finance.yahoo.com/news/why-smaller-investors-care-stock-141707799.html?.tsrc=rss
Day 1 2 3 4 5 6 7 8 9 10 11 12 13 14
AIZ 1.07 1.02 1.49 1.94 1.84 1.66 1.37 1.18 0.84 0.72 0.25 0.7 0.39 0.68
ALL 0.838 0.823 0.862 1.246 1.538 1.762 1.131 0.9 0.9 1.215 1.315 1.331 1.523 1.462
Day 1 2 3 4 5 6 7 8 9 10 11 12 13 14
NOC 1.754 1.808 2.615 1.815 2.131 1.985 1.923 1.762 1.477 1.308 1.777 2.315 1.754 2.146
MMM 1.09 1.68 1.95 1.9 1.67 1.5 1.81 2.16 2.58 1.75 1.89 2.3 2.53 2.52
ROK 0.769 1.123 0.862 1.285 1.969 2.731 2.262 1.146 0.746 0.538 0.115 -0.431 0.054 0.123
CSX -0.942 -1.633 -1.375 -1.017 -0.917 -1.225 -1.617 -2.1 -2.808 -3.617 -3.6 -3.45 -3.417 -3.592
LMT 0.133 0.16 0.1 -0.167 -0.733 -0.52 -0.64 -1.113 -1.733 -1.793 -1.693 -1.76 -1.427 -2.3
Page � of �15 15


![CSIT691 Independent Project - UNSW School of Computer ...rossiter/independent_studies... · multiplayer game and its possible solution. The game was built using Adobe Flex 3[1] together](https://static.documents.pub/doc/80x56/5eda1f66b3745412b570ce1f/csit691-independent-project-unsw-school-of-computer-rossiterindependentstudies.jpg)


