Mass cultures of algae receive considerable atten-tion because of their potential to clean up waste water(Gonzalez et al. 2008, Zhang et al. 2008), yield valu-
able products (Nitsan et al. 1999, Zhu & Jiang 2008),produce high levels of biomass (Gordon & Polle 2007)and, more recently, be used as a source for biofuelsand biodiesel (Gordon & Polle 2007). Both indoor sys-tems, which use either artificial lighting or sunlight
Short-term variations in photosynthetic parametersof Nannochloropsis cultures grown in two types of
outdoor mass cultivation systems
Jacco C. Kromkamp1,*, John Beardall2, Assaf Sukenik3, Jiri Kopeck)4, Jiri Masojidek5, Stef van Bergeijk6, Shai Gabai7, Efrat Shaham7, Amir Yamshon7
1Netherlands Institute of Ecology, Centre for Estuarine and Marine Ecology (NIOO-CEME), PO Box 140, 4400 AC Yerseke,The Netherlands
2School of Biological Sciences, Monash University, Wellington Road, Clayton, Victoria 3800, Australia3Israel Oceanographic and Limnological Research, Yigal Allon Kinneret Limnological Laboratory, PO Box 447,
14950 Migdal, Israel4Institute of Physical Biology, University of South Bohemia, Zámek 136, 37333 Nové Hrady, Czech Republic
5Institute of Microbiology, Academy of Sciences, Opatovick) ml)n, 37981 Trebon, Czech Republic6IFAPA Centro El Toruño Ctra. N IV Madrid-Cádiz, km 654a Camino de Tiro Pichón, 11500 El Puerto de Santa María, Spain
7The Mina and Everard Goodman Faculty of Life Sciences, Bar-Ilan University, Ramat-Gan 52900, Israel
ABSTRACT: The present study evaluated productivity under different operational (optical) condi-tions using the unicellular alga Nannochloropsis sp. (Eustigmatophyta). This alga is often grown inmass algal cultures because it contains high contents of the polyunsaturated fatty acid, eicosapen-taenoic acid (EPA, 20:5ω3). We followed biomass, photosynthetic activities and physiological parame-ters in a 3 d experiment using various photosynthesis techniques in 2 outdoor cultivation systems: aflat panel photobioreactor (FPP) and a high rate algal pond (HRAP). We aimed to detect acclimationbehaviour to the different optical conditions, with the FPP having a short light path and the HRAPhaving a long light path. Both algae cultures showed an afternoon depression of photosynthetic activ-ity, which was more pronounced in the FPP. Therefore, the HRAP culture showed ‘classical’ shadeadaptation behaviour, whereas the FPP algae was high-light acclimated. The FPP showed diurnalchanges in the potential rates of photosynthesis and respiration. High temperatures (41°C) on Day 3in the FPP caused a large reduction in the maximum Photosystem II (PSII) efficiency (Fv/Fm) and anover-reduction of the PSII acceptors, which did not recover during the light period. Chlorophyll fluo-rescence measurements with and without dark adaptation suggested that the decreased photosyn-thetic activity was due to both chronic and dynamic downregulation. Photodamage was higher in theFPP, but most was recovered during the evening. A comparison between the quantum efficiencies forPSII charge separation and oxygen evolution revealed a close coupling between the 2 processes. Wealso concluded that the optical absorption cross section of PSII equalled 75% of the total absorptioncross section.
Resale or republication not permitted without written consent of the publisher
Contribution to AME Special 2: ‘Progress and perspectives in aquatic primary productivity’ OPENPEN ACCESSCCESS
Aquat Microb Ecol: Preprint, 2009
(Matthijs et al. 1996), and outdoor systems, which usenatural solar radiation, are currently in use. Althoughoperational conditions can be optimized for outdoorproduction ponds and photobioreactors to maintainmaximal production rates for extended periods(Borowitzka 1999), these systems are nonethelessprone to technical failures leading to possible condi-tions of stress for the algae. For reliable large scale pro-duction it is essential that algae can recover from thesestressful conditions.
The unicellular alga Nannochloropsis (Eustigmato-phyta) was used here with the aim to study a single spe-cies and to evaluate productivity under different opera-tional conditions using different methodologies tomeasure photosynthetic performance. Nannochloropsisis recognized as an excellent source of eicosapen-taenoic acid (EPA, 20:5ω3), a polyunsaturated fatty acidessential for human and animal consumption. Massproduction of Nannochloropsis can be easily attained inhigh rate algal ponds (Sukenik 1999), in flat panel pho-tobioreactors (Zuo & Richmond 1999) or in tubular pho-tobioreactors (Chini Zittelli et al. 1999).
In the present study we explored the photosyntheticbehaviour in 2 optically different outdoor culture sys-tems: a high rate algal pond (HRAP) and a flat panelphotobioreactor (FPP). Both systems differ significantlywith respect to the optical conditions experienced bythe algae. In the HRAP, the high biomass density in theculture creates a steep light gradient where the algaecirculate from the surface, with high irradiance, to thebottom of the pond with low irradiance. Although themaximum irradiance experienced might be high, theaverage irradiance is limited. In an FPP, the light pathis often restricted to several centimetres, meaning thatthe average irradiance is higher than in the HRAP. Wewere especially interested in the photophysiologicalacclimation pattern under various optical conditions.The results presented here focused on characterisingthe normal diurnal fluctuations in physiological perfor-mance of the 2 culture types, which acclimate to differ-ent irradiance regimes and other physicochemical fea-tures experienced in the FPP and HRAP. In anaccompanying paper (Sukenik et al. 2009, this SpecialIssue) we studied the photosynthetic responses ofalgae using chlorophyll fluorescence methods underhigh irradiance conditions.
MATERIALS AND METHODS
Algal mass production systems. Two outdoor massalgal production cultures systems were employed forcultivation of the microalga Nannochloropsis (Fig. 1).The HRAP was a concrete raceway with a surface areaof 60 m2, equipped with a paddle wheel (Sukenik et al.
1993), and where the depth of the culture was main-tained at 35 cm. To avoid pH shifts in the dense cul-ture, CO2 was supplied through a solenoid valve acti-vated by a pH controller set to pH 7.8. The culture wasdiluted daily by replacing 10% of the pond volumewith fresh medium. Estimated daily evaporation wascompensated for with domestic tap water. The culturemedium consisted of 70% seawater and 30% tap waterto provide a salinity of 28, and the medium wasenriched with 2 mM (NH4)2SO4, 0.2 mM H3PO4 and0.02 mM Fe2(SO4)3. The HRAP was operated continu-ously for 4 wk before measurements were taken.
The FPP comprised a metal frame that held a 100 lflat plastic bag, 5 cm wide, 200 cm long and 100 cmhigh (Fig. 1). The Nannochloropsis culture from theHRAP was used to inoculate the FPP 1 wk before themeasurements started. Either air (Days 1 and 2) orCO2-enriched air (ca. 0.5% CO2, Day 3) was bubbledthrough the culture at the rate of 5 l min–1 to maintain
2
Fig. 1. (A) The flat panel photobioreactor (FPP), constructedof a metal net supporting a flat plastic bag of 5 cm depth. (B)The high rate algal pond (HRAP), constructed of concrete
channels with circulation provided by a paddle wheel
Kromkamp et al.: Photosynthetic performance in mass cultures
high turbulence and keep the pH in a range between7.5 and 8.2. The culture pH and temperature weremonitored continuously. Seawater was circulated in‘cooling fingers’ immersed in the culture to maintainphysiological temperature in the FPP culture.
The study was carried out at the National Maricul-ture Center (NCM) Israel Oceanographic and Limno-logical Research, Eilat, Israel, for 3 consecutive daysfrom 1 to 3 April 2008.
Chlorophyll and cell concentrations. Collected cul-tures were sub-sampled to measure pigment concen-tration, cell concentration and algal biomass. Photo-synthetic pigments were extracted by homogenizingsamples in 90% acetone, then filtered through glassfibre filters and measured using a DW-2a spectropho-tometer (Aminco). Chlorophyll a (chl a) and carotenoidconcentrations were calculated (Lichtenthaler 1987).Cell number was counted with a haemocytometer. Bio-mass dry weight (DW) was estimated by filtering aknown volume of culture through a pre-dried and pre-weighed glass fibre filter (GF/C, Whatman) and thendrying the filter for 1 h at 110°C.
Other biochemical parameters. Absorption coeffi-cients of the cells were measured using the Shibatatechnique (Shibata et al. 1954) with standard white A4copy paper as a light diffuser and a UVmin 1240 visibleUV light (UV/VIS) spectrophotometer (Shimadzu).Absorption (cm–1) was divided by the chl a concentra-tion, converted to natural log values and expressed permeter to obtain the standard optical cross sections (m2
mg–1 chl a).Incident solar radiation was measured with a pyra-
nometer (Li-Cor) every 5 min and stored in a data log-ger (Li-Cor 1000) assuming that 1 W m–2 equals4.5 µmol photons m–2 s–1 and that photosynthetically ac-tive radiation (PAR) is 40% of the total solar irradiance.
Photosynthetic measurements. Dual pulse ampli-tude modulation (PAM): The dual PAM fluorometer(Walz) measures the Photosystem II (PSII) efficiencysimultaneously with the absorption changes of Photo-system I (PSI) using the pulse modulation principle inthe dual wavelength approach (Klughammer &Schreiber 2008). We used this instrument to carry outrapid light curves (RLC) of photosynthetic electrontransport rates as a function of irradiance. Sampleswere concentrated ~10-fold by centrifugation (6 min at2900 × g). Sample handling was performed in dim lightwithin 15 to 20 min, which means that all RLCs wereperformed with the dark-adapted samples, and thatthe measured RLCs were likely to measure potentialphotosynthetic activity (White & Critchley 1999). Threereplicate RLCs were measured under increasingactinic light intensities lasting 30 s each. PSII electrontransport rates (ETR) were calculated as relative ratesby multiplying the irradiance (E) with the effective
quantum efficiency (ΔF/Fm’), i.e. rETR = E × ΔF/Fm’).ΔF equals the maximum fluorescence measured atirradiance E(Fm’) minus the steady state fluorescennceF. All RLCs were fitted using the exponential model ofWebb et al. (1974).
We also measured RLCs on sub-samples immedi-ately withdrawn from the 2 culture systems using thewater pulse amplitude modulation, water PAM (Walz).As such, and in contrast to the dual PAM data, thesesamples had not been dark adapted before RLC mea-surements.
Flow-through water PAM: This is a highly sensitivechlorophyll fluorometer designed for continuouslymonitoring photosynthetic activity of phytoplanktonand algal suspensions. It consists of a waterproof mea-suring head covered by a flow-through chamber and isoperated in conjunction with the standard PAM controlunit via a personal computer with the Win Control soft-ware (Walz). The chamber is connected to a peristalticpump, which continuously pumped samples from thealgal photobioreactor into the waterproof measuringhead. Simulated in situ RLCs were acquired byrepeated measurements of fluorescence responses tosaturating flashes, followed by a 30 s illuminationperiod of actinic light at increasing intensities. Thisprocedure provided a series of photosynthetic fluores-cence yields (PFYs) as a function of the actinic lightintensity. Maximum PFY in the light-adapted statemeasured with the flow-through water PAM was cal-culated as: (Fm’ – Fo’)/Fm’ = Fv’/Fm’, where Fv’/Fm’ is themaximum efficiency of PSII and Fo’ is the minimal flu-orescence in the light-adapted state. Three replicatesRLC were measured for both production systems oneach sampling time. On several occasions, in situ vari-ations in PFY were followed by a series of repetitivesaturating pulses separated from each other by 2 to3 min.
Fluorescence induction curves: A portable fluorom-eter, the Aquapen AP 100 (Photon System Instru-ments), fitted with red light-emitting diodes (LEDs) toprovide saturating light intensity was used to followthe polyphasic rise of chl a fluorescence in both out-door cultures, the so-called Kautsky curve. Dark-adapted (10 min) samples were diluted to a final con-centration of about 200 mg biomass l–1 (about 3.5 mgchl l–1) and were placed in a 3 ml fluorescence cuvette,which was mounted in front of the detector while theilluminating red LEDs supplied high intensity lightfrom both sides, perpendicular to the detector. Rapidfluorescence induction curves were recorded in thetime range between 50 µs and 2 s from the onset of thesaturation light. At least 3 curves were recorded foreach sample and averaged. The fluorescence induc-tion curve rises from the minimum fluorescence Fo (O)to the maximum fluorescence Fm (P) via 2 inflection
3
Aquat Microb Ecol: Preprint, 2009
points, J and I, resulting in the well-known OIJP tran-sient, where O, J, I and P are inflection points on thefluorescence induction curve (e.g. Strasser et al. 1995).Vj or Vi are the chlorophyll fluorescence yields at thecorresponding points on the fluorescence inductioncurve. From the fluorescence levels at J (Fj) and I (Fi)the parameters Vj and Vi were calculated as follows:
Vj = (Fj – Fo)/(Fm – Fo) and Vi = (Fi – Fo)/ (Fm – Fo) (1)
Photosynthetic oxygen evolution: Photosynthesisand respiration rates in response to an irradiance levelwere measured as oxygen exchange with a Clark-typepolarographic oxygen electrode (model 5331, YellowSprings Instruments) while the illumination of the algalsample was provided by a light pipette (Brammer, Illu-minova) as described by Dubinsky et al. (1987) andmeasured by a LI-250A light meter connected to LI-190Quantum Sensor (Li COR). Samples collected from theHRAP or FPP were diluted twice with a fresh medium,placed into the incubation chamber (ca. 15 ml) andequilibrated to the chamber temperature (25°C) in thedark. After 20 min of dark incubation, the respirationrate was measured for 120 s. Net photosynthetic rateswere measured while the incubation chamber was illu-minated with a sequence of 9 irradiances (6, 44, 80,130, 166, 280, 350, 580 and 740 µmol photons m–2 s–1)provided by the light pipette. Each irradiance periodlasted for 120 s. The experiments were duplicated inmost cases. The calculations of the photosynthetic ratewere carried out with the average values of gross oxy-gen evolution during the light period except for thefirst few seconds of the transition between conditions.The P versus E equations and parameters (α, Pmax, Ek
and Ecom) were fitted using a hyperbolic tangent model(Platt & Jassby 1976).
RESULTS
Irradiance, temperature and pH
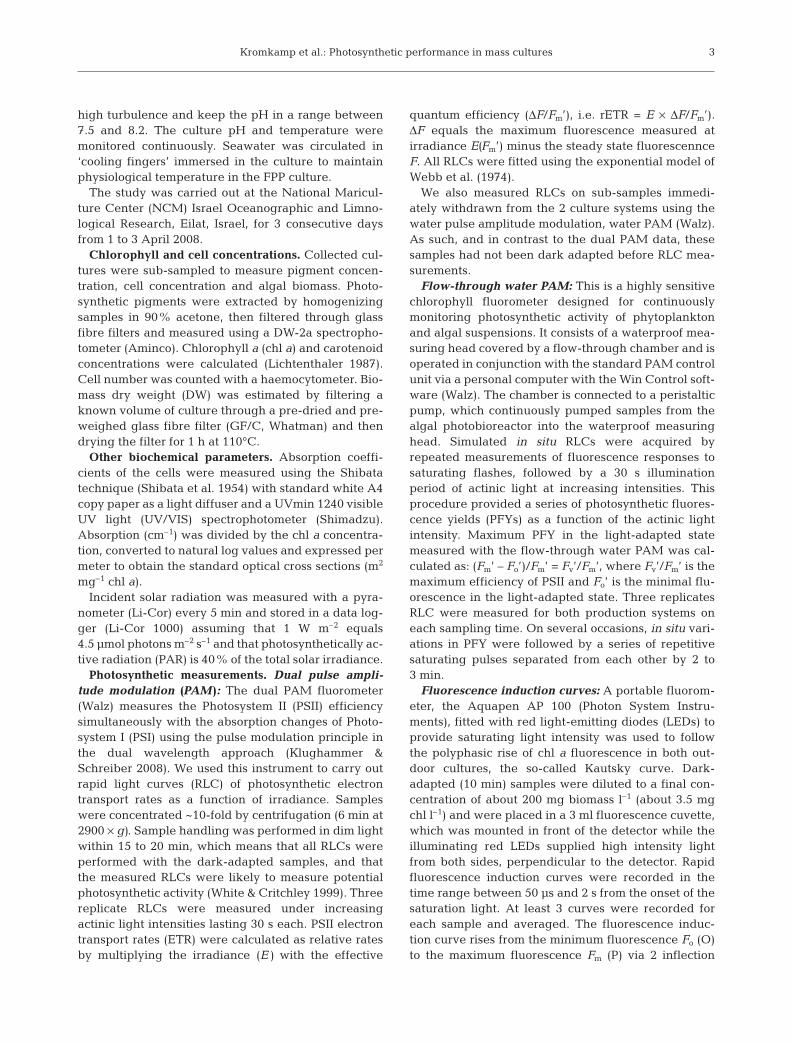
Changes in the physico-chemical environment in the2 culture systems are shown in Fig. 2 (pH and temper-ature) and Fig. 3 (incident photon flux). Incidentphoton flux during the experiment was similar on all3 d of the experiment, attaining maximal values of~2000 µmol photons m–2 s–1 at around 13:00 h (Fig. 3).In concert with the increasing solar irradiance, thetemperature in both systems increased during the day,peaking after 15:00 h. However, daily changes in tem-perature were not as marked for the HRAP as theywere for the FPP (Fig. 2), which reached a high supra-optimum value of 41°C on 3 April when the coolingcapacity was insufficient. Similarly, the pH changes ofthe culture were not as dramatic in the HRAP; they
increased from pH 7 in the morning to pH 8.3 in theafternoon, and returned to pH 7 in the late evening.However, without CO2 control, as was exercised onDay 2, pH rose considerably in the FPP, attaining val-ues of 10 whereas on Day 3 the pH was kept constantat pH 8 (Fig. 2).
Although we could not measure the diffuse lightattenuation coefficient (kd) we tried to estimate the
4
A: FPP
0
10
20
30
40
1 April2 April3 April
B: HRAP
0
10
20
30
40
C: FPP
Time of day (h)
pH
Tem
per
atur
e (°
C)
00:00 06:00 12:00 18:000
5
6
7
8
9
10
11 D: HRAP
00:00 06:00 12:00 18:000
5
6
7
8
9
10
11
Fig. 2. Changes in (A,B) temperature and (C,D) pH for the flatpanel photobioreactor (FPP; A,C) and the high rate algal pond(HRAP; B,D). Changes in operation of the FPP (CO2 on/off on
3 April) are indicated by the arrows
Date (d/mo)
Chl a
(m
g l–
1)
Irra
dia
nce (µm
ol p
ho
tons
m–2
s–1
)
To
tal c
aro
teno
ids
(mg
l–1)
2/4 3/4 4/40
2
4
6
0
500
1000
1500
2000
2500
0
1
2
3
Chl a FPPChl a HRAPPARCar FPPCar HRAP
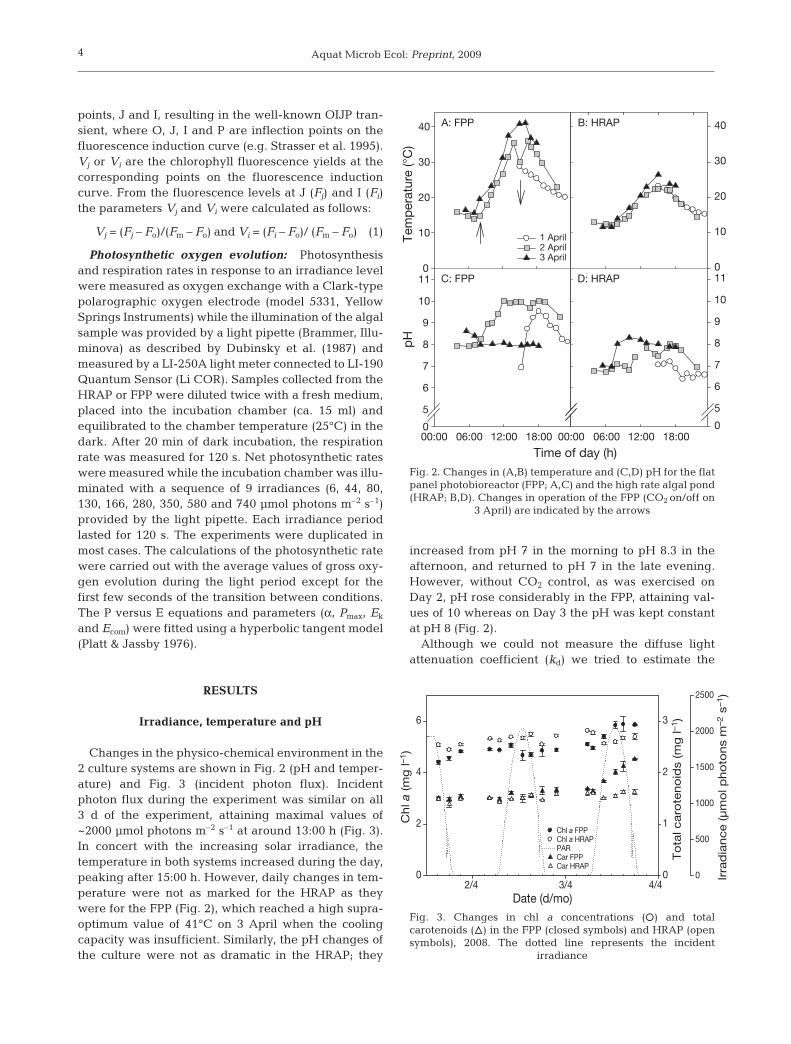
Fig. 3. Changes in chl a concentrations (s) and totalcarotenoids (n) in the FPP (closed symbols) and HRAP (opensymbols), 2008. The dotted line represents the incident
irradiance
Kromkamp et al.: Photosynthetic performance in mass cultures
average irradiance in the HRAP and FPP. From a massculture of Nannochloropsis with a chl a content per cellsimilar to that of the HRAP culture, a kd of 66.5 m–1 wasmeasured at a cell density of 57 × 106 cells ml–1 (J. C.Kromkamp & F. van Hoogstraten unpubl.). Using thedata from Table 1 we calculated kd values of 51.4 and124 m–1 in the HRAP and FPP, respectively. For the FPPculture this might be an overestimation because of thelower cellular chl a content. As the daily average irra-diance was 1130 µmol photons m–2 s–1 we calculated anaverage daily irradiance of 93 µmol photons m–2 s–1 inthe HRAP and 222 µmol photons m–2 s–1 in the FPP.This calculation was done assuming a path length of35 cm for the HRAP and 5 cm for the FPP. These pathlengths might increase with changing sun angle. How-ever, because the cell densities were so high, a diffuselight gradient will develop quickly making the angle ofthe sun less important.
Light climate, biomass and pigmentation
Both cultures showed an increase in the chl a con-centration with time (Fig. 3). According to the NationalMariculture Center (NCM), on which premises we per-formed our experiments, the HRAP had a dilution rateof 0.1 d–1. From this and the change in chl a concentra-tion we calculated the specific growth rate in this cul-ture during the measuring period as 0.13 ± 0.013 d–1
(mean ± SE). How precise this value is depends on theaccuracy of the water addition to compensate for theevaporation.
The FPP showed a higher daily rate of increase in chla (Fig. 3), but this was partly due to the fact that onDay 1 and Day 3 there was no dilution in the system
and the calculated growth rate for those periodsequalled approximately 0.20 d–1. On Day 2, the culturewas diluted by ~15% accounting for the smallerabsolute changes in chl a l–1 shown in Fig. 3 at thistime. The overall growth rate in the FPP equalled0.17 ± 0.019 d–1. As the 95% confidence intervals over-lapped, we could thus not conclude that these growthrates were significantly different.
DW and cell number showed more variation than thechl a content and did not show a significant changeduring the 3 d measuring period (Tables 1 & 2). Onlythe slight DW increase in the HRAP was significant(ANOVA, p < 0.01). Although the chl a concentrationshardly differed between both systems, the DW of theFPP was much higher (0.56 g l–1) than that of the HRAP(0.23 g l–1). The cell concentrations were also twice ashigh in the FPP than in the HRAP. As a result the chla/DW (w/w) ratio was 2.5 times higher in the HRAPthan in the FPP (Table 2). This result suggests a greatershade-adaptation by the HRAP culture compared withthe FPP culture, reflecting the greater degree of lightattenuation in the deeper culture and consequentlonger optical light path. The DW per cell in the FPPwas 32% higher than that in the HRAP. We do notknow whether this is due to a higher concentration ofprotein, fatty acids/lipids or carbohydrates. The maxi-mal photosynthetic rates per cell based on oxygenexchange (but not per unit chlorophyll, see Fig. 7)were higher in the FPP than in the HRAP, suggestingthat Rubisco levels (and hence protein) might havebeen higher in the former cultures.
Total carotenoids were about 15% higher in the FPPthan in the HRAP, and the carotenoids/chl a ratio wasalso higher (0.32 and 0.27 for the FPP and HRAP, respec-tively). However, the total carotenoids per cell were 75%
higher in the HRAP cells than in theFPP cells, in accordance with itsshade-acclimated pattern. Because noHPLC data were available we cannotcomment on the composition of thelight-harvesting versus the protectivecarotenoids. On Day 3, the carotenoidsshowed a marked increase in the FPP,most probably as a result of the stressfulconditions imposed by the suboptimaltemperatures during that day (Fig. 2).Also the carotenoid/chl a ratio in-creased from 0.33 to 0.40, indicating astress response.
Absorption cross section
The optical absorption cross section(a*) of the Nannochlorpsis cells in the
5
Culture Carotenoids Chl a Cells DW Carotenoids:system (mg l–1) (mg l–1) (× 106 ml–1) (mg l–1) chl a ratio
Table 2. Average (±SE) dry weight (DW), cell number and pigment content perbiomass unit (DW or cell) during the 3 d measuring period
Aquat Microb Ecol: Preprint, 2009
FPP decreased from 0.0090 m2 mg–1 chl ameasured in the evening of 1 April to0.0077 m2 mg–1 chl a at 10:00 h on Day 3.This is higher than the a* of 0.0068 m2
mg–1 chl a of the algal cells in the HRAP(Table 3). This was expected because theHRAP cells had a higher chl a contentper cell. Hence, the shade adaptationpattern of the HRAP cells caused ahigher degree of pigment packaging.Interestingly, on 3 April a* of the FPPcells increased from 0.0077 at 10:00 h to0.0082 m2 mg–1 chl a several hours later.Most probably, this was due to the induc-tion of carotenoid synthesis on this day(which increased from 1.14 at 07:00 h to1.39 mg l–1 at 13:00 h). These values of a*are at the low end of the range of naturalvariability, reflecting the cultured organ-ism’s already small size of a* and proba-bly low degree of packaging.
Photosynthetic performance
Photosynthetic characteristicsmeasured by the water PAM and the
dual PAM
For both the water PAM and the dualPAM measurements, we observed thatthe culture in the HRAP had significantlylower relative photosynthetic electrontransport (rETRmax) values than those inthe FPP (Fig. 4). The HRAP culture alsoshowed less variation during the experi-mental period. Such reductions in maxi-mal rates of photosynthesis are consistent with agreater degree of shade adaptation in the HRAP(Richardson et al. 1983). The rETRmax in the FPP wasstrongly depressed during the afternoon on Day 2, pos-sibly due to CO2 depletion. This was both visible withand without dark acclimation, although the water PAMdata (i.e. no dark acclimation) showed a much larger
decrease in rETRmax. The high irradiance was not themain factor for the depression, which can be deducedfrom the comparison between the 16:00 h samples onDay 1 (e.g. water PAM: rETRmax = 155 relative units[r.u.]) and Day 2 (rETRmax = 72 r.u.). The pH stat experi-ment on Day 3, in which we kept the pH constant, wasparalleled by the supra-optimum temperature (see ac-companying paper by Sukenik et al. 2009). This exces-sively high temperature clearly induced an even largerdecrease in rETRmax measured by both techniques atmid-day than observed the previous day. In any case, atnight the difference in rETRmax between the 2 cultureswas diminished and according to expectations both wa-ter PAM and dual PAM measured similar rETRmax val-ues (except in the early night on 3 April in the HRAP).Also, the values of rETRmax at night are relatively lowdue to the well-known downregulation of enzyme ac-tivity during the darkness, which was especially strong
6
Date Time of day (h) FPP HRAP
1 April 08 20:00 0.0090 0.006.73 April 08 10:00 0.0077 nd3 April 08 12:00 0.0082 0.0068
Table 3. Absorption cross sections (m2 mg–1 chl a) of theNannochloropsis cultures in the 2 mass culture systems. nd:no data. FFP: flat panel photobioreactor; HRAP: high rate
algal pond
A: FPP
0
100
200
300
400
500WaterPAMPARDualPAM
B: HRAP
0
500
1000
PA
RP
AR
α ETR
(r.u
.)rE
TRm
ax (r
.u.)
1500
2000
2500WaterPAMPARDualPAM
C: FPP
2/4 3/40.0
0.2
0.4
0.6
0.8
1.0
WaterPAMPARDualPAM
D: HRAP
2/4
Date (d/mo)3/4
0
500
1000
1500
2000
WaterPAMPARDualPAM
Fig. 4. Changes in (A,B) rETRmax and (C,D) light harvesting efficiency (αETR)over the experimental period in 2008 in (A,C) flat panel photobioreactor (FPP)and (B,D) high rate algal pond (HRAP) cultures as determined using the waterpulse amplitude modulation (PAM) and the dual PAM. Incident irradiance is
plotted as a dotted line
Kromkamp et al.: Photosynthetic performance in mass cultures
in the FPP culture (Fig. 4A). Note that the water PAM-derived rETRmax values were higher during the morn-ing and evening periods than were the dual PAM-de-rived ETRmax values, whereas at night they weresimilar. This suggests that downregulation of enzymeactivity already started during the 20 to 30 min dark ac-climation time used for the dual PAM measurements.
Water PAM alpha values based on the RLC measure-ments were significantly decreased around mid-day/early afternoon in both FPP and HRAP cultures(Fig. 4). The variability in the dual PAM αETR valueswas much less pronounced. However, in contrast to therETRmax values, αETR of the water PAM samples wasnot different between the 2 culture systems (ANOVA,p = 0.63). Although the average values measured afterdark adaptation (dual PAM) of the FPP and HRAP val-ues were similar (0.73 and 0.79, respectively) the smalldifference was significant (ANOVA, p < 0.01). Com-paring the nightly αETR values between the dual PAMand water PAM is difficult because the values dependon the accuracy of the calibration of the internal lightsources of the PAMs. As we could not perform an inter-calibration we cannot say whether the differencesmeasured during the night were significant. However,the increase in αETR during the 2nd night measuredwith the water PAM was not evident with the dualPAM. At present we cannot explain this.
The light saturation parameter Ek (= rETRmax/αETR) ofthe FPP was substantially higher than Ek of the cells inthe HRAP. This was observed both for the water PAMmeasurements (values averaged 466 versus 264 µmolphotons m–2 s–1 for the FPP and HRAP, respectively)and the dual PAM measurements (261 versus 162 µmolphotons m–2 s–1 for the FPP and HRAP, respectively).This again clearly demonstrates shade adaptation ofthe HRAP cells and light acclimation of the FPP cells.
Dual PAM Fv/Fm data
The maximum PSII quantum efficiency (Fv/Fm) mea-sured after 15 to 20 min of darkness adaptation clearlyrevealed a decrease at early afternoon followed by arecovery in the evening (Fig. 5); between 18:00 and19:30 h, Fv/Fm fully recovered. It can be expectedthat dynamic downregulation of non-photochemicalquenching (NPQ) will relax if it is due to the xantho-phyll cycle only. This was not the case and this sug-gests the existence of long-lived quenchers, most prob-ably caused by photodamage to PSII, corroborated bythe observed PSII heterogeneity or QB-non-reducingPSII centres (see next section for explanation). On thefirst 2 d of the experiments the difference in Fv/Fm
between the FPP and HRAP samples was not signifi-cant, suggesting the CO2 depletion in the FPP on Day 2
did not influence Fv/Fm. However, the rise in tempera-ture on Day 3 in the FPP caused a large decrease inFv/Fm (0.38), although at 18:00 h Fv/Fm showed a trendof recovery (0.58).
The chl a fluorescence induction kinetics
The rapid chl a fluorescence induction kinetics of alloxygenic photosynthetic organisms show a polyphasicrise (chl a fluorescence transient) between the initial(Fo) and the maximum (Fm) fluorescence during thefirst second of illumination (Neubauer & Schreiber1987). These phases have been designated as O, J, Iand P, and can be visualized using a logarithmic timescale (Strasser et al. 1995). The current understandingof the OJIP transient rise is that it reflects the filling up(i.e. reduction) of the electron acceptor pool (phaeo-phytine (Ph), QA, QB and PQ pool) of PSII in a 4-photonprocess (Strasser et al. 2004, Lazár 2006). The inflec-tion J (2 ms) represents the double reduction of elec-tron carriers Ph, QA and QB, and, perhaps because of alimitation in electron acceptance by QB, this step usu-ally occurs when cells are exposed to excessive lightthat increases the degree of reduction of the PQ pool,while the I-step (30 ms) is connected to a 3-electronreduction in the PSII electron carriers to differentredox states (e.g. Ph QA
– QB2–, Ph– QA QB
2– or Ph– QA–
QB) of the reaction centre complex, which reduces thePQ pool (Lazár 2006). The I-step probably reflects theheterogeneity of the PQ pool, with fast-reducing andslow-reducing PSII centres. Hence, slow reaction cen-tres may provide a mechanism for quenching exces-sive energy (Strasser et al. 1995). The drop in theinduction curve of microalgal cells beyond the P-stepindicates that the PQ pool is being re-oxidized due to
7
Date (d/mo)
F v/F
m
Irra
dia
nce
(µm
ol p
hoto
ns m
–2 s
–1)
2/4 3/4 4/40.0
0.2
0.4
0.6
0.8
0
500
1000
1500
2000
2500
FPPHRAPPAR
Fig. 5. Fv/Fm values of the flat panel photobioreactor (FPP) andhigh rate algal pond (HRAP) measured during the experimen-tal period in 2008 using the dual pulse amplitude modulation
(PAM). Incident irradiance is plotted as a dotted line
Aquat Microb Ecol: Preprint, 2009
the demand of reducing equivalents from the Calvin-Benson cycle. Thus, the ‘JIP’ test can be used as a rapidmonitor of photosynthetic activity, including the effectsof various stressors on this process.
The Aquapen AP100 was applied to record fluores-cence induction curves in Nannochloropsis samples col-lected from the FPP and HRAP on 3 d of measurements.
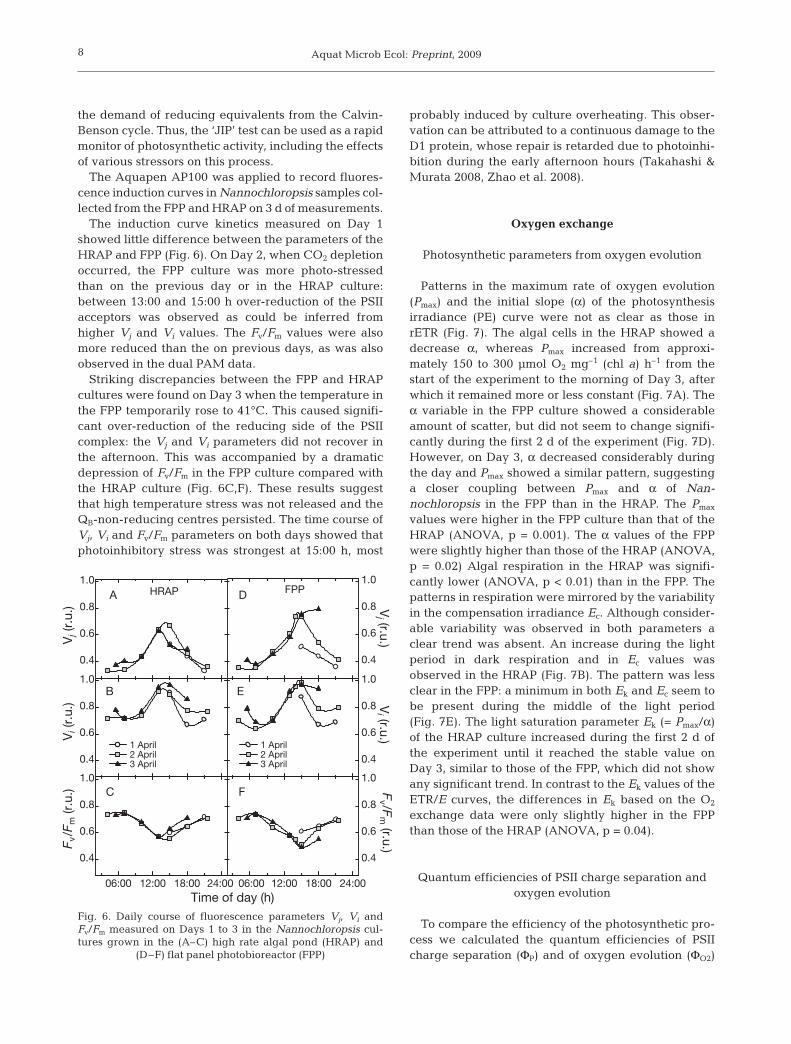
The induction curve kinetics measured on Day 1showed little difference between the parameters of theHRAP and FPP (Fig. 6). On Day 2, when CO2 depletionoccurred, the FPP culture was more photo-stressedthan on the previous day or in the HRAP culture:between 13:00 and 15:00 h over-reduction of the PSIIacceptors was observed as could be inferred fromhigher Vj and Vi values. The Fv/Fm values were alsomore reduced than the on previous days, as was alsoobserved in the dual PAM data.
Striking discrepancies between the FPP and HRAPcultures were found on Day 3 when the temperature inthe FPP temporarily rose to 41°C. This caused signifi-cant over-reduction of the reducing side of the PSIIcomplex: the Vj and Vi parameters did not recover inthe afternoon. This was accompanied by a dramaticdepression of Fv/Fm in the FPP culture compared withthe HRAP culture (Fig. 6C,F). These results suggestthat high temperature stress was not released and theQB-non-reducing centres persisted. The time course ofVj, Vi and Fv/Fm parameters on both days showed thatphotoinhibitory stress was strongest at 15:00 h, most
probably induced by culture overheating. This obser-vation can be attributed to a continuous damage to theD1 protein, whose repair is retarded due to photoinhi-bition during the early afternoon hours (Takahashi &Murata 2008, Zhao et al. 2008).
Oxygen exchange
Photosynthetic parameters from oxygen evolution
Patterns in the maximum rate of oxygen evolution(Pmax) and the initial slope (α) of the photosynthesisirradiance (PE) curve were not as clear as those inrETR (Fig. 7). The algal cells in the HRAP showed adecrease α, whereas Pmax increased from approxi-mately 150 to 300 µmol O2 mg–1 (chl a) h–1 from thestart of the experiment to the morning of Day 3, afterwhich it remained more or less constant (Fig. 7A). Theα variable in the FPP culture showed a considerableamount of scatter, but did not seem to change signifi-cantly during the first 2 d of the experiment (Fig. 7D).However, on Day 3, α decreased considerably duringthe day and Pmax showed a similar pattern, suggestinga closer coupling between Pmax and α of Nan-nochloropsis in the FPP than in the HRAP. The Pmax
values were higher in the FPP culture than that of theHRAP (ANOVA, p = 0.001). The α values of the FPPwere slightly higher than those of the HRAP (ANOVA,p = 0.02) Algal respiration in the HRAP was signifi-cantly lower (ANOVA, p < 0.01) than in the FPP. Thepatterns in respiration were mirrored by the variabilityin the compensation irradiance Ec. Although consider-able variability was observed in both parameters aclear trend was absent. An increase during the lightperiod in dark respiration and in Ec values wasobserved in the HRAP (Fig. 7B). The pattern was lessclear in the FPP: a minimum in both Ek and Ec seem tobe present during the middle of the light period(Fig. 7E). The light saturation parameter Ek (= Pmax/α)of the HRAP culture increased during the first 2 d ofthe experiment until it reached the stable value onDay 3, similar to those of the FPP, which did not showany significant trend. In contrast to the Ek values of theETR/E curves, the differences in Ek based on the O2
exchange data were only slightly higher in the FPPthan those of the HRAP (ANOVA, p = 0.04).
Quantum efficiencies of PSII charge separation andoxygen evolution
To compare the efficiency of the photosynthetic pro-cess we calculated the quantum efficiencies of PSIIcharge separation (ΦP) and of oxygen evolution (ΦO2)
8
0.4
0.6
0.8
1.0FPP
06:00 12:00 18:00 24:00
0.4
0.6
0.8
1.0
0.4
0.6
0.8
1.0
1 April2 April3 April
0.4
0.6
0.8
1.0HRAP
Time of day (h)
Vj (
r.u.
)V
i (r.
u.)
F v/F
m (r
.u.)
Vj (r.u.)
Vi (r.u.)
Fv /F
m (r.u.)
06:00 12:00 18:00 24:00
0.4
0.6
0.8
1.0
0.4
0.6
0.8
1.0
1 April2 April3 April
A
B
C
D
E
F
Fig. 6. Daily course of fluorescence parameters Vj, Vi andFv/Fm measured on Days 1 to 3 in the Nannochloropsis cul-tures grown in the (A–C) high rate algal pond (HRAP) and
(D–F) flat panel photobioreactor (FPP)
Kromkamp et al.: Photosynthetic performance in mass cultures
as follows, ignoring spectral differences between thelight sources, which might influence the data:
Φ = Pmax/(a* × E), (2)
where Pmax is the maximum rate of oxygen evolution orabsolute ETR. Absolute ETR was calculated as:
ETR = E × ΔF/Fm’ × a* × FII, (3)
where FII is the ratio of the optical absorption cross sec-tion of PSII relative to the total absorption cross section
(Kromkamp & Forster 2003); it is often assumed thatboth the PSI and PSII antenna absorb 50% of the light(Gilbert et al. 2000). According to Suggett et al. (2004)FII varies between 0.5 and 0.6 for most taxa, and for thepurpose of our calculations we assumed that FII
equalled 0.5. Subsequently, we plotted ΦO2 as a func-tion of ΦP of the HRAP cells (Fig. 8). The plots show alinear relationship between both quantum efficiencies,demonstrating a tight coupling between the differentprocesses in the light reactions of photosynthesis. The
9
A: HRAP
0.0
0.5
1.0
1.5
2.0
2.5
3.0α
Res
pira
tion
Ek
Ek
Res
pira
tion
Pm
ax
Pm
ax
Ec
Ec
α
0
200
400
600
800
αPmax
0
2
4
6
8
10
0
10
20
30
40
50
60
RespirationEc
12:00:00 0:00:00 12:00:00 0:00:00 12:00:00
Time of day (h) Time of day (h)
0
50
100
150
200
250
B: HRAP
C: HRAP
D: FPP
0.0
0.5
1.0
1.5
2.0
2.5
3.0
3.5
0
200
400
600
800
αPmax
0
2
4
6
8
10
0
10
20
30
40
50
60
RespirationEc
E: FPP
12:00:00 0:00:00 12:00:00 0:00:00 12:00:000
50
100
150
200
250
F: FPP
Fig. 7. Photosynthetic parameters, as determined by oxygen exchange measurements, of Nannochloropsis grown in the high ratealgal pond (HRAP) (A–C) or flat panel photobioreactor (FPP) (D–F). Pmax: µmol O2 mg (chl a)–1 h–1; respiration: nmol O2 cell–1 h–1;Ec, Ek: µmol photons m–2 s–1; α: µmol O2 (mg chl a)–1 h–1 (µmol photons m–2 s–1)–1. The day/night period is given at the top of the
panels as a light/dark bar
Aquat Microb Ecol: Preprint, 2009
slopes of the lines give the conversion factor needed toconvert ETR into rates of oxygen evolution, and are thereciprocal of the quantum requirement for charge sep-arations in PSII. The values on 2 and 3 April are abovethe dashed line, which indicates the relationship when5 absorbed photons are needed to produce a moleculeof oxygen in PSII. Although the Z-scheme of photosyn-thesis requires 4 absorbed photons for PSII and 4 for
PSI, the minimum quantum requirement (QR) is likelyto be closer to 10 (Mauzerall & Greenbaum 1989). Thevalues above the dashed line indicate a quantumrequirement less than 5, and in all instances this seemsto be the case, which is contradictory to our expecta-tions. For the HRAP the lines at 7:00, 13:30 and 21:30 hon 2 April are identical, but the lines of the 2nd half ofthe afternoon move upwards, indicating a decrease in
10
A: HRAP - 2 April
ΦP (mol e– (mol photons)–1)
ΦO
2 (m
ol O
2 (m
ol p
hoto
ns)–1
)
ΦO
2 (m
ol O
2 (m
ol p
hoto
ns)–1
)
0.00 0.05 0.10 0.15 0.200.00
0.02
0.04
0.06
0.08
0.10
0.12
7:00h13:30h15:00h18:00h21:30h
B: HRAP - 3 April
0.00 0.05 0.10 0.15 0.20 0.250.00
0.02
0.04
0.06
0.08
0.10
7:00h13:30h15:00h18:00h
Fig. 8. Quantum efficiencies of oxygen evolution (ΦO2) plotted as a function of the quantum efficiencies of Photosystem II chargeseparation (ΦP) of the Nannochloropsis cells in the high rate algal pond (HRAP) on 2 April (A) and 3 April (B). The dotted line
represents the line assuming 5 absorbed photons are needed to produce a molecule of O2 by PSII
A: FPP - 2 April
0.00 0.05 0.10 0.15 0.200.00
0.02
0.04
0.06
0.08
0.10
0.12
7:00h10:00h13:30h15:00h18:00h21:30h
B: FPP - 3 April
0.00 0.05 0.10 0.15 0.200.00
0.02
0.04
0.06
0.08
0.10
7:00h10:00h13:30h15:00h18:00h
ΦP (mol e– (mol photons)–1)
ΦO
2 (m
ol O
2 (m
ol p
hoto
ns)–1
)
ΦO
2 (m
ol O
2 (m
ol p
hoto
ns)–1
)
Fig. 9. Quantum efficiencies of oxygen evolution (ΦO2) plotted as a function of the quantum efficiencies of Photosystem II chargeseparation (ΦP) of the Nannochloropsis cells in the FPP on 2 April (A) and 3 April (B). The dotted line represents the line assuming
10 absorbed photons are needed to produce a molecule of O2 by PSII
Kromkamp et al.: Photosynthetic performance in mass cultures
the quantum requirement. On 3 April the lines werecloser together, indicating less variability in the quan-tum requirements during the day.
The QR of the cells in the FPP also showed QR belowthe minimum of 5 absorbed photons per molecule of O2
for PSII (Fig. 9), as all values were above the dashedline. Some non-linearity was also observed, especiallyin the 10:00 h sample on 2 April. This was caused by alarge discrepancy between the Ek of ETR (425 µmolphotons m–2 s–1) and the Ek of O2 evolution (181 µmolphotons m–2 s–1). Like the situation observed for theHRAP the variability in the relationship showed morevariation on 2 April than on 3 April, when all relation-ships showed good reproducibility as all lines weresimilar, with the exception of the 18:00 h sample. Therelationship between ΦP and ΦO2 approached 1:1 lineindicating a quantum requirement of 5 absorbed pho-tons per O2 molecule produced.
To further evaluate the slopes we plotted the recipro-cal slopes (the QR) in Fig. 10. As mentioned above, allQR for PSII are below the minimum of 5, with the pos-sible exception of the last FPP sample. In both theHRAP and FPP no clear pattern could be distinguished,although substantial variation in QR was observed.The increase in QR of the last measurement at 18:00 hin the FPP on 3 April is clearly visible. Despite the dif-ferent optical conditions the QR of HRAP did not differsignificantly (ANOVA, p = 0.37).
DISCUSSION
Environmental (stress) conditions
Due to the pond’s larger volume compared with theFPP, the environmental changes were less in the HRAPpond where temperature fluctuations were smaller
than 15°C and pH changes did not exceed 2 pH units,which is still considerable. However, temperature fluc-tuations in the FPP were much larger, with tempera-tures reaching higher than 40°C on 3 April due to theabsence of wind and an insufficient cooling capacityinside the FPP. Without pH control the pH fluctuatednearly 3 pH units, and the unusually high pH of 10 onDay 2 resulted in CO2 depletion as could be inferredfrom the photosynthesis parameters. Hence, despitethe more constant optical conditions in the FPP, otherenvironmental parameters were more variable.
Biomass development and pigment content
The average irradiance in the HRAP and FPP wasestimated to be 93 and 222 µmol photons m–2 s–1,respectively. As the cells in the FPP contained lesschlorophyll than the cells used to estimate kd, the aver-age irradiance might have been a little higher. How-ever, because the FPP was situated vertically the aver-age irradiance of 222 µmol photons m–2 s–1 can beconsidered a maximum estimate as it will be influ-enced by the changing sun angle, which will increasepath length. However, with so many cells the light fieldwill become diffuse quickly, lessening the influence ofa varying sun angle on the light path length. Despitethe difference in average irradiance, the overall calcu-lated growth rates for the HRAP culture was only a lit-tle lower (0.13 d–1) than growth rate in the FPP(0.17 d–1), and this difference was not significant.
Despite the similar pigment concentration, biomass(both as cell concentration or as DW) was approxi-mately twice as high in the FPP than in the HRAP. Dueto the higher irradiance the cells had a lower chl a andcarotenoid content, but a higher DW content per cell.Hence, despite uncertainties in the average irradiance,the HRAP showed shade acclimation and the FPP cellsshowed high light acclimation. The differences in cel-lular pigment content were reflected in a higher opti-cal absorption cross section of the FPP cells, caused bya lower chl a and carotenoid content per cell and alesser degree of pigment packaging.
Because we did not perform HPLC analysis we can-not comment on the composition of the carotenoids,but the increase in the FPP in the carotenoid content asa result of the stressful temperature condition on Day 3make it likely that this will be the result of an increasein protective carotenoids.
Photosynthetic performance
In general, the HRAP cells showed less variability inphotosynthetic parameters (respiration and compensa-
11
12:00:00 0:00:00 12:00:00
Qua
ntum
req
uire
men
t PS
II
0:00:00
Time of day (h) 12:00:00 0:00:00
0
1
2
3
4
5HRAPFPP
1 April 2 April 3 April
Fig. 10. Quantum requirements for oxygen evolution (recipro-cal of slopes of Figs. 8 & 9). The day/night period is given at
the bottom of the panel as a light/dark bar
Aquat Microb Ecol: Preprint, 2009
tion irradiance excepted, which showed an increaseduring the light period) than did the FPP cells, whichshowed clear signs of a decrease in ETRmax and Pmax
during Day 2 when CO2 depletion occurred and duringthe high temperature stress conditions on Day 3. TheHRAP culture also showed a shade-adapted acclima-tion pattern compared with the high light acclimationpattern of the FPP, as evidenced by higher ETRmax, Ek
and respiration values and by lower cellular chl a con-tents of the latter mass culture.
The cells in the FPP experienced severe stress condi-tions during Day 3, caused by the combination of ahigh irradiance (which was the same as the previousday) and a high temperature in the afternoon of Day 3.The results indicate that the decrease in photosyn-thetic activity is caused both by dynamic downregula-tion, most probably mediated by the xanthophyll cycle,and photodamage as 20 min dark adaptation was notlong enough to relax NPQ, leading to lowered Fv/Fm
values (Figs. 5 & 6). No recovery was observed in the Vj
and Vi parameters, meaning that the QB non-reducingPSII centres persisted. The role of NPQ could also bedemonstrated by comparing the RLCs measured withand without dark adaptation. The decrease in rETRmax
was more pronounced in RLCs without dark adapta-tion and decreases in αETR were only visible in theRLCs without dark adaptation. Hence, the relaxationof NPQ during the dark adaptation period clearlyaffected the shape of the RLCs.
Despite the harsh conditions imposed by CO2 deple-tion on Day 2 and high temperature on Day 3, the pri-mary processes of the light reaction remained closelycoupled as we nearly always observed a linear rela-tionship between ΦP and ΦO2. A high excitation pres-sure, which might be amplified by PSII damage, mightinduce an uncoupling between PSII charge separationand net oxygen evolution. This uncoupling might becaused by cyclic electron transport around PSII (Prasilet al. 1996, Lavaud 2007) or by the induction of alterna-tive electron acceptors, especially the Mehler reaction,where donation of electrons by PSI via ferredoxin to O2
leads to the formation of hydrogen peroxide, which issubsequently converted back to water, leading to thewater–water cycle (Asada 2000). This type of non-lin-earity has been frequently observed (e.g. see Flamel-ing & Kromkamp 1998) and seems to occur more in cul-ture studies than in natural population studies (seePerkins et al. in press for a summary). Hence, in ourstudy the Mehler reaction does not lead to net oxygenproduction, and we would see this as a decrease in ΦP.This would cause a ‘downward non-linearity’ of theplots in Figs. 8 & 9, and this clearly is not observed.This is also clear from the plots of the QR (Fig. 10),where the QR did not show a clear response during thelight period in either the HRAP or FPP. The exception
is 18:00 h sample from the FPP, which showed a clearrise in the QR. Hence, despite the stressful conditions,the light reactions of the photosynthetic pathwayremain closely coupled and seem rather robust.
The calculated quantum requirements are below thetheoretical minimum of 4 absorbed photons requiredby PSII to produce 1 molecule of O2. This obviously isnot correct, and the easiest way to explain this is toassume that the antenna of PSII is larger than weassumed. Because we lack information on this weassumed that 50% of the light was absorbed by PSII(Gilbert et al. 2000), and this was corroborated by Sug-gett et al. (2004) who showed that for many algal taxathe fraction of light absorbed by PSII varied between50 and 60%, with the exception of cyanobacteria andthe pelagophyte Aureococcus anophagefferens,although they weighted the absorption for the blueexcitation light of the fast repetition rate fluorometer(FRRF). This is in contrast to the results obtained byJohnsen & Sakshaug (2007) who showed that FII aver-aged 0.72. Assuming this value, the QR of the FPPwould increase to 4.2 ± 0.7 and the QR of the HRAP to4.4 ± 0.8 mol absorbed photons per mol O2 produced.Thus, our computed QR requirements are too low mostprobably due to an underestimate of the true opticalabsorption cross section of PSII. In these calculationswe ignored the possible effect of spectral differencesbetween the red LED sources of the dual PAM and thehalogen light source of the light pipette. For both lightsources we calculated the fraction of the light that isabsorbed (the so-called PUR/PAR ratio where PUR isphotosynthetically usable radiation). Using a standardhalogen light source this ratio was 0.26 and for the sim-ulated red LED used by the PAM the PUR/PAR ratiowas remarkably similar (0.25). Hence, if we were tocorrect our estimates of the quantum efficiencies forthe spectral differences of the light sources this wouldnot affect our estimates of the quantum requirementsas the same spectral correction factor needs to beapplied.
As a result of the differences in photosynthetic per-formance and optical conditions experienced by thealga, the average biomass of FPP was about twice ashigh as that of the HRAP. The algae in the FPP also hada higher growth rate than those in the HRAP, althoughwith the present data we could not prove that thishigher growth rate was statistically significant. Thesedifferences were achieved with similar pigment con-centrations in both culture systems. So, if biomass isthe desired product the HRAP seems to be the methodof choice as the larger depth will more than offset thelower concentration, and using the data from Table 1the HRAP will yield 80 g m–2 whereas the FPP willyield 28 g m–2. As the systems were still growing thesewere minimum estimates. Also, the HRAP is less sensi-
12
Kromkamp et al.: Photosynthetic performance in mass cultures
tive to mechanical failure. If high quality products arepursued, the FPP might be the method of choice. TheFPP system is easier to manipulate with respect toproducts that are formed during special conditions.This can be exemplified in Fig. 3, where the tempera-ture stress conditions induced formation of specialcarotenoids.
Acknowledgements. This study was carried out during the8th International Workshop of the Group for Aquatic PrimaryProductivity (GAP) and the Batsheva de Rothschild Seminaron Gross and Net Primary Productivity held at the Interuni-versity Institute for Marine Sciences, Eilat, Israel, in April2008. We thank the Batsheva de Rothschild Foundation, BarIlan University, the Moshe Shilo Center for Marine Biogeo-chemistry and the staff of the Interuniversity Institute forfunding and logistic support. Skillful help and technical assis-tance was provided by E. Ben-David, the National Maricul-ture Center (NCM), Israel Oceanographic and LimnologicalResearch (IOLR). We thank M. Spiegel, M. Uhko and S.Bossibba for their generous support before and during thisstudy. Partial funding (J.M. and J.K.) was also provided byprojects MSM6007665808 and AV02 50200510 of the Ministryof Education Youth and Sports of the Czech Republic and bythe project A608170601 of the Czech Academy of Sciencesand project 521/09/0656 of the Czech Science Foundation.We thank 3 anonymous reviewers for their constructiveremarks. This is NIOO publication 4586.
LITERATURE CITED
Asada K (2000) The water-water cycle as alternative photonand electron sinks. Philos Trans R Soc Lond B Biol Sci355:1419–1431
Borowitzka M (1999) Commercial production of microalgae:ponds, tanks, tubes and fermenters. J Biotechnol 70:313–321
Chini Zittelli G, Lavista F, Bastianini A, Rodolfi L, VincenziniM, Tredici MR (1999) Production of eicosapentaenoic acidby Nannochloropsis sp. cultures in outdoor tubular photo-bioreactors. J Biotechnol 70:299–312
Dubinsky Z, Falkowski PG, Post AF, van Hes UM (1987) Asystem for measuring phytoplankton photosynthesis in adefined light field with an oxygen electrode. J PlanktonRes 9:607–612
Flameling IA, Kromkamp J (1998) Light dependence of quan-tum yields for PSII charge separation and oxygen evolu-tion in eucaryotic algae. Limnol Oceanogr 43:284–297
Gilbert M, Wilhelm C, Richter M (2000) Bio-optical modellingof oxygen evolution using in vivo fluorescence: compari-son of measured and calculated photosynthesis/irradiance(P-I) curves in four representative phytoplankton species.J Plant Physiol 157:307–314
Gonzalez C, Marciniak J, Villaverde S, Leon C, Garcia PA,Munoz R (2008) Efficient nutrient removal from swinemanure in a tubular biofilm photo-bioreactor using algae-bacteria consortia. Water Sci Technol 58:95–102
Gordon JM, Polle JEW (2007) Ultrahigh bioproductivity fromalgae. Appl Microbiol Biotechnol 76:969–975
Johnsen G, Sakshaug E (2007) Biooptical characteristics ofPSII and PSI in 33 species (13 pigment groups) of marinephytoplankton, and the relevance for pulse-amplitude-modulated and fast-repetition-rate fluorometry. J Phycol43:1236–1251
Klughammer C, Schreiber U (2008) Saturation pulse methodfor assessment of energy conversion in PSI. PAM ApplNotes 1:11–14
Kromkamp JC, Forster RM (2003) The use of variable fluo-rescence measurements in aquatic ecosystems: differ-ences between multiple and single turnover measuringprotocols and suggested terminology. Eur J Phycol 38:103–112
Lavaud J (2007) Fast regulation of photosynthesis in diatoms:mechanisms, evolution and ecophysiology. Funct Plant SciBiotechnol 1:267–287
Lazár D (2006) The polyphasic chlorophyll a fluorescence risemeasured under high intensity of exciting light. FunctPlant Biol 33:9–30
Lichtenthaler HK (1987) Chlorophylls and carotenoids, thepigments of photosynthetic biomembranes. In: Douce R,Packer L (eds) Methods in enzymology, Vol 148. AcademicPress, New York, p 350–382
Matthijs HCP, Balke H, VanHes UM, Kroon BMA, Mur LR,Binot RA (1996) Application of light-emitting diodes inbioreactors: flashing light effects and energy economy inalgal culture (Chlorella pyrenoidosa). Biotechnol Bioeng50:98–107
Mauzerall D, Greenbaum NL (1989) The absolute size of aphotosynthetic unit. Biochim Biophys Acta 974:119–140
Neubauer C, Schreiber U (1987) The polyphasic rise ofchlorophyll fluorescence upon onset of strong continuousillumination. I. Saturation characteristics and partial con-trol by the Photosystem II acceptor side. Z NaturforschSect C J Biosci 42:1246–1254
Nitsan Z, Mokady S, Sukenik A (1999) Enrichment of poultryproducts with Ω 3 fatty acids by dietary supplementationwith the alga Nannochloropsis and mantur oil. J AgricFood Chem 47:5127–5132
Perkins RG, Kromkamp JC, Serôdio J, Lavaud J and others (inpress) The application of variable chlorophyll fluores-cence to microphytobenthic biofilms. J Appl Phycol
Platt T, Jassby AD (1976) The relationship between photosyn-thesis and light for natural assemblages of coastal Mainephytoplankton. J Phycol 12:421–430
Prasil O, Kolber Z, Berry J, Falkowski PG (1996) Cyclic elec-tron flow around photosystem II in vivo. Photosynth Res48:395–410
Richardson K, Beardall J, Raven JA (1983) Adaptation of uni-cellular algae to irradiance: an analysis of strategies. NewPhytol 93:157–191
Shibata K, Benson AA, Calvin M (1954) The absorption spec-tra of suspensions of living micro-organisms. Biochim Bio-phys Acta 15:461–470
Strasser RJ, Srivastava A, Govindjee (1995) Polyphasicchlorophyll a fluorescence transient in plants and cyano-bacteria. Photochem Photobiol 61:33–42
Strasser RJ, Tsimili-Michael M, Srivastava A (2004) Analysisof the chlorophyll a fluorescence transient. In: Papageor-giou GC, Govindjee (eds) Chlorophyll a fluorescence: asignature of photosynthesis. Advances in photosynthesisand respiration, Vol 19. Springer, Dordrecht, p 321–362
Suggett DJ, MacIntyre HL, Geider RJ (2004) Evaluation ofbiophysical and optical determinations of light absorptionby photosystem II in phytoplankton. Limnol OceanogrMethods 2:316–332
Sukenik A (1999). Eicosapentaenoic acid by the marineeustigmatophyte Nannochloropsis. In: Cohen Z (ed)Chemicals from microalgae. Taylor & Francis, London,p 41–56
Sukenik A, Zmora O, Carmeli Y (1993) Biochemical quality ofmarine unicellular algae with special emphasis on lipid
13
Aquat Microb Ecol: Preprint, 2009
composition. II. Nannochloropsis sp. Aquaculture 117:313–326
Sukenik A, Beardall B, Kromkamp JC, Kopeck) J and others (inpress) Photosynthetic performance of outdoor Nannochlo-ropsis mass cultures under a wide range of environmentalconditions. Aquat Microb Ecol doi:10.3354/ame01309
Takahashi S, Murata N (2008) How do environmental stressesaccelerate photoinhibition? Trends Plant Sci 13:178–182
Webb WL, Newton M, Starr D (1974) Carbon dioxide ex-change of Alnus rubra: a mathematical model. Oecologia17:281–291
White AJ, Critchley C (1999) Rapid light curves: a new fluo-rescence method to assess the state of the photosyntheticapparatus. Photosynth Res 59:63–72
Zhang E, Wang B, Wang QH, Zhang SB, Zhao BD (2008)Ammonia-nitrogen and orthophosphate removal byimmobilized Scenedesmus sp. isolated from municipalwastewater for potential use in tertiary treatment. Biore-sour Technol 99:3787–3793
Zhao B, Wanga J, Gong H, Wena X, Ren H, Lu C (2008) Effectsof heat stress on PSII photochemistry in a cyanobacteriumSpirulina platensis. Plant Sci 175: 556–564
Zhu YH, Jiang JG (2008) Continuous cultivation of Dunaliellasalina in photobioreactor for the production of β-carotene.Eur Food Res Technol 227:953–959
Zou N, Richmond A (1999) Effect of light-path length in out-door flat plate reactors on output rate of cell mass and ofEPA in Nannochloropsis sp. J Biotechnol 70:351–356
14
Editorial responsibility: Tom Berman,Migdal, Israel
Submitted: December 9, 2008; Accepted: May 4, 2009Proofs received from author(s): July 14, 2009