1
Short Title: Comparison of Withania plastid genomes
Comparative Plastomics of Ashwagandha (Withania, Solanaceae) and Identification of
Mutational Hotspots for Barcoding Medicinal Plants
Furrukh Mehmood1,2, Abdullah1, Zartasha Ubaid1, Yiming Bao3, Peter Poczai2*, Bushra Mirza*1,4
1Department of Biochemistry, Quaid-i-Azam University, Islamabad, Pakistan
2Finnish Museum of Natural History, University of Helsinki, Helsinki, Finland
3National Genomics Data Center, Beijing Institute of Genomics, Chinese Academy of Sciences,
Beijing, China
4Lahore College for Women University, Pakistan
*Corresponding authors: Bushra Mirza ([email protected])
Peter Poczai ([email protected])
Preprints (www.preprints.org) | NOT PEER-REVIEWED | Posted: 11 March 2020 doi:10.20944/preprints202003.0181.v1
© 2020 by the author(s). Distributed under a Creative Commons CC BY license.
Peer-reviewed version available at Plants 2020, 9, 752; doi:10.3390/plants9060752
2
Abstract
Within the family Solanaceae, Withania is a small genus belonging to the Solanoideae subfamily.
Here, we report the de novo assembled, complete, plastomed genome sequences of W. coagulans,
W. adpressa, and W. riebeckii. The length of these genomes ranged from 154,198 base pairs (bp)
to 154,361 bp and contained a pair of inverted repeats (IRa and IRb) of 25,027--25,071 bp that
were separated by a large single-copy (LSC) region of 85,675--85,760 bp and a small single-copy
(SSC) region of 18,457--18,469 bp. We analyzed the structural organization, gene content and
order, guanine-cytosine content, codon usage, RNA-editing sites, microsatellites, oligonucleotide
and tandem repeats, and substitutions of Withania plastid genomes, which revealed close
resemblance among the species. Both the substitution and insertion and deletion analyses
confirmed that the IR region was significantly conserved compared with the LSC and SSC regions.
Further comparative analysis among the Withania species highlighted 30 divergent hotspots that
could potentially be used for molecular marker development, phylogenetic analysis, and species
identification.
Key words:
Ashwagandha, Chloroplast genome, InDels, Medicinal plants, Mutational hotspots,
Phylogenomics, Solanaceae, Substitutions, Withania
INTRODUCTION
The plant family Solanaceae consists of ~ 93 genera and ~ 2700 species [1,2]. This megadiverse
family is comprised of species ranging from herbaceous annuals to perennial trees, with a natural
distribution ranging from deserts to rainforests [3]. The genus Withania Pauq., belonging to the
subfamily Solanoideae, contains ~10--20 species [1]. Among the worldwide list of Withania
species, ashwagandha or winter cherry (W. somnifera (L.) Dunal) and paneer booti or ashutosh
booti (W. coagulans (Stocks) Dunal) are considered highly important, due to their therapeutic
potentials. These species play an important role in the indigenous medicine of Southeast Asia [4].
Withania somnifera has been used for over 3,000 years in the Ayurvedic medicine system [5].
Many studies of Withania have described the pharmacological properties of these species [6–9].
Preprints (www.preprints.org) | NOT PEER-REVIEWED | Posted: 11 March 2020 doi:10.20944/preprints202003.0181.v1
Peer-reviewed version available at Plants 2020, 9, 752; doi:10.3390/plants9060752
3
The ubiquity of such herbal products has expanded globally during recent decades. The worldwide
market for medicinal plants is anticipated to reach 5 trillion USD by 2050, with Europe driving
the market [10]. Medicinal plants are outstanding sources of innovative drug development, but
assessing their pharmacological properties and effectiveness requires thorough approaches.
Irregularities are calling attention to the quality of traded mass-produced herbal products
manufactured from ashwagandha (Withania species), with direct impact on their efficacy and
safety [11]. The quality of these manufactured herbal products is highly variable globally, and
consistent analytical approaches are required to identify and monitor their quality along the value
chain. DNA barcoding has become a major focus in the herbal medicine industry, because it can
be used to consistently apply quality control over the manufactured products and to identify
medicinal materials to protect consumers from being duped by dishonest suppliers. In addition,
DNA barcoding can serve as a forensic tool to aid in detecting toxic herbal materials in life-
threatening situations, prevent poisoning, and improve control procedures of herbal drug
substances [12].
The structure and composition of the chloroplast (cp) genome can be utilized to generate molecular
markers that can be used in DNA barcoding [13]. Cps are important and universal organelles
that play a vital role in photosynthesis and are also associated with biochemical pathways, such as
the biosynthesis of fatty acids, amino acids, vitamins, and pigments [14]. Among the many plant
species, plastid genomes are about 75-250 kilobases (kb) in size [15] and contain ~120 genes,
which include protein-encoding genes, ribosomal RNA (rRNA), and transfer RNA (tRNA) [16].
Angiosperm plastomes occur in circular and linear forms [17], and the percentage of each varies
within plant cells [17]. Circular-formed plastomes are typically quadripartite in structure, with a
pair of inverted repeats (IRa and IRb) regions, segregated by a large single-copy (LSC) and a small
single-copy (SSC) region [15,18,19]. Numerous mutational events occur in plastid genomes:
variations in tandem repeat numbers, insertions and deletions (InDels), point mutations, inversions
and translocations [19–21]. Plastomes have been termed as ‛superbarcodes’ , due to their
comparatively conserved organization, gene content, slow rate of nucleotide substitution in
protein-encoding genes, and uniparental inheritance, which make them excellent sources of
phylogenetic reconstruction and species identification at diverse taxonomic levels [22–25].
Plastome-sequencing data can also be useful for agricultural trait improvement [26],
Preprints (www.preprints.org) | NOT PEER-REVIEWED | Posted: 11 March 2020 doi:10.20944/preprints202003.0181.v1
Peer-reviewed version available at Plants 2020, 9, 752; doi:10.3390/plants9060752
4
transplastomics [27,28], population genetics [29], and conservation of species facing extinction
[30].
Here, we aimed to assemble and compare the plastid genome sequences of W. coagulans, W.
adpressa Coss., and W. riebeckii Schweinf. ex Balf.f. to reveal differences in their organization
and characteristics in repeats, insertion-deletions, and single-nucleotide polymorphisms (SNPs),
as well as to identify mutational hotspots for DNA barcoding. We also inferred the phylogeny of
Withania, based on our sampling, to determine the utility of the polymorphic loci detected in
species identification.
MATERIALS AND METHODS
Genome assembly and annotation
Fresh lush green leaves of W. coagulans, were obtained from Mianwali, Pakistan (32.5839° N,
71.5370° E). The leaf samples were rinsed with 70% ethanol, and total genomic DNA was
extracted, following the CTAB (cetyltrimethylammonium bromide) method [31]. DNA quality
and concentration were assessed by Colibri spectrometer Nanodrop Titertek-Berthold, Berthold
Detection Systems GmbH, Pforzheim, Germany) and 1% agarose gel electrophoresis. The genome
was sequenced, using the Illumina HiSeq PE150 platform (Illumina Inc., San Diego, CA, USA)
(Beijing Institute of Genomics). Furthermore, the Illumina sequence data of W. adpressa (5 Gb)
and W. riebeckii (5 Gb) were acquired from the Sequence Read Archive (SRA) deposited under
accession numbers SRR8718119 and SRR8718120. The raw sequencing read quality was checked
with the FastQC tool [32]. We used Velvet 1.2.10 [33] with k-mer sizes of 71, 91, 101, and 111 to
initially assemble the large sequence contigs from raw paired-end reads. Then, using the de novo
assembly option of Geneious R8.1 (Biomatters Ltd., Aukland, New Zealand [34], these contigs
were combined to produce complete plastid genomes. The junction sites between LSC, SSC, and
IR were determined for these novel assembled plastomes. Annotations of the genome sequence
were performed, using GeSeq [35] and CPGAVAS2 [36]. Then, the results were compared,
inspected, and curated manually. Additionally, tRNA genes were identified, using tRNAscan-SE
version 2.0 under default parameters [37] and Aragorn version 1.2.38 [38]. CPGAVAS2 [36] and
Clico FS [39] was used to draw circular maps of the genomes. The average coverage depths of the
Withania species plastomes were determined by mapping the reads to the de novo assembled
plastid genome through the Burrows-Wheeler Aligner (BWA) [40] and visualizing in Tablet [41].
Preprints (www.preprints.org) | NOT PEER-REVIEWED | Posted: 11 March 2020 doi:10.20944/preprints202003.0181.v1
Peer-reviewed version available at Plants 2020, 9, 752; doi:10.3390/plants9060752
5
The novel annotated plastid genomes were deposited in the National Center for Biotechnology
Information (NCBI) under the following accession numbers: W. coagulans (MN216390), W.
adpressa (BK010847), and W. riebeckii (BK010849), while the plastid genome of W.
coagulans was also deposited in the GWH database of the National Genomics Data Center [42]
with the accession number GWHACBF00000000.
Comparative chloroplast genome analysis
All de novo plastid genomes were aligned with Multiple Alignment using Fast Fourier Transform
(MAFFT) 7.309 [43], using default parameters, while protein-encoding genes, intergenic spacer
(IGS) regions, and introns were extracted to analyze nucleotide diversity in DnaSP v6 [44]. The
substitution and transition (Ts) and transversion (Tv) rates were resolved from the MAFFT
alignment, using W. somnifera as a reference for the other Withania species. Each structural
element, including the LSC, SSC, and IR, was aligned individually, and SNPs and InDel
polymorphisms were analyzed in DnaSP. The expansion and contraction of IRs and their border
positions were compared among Withania species, using IRscope [45]. To analyze the structural
evolution of Withania plastid genome, the four genome sequences were compared using Circoletto
[46] combuning blastn search (e-value of <1 x 10⁻¹⁰) with Circos output.
Potential RNA editing sites were predicted, using Predictive RNA Editor for Plants-chloroplast
genes (PREP-cp) and default settings [47], while the relative synonymous codon usage (RSCU)
and amino-acid frequencies were analyzed in Geneious R8.1. The ratios of synonymous (Ks) and
non-synonymous (Ka) substitutions for each extracted protein-encoding gene were calculated with
DnaSP for all Withania, using W. somnifera as reference.
Microsatellite repeats in Withania plastid genomes were detected with MIcroSAtellite-web
(MISA) [48], using a minimal repeat number of 7 for mononucleotide simple sequence repeats
(SSRs), four repeat units for dinucleotide SSRs, and three repeat units for tri-, tetra-, penta-, and
hexanucleotide SSRs. We also used REPuter [49] with parameters: minimal repeat size 30 base
pairs (bp), Hamming distance 3, minimum similarity percentage of two repeat copies 90%,
maximum computed repeats numbers 500 bp for scanning and visualizing forward (F), reverse
(R), palindromic (P), and complementary (C) repeats. Tandem repeats were also searched, using
the tandem repeat finder program with default parameters [50].
Preprints (www.preprints.org) | NOT PEER-REVIEWED | Posted: 11 March 2020 doi:10.20944/preprints202003.0181.v1
Peer-reviewed version available at Plants 2020, 9, 752; doi:10.3390/plants9060752
6
Plastid phylogenomic analysis
We included all available Withania plastid genome sequences in our analysis and added further
Solanaceae plastid genomes (Organelle Genome Resources of NCBI, accessed on 21 January,
2020) from closely related groups of Physaleae and additional taxonomic groups from the so-called
‘x = 12 clade’ that encompasses the species from Solanoideae and Nicotianoideae. We used
Petunia × atkinsiana (Sweet) D. Don ex W.H. Baxter (Syn.: Petunia × hybrida Vilm.) as an
outgroup to root our tree, since this was the only available complete plastid genome sequence
outside the x = 12 clade. For phylogenetic analysis, we removed one of the IR regions, and
subsequently all protein-encoding genes were excised from the plastid genomes. The reading
frames were manually verified during extraction by checking the start and stop codons. We
discarded accD, ycf1, and ycf15 from our final alignment, because these genes were highly variable
in size. The trans-spliced rps12 was also not included in the phylogenetic alignment together with
sequence of the infA pseudogene. Sequences of 74 protein-coding genes were concatenated and
aligned using MAFFT, then tree searches were performed in IQ-TREE 1.5.5 [51]. We used IQ-
TREE to infer the best-fitting models of substitution for partitioning the matrix-combining
multiple genes with the -TESTMERGEONLY and -AICc (Akaike information criterion corrected
for small sample sizes) options in the built-in ModelFinder [52]. Maximum likelihood (ML)
analyses were performed, using the ultrafast bootstrap approximation (UFBoot; [53]) with 1,000
replicates. The key idea behind UFBoot is to keep trees encountered during the ML-tree search for
the original sequence alignment and to use them to evaluate the tree likelihoods for the bootstrap
sequence alignment. UFBoot provides relatively unbiased bootstrap estimates under mild model
misspecifications and reduces computing time while achieving more unbiased branch supports
than standard bootstrap [53]. The SH-like approximate likelihood ratio test (SH-aLRT) was also
conducted together with UFBoot, while TreeDyn was used for further enhancement of
phylogenetic tree analysis [54,55].
RESULTS
Organization and characteristics of Withania plastid genomes
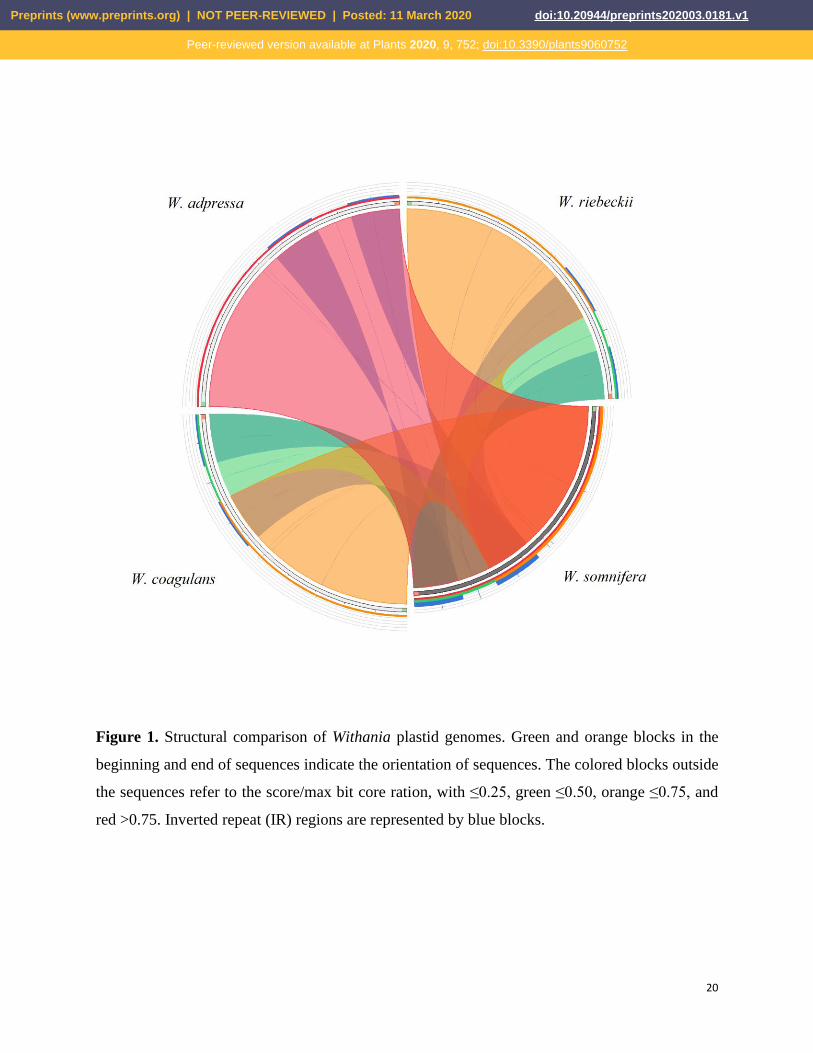
Our comparative analysis revealed that Withania species have similar plastid genome structures
(Fig. 1 and Table 1). The length of the assembled plastid genomes varied between 154,198 bp and
154,361 bp. The average coverage depth of the assembled plastomes of W. coagulans, W.
Preprints (www.preprints.org) | NOT PEER-REVIEWED | Posted: 11 March 2020 doi:10.20944/preprints202003.0181.v1
Peer-reviewed version available at Plants 2020, 9, 752; doi:10.3390/plants9060752
7
adpressa, and W. riebeckii was 573×, 566×, and 590×, respectively. The total guanosine-cytosine
(GC) content of the de novo assembled Withania plastid genomes was 37.7%, as was the
previously sequenced species. The GC content of the IR region was higher (43.2%) than the LSC
(35.7%) and SSC (31.8%) regions, which could have been due to the occurrence of rRNA genes,
which are known to contain GC-rich regions [19, 55–58]. The plastomes of the de novo assembled
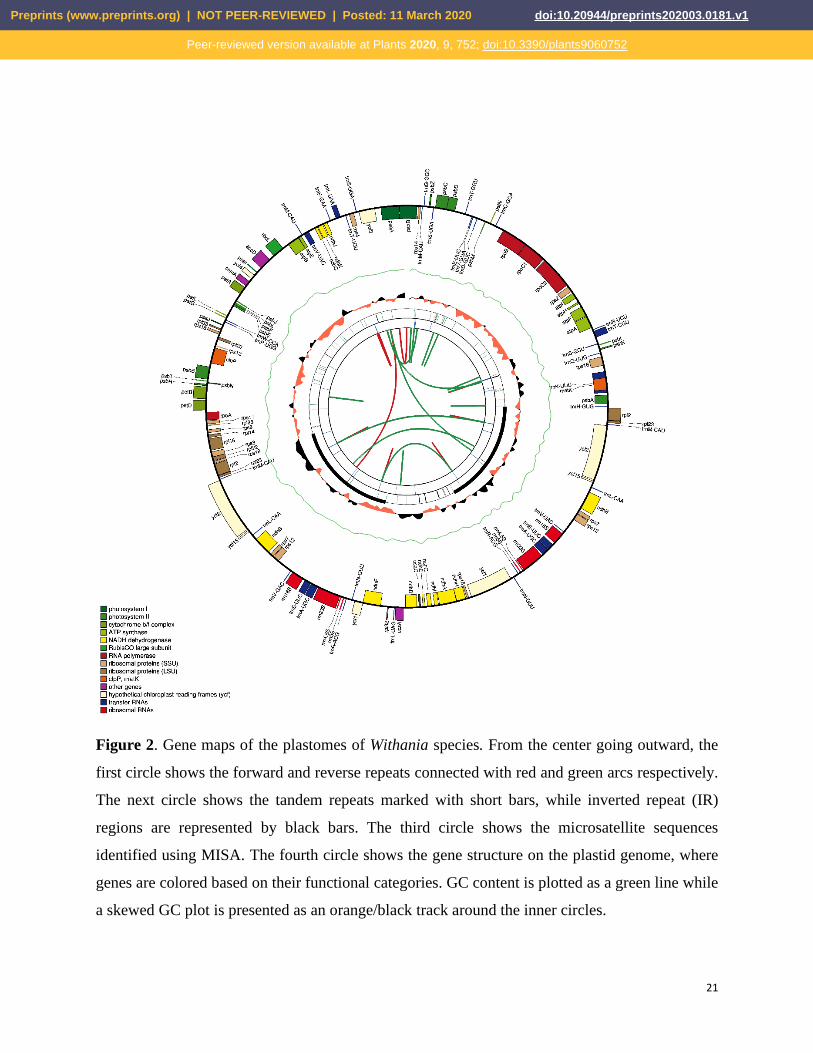
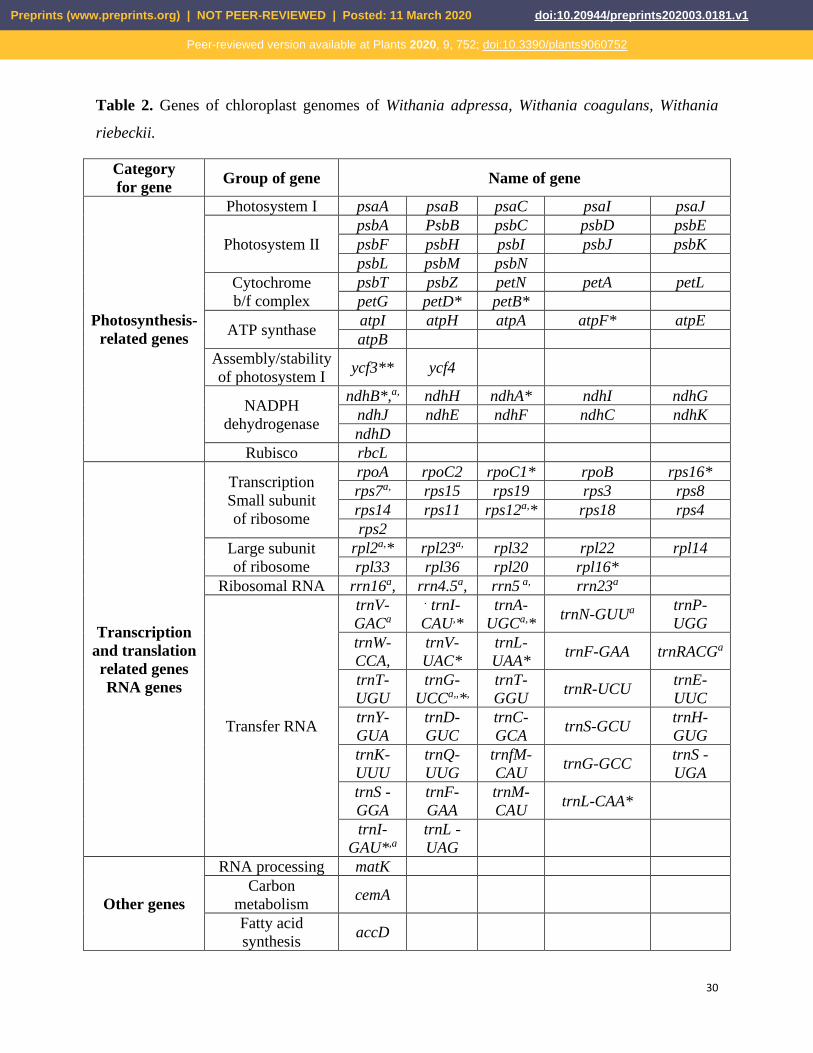
Withania species had 132 unique genes, whereas 18 genes were duplicated in the IR (Table 2, Fig.
2). Out of these 132 genes, 86 were protein-encoding, 37 were tRNA, and 8 rRNA genes were
similarly present in all species. The IR regions contained 18 duplicated genes and out of these 7
were protein-encoding, 4 were rRNA, and 7 were tRNA genes. The protein-encoding genes clpP,
ycf3, and rps12 contained two introns, while rps16, atpF, rpoC1, petB, petD, rpl16, ndhA, rpl2,
and ndhB additional genes contained one intron each. The rps12 gene was trans-spliced with its
5′end exon located in the LSC, while its two 3′end exons were found in the IR. The tRNAs (53%)
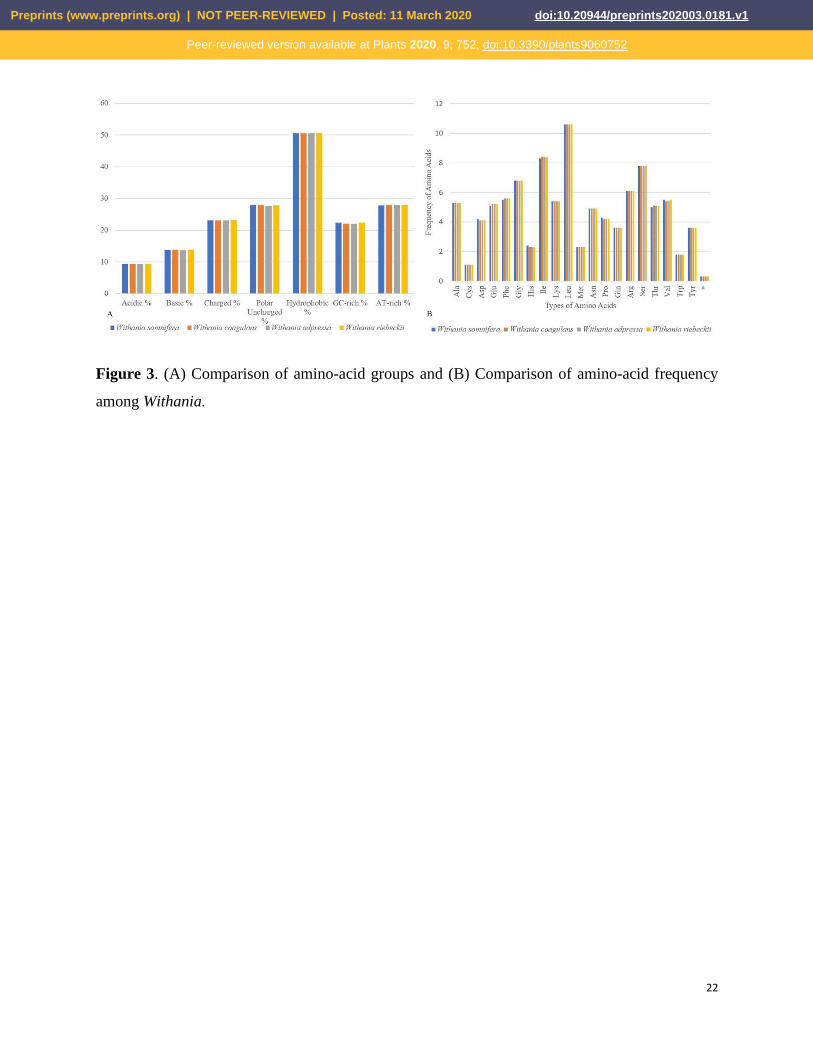
and rRNAs (55.3%) showed the highest GC content. Hydrophobic amino acids were abundant,
while the acidic amino acids were present in the least amount in plastid genomes of the genus
Withania. These amino acids were adenine-thymine (AT)-rich sequences in all species (Fig. 3A).
The RSCU and frequency of amino acids were also analyzed, which revealed that Leu is the most
abundant, while cysteine (Cys) was the least encoded amino acid in Withania plastid genomes
(Fig. 3B). The codon usage also revealed a shift towards the number of codons having A/T at the
third position (Table S1).
Divergence hotspots in Withania
Our comparison showed that all Withania genomes had similar nucleotide compositions in all
structural (LSC, SSC, and IR) and coding regions, which extended even to IGSs (Table S2). The
number of substitutions ranged between 28 and 110, while substitution types were shared among
species (Table 3). The most frequently occurring mutations were A/G and C/T conversions,
compared with other SNPs (Table 3). The ratio of Ts and Tv in the plastid genomes ranged from
1.09 to 1.2 in the LSC and between 0 and 1 in the SSC, while varying from 1 to 5 in the IR region
(Table S3). In general, the Ts were more frequent in Withania, in line with observations in other
plant species [59,60]. InDels were also examined, using DnaSP in all regions of the plastid
genome. The number of InDels ranged from 42 to 44, mostly located in the LSC and sparsely
found in the SSC, whereas the IRs contained only a few InDels (Table 4). This may have been due
to the observation that IRs are more conserved in plastid genomes and evolve under concerted
Preprints (www.preprints.org) | NOT PEER-REVIEWED | Posted: 11 March 2020 doi:10.20944/preprints202003.0181.v1
Peer-reviewed version available at Plants 2020, 9, 752; doi:10.3390/plants9060752
8
evolution, while the LSC and SSC regions are more prone to substitutions [61]. In considering all
positions with single- or multinucleotide variations as SNPs, then 205 SNPs were identified,
corresponding to a mean SNP frequency of 0.2050 SNPs/kb in Withania species, while InDels
showed a mean frequency of 0.128/kb.
The InDels and SNP mutational events in the plastid genome showed uneven distributions and
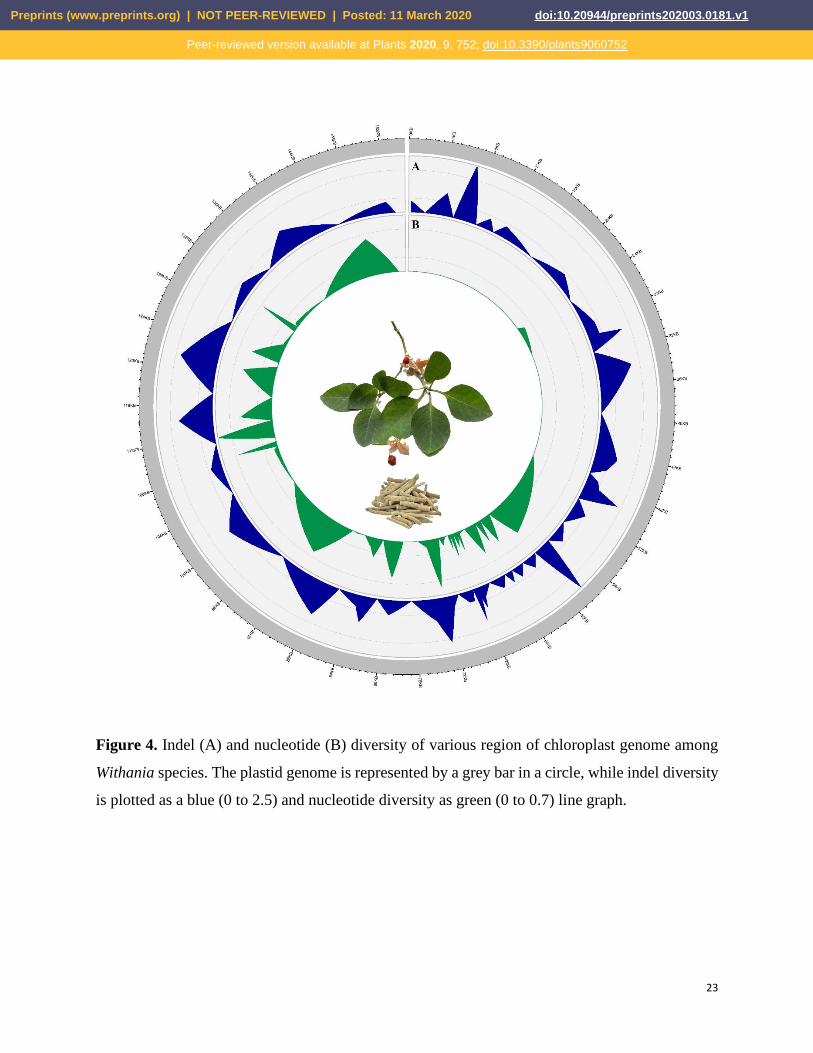
clustered as ‛hotspots’ [62,63]. At this point, we chose 17 highly polymorphic regions for marker
development (Table 5). Out of these 17 regions, 14 were IGSs, and 3 were genes. More
polymorphism was shown in the IGS regions (average π = 0.6087) than in the gene’s regions (π =
0.3061), intron (average π = 0.1061), and exon (0.0439). Among the Withania species, the values
ranged from 0 (ycf4) to 0.6122 (ndhF region) (Fig. 4). We further investigated the Ks and Ka
substitutions and their ratio (Ka/Ks) among these hotspots (Table S4). We selected 77 protein-
encoding genes for further analysis and found that 69 genes showed Ks = 0 and 58 had Ka = 0,
while 72 genes had both Ks and Ka = 0. Of the protein-encoding genes, four (accD, ycf2, ycf1,
ndhF) showed Ka/Ks ratios of more than 1, while ycf1 and psbC showed Ka/Ks ratios greater
than 0-1 for W. riebeckii, ndhF for W. coagulans, and rps15 for W. adpressa and accD, ycf2
showed had Ka/Ks greater than 0 for W. adpressa and W. riebeckii and rpoC2 for W. coagulans
and W. riebeckii. Most of the genes showed relatively slow evolutionary divergence, indicating
the conserved nature of the protein-encoding genes found in the plastid genome. Plastid genes are
mostly subjected to purifying selection, and the low Ka/Ks ratio is due to conservation of the
functions of the photosynthetic apparatus.
Repeat structure and analyses
Repeats in the plastid genome are useful in evolutionary studies and play crucial roles in genome
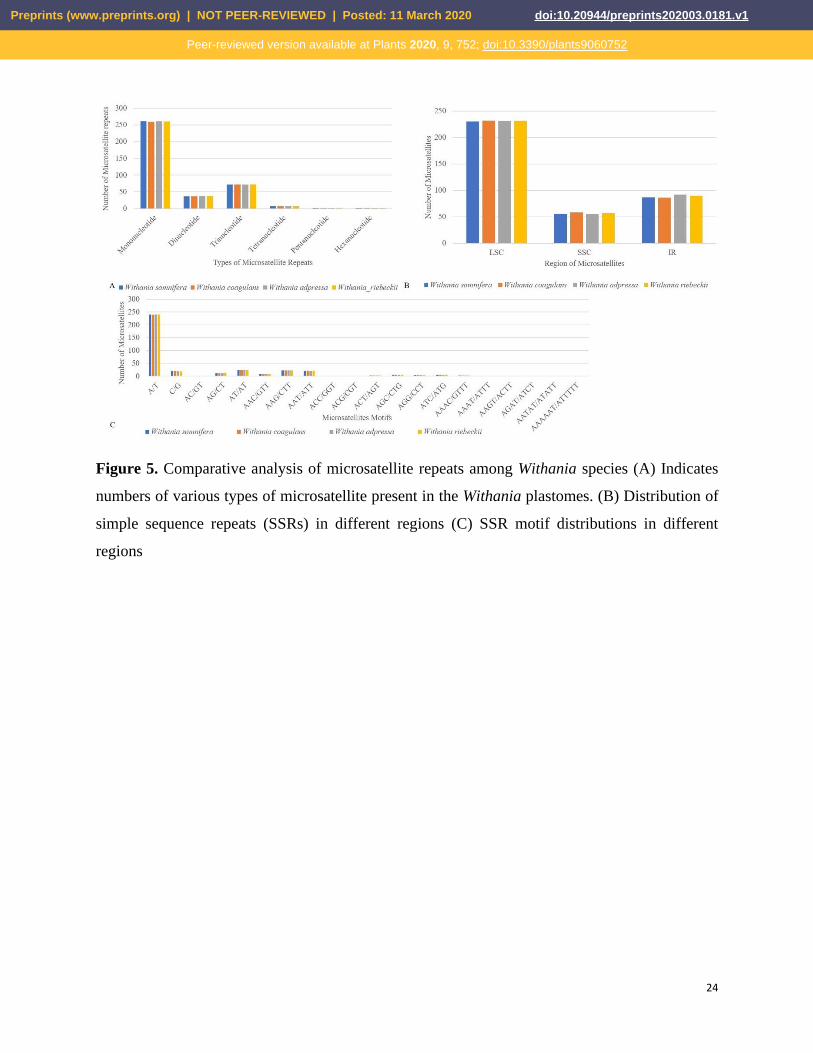
arrangement, plant breeding, and linkage map construction [64–66]. We performed a microsatellite
analysis that revealed shared microsatellite loci ranging from 376 (W. coagulans) to 379 (W.
adpressa). Most SSRs were mononucleotide stretches followed by trinucleotide and dinucleotide
repeats. In these groups, A/T motifs were highly abundant in mononucleotides, and AT/TA motifs
were frequently observed among dinucleotide SSRs. The mononucleotide SSR motifs varied from
7- to 17-unit repeat; in dinucleotide SSRs, the motif change was from 4- to 5-unit repeats, whereas
other types of SSRs were present mainly in 3--5-unit repeats. Most SSRs occurred in the LSC,
followed by IR and SSC (Fig. 5) (Table S5). REPuter was also employed to locate further tandem
Preprints (www.preprints.org) | NOT PEER-REVIEWED | Posted: 11 March 2020 doi:10.20944/preprints202003.0181.v1
Peer-reviewed version available at Plants 2020, 9, 752; doi:10.3390/plants9060752
9
repeats in all Withania species. A total of 66 oligonucleotide repeats were found among Withania
species. The F and P repeats were present in large numbers in all species. The oligonucleotide
repeats were variable in size (30-60 bp) and a large fraction of the repeats was located in the LSC
and existed in IGS regions, followed by gene, intron, and coding DNA sequence (CDS) regions
(Fig. 6) (Table S7). The number of tandem repeats varied from 22 to 25 between Withania species
(Fig. 7) (Table S6).
Comparative plastomics and inverted repeat boundaries
The plastid genome of land plants has a conserved quadripartite structure, but diversity exists at
the junction sites of the major structural regions of the genome. The variations in plastid genome
sizes can also be attributed to changes in the IR structure, such as contractions and expansions or
even loss of IRs along with the changes in the length of IGSs [67,68]. The size range of LSC, SSC,
and IR varies among the plastid genomes of the species, which may progress to alterations in
several genes, leading to deletion, duplication, or functional pseudogenization at the junction sites.
The variations at the joining sites of different regions of the plastid genome can help to expand our
knowledge of the evolution of species [68]. Liu et al. [69] reported that the similarities at the
joining regions may be used to explain the relationship between the species, while those plants
having high levels of relatedness show minimal fluctuations at the junctions of the cp genome. To
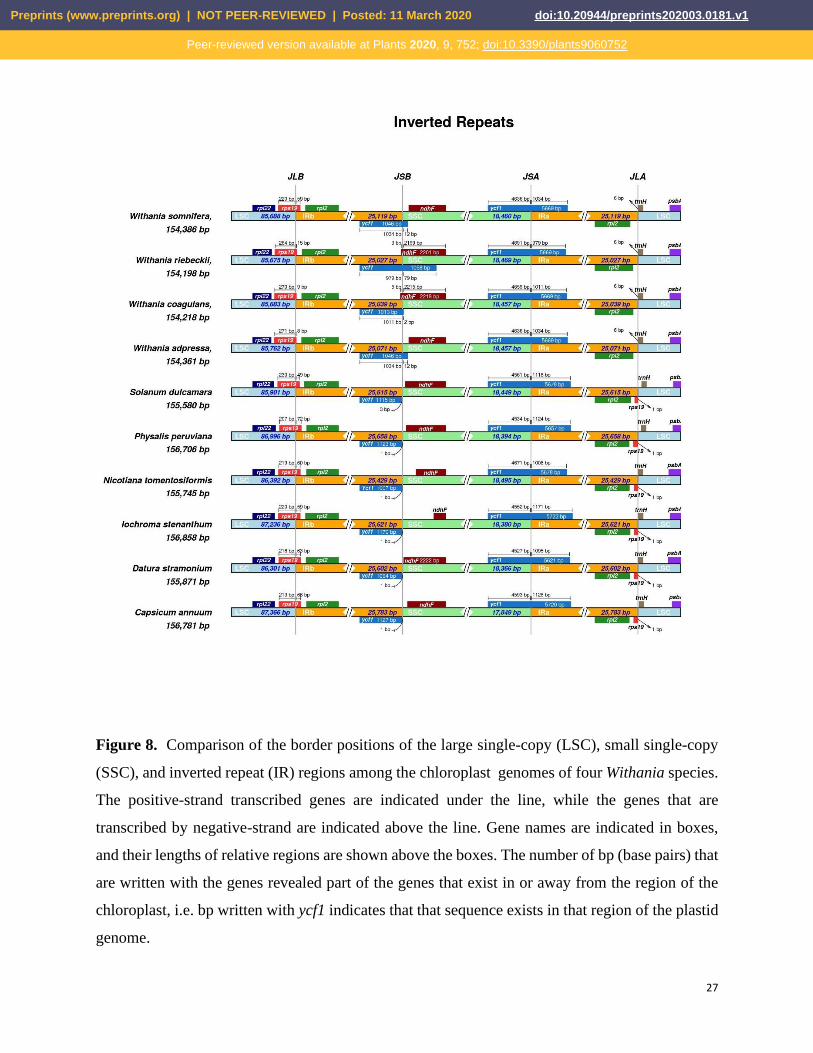
investigate such events, we compared the JL (LSC/IR) and JS (IR/SSC) junction sites of Withania
plastid genomes (Fig. 8). The resemblance at junctions revealed the close resemblance among the
Withania species. The rps19 gene was found at the junction site of JLB (LSC/IRb), and a portion
of this gene (8-59 bp) was copied in the IRa in all Withania genomes. The ndhF gene was entirely
present in the SSC region in W. somnifera and W. adpressa, but in W. coagulans (5 bp) and W.
riebeckii (3 bp) it was located in the IRb region.
Putative RNA-editing sites
RNA editing can modify the DNA-encoded sequencing of transcribed RNA by adding, deleting,
or modifying the nucleotides [46]. RNA editing aids in creating transcripts and maintaining protein
diversity [70]. Some RNA-editing sites in plastomes are conserved in higher plants [71]. To
examine the RNA editing in Withania species, we predicted putative sites in the plastid genomes,
using PREP-cp which revealed 37 putative sites in 15 genes of W. somnifera while 35, 39, and
37 editing sites were found in 13 genes of W. coagulans, and 14 genes of W. adpressa, and W.
Preprints (www.preprints.org) | NOT PEER-REVIEWED | Posted: 11 March 2020 doi:10.20944/preprints202003.0181.v1
Peer-reviewed version available at Plants 2020, 9, 752; doi:10.3390/plants9060752
10
riebeckii, respectively. The gene clpP has editing sites only in W. somnifera and ccsA only in W.
adpressa. Most of these RNA-editing sites were found among ndhB (9), ndhD (7), and rpoB (5).
All Withania species have high levels of conversion for Serine (Ser) to Leucine (Leu) 60%, 53.8%,
and 59.4%, respectively, followed by Proline (Pro) to Leu 14.28%, 17.94%, and 16.21%,
respectively and Ser to Phenylalanine (Phe) 8.57%, 10.2%, and 10.8%, respectively. Of the
putative RNA-editing sites detected 33 (94.2%), 34 (87.1%), and 33 (89.1%) codons substituted
on the second nucleotide and 2 (5.71%), 5 (12.8%), and 4 (10.81%) codons substituted on the first
nucleotide in W. coagulans, W. adpressa, and W. riebeckii. Many amino acids were converted
from Ser to Leu and changes at these sites assisted in the formation of hydrophobic amino acids,
e.g. Valine (Val), Leu and Phe (Table S8).
Phylogenetic Analysis
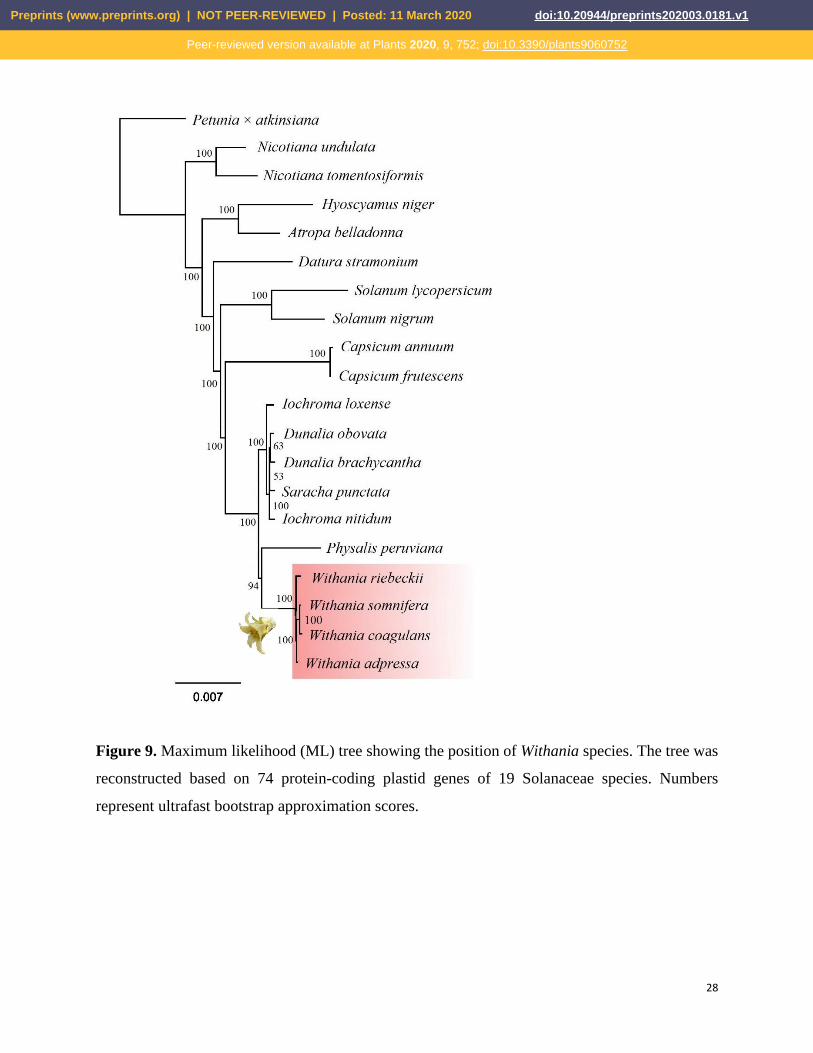
We performed maximum-likelihood analysis for phylogenetic reconstruction for 19 Solanaceae
species, based on selected protein-coding gene sequences extracted from whole-plastid genome
sequences. Our tree was reconstructed, based on a 69,582-bp alignment, and resolved a
phylogenetic tree supported by high bootstrap values (Fig. 9). The genus Withania was represented
by W. adpressa, native to North Africa, Morocco, and Algeria, W. coagulans from the eastern
distribution area, W. riebeckii native to the island of Socotra, Jemen, and finally, the widespread
W. somnifera. Our phylogenetic analysis of the genus Withania showed that it is monophyletic
and closely related to groundcherries (Physalis L.), with which it is often confused, and like the
latter also belongs to the subfamily Solanoideae. However, this relationship needs further sampling
to investigate the relationship of the allied genera. Our results were consistent with results from
the plastid intergenic atpB-rbcL spacer [71] ndhF and trnLF [1] and also based on whole-plastid
genome sequences [18].
DISCUSSION
Chloroplast DNA (cpDNA) is an excellent source of molecular variation available for higher-order
(i.e. generic level and above) phylogenetic studies in plants [19,66,73]. Data from the study of
cpDNA have helped to resolve some long-standing problems in Solanaceae systematics [74]. Thus,
we characterized, annotated, and analyzed the plastid genome of Withania species which was
further used in phylogenetic inference. Withania species belong to a rather diverse and widely
distributed Withaninae clade within the so-called physaloid group. Species of the genus Withania
Preprints (www.preprints.org) | NOT PEER-REVIEWED | Posted: 11 March 2020 doi:10.20944/preprints202003.0181.v1
Peer-reviewed version available at Plants 2020, 9, 752; doi:10.3390/plants9060752
11
are morphologically similar: the flowers are found in axillary fascicles with the peduncle absent.
The corollas are campanulate, urceolate, rotate, or salverform, while the filaments are often with
conspicuous lateral appendages, forming nectar grooves. The Withaninae clade consists of
approximately seven small often monotypic genera, such as Tubocapsicum (Wettst.) Makino,
Mellissia Hook. f., Aureliana Sendtn. or Discopodium Hochst., which are herbs, shrubs, or trees
primarily from the Old World. D’Arcy [75] considered Withania to be one of the truly Old-World
genera, while Symon [76] regarded it as a distinctive African Gondwanan element. Withania has
two centers of distribution: the first, located in the Canary Islands, Spain, and Northwest Africa
and the second, in the Horn of Africa, South Arabia, and India. The phylogenetic relationships
within the genus are poorly known, and the biology, chromosome numbers, and the exact number
of species are also lacking. Chromosome counts showed that most species of Withania are
polyploids with 2n = 2x = 48 [77], derived from the x = 12 haploid chromosome number typical
for the majority of Solanaceae species. In addition to the currently accepted Withania taxa, there
are 35 unresolved botanical names that need further investigation to clarify the taxonomy of the
genus.
In Hepper’s treatment [78], Withania consisted of 10 species, which were extended by Hunziker
[79] with the addition of nine mesophytes from the genera Mellissia Hook. and Physaliastrum
Makino. These additions extended the geographical range of the genus from the Canary Islands in
the west, through Asia to China and Japan in the east. Symon [75] also emphasized the similarity
of Mellissia (a critically endangered endemic of St Helena) to Withania but retained them as
distinct genera. In contrast, Hunziker [79] included Mellissia within Withania and molecular
results support this placement [1]. There is no consensus on the positions of the small clades related
to Withania, while its closest relatives are also debated. In our analysis, Withania resembles
Physalis, which is similar to the results of Deanna et al. [77], although this branching is supported
by only weak bootstrap values.
Plastid genome sequences could be used as tools to further elucidate species boundaries and
investigate the phylogenetic relationships among the small clades of Withaninae and resolve the
taxonomic debate over the placement of Melissia and other monotypic genera. For such barcoding
studies our results could provide valuable reference genomes for assemblies. The hotspot regions
described in our study could be useful in such phylogenetic or even population genetic
investigations. It was previously demonstrated that identifying highly variable regions by
Preprints (www.preprints.org) | NOT PEER-REVIEWED | Posted: 11 March 2020 doi:10.20944/preprints202003.0181.v1
Peer-reviewed version available at Plants 2020, 9, 752; doi:10.3390/plants9060752
12
comparative plastomics could provide crucial information about the loci suitable for development
of molecular markers [57,80–82]. Such divergent hotspots in the plastomes can be applied for
DNA barcoding at the generic level [29,83–85]. Thus, the set of 30 polymorphic regions identified
among Withania in our study could be applied for DNA barcoding.
By further analyzing the Ks and Ka arrangement of nucleotide substitution of these divergent
hotspots, we observed that the Ks substitutions are greater relative to the Ka substations. Such
observations are essential markers in evolution for defining slow- and fast-evolving genes [86].
The ratio of Ka/Ks also informs us about the selection pressure on these genes. When the Ka/Ks
value is minimal, it represents purifying selection, while values similar to it or equal to 1 represent
neutral evolution, and values greater than 1 denote positive selection [85]. Most plastid genes
showed a minimal Ka/Ks ratio (< 0.5), demonstrating that purifying selection is acting over these
genes, due to functional constraints of the plastid genome. However, atpB, ndhD, ndhF, rpoA,
rpoC1, rps2, and rps12 showed greater Ka/Ks values (> 1), possibly indicating selective pressure
acting over these genes that was previously proposed in other groups [57,87–89]. Our sampling in
the Withania clade was limited to further explore the biological causes of the elevated Ka/Ks ratios
observed in cases involving these genes. Here, we suggest that the following set of genes could
be the principal candidates in investigations of these environmental interactions and their effects
on plastid genes. Such investigations should include a nearly complete phylogenetic sampling of
Withania and consider the random fluctuations in Ka and Ks estimates that could easily lead to
erroneous inferences. Random fluctuations in the underlying sequences or in their sampling can
easily shift the inference of Ka and Ks to above 1, leading to an inferred positively selected
inference. This shortcoming can be bypassed by complete sampling and additional tests of
selective pressure.
CONCLUSIONS
Here, we sequenced, assembled, annotated, and compared the complete plastid genome sequence
of three Withania species. The structure of these genomes showed organization similar to that
previously reported for species of the Solanaceae. We identified sequence divergence hotspots and
located repeat sequences and InDels in the plastomes of Withania species. These regions may
constitute a useful means to develop suitable molecular markers for species identification and
DNA barcoding of ashwagandha medicinal products. Such commonly used herbal products are
Preprints (www.preprints.org) | NOT PEER-REVIEWED | Posted: 11 March 2020 doi:10.20944/preprints202003.0181.v1
Peer-reviewed version available at Plants 2020, 9, 752; doi:10.3390/plants9060752
13
frequently bundled by the industry as formulated raw herbs collected in the wild and transported
to international markets. The long transportation chain, with many middlemen, results in increased
events of misidentification and adulteration [90]. Due to lack of proper monitoring and regulatory
systems, there is a risk that many medicinal plants and their products sold on the market will be
taxonomically misidentified, mislabeled, or contaminated [90]. Globally, the focus has been on
the potential hazards of traditional herbal medicinal products [91]. It is hoped that our study will
aid in the development of DNA-barcoding markers to clarify the taxonomic identity of Withania
species in medicinal plant production. Plastid genome-based ‛superbarcoding’ is repeatable,
reliable, and sensitive enough to distinguish look-alike species and has the potential for becoming
a valuable tool for the biomonitoring of multi-ingredients manufactured from ashwagandha.
Acknowledgements
This work was supported by the National Key Research and Development Program of China
[2016YFE0206600 to Y.B.]; The 13th Five-year Informatization Plan of the Chinese Academy of
Sciences [XXH13505–05 to Y.B.]; The 100-Talent Program of the Chinese Academy of Sciences
[to Y.B.]; The Open Biodiversity and Health Big Data Initiative of IUBS [to Y.B.]. We highly
acknowledge the DNA4 Technologies LLC (Withania adpressa, Withania riebeckii) for
sequencing and deposition of the raw sequencing data in the public repository of the National
Center of Biotechnology Information. The authors thank James Thompson for editing the
manuscript.
Conflict of interest
The authors declare that they have no conflict of interest.
References
1. Olmstead, R.G.; Bohs, L.; Migid, H.A.; Santiago-Valentin, E. Garcia, V.F.; Collier, S.M. A
Molecular phylogeny of the Solanaceae. Taxon 2008, 57, 1159–1181.
2. Olmstead, R.G.; Bohs, L. A summary of molecular systematic research in solanaceae: 1982-
2006. Solanaceae IV: Genomics meets biodiversity. Proceedings of the VIth international
Solanaceae conference, Madison, Wisconsin, USA. 2007. pp 255–268
3. Knapp, S.; Bohs, L.; Nee, M.; Spooner, D.M. Solanaceae - A model for linking genomics
with biodiversity. Comp. Funct. Genomics 2004, 5, 285–291.
4. Mirjalili, M.H.; Moyano, E.; Bonfill, M.; Cusido, R.M.; Palazón, J. Steroidal lactones from
withania somnifera, an ancient plant for novel medicine. Molecules 2009, 14, 2373–2393.
5. Singh, P.; Guleri, R.; Singh, V.; Kaur, G.; Kataria, H.; Singh, B.; Kaur, G.; Kaul, S.C.;
Preprints (www.preprints.org) | NOT PEER-REVIEWED | Posted: 11 March 2020 doi:10.20944/preprints202003.0181.v1
Peer-reviewed version available at Plants 2020, 9, 752; doi:10.3390/plants9060752
14
Wadhwa, R.; Pati, P.K. Biotechnological interventions in Withania somnifera (L.) Dunal.
Biotechnol. Genet. Eng. Rev. 2015, 31, 1–20.
6. Uddin, Q.; Samiulla, L.; Singh, V.K.; Jamil, S.S. Phytochemical and pharmacological
profile of Withania somnifera Dunal: A review. J. Appl. Pharm. Sci. 2012, 2, 170–175.
7. Maurya, R. Chemistry and pharmacology of Withania coagulans: an Ayurvedic remedy. J.
Pharm. Pharmacol. 2010, 62, 153–160.
8. Ihsan-ul-Haq; Youn, U.J.; Chai, X.; Park, E.-J.; Kondratyuk, T.P.; Simmons, C.J.; Borris,
R.P.; Mirza, B.; Pezzuto, J.M.; Chang, L.C. Biologically active withanolides from Withania
coagulans. J. Nat. Prod. 2013, 76, 22–28.
9. Rehman, S.; Keefover-Ring, K.; Haq, I. ul; Dilshad, E.; Khan, M.I.; Akhtar, N.; Mirza, B.
Drier Climatic Conditions Increase Withanolide Content of Withania coagulans Enhancing
Its Inhibitory Potential Against Human Prostate Cancer Cells. Appl. Biochem. Biotechnol.
2019, 188, 460–480.
10. Shinwari, Z.K. Medicinal plants research in Pakistan. J. Med. Plants Res. 2010, 4, 161–176.
11. Raclariu, A.C.; Heinrich, M.; Ichim, M.C.; de Boer, H. Benefits and Limitations of DNA
Barcoding and Metabarcoding in Herbal Product Authentication. Phytochem. Anal. 2018,
29, 123–128.
12. Li, M.; Cao, H.; But, P.P.H.; Shaw, P.C. Identification of herbal medicinal materials using
DNA barcodes. J. Syst. Evol. 2011, 49, 271–283.
13. Jin, S.; Daniell, H. The Engineered Chloroplast Genome Just Got Smarter. Trends Plant
Sci. 2015, 20, 622–640.
14. Cooper, G. Chloroplasts and other plastids in the cell: A molecular approach. 2nd edition;
Sunderland, MA, Sinauer Associates, 2000.
15. Palmer, J.D. Comparative organization of chloroplast genomes. Annu. Rev. Genet. 1985,
19, 325–354.
16. Daniell, H.; Lin, C.-S.; Yu, M.; Chang, W.-J. Chloroplast genomes: diversity, evolution,
and applications in genetic engineering. Genome Biol. 2016, 17, 134.
17. Oldenburg, D.J.; Bendich, A.J. DNA maintenance in plastids and mitochondria of plants.
Front. Plant Sci. 2015, 6, 883.
18. Amiryousefi, A.; Hyvönen, J.; Poczai, P. The chloroplast genome sequence of bittersweet
(Solanum dulcamara): Plastid genome structure evolution in Solanaceae. PLoS One 2018,
13, 1–23.
19. Abdullah; Shahzadi, I.; Mehmood, F.; Ali, Z.; Malik, M.S.; Waseem, S.; Mirza, B.; Ahmed,
I.; Waheed, M.T. Comparative analyses of chloroplast genomes among three Firmiana
species: Identification of mutational hotspots and phylogenetic relationship with other
species of Malvaceae. Plant Gene 2019, 100199.
20. Jheng, C.-F.; Chen, T.-C.; Lin, J.-Y.; Chen, T.-C.; Wu, W.-L.; Chang, C.-C. The
comparative chloroplast genomic analysis of photosynthetic orchids and developing DNA
markers to distinguish Phalaenopsis orchids. Plant Sci. 2012, 190, 62–73.
21. Xu, J.-H.; Liu, Q.; Hu, W.; Wang, T.; Xue, Q.; Messing, J. Dynamics of chloroplast
Preprints (www.preprints.org) | NOT PEER-REVIEWED | Posted: 11 March 2020 doi:10.20944/preprints202003.0181.v1
Peer-reviewed version available at Plants 2020, 9, 752; doi:10.3390/plants9060752
15
genomes in green plants. Genomics 2015, 106, 221–231.
22. Moore, M.J.; Bell, C.D.; Soltis, P.S.; Soltis, D.E. Using plastid genome-scale data to resolve
enigmatic relationships among basal angiosperms. Proc. Natl. Acad. Sci. 2007, 104, 19363–
19368.
23. Ravi, V.; Khurana, J.P.; Tyagi, A.K.; Khurana, P. An update on chloroplast genomes. Plant
Syst. Evol. 2008, 271, 101–122.
24. Yang, M.; Zhang, X.; Liu, G.; Yin, Y.; Chen, K.; Yun, Q.; Zhao, D.; Al-Mssallem, I.S.; Yu,
J. The complete chloroplast genome sequence of date palm (Phoenix dactylifera L.). PLoS
One 2010, 5, e12762.
25. Bi, Y.; Zhang, M.F.; Xue, J.; Dong, R.; Du, Y.P.; Zhang, X.H. Chloroplast genomic
resources for phylogeny and DNA barcoding: A case study on Fritillaria. Sci. Rep. 2018,
8, 1184.
26. Bansal, K.C.; Saha, D. Chloroplast Genomics and Genetic Engineering for Crop
Improvement. Agric. Res. 2012, 1, 53–66.
27. Waheed, M.T.; Thönes, N.; Müller, M.; Hassan, S.W.; Razavi, N.M.; Lössl, E.; Kaul, H.P.;
Lössl, A.G. Transplastomic expression of a modified human papillomavirus L1 protein
leading to the assembly of capsomeres in tobacco: A step towards cost-effective second-
generation vaccines. Transgenic Res. 2011, 20, 271–282.
28. Waheed, M.T.; Ismail, H.; Gottschamel, J.; Mirza, B.; Lössl, A.G. Plastids: The Green
Frontiers for Vaccine Production. Front. Plant Sci. 2015, 6, 1005.
29. Ahmad, I. Evolutionary dynamics in taro, Massey University, Palmerston North, New
Zealand, 2014.
30. Wambugu, P.W.; Brozynska, M.; Furtado, A.; Waters, D.L.; Henry, R.J. Relationships of
wild and domesticated rices (Oryza AA genome species) based upon whole chloroplast
genome sequences. Sci. Rep. 2015, 5, 13957.
31. Murray, M.G.; Thompson, W.F. Rapid isolation of high molecular weight plant DNA.
Nucleic Acids Res. 1980, 8, 4321–4325.
32. Andrews, S. FASTQC. A quality control tool for high throughput sequence data.
Available:https://www.bioinformatics.babraham.ac.uk/projects/fastqc/ (accessed on
14.02.2020)
33. Zerbino, D.R.; Birney, E. Velvet: Algorithms for de novo short read assembly using de
Bruijn graphs. Genome Res. 2008, 18, 821–829.
34. Kearse, M.; Moir, R.; Wilson, A.; Stones-Havas, S.; Cheung, M.; Sturrock, S.; Buxton, S.;
Cooper, A.; Markowitz, S.; Duran, C.; et al. Geneious Basic: An integrated and extendable
desktop software platform for the organization and analysis of sequence data.
Bioinformatics 2012, 28, 1647–1649.
35. Tillich, M.; Lehwark, P.; Pellizzer, T.; Ulbricht-Jones, E.S.; Fischer, A.; Bock, R.; Greiner,
S. GeSeq – versatile and accurate annotation of organelle genomes. Nucleic Acids Res.
2017, 45, W6–W11.
36. Shi, L.; Chen, H.; Jiang, M.; Wang, L.; Wu, X.; Huang, L.; Liu, C. CPGAVAS2, an
Preprints (www.preprints.org) | NOT PEER-REVIEWED | Posted: 11 March 2020 doi:10.20944/preprints202003.0181.v1
Peer-reviewed version available at Plants 2020, 9, 752; doi:10.3390/plants9060752
16
integrated plastome sequence annotator and analyzer. Nucleic Acids Res. 2019, 47, W65–
W73.
37. Lowe, T.M.; Chan, P.P. tRNAscan-SE On-line: integrating search and context for analysis
of transfer RNA genes. Nucleic Acids Res. 2016, 44, W54–W57.
38. Laslett, D.; Canback, B. ARAGORN, a program to detect tRNA genes and tmRNA genes
in nucleotide sequences. Nucleic Acids Res. 2004, 32, 11–16.
39. Cheong, W-H.; Tan, Y-C.; Yap, S-J; Ng, K-P. Clico FS: an interactive web-based service
of Circos. Bioinformatics 2015, 31, 3685–3687.
40. Li, H.; Durbin, R. Fast and accurate short read alignment with Burrows-Wheeler transform.
Bioinformatics 2009, 25, 1754–1760.
41. Milne, I.; Bayer, M.; Cardle, L.; Shaw, P.; Stephen, G.; Wright, F.; Marshall, D. Tablet-
next generation sequence assembly visualization. Bioinformatics 2009, 26, 401–402.
42. Zhang, Z.; Zhao, W.; Xiao, J.; Bao, Y.; He, S.; Zhang, G.; Li, Y.; Zhao, G.; Chen, R.; Gao,
Y.; et al. Database Resources of the National Genomics Data Center in 2020. Nucleic Acids
Res. 2019, 48, D24–D33.
43. Katoh, K.; Kuma, K.I.; Toh, H.; Miyata, T. MAFFT version 5: Improvement in accuracy of
multiple sequence alignment. Nucleic Acids Res. 2005, 33, 511–518.
44. Rozas, J.; Ferrer-Mata, A.; Sanchez-DelBarrio, J.C.; Guirao-Rico, S.; Librado, P.; Ramos-
Onsins, S.E.; Sanchez-Gracia, A. DnaSP 6: DNA sequence polymorphism analysis of large
data sets. Mol. Biol. Evol. 2017, 34, 3299–3302.
45. Amiryousefi, A.; Hyvönen, J.; Poczai, P. IRscope: an online program to visualize the
junction sites of chloroplast genomes. Bioinformatics 2018, 34, 3030–3031.
46. Darzentas, N. Circoletto: visualizing sequence similarity with Circos. Bioinformatics 2010,
26, 2620–2621
47. Mower, J.P. The PREP suite: Predictive RNA editors for plant mitochondrial genes,
chloroplast genes and user-defined alignments. Nucleic Acids Res. 2009, 37, W253–W259.
48. Beier, S.; Thiel, T.; Münch, T.; Scholz, U.; Mascher, M. MISA-web: a web server for
microsatellite prediction. Bioinformatics 2017, 33, 2583–2585.
49. Kurtz, S. Choudhuri, J.V.; Ohlebusch, E.; Schleiermacher, C.; Stoye, J.; Giegerich, R.
REPuter: the manifold applications of repeat analysis on a genomic scale. Nucleic Acids
Res. 2002, 29, 4633–4642.
50. Benson, G. Tandem repeats finder: A program to analyze DNA sequences. Nucleic Acids
Res. 1999, 27, 573–580.
51. Nguyen, L.-T.; Schmidt, H.A.; von Haeseler, A.; Minh, B.Q. IQ-TREE: A fast and effective
stochastic algorithm for estimating Maximum-likelihood phylogenies. Mol. Biol. Evol.
2015, 32, 268–274.
52. Kalyaanamoorthy, S.; Minh, B.Q.; Wong, T.K.F.; von Haeseler, A.; Jermiin, L.S.
ModelFinder: fast model selection for accurate phylogenetic estimates. Nat. Methods 2017,
14, 587–589.
Preprints (www.preprints.org) | NOT PEER-REVIEWED | Posted: 11 March 2020 doi:10.20944/preprints202003.0181.v1
Peer-reviewed version available at Plants 2020, 9, 752; doi:10.3390/plants9060752
17
53. Hoang, D.T.; Chernomor, O.; von Haeseler, A.; Minh, B.Q.; Vinh, L.S. UFBoot2:
Improving the ultrafast bootstrap approximation. Mol. Biol. Evol. 2018, 35, 518–522.
54. Dereeper, A.; Guignon, V.; Blanc, G.; Audic, S.; Buffet, S.; Chevenet, F.; Dufayard, J.-F.;
Guindon, S.; Lefort, V.; Lescot, M.; et al. Phylogeny.fr: robust phylogenetic analysis for
the non-specialist. Nucleic Acids Res. 2008, 36, W465–W469.
55. Lemoine, F.; Correia, D.; Lefort, V.; Doppelt-Azeroual, O.; Mareuil, F.; Cohen-Boulakia,
S.; Gascuel, O. NGPhylogeny.fr: new generation phylogenetic services for non-specialists.
Nucleic Acids Res. 2019, 47, W260–265.
56. Qian, J.; Song, J.; Gao, H.; Zhu, Y.; Xu, J.; Pang, X.; Yao, H.; Sun, C.; Li, X.; Li, C.; et al.
The complete chloroplast genome sequence of the medicinal plant Salvia miltiorrhiza. PLoS
One 2013, 8, e57607.
57. Abdullah; Mehmood, F.; Shahzadi, I.; Waseem, S.; Mirza, B.; Ahmed, I.; Waheed, M.T.
Chloroplast genome of Hibiscus rosa-sinensis (Malvaceae): Comparative analyses and
identification of mutational hotspots. Genomics 2020, 112, 581–591.
58. Shahzadi, I.; Abdullah; Mehmood, F.; Ali, Z.; Ahmed, I.; Mirza, B. Chloroplast genome
sequences of Artemisia maritima and Artemisia absinthium: Comparative analyses,
mutational hotspots in genus Artemisia and phylogeny in family Asteraceae. Genomics
2019. DOI: https://doi.org/10.1016/j.ygeno.2019.08.016
59. Song, Y.; Chen, Y.; Lv, J.; Xu, J.; Zhu, S.; Li, M. Comparative Chloroplast Genomes of
Sorghum Species: Sequence Divergence and Phylogenetic Relationships. BioMed Res. Int.
2019, DOI: https://doi.org/10.1155/2019/5046958
60. Sun, J.; Chen, M.; Yujiang; Zhao, D.; Tao, J. Characterization of the Complete Chloroplast
Genomes of Sequences of Two Diploid Species: Paeonia lactiflora ‘Da Fugui’ and Paeonia
ostii ‘Fengdan’ in the Paeoniaceae Family. J. Hortic. 2018, 5, 4.
61. Ahmed, I.; Biggs, P.J.; Matthews, P.J.; Collins, L.J.; Hendy, M.D.; Lockhart, P.J.
Mutational dynamics of aroid chloroplast genomes. Genome Biol. Evol. 2012, 4, 1316–
1323.
62. Shaw, J.; Lickey, E.B.; Schilling, E.E.; Small, R.L. Comparison of whole chloroplast
genome sequences to choose noncoding regions for phylogenetic studies in angiosperms:
The Tortoise and the hare III. Am. J. Bot. 2007, 94, 275–288.
63. Worberg, A.; Quandt, D.; Barniske, A.M.; Löhne, C.; Hilu, K.W.; Borsch, T. Phylogeny of
basal eudicots: Insights from non-coding and rapidly evolving DNA. Org. Divers. Evol.
2007, 7, 55–77.
64. Powell, W.; Morgante, M.; McDevitt, R.; Vendramin, G.G.; Rafalski, J.A. Polymorphic
simple sequence repeats regions in chloroplast genomes: applications to the population
genetics of pines. Proc. Natl. Acad. Sci. U. S. A. 1995, 92, 7759–7763.
65. Xue, J.; Wang, S.; Zhou, S.L. Polymorphic chloroplast microsatellite loci in Nelumbo
(Nelumbonaceae). Am. J. Bot. 2012, 99, e240–e244.
66. Zhang, Y.; Du, L.; Liu, A.; Chen, J.; Wu, L.; Hu, W.; Zhang, W.; Kim, K.; Lee, S.-C.; Yang,
T.-J.; et al. The Complete Chloroplast Genome Sequences of Five Epimedium Species:
Lights into Phylogenetic and Taxonomic Analyses. Front. Plant Sci. 2016, 7, 306.
Preprints (www.preprints.org) | NOT PEER-REVIEWED | Posted: 11 March 2020 doi:10.20944/preprints202003.0181.v1
Peer-reviewed version available at Plants 2020, 9, 752; doi:10.3390/plants9060752
18
67. Wang, R.J.; Cheng, C.L.; Chang, C.C.; Wu, C.L.; Su, T.M.; Chaw, S.M. Dynamics and
evolution of the inverted repeat-large single copy junctions in the chloroplast genomes of
monocots. BMC Evol. Biol. 2008, 8, 36
68. Palmer, J.D.; Jansen, R.K.; Michaels, H.J.; Chase, M.W.; Manhart, J.R. Chloroplast DNA
Variation and Plant Phylogeny. Ann. Missouri Bot. Gard. 1988, 75, 1180–1206.
69. Liu, H.; He, J.; Ding, C.; Lyu, R.; Pei, L.; Cheng, J.; Xie, L. Comparative Analysis of
Complete Chloroplast Genomes of Anemoclema, Anemone, Pulsatilla, and Hepatica
Revealing Structural Variations Among Genera in Tribe Anemoneae (Ranunculaceae).
Front. Plant Sci. 2018, 9, 1–16.
70. Bundschuh, R.; Altmüller, J.; Becker, C.; Nürnberg, P.; Gott, J.M. Complete
characterization of the edited transcriptome of the mitochondrion of Physarum
polycephalum using deep sequencing of RNA. Nucleic Acids Res. 2011, 39, 6044–6055.
71. Zeng, W.H.; Liao, S.C.; Chang, C.C. Identification of RNA editing sites in chloroplast
transcripts of Phalaenopsis aphrodite and comparative analysis with those of other seed
plants. Plant Cell Physiol. 2007, 48, 362–368.
72. Jamil, I.; Qamarunnisa, S.; Azhar, A.; Shinwari, Z.K.; Ali, S.I.; Qaiser, M.; Jamil, I.; Al,
E.T.Subfamilial relationships within Solanaceae as inferred from atpB-rbcL intergenic
spacer. Pak. J. Bot. 2014, 46, 585–590.
73. Jansen, R.K.; Cai, Z.; Raubeson, L.A.; Daniell, H.; dePamphilis, C.W.; Leebens-Mack, J.;
Muller, K.F.; Guisinger-Bellian, M.; Haberle, R.C.; Hansen, A.K.; et al. Analysis of 81
genes from 64 plastid genomes resolves relationships in angiosperms and identifies
genome-scale evolutionary patterns. Proc. Natl. Acad. Sci. 2007, 104, 19369–19374.
74. Olmstead, R.G.; Sweere, J.A.; Spangler, R.E.; Bohs, L.; Palmer, J.D. Phylogeny and
Provisional Classification of the Solanaceae Based on Chloroplast DNA. In Solanaceae IV:
Advances in biology and utilization. Nee M., Symon, D.E., Lester, R.N., Jessop J.P. Ed.
Royal Botanic Gardens, Kew, pp. 111–137.
75. D'Arcy, W.G. The Solanaceae since 1976, with a review of its biogeography. In Solanaceae
III: Taxonomy, Chemistry, Evolution. Hawkes, J.G.; Lester, R.N.; Nee, M.; Estrada, N. Ed.;
Royal Botanic Gardens, Kew, UK, 1991; pp. 75–138.
76. Symon, D.E. Gondwanan elements of the Solanaceae. In Solanaceae III: taxonomy,
chemistry, evolution; Hawkes JG, Lester RN, Nee M, Estrada N. Royal Botanical Gardens,
Kew, U., Ed.; 1991; pp. 139–150.
77. Deanna, R.; Smith, S.D.; Särkinen, T.; Chiarini, F. Patterns of chromosomal evolution in
the florally diverse Andean clade Iochrominae (Solanaceae). Perspect. Plant Ecol. Evol.
Syst. 2018, 35, 31–43
78. Hepper, F.N. Old World Withania (Solanaceae): a taxonomic review and key to the species.
In Solanaceae III: Taxonomy, chemistry, evolution.; In: Hakes JG, Lester RN, Nee M,
Estrada. N., Ed.; Royal Botanic Gardens, Kew, UK, 1991; pp. 211–228.
79. Hunziker, A.T. Genera Solanacearum: The Genera of Solanaceae Illustrated, Arranged
According to a New System. Ruggell: ARG Gantner Verlag, 2001.
80. Choi, K.S.; Chung, M.G.; Park, S. The complete chloroplast genome sequences of three
Preprints (www.preprints.org) | NOT PEER-REVIEWED | Posted: 11 March 2020 doi:10.20944/preprints202003.0181.v1
Peer-reviewed version available at Plants 2020, 9, 752; doi:10.3390/plants9060752
19
veroniceae species (Plantaginaceae): comparative analysis and highly divergent regions.
Front. Plant Sci. 2016, 7, 1–8.
81. Li, Y.; Zhang, Z.; Yang, J.; Lv, G. Complete chloroplast genome of seven Fritillaria
species, variable DNA markers identification and phylogenetic relationships within the
genus. PLoS One 2018, 13, e0194613
82. Menezes, A.P.A.; Resende-Moreira, L.C.; Buzatti, R.S.O.; Nazareno, A.G.; Carlsen, M.;
Lobo, F.P.; Kalapothakis, E.; Lovato, M.B. Chloroplast genomes of Byrsonima species
(Malpighiaceae): Comparative analysis and screening of high divergence sequences. Sci.
Rep. 2018, 8, 1–12.
83. Ahmed, I.; Matthews, P.J.; Biggs, P.J.; Naeem, M.; Mclenachan, P.A.; Lockhart, P.J.
Identification of chloroplast genome loci suitable for high-resolution phylogeographic
studies of Colocasia esculenta (L.) Schott (Araceae) and closely related taxa. Mol. Ecol.
Resour. 2013, 13, 929–937.
84. Dong, W.; Liu, J.; Yu, J.; Wang, L.; Zhou, S. Highly variable chloroplast markers for
evaluating plant phylogeny at low taxonomic levels and for DNA barcoding. PLoS One
2012, 7, e35071
85. Nguyen, V.B.; Park, H.-S.; Lee, S.-C.; Lee, J.; Park, J.Y.; Yang, T.-J. Authentication
markers for five major Panax species developed via comparative analysis of complete
chloroplast genome sequences; J. Agric. Food Chem. 2017, 65, 6298–6306
86. Kimura, M. Model of effectively neutral mutations in which selective constraint is
incorporated. Proc. Natl. Acad. Sci. 1979, 76, 3440–3444
87. Lawrie, D.S.; Messer, P.W.; Hershberg, R.; Petrov, D.A. Strong Purifying Selection at
Synonymous Sites in D. melanogaster. PLoS Genet. 2013, 9, e1003527
88. Poczai, P.; Hyvönen, J. The complete chloroplast genome sequence of the CAM epiphyte
Spanish moss (Tillandsia usneoides, Bromeliaceae) and its comparative analysis. PLoS One
2017, 12, e0187199
89. Menezes, A.P.A.; Resende-Moreira, L.C.; Buzatti, R.S.O.; Nazareno, A.G.; Carlsen, M.;
Lobo, F.P.; Kalapothakis, E.; Lovato, M.B. Chloroplast genomes of Byrsonima species
(Malpighiaceae): Comparative analysis and screening of high divergence sequences. Sci.
Rep. 2018, 8, 2210
90. Zahra, N.B.; Shinwari, Z.K.; Qaiser, M. DNA barcoding: A tool for standardization of
herbal medicinal products (HMPs) of Lamiaceae from Pakistan. Pak. J. Bot. 2016, 48,
2167–2174.
91. Xin, T.; Xu, Z.; Jia, J.; Leon, C.; Hu, S.; Lin, Y.; Ragupathy, S.; Song, J.; Newmaster, S.G.
Biomonitoring for traditional herbal medicinal products using DNA metabarcoding and
single molecule, real-time sequencing. Acta Pharm. Sin. B 2018, 8, 488–497
Preprints (www.preprints.org) | NOT PEER-REVIEWED | Posted: 11 March 2020 doi:10.20944/preprints202003.0181.v1
Peer-reviewed version available at Plants 2020, 9, 752; doi:10.3390/plants9060752
20
Figure 1. Structural comparison of Withania plastid genomes. Green and orange blocks in the
beginning and end of sequences indicate the orientation of sequences. The colored blocks outside
the sequences refer to the score/max bit core ration, with ≤0.25, green ≤0.50, orange ≤0.75, and
red >0.75. Inverted repeat (IR) regions are represented by blue blocks.
Preprints (www.preprints.org) | NOT PEER-REVIEWED | Posted: 11 March 2020 doi:10.20944/preprints202003.0181.v1
Peer-reviewed version available at Plants 2020, 9, 752; doi:10.3390/plants9060752
21
Figure 2. Gene maps of the plastomes of Withania species. From the center going outward, the
first circle shows the forward and reverse repeats connected with red and green arcs respectively.
The next circle shows the tandem repeats marked with short bars, while inverted repeat (IR)
regions are represented by black bars. The third circle shows the microsatellite sequences
identified using MISA. The fourth circle shows the gene structure on the plastid genome, where
genes are colored based on their functional categories. GC content is plotted as a green line while
a skewed GC plot is presented as an orange/black track around the inner circles.
Preprints (www.preprints.org) | NOT PEER-REVIEWED | Posted: 11 March 2020 doi:10.20944/preprints202003.0181.v1
Peer-reviewed version available at Plants 2020, 9, 752; doi:10.3390/plants9060752
22
Figure 3. (A) Comparison of amino-acid groups and (B) Comparison of amino-acid frequency
among Withania.
Preprints (www.preprints.org) | NOT PEER-REVIEWED | Posted: 11 March 2020 doi:10.20944/preprints202003.0181.v1
Peer-reviewed version available at Plants 2020, 9, 752; doi:10.3390/plants9060752
23
Figure 4. Indel (A) and nucleotide (B) diversity of various region of chloroplast genome among
Withania species. The plastid genome is represented by a grey bar in a circle, while indel diversity
is plotted as a blue (0 to 2.5) and nucleotide diversity as green (0 to 0.7) line graph.
Preprints (www.preprints.org) | NOT PEER-REVIEWED | Posted: 11 March 2020 doi:10.20944/preprints202003.0181.v1
Peer-reviewed version available at Plants 2020, 9, 752; doi:10.3390/plants9060752
24
Figure 5. Comparative analysis of microsatellite repeats among Withania species (A) Indicates
numbers of various types of microsatellite present in the Withania plastomes. (B) Distribution of
simple sequence repeats (SSRs) in different regions (C) SSR motif distributions in different
regions
Preprints (www.preprints.org) | NOT PEER-REVIEWED | Posted: 11 March 2020 doi:10.20944/preprints202003.0181.v1
Peer-reviewed version available at Plants 2020, 9, 752; doi:10.3390/plants9060752
25
Figure 6. (A) Indicates various types of oligonucleotide repeats that exist in all Withania species
(B) Indicates repeats that exist in ranges of size e.g. 30–35 indicates numbers of repeats within
the size range that vary from 30 to 35 (C) Indicates numbers of repeats that exist in separate areas
of the plastid genome. LSC: large single-copy, SSC: small single-copy, IR: inverted repeat region,
LSC/SSC: one copy of LSC and another in SSC, LSC/IR: one copy of LSC and another in SSC,
IR/SSC: one copy of IR and another in SSC, LSC/SSC/IR: one copy of LSC, one in SSC, and
another in IR, (D) Indicates number of repeats in different regions of plastid genome, IGS:
Intergenic spacer region, CDS: coding DNA sequences, Intron: intronic regions, IGS/Intron: one
copy of the IGS region and another in intronic regions, Intron/CDS: one copy intron region and
another in CDS regions, IGS/CDS: IGS region copy of repeat and one more in coding regions.
Preprints (www.preprints.org) | NOT PEER-REVIEWED | Posted: 11 March 2020 doi:10.20944/preprints202003.0181.v1
Peer-reviewed version available at Plants 2020, 9, 752; doi:10.3390/plants9060752
26
Figure 7. Comparison of tandem repeats among Withania (A) Number of tandem repeats in the
chloroplast genomes (B) Location and number of tandem repeats (C) Tandem repeat number, size,
distribution.
Preprints (www.preprints.org) | NOT PEER-REVIEWED | Posted: 11 March 2020 doi:10.20944/preprints202003.0181.v1
Peer-reviewed version available at Plants 2020, 9, 752; doi:10.3390/plants9060752
27
Figure 8. Comparison of the border positions of the large single-copy (LSC), small single-copy
(SSC), and inverted repeat (IR) regions among the chloroplast genomes of four Withania species.
The positive-strand transcribed genes are indicated under the line, while the genes that are
transcribed by negative-strand are indicated above the line. Gene names are indicated in boxes,
and their lengths of relative regions are shown above the boxes. The number of bp (base pairs) that
are written with the genes revealed part of the genes that exist in or away from the region of the
chloroplast, i.e. bp written with ycf1 indicates that that sequence exists in that region of the plastid
genome.
Preprints (www.preprints.org) | NOT PEER-REVIEWED | Posted: 11 March 2020 doi:10.20944/preprints202003.0181.v1
Peer-reviewed version available at Plants 2020, 9, 752; doi:10.3390/plants9060752
28
Figure 9. Maximum likelihood (ML) tree showing the position of Withania species. The tree was
reconstructed based on 74 protein-coding plastid genes of 19 Solanaceae species. Numbers
represent ultrafast bootstrap approximation scores.
Preprints (www.preprints.org) | NOT PEER-REVIEWED | Posted: 11 March 2020 doi:10.20944/preprints202003.0181.v1
Peer-reviewed version available at Plants 2020, 9, 752; doi:10.3390/plants9060752
29
Table 1. Comparison and general features of chloroplast genomes of Withania somnifera,
Withania adpressa, Withania coagulans, Withania riebeckii.
Characteristics Withania
somnifera
Withania
coagulans
Withania
adpressa
Withania
riebeckii
Size (base pair; bp) 154,386 154,216 154,361 154,198
LSC length (bp) 85,688 85,683 85,760 85,675
SSC length (bp) 18,464 18,457 18,457 18,469
IR length (bp) 25,117 25,038 25,071 25,027
Number of genes 132 132 132 132
Protein-coding genes 86 86 86 86
tRNA genes 37 37 37 37
rRNA genes 8 8 8 8
Duplicate genes 18 18 18 18
GC content
Total (%) 37.7% 37.7% 37.7% 37.7%
LSC (%) 35.7% 35.7% 35.7% 35.7%
SSC (%) 31.8% 31.8% 31.8% 31.8%
IR (%) 43.2% 43.2% 43.2% 43.2%
CDS (%) 38.2% 38.2% 38.2% 38.2%
rRNA (%) 55.3% 55.3% 55.3% 55.3%
tRNA (%) 53% 52.9% 53% 53%
All gene % 40% 39.8% 39.8% 39.8%
Protein coding part (CDS) (%bp) 50.9% 51.0% 51.0% 51.0%
All gene (%bp) 72.06% 72.11% 72.07% 72.13%
Non-coding region (%bp) 27.94% 27.89% 27.93% 27.87%
Preprints (www.preprints.org) | NOT PEER-REVIEWED | Posted: 11 March 2020 doi:10.20944/preprints202003.0181.v1
Peer-reviewed version available at Plants 2020, 9, 752; doi:10.3390/plants9060752
30
Table 2. Genes of chloroplast genomes of Withania adpressa, Withania coagulans, Withania
riebeckii.
Category
for gene Group of gene Name of gene
Photosynthesis-
related genes
Photosystem Ⅰ psaA psaB psaC psaI psaJ
Photosystem Ⅱ
psbA PsbB psbC psbD psbE
psbF psbH psbI psbJ psbK
psbL psbM psbN
Cytochrome
b/f complex
psbT psbZ petN petA petL
petG petD* petB*
ATP synthase atpI atpH atpA atpF* atpE
atpB
Assembly/stability
of photosystem Ⅰ ycf3** ycf4
NADPH
dehydrogenase
ndhB*,a, ndhH ndhA* ndhI ndhG
ndhJ ndhE ndhF ndhC ndhK
ndhD
Rubisco rbcL
Transcription
and translation
related genes
RNA genes
Transcription
Small subunit
of ribosome
rpoA rpoC2 rpoC1* rpoB rps16*
rps7a, rps15 rps19 rps3 rps8
rps14 rps11 rps12a,* rps18 rps4
rps2
Large subunit
of ribosome
rpl2a,* rpl23a, rpl32 rpl22 rpl14
rpl33 rpl36 rpl20 rpl16*
Ribosomal RNA rrn16a, rrn4.5a, rrn5 a, rrn23a
Transfer RNA
trnV-
GACa
. trnI-
CAU,*
trnA-
UGCa,* trnN-GUUa
trnP-
UGG
trnW-
CCA,
trnV-
UAC*
trnL-
UAA* trnF-GAA trnRACGa
trnT-
UGU
trnG-
UCCa,,*,
trnT-
GGU trnR-UCU
trnE-
UUC
trnY-
GUA
trnD-
GUC
trnC-
GCA trnS-GCU trnH-
GUG
trnK-
UUU
trnQ-
UUG
trnfM-
CAU trnG-GCC
trnS -
UGA
trnS -
GGA
trnF-
GAA
trnM-
CAU trnL-CAA*
trnI-
GAU*,a
trnL -
UAG
Other genes
RNA processing matK
Carbon
metabolism cemA
Fatty acid
synthesis accD
Preprints (www.preprints.org) | NOT PEER-REVIEWED | Posted: 11 March 2020 doi:10.20944/preprints202003.0181.v1
Peer-reviewed version available at Plants 2020, 9, 752; doi:10.3390/plants9060752
31
Proteolysis clpP**
Component of
TIC complex ycf1a
Hypothetical
proteins ycf2a Ycf15
* Gene with one intron, ** Gene with two introns, a Gene with two copies, Same genes in all
Withania species.
Table 3. Comparison of substitution in Withania species
Types Withania coagulans
Withania adpressa
Withania riebeckii
A/G 4 20 26
C/T 13 15 26
A/C 3 11 17
C/G 2 3 4
G/T 1 14 25
A/T 5 4 12
Total 28 67 110
LSC 22 44 79
SSC 0 20 31
IR 6 3 8
Withania somnifera was used as reference for SNPs detection.
Table 4. Distribution of InDels in Withania chloroplast genome.
Withania coagulans InDel length (bp) InDel average length
LSC 29 105 3.621
SSC 5 49 9.80
IR 8 87 10.87
Withania adpressa InDel length (bp) InDel average length
LSC 30 146 4.867
SSC 6 11 1.833
IR 6 72 12.0
Withania riebeckii InDel length (bp) InDel average length
LSC 34 163 4.794
SSC 6 103 17.16
IR 4 104 26.0
Preprints (www.preprints.org) | NOT PEER-REVIEWED | Posted: 11 March 2020 doi:10.20944/preprints202003.0181.v1
Peer-reviewed version available at Plants 2020, 9, 752; doi:10.3390/plants9060752
32
Table 5. Mutational hotspots among Withania species.
S. No Region Nucleotide
Diversity
Total number
of InDel sites
Number of sites
1 rps16-trnQ-UUG 2.5 31 1229
2 rbcL-accD 2.5 20 783
3 clpP 2.49333 8 1999
4 trnL-UAA-trnF-GAA 1.667 11 300
5 ndhA 2.08808 10 2254
6 petN-psbM 1.5 4 737
7 trnT-psbD 1.5 9 1176
8 trnp-UGG-psaJ 1.5 7 429
9 trnI-ycf2 1.5 8 88
10 rpl32-trnL-UAG 1.5 3 856
11 rpl14-rpl16 1.167 2 125
12 trnK-UUU-rps16 1 2 678
13 rpoB-trnC-GCA 1 11 1313
14 ycf3 1 2 1993
15 petG-trnW-CCA 1 2 131
16 clpP-psbB 1 2 445
17 ycf15-trnV-GAC 1.00509 12 498
Preprints (www.preprints.org) | NOT PEER-REVIEWED | Posted: 11 March 2020 doi:10.20944/preprints202003.0181.v1
Peer-reviewed version available at Plants 2020, 9, 752; doi:10.3390/plants9060752