Shortwave aerosol radiative forcing from Terra 1 Shortwave Aerosol Radiative Forcing from MODIS and CERES Observations over the Oceans Sundar A. Christopher* and Jianglong Zhang Department of Atmospheric Sciences University of Alabama, Huntsville Submitted to Geophysical Research Letters January 25, 2002 Revised version submitted: March 1, 2002 * Author to whom correspondence should be addressed Sundar A. Christopher Department of Atmospheric Sciences, NSSTC University of Alabama in Huntsville 320 Sparkman Drive Huntsville, AL 35806 Phone: (256) 961 – 7872 Fax: (256) 961 – 7755 Email: [email protected]
Transcript
Shortwave aerosol radiative forcing from Terra
1
Shortwave Aerosol Radiative Forcing from MODIS and CERES Observations over the Oceans
Sundar A. Christopher* and Jianglong Zhang
Department of Atmospheric Sciences University of Alabama, Huntsville
Submitted to
Geophysical Research Letters January 25, 2002
Revised version submitted: March 1, 2002
* Author to whom correspondence should be addressed Sundar A. Christopher Department of Atmospheric Sciences, NSSTC University of Alabama in Huntsville 320 Sparkman Drive Huntsville, AL 35806 Phone: (256) 961 – 7872 Fax: (256) 961 – 7755 Email: [email protected]
Using spatially and temporally collocated data sets from the Clouds and Earth's Radiant
Energy System (CERES) and Moderate-Resolution Imaging Spectroradiometer (MODIS)
instruments on the Terra satellite, a new strategy is presented for studying the Shortwave Aerosol
Radiative Forcing (SWARF) over the global oceans for September 2000. Using collocated data,
the global averaged optical thickness (τ0.55) for cloud-free CERES pixels is 0.07 with a SWARF
of -6 Wm-2. The spatial patterns of tropospheric aerosols are clearly seen from satellite
observations. The τ0.55 and SWARF values derived from two independent instruments are in
excellent agreement with the following relationship: SWARF = 0.35 -105.34τ0.55 +61.47τ0.552 (0
≤ τ0.55 ≤ 0.7)Wm-2. The synergistic use of the MODIS and CERES data sets can be used to
provide independent estimates of SWARF, and can be used as a validation tool for studies that
attempt to model the role of aerosols on climate.
Shortwave aerosol radiative forcing from Terra
3
1. Introduction
Aerosols play a key role on the radiation balance of the earth-atmosphere system. The study
of the radiative effects of tropospheric aerosols including mineral dust, organic carbon, black
carbon, and sulfate have proved to be a challenging task due to the spatial and temporal
variability of aerosol distribution and its properties. Current estimates of Shortwave Aerosol
Radiative Forcing (SWARF) for biomass burning and fossil fuel aerosols range from -0.1 to -0.5
Wm-2 and -0.1 to -1.0 Wm-2 respectively, and the sign and magnitude of the radiative effect is
still uncertain [IPCC, 2001]. Typical approaches for studying the radiative forcing of aerosols
include: (1) Use of radiative transfer equations to calculate radiative forcing of optically thin
aerosols [e.g. Penner et al., 1992]; (2) Use of General Circulation Models (GCM) [e.g. Hansen
et al., 1998]; and (3) Use of satellite-derived aerosol distributions and aerosol optical thickness
(τ) to calculate the effect of aerosols in radiative transfer models [e.g. Christopher et al., 2002].
Recently, several studies have shown the potential of satellite-retrieved top-of-the-atmosphere
(TOA) fluxes to examine the radiative effect of aerosols. Haywood et al., [1999] compared TOA
shortwave (SW) fluxes derived from the Earth Radiation Budget Experiment (ERBE) and a
GCM model to study the radiative effect of aerosols. Christopher et al., [2000] studied the
radiative effect of biomass burning over Central America by using collocated Clouds and Earth's
Radiant Energy System (CERES) and Visible Infrared Scanner (VIRS) measurements from the
Tropical Rainfall Measuring Mission (TRMM) platform. Using VIRS and CERES data, Loeb
and Kato [2002] have extended this approach to study the direct radiative forcing of aerosols
over the oceans. This approach of using combined satellite measurements provides an
independent method for studying the impact of aerosols on climate. NASA’s suite of well-
calibrated sensors on the Terra satellite provides an unprecedented opportunity to study the effect
Shortwave aerosol radiative forcing from Terra
4
of aerosols on climate. In this paper, we estimate the SWARF in cloud free regions over the
global oceans using a combination of CERES and Moderate-Resolution Imaging
Spectroradiometer (MODIS) data sets from Terra.
2. Data and Methodology
Three data sets are used in this study; the MODIS Level 2 (MOD04) daily aerosol product
[Tanré et al., 1997; Kaufman et al., 1997]; the MODIS Level 2 daily (MOD06) cloud product
[Ackerman et al., 1998], and the pixel level CERES ES-8 at a spatial resolution of 30km at nadir
[Wielicki et al., 1996]. The MOD04 and MOD06 provide aerosol and cloud properties and
CERES ES-8 data provides TOA SW fluxes. The CERES ES-8 data contains broadband TOA
SW (0.3-5 µm) and longwave (5.0-50.0 µm) fluxes that are inverted from measured radiances
using Angular Distribution Models (ADM’s) developed for the Earth Radiation Budget Program
(ERBE) program [Wielicki and Green, 1989; Wielicki et al., 1996]. Errors in scene
misidentification are estimated to be on the order of 14% [Dieckmann and Smith, 1989].
Although the ES-8 do not include aerosol specific ADM’s, recent research shows that the
uncertainties in using ERBE ADM’s instead of ADMs for biomass burning aerosols over land is
on the order of 10% [Li et al. 2000]. In this study, since we use only cloud-free CERES pixels
over oceans, we expect the uncertainties to be less than 10%.
Using measured radiances at 500m spatial resolution from six bands between 0.55-2.1 µm,
the primary aerosol products retrieved by the MODIS algorithm include spectral aerosol optical
thickness, the aerosol effective radius (re), and the fraction of the total optical thickness
contributed by the sub-micron size mode aerosol [Tanré et al., 1997]. These aerosol properties
are then reported at 10km spatial resolution in the MOD04 data. The MODIS aerosol optical
Shortwave aerosol radiative forcing from Terra
5
thickness retrieval over ocean is implemented using a look-up-table approach with 11 sets of
aerosol models as inputs [Tanré et al., 1997]. Based on theoretical sensitivity studies, the
uncertainties in τ0.55 retrievals are estimated to be ± 0.05 ± 0.05τ0.55 over ocean [Tanré et al.,
1997]. The MODIS aerosol optical thickness product has been validated against sunphotometer
derived values over oceans and recent results have confirmed that the MODIS algorithm over
ocean areas is performing within the expected accuracy [Remer et al., 2002b].
The MOD06 product provides cloud top parameters, such as cloud top pressure and cloud top
temperature, at 5 km resolution and cloud optical parameters, such as cloud optical thickness and
cloud effective radius, at 1 km resolution [King et al., 1992; Ackerman et al., 1998]. The MOD06
data also provides cloud fraction at both 1 and 5 km resolution. In this study, we take each
CERES footprint and collocate the 5km- MOD06 data to identify cloud-free regions. For these
cloud free regions, we obtain aerosol properties from the MOD04 data. Twenty-nine days of
global CERES and MODIS (MOD04 and MOD06) data in September 2000 were used in this
study (CERES ES-8 data from September 17th was unavailable) and is roughly equivalent to
about 500GB of data.
On Terra, there are two identical CERES instruments. One instrument operates in a cross
track scan mode similar to that of the ERBE scanner while the second instrument operates in a
biaxial scan mode to provide new angular flux information [Wielicki et al., 1996]. In this study,
only the cross track scan mode data is used. The CERES pixels that are labeled as “clear ocean”
by the CERES ES-8 data [Wielicki and Green, 1989] were first selected. However, due to the
large footprint of the CERES scanner, these pixels could still have some cloud contamination. To
eliminate these cloud effects, the MOD06 data is collocated with the CERES data and only those
CERES pixels with a 0% cloud fraction as identified by the MOD06 data were used. By using
Shortwave aerosol radiative forcing from Terra
6
such a stringent cloud screening criteria, it is possible that thick aerosol plumes are rejected in
the analysis.
The SWARF* at the top of the atmosphere (TOA) is defined as the difference between clear
(Fclr ) and aerosol (Faer) fluxes [Christopher et al., 2000]. In this study, Fclr and Faer were
averaged over 2°×2° (latitude×longitude) bins. The Faer values are obtained by averaging the
cloud free CERES ES-8 data within a 2°×2° bin. However, Fclr is more difficult to obtain because
when aerosol loading is low, satellite imagers are not effective in detecting aerosols [Remer et
al., 2002a]. Tanré et al., [1997] estimated the uncertainties in MOD04 aerosol optical thickness
product to be ± 0.05 ± 0.05τ over ocean. In this study, on an average, the SW flux increases by
about 5Wm-2 when the MODIS τ0.55 changes from values near zero to values near 0.05. On a
regional basis, King et al., [1999] estimated that the uncertainties in MODIS aerosol optical
thickness retrievals over ocean is 0.01 ± 0.05τ for selected cases during the Tropospheric
Aerosol Radiative Forcing Observational Experiment (TARFOX). To obtain Fclr values, we use
cloud free CERES pixels that have τ0.55 < 0.02, as determined by the MODIS data. Due to this
assumption, our first order estimation shows that the uncertainties in Fclr is on the order of 1Wm-
2.
3. Results and Discussion
Figure 1a and 1b show the global distribution of MODIS-retrieved τ0.55 and CERES-derived
SWARF for collocated cloud-free MOD04 and CERES ES-8 data over ocean areas. We
emphasize that the aerosol optical thickness shown in Figure1a is reported for cloud-free CERES
pixels. Therefore some aerosol features are not seen due to the possible cloud contamination and
* SWARF = Fclr - Faer, where Faer is the TOA SW flux in aerosol regions, and Fclr is the TOA clear sky flux.
Shortwave aerosol radiative forcing from Terra
7
stringent cloud screening procedure (see section 2). Remer et al., [2002b] show the full range of
aerosol optical thickness for September 2000. For example, smoke from South Africa and
pollution from the Indian subcontinent that is seen in Remer et al., [2002b] is not seen in Figure
1a due to cloud contamination or misidentification of aerosol pixels as being cloudy. Therefore
the aerosol optical thickness values reported in this study for cloud-free CERES pixels could be
smaller than those reported by Remer et al., [2002b]. The spatial distribution of τ0.55 and SWARF
derived from two independent sets of measurements are remarkably consistent. Missing data
shown in gray is often due to persistent cloud coverage often observed over the West Coast of
South America and Africa [e.g. Albrecht et al., 1995], and over the Intertropical Convergence
(ITCZ). The spatial distribution of τ0.55 is consistent with previously reported values [Husar et
al., 1997; Remer et al., 2002b]. The regions with τ0.55 values greater than 0.15 are dominated by:
(1) dust plumes over the Atlantic ocean and the Mediterranean sea originating from North
Africa; (2) biomass burning aerosols over the Indian ocean and South Atlantic ocean from South
Africa and smoke aerosols over the Indian Ocean from Australia [e.g. Olson et al., 1999]; (3)
Pollutant aerosols from East Asia to the North Pacific ocean and from Europe to the North
Atlantic Ocean. The averaged τ0.55 and SWARF values are 0.07 (Figure 1a) and -6 Wm-2(Figure
1b) respectively for cloud-free regions as observed by CERES. Superimposed on Figure 1a are
six boxes, which represent selected regions over the ocean and are labeled after the closest
aerosol source regions (except Remote Ocean). The six areas are (1) South Africa (SA) (0-40°S,
30-50°E), (2) Australia (AUS) (0-20°S, 110-130°E), (3) East Asia (EA) (20-40°N, 110-130°E),
(4) North Africa (NAF) (10-30°N, 10-40°W), (5) North America (NAM) (20-40°N, 60-80°W),
and (6) Remote Ocean (RO) (20-40°S, 100-120°W).
Figure 1c shows the relationship between MODIS-retrieved τ0.55 versus the CERES-derived
Shortwave aerosol radiative forcing from Terra
8
SWARF. The aerosol optical thickness and SWARF derived from two independent methods are
highly correlated. The SWARF is most sensitive to τ0.55 changes when τ0.55 is low and less
sensitive to τ0.55 changes when the aerosol loading is high. For example, a change in τ0.55 from 0
to 0.05 causes a change in SWARF of -5.1 Wm-2 and a change in τ0.55 from 0.45 to 0.5 causes a
change in SWARF of -2.3 Wm-2. A second order polynomial fit through data points yields the
following relationship: SWARF = 0.35 -105.34τ0.55 +61.47τ0.552 (0 ≤ τ0.55 ≤ 0.7) Wm-2. However,
this relationship was developed for only one month of data and may change significantly for
other months.
Figure 1d shows the τ0.55 versus the cloud-free SW flux for the six selected regions. The
globally averaged value is indicated by the solid black line. When the τ0.55 is less than 0.2, the
relationship between SWARF and τ0.55 is similar among the different regions (except for NAF)
because when aerosol loading is low, the background aerosols are major contributors to SWARF.
The NAF region dominated by dust aerosols is most efficient in reflecting incoming solar energy
when compared with other regions. The aerosols from the SA and AUS source regions have
lower SWARF values when τ0.55 is greater than 0.2. The slopes of τ0.55 vs. SW flux for the SA
and AUS regions are very similar, which implies that the aerosols in these two regions have
similar radiative properties where the dominant aerosol type is from biomass burning [Husar et
al., 1997; Olson et al., 1999]. Recent studies show that the single scattering albedo (ωo) of dust
and smoke aerosols at 0.64 µm is 0.97 [Kaufman et al., 2001] and 0.86 [Reid et al., 1998]
respectively. The higher ωo values of dust leads to higher TOA SW values when compared with
SW flux values for regions dominated by biomass burning and pollutant aerosols. The slope of
τ0.55 vs. SW flux for the EA region is between that of dust and smoke regions. The dominant
aerosol type is from industrial pollution that has different aerosol radiative characteristics when
Shortwave aerosol radiative forcing from Terra
9
compared with dust and smoke aerosols.
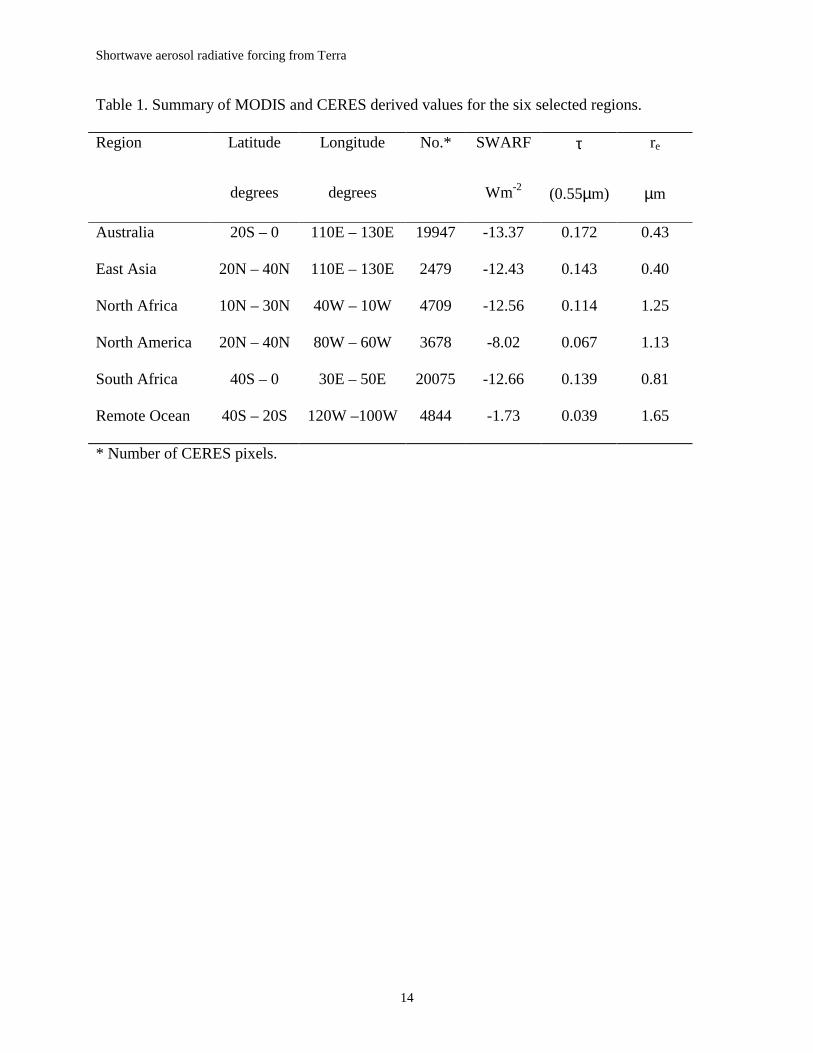
Table 1 summarizes the results for the six regions. The lowest averaged τ0.55 of 0.039 is
observed over the RO region with a SWARF value of -1.73 Wm-2. The highest averaged τ0.55 of
0.17 is found near Australia with a SWARF value of -13.37 Wm-2. The EA and SA regions have
similar τ0.55 and SWARF values. However, the NAF region has a SWARF value of -12.56 Wm-2,
that is similar to SWARF values over EA and SA regions with a lower τ0.55 of about 0.114. This
indicates the differences in aerosol radiative characteristics between regions dominated by dust
(NAF), biomass burning (SA), and pollutant aerosols (EA). The aerosol effective radii (re) are
1.25 and 1.65 µm for NAF and RO regions respectively. The predominant aerosol type in NAF is
dust aerosol with re on the order of 1.5-2.5 µm [Kaufman et al., 2001]. The dominant aerosol
type over the RO is sea salt, that has a similar or even larger peak effective radius when
compared with dust aerosols [Andreas, 1998]. In comparison, the re values are smaller for SA,
AUS, and EA regions because aerosols in these regions are dominated by either smoke or
pollutant aerosols with re values on the order of 0.1~0.2 µm [Kaufman et al., 1997; Reid et al.,
1998].
4. Conclusions
This study shows a new strategy for studying the effect of aerosols on the radiation balance
of the earth-atmosphere system through synergistic use of multiple instruments on the same
satellite. However, the uncertainties involved in this study should be carefully examined in future
studies. One of the uncertainties that arise from this approach is the lack of ADM’s for aerosols.
New strategies for developing ADM’s for aerosols must be developed as a function of aerosol
type and optical thickness. The biaxial scan mode data from CERES on Terra can be used to
Shortwave aerosol radiative forcing from Terra
10
develop such ADM’s. Other sources of uncertainty include estimation of Fclr in persistent cloudy
areas and the effect of surface conditions such as wind speed. The focus of this paper was to
examine the global aerosol direct radiative forcing over ocean for cloud free conditions.
Averaged over the entire month, for cloud-free CERES pixels, the τ0.55 is 0.07 and SWARF is –6
Wm-2. This is a first step towards the study of global aerosol radiative forcing using satellite
measurements. The next challenging step is to extend this work over land regions where the
surface effects play an important role. The strengths of other instruments such as the Multi-angle
Imaging SpectroRadiometer (MISR) with several view angles can also be utilized to reduce the
uncertainties in SWARF.
Acknowledgements
This research was partially supported by NASA grant NCC8-200 under the Global Aerosol
Climatology Project. The CERES data were obtained from the NASA Langley Research Center
Atmospheric Sciences Data Center and the MODIS data were obtained through the Goddard
Space Flight Center Data Center. We also thank the CERES science team for providing the
CERES point spread function and geolocation information.
References
Ackerman, S. A., K. I. Strabala, W. P. Menzel, R. A. Frey, C. C. Moeller, and L. E. Gumley, Discriminating clear sky from clouds with MODIS, J. Geophys. Res., 103, 32193-32140, 1998.
Albrecht, B. A., C. S. Bretherton, D. Johnson, W. H. Schubert, and A. S. Frisch, The Atlantic Stratocumulus Transition Experiment (ASTEX). Bull. Am. Meteorol. Soc, 76, 889-904, 1995.
Andreas, E. L., A new sea spray generation function for wind speeds up to 32ms-1, J. Phys. Oceanogr., 28, 2175-2184, 1998.
Shortwave aerosol radiative forcing from Terra
11
Christopher, S. A, J. Chou, J. Zhang, X. Li and R. M. Welch, Shortwave direct radiative forcing of biomass burning aerosols estimated from VIRS and CERES, Geophys. Res. Lett., 27, 2197-2200, 2000.
Christopher, S. A., and J. Zhang, Daytime variation of shortwave direct radiative forcing of biomass burning aerosols from GOES 8 imager, J. Atmos. Sci., 59, 681-691, 2002.
Dieckmann, F. J., and G. L. Smith, Investigation of scene identification algorithms for radiation measurements, J. Geophys. Res., 94, 3395-3412, 1989.
Hansen, J., M. Sato, A. Lacis, R. Ruedy, I. Tegen, and E. Matthews, Climate forcings in the Industrial era, Proc. Natl. Acad. Sci., 95, 12,753-12,758, 1998.
Haywood, J. M., V. Ramaswamy, and B. J. Soden, Tropospheric aerosol climate forcing in clear-sky satellite observations over the oceans, Science, 283, 1299-1303, 1999.
Husar R. B., J. M. Prospero, and L. L. Stowe, Characterization of tropospheric aerosols over the oceans with the NOAA advanced very high-resolution radiometer optical thickness operational product, J. Geophys. Res., 102, 16889-16909, 1997.
Intergovernmental Panel on Climate Change (IPCC), Climate change 2001, The scientific basis, Cambridge University Press, 881pp, 2001.
Kaufman Y.J., D. Tanré, L. A. Remer, E. Vermote, A. Chu and B. N. Holben, Operational remote sensing of tropospheric aerosol over land from EOS moderate resolution imaging spectroradiometer, J. Geophys. Res., 102, 17051-17067, 1997.
Kaufman Y.J., D. Tanré, O. Dubovik, A. Karnieli, and L.A. Remer, Absorption of sunlight by dust as inferred from satellite and ground-based remote sensing, Geophys. Res. Lett., 28, 1479-1482, 2001.
King, M. D., Y. J. Kaufman, W. P. Menzel, and D. Tanre, Remote sensing of cloud, aerosol, and water vapor properties from the Moderate Resolution Imaging Spectrometer (MODIS), IEEE Trans. Geosci. Remote Sens., 30, 2-27, 1992.
King, M.D., Y.J. Kaufman, D. Tanré, and T. Nakajima, Remote sensing of tropospheric aerosols from space: Past, Present, and Future, Bull. Am. Meteorol. Soc., 80, 2229-2259, 1999.
Li, X., S.A. Christopher, J. Chou, and R.M. Welch, Estimation of shortwave direct radiative forcing of biomass burning aerosols using angular dependence models. J. Appl. Meteor., 39, 2278-2291, 2000.
Loeb, N. G., and S. Kato, Top-of-Atmosphere direct radiative effect of aerosols from the Clouds and the Earth's Radiant Energy System Satellite instrument (CERES), J. Climate, in press, 2002.
Olson, J., R., B. A. Baum, D. R. Cahoon, and J. H. Crawford, Frequency and distribution of forest, savanna, and crop fires over tropical regions during PEM-Tropics A, J. Geophys. Res., 104, 5865-5876, 1999.
Penner, J. E., R. E. Dickinson, and C. A. O’Neill, Effects of aerosol from biomass burning on the global radiation budget, Science, 256, 1432-1434, 1992.
Reid, J. S., P. V. Hobbs, R. J. Ferek, D. R. Blake, J. V. Martins, M. R. Dunlap, and C. Liousse, Physical, chemical and optical properties of regional hazes dominated by smoke in Brazil, J. Geophys. Res., 103, 32059-32080, 1998.
Remer, L. A., Y. J. Kaufman, Z. Levin and S. Ghan, Model assessment of the ability of MODIS to measure top of atmosphere direct radiative forcing from smoke aerosols. J. Atmos. Sci., 59, 657-667, 2002a.
Shortwave aerosol radiative forcing from Terra
12
Remer, L. A., D. Tanré, Y. J. Kaufman, C. Ichoku, S. Mattoo, R. Levy, D. A. Chu, B. N. Holben, O. Dubovik, A. Smirnov, J. V. Martins, R. R. Li, and Z. Ahmad, Validation of MODIS aerosol retrieval over ocean, Geophys. Res. Lett., (2002b, in press).
Tanré, D., Y.J. Kaufman, M. Herman and S. Mattoo, Remote sensing of aerosol properties over oceans using the MODIS/EOS spectral radiances, J. Geophys. Res., 102, 16971-16988, 1997.
Wielicki, B. A., B. R. Barkstrom, E. F. Harrison, R. B. Lee III, G. L. Smith, and J. E. Cooper, Clouds and the Earth's Radiant Energy System (CERES): An Earth observing system experiment, Bull. Am. Meteorol. Soc., 77, 853-868, 1996.
Wielicki, B. A., and R.N. Green, Cloud identification for ERBE radiative flux retrieval, J. Appl. Meteorol., 28, 1133-1146, 1989.
Shortwave aerosol radiative forcing from Terra
13
Figure Captions
Figure 1a. Spatial distribution of MODIS τ0.55 over the global ocean for cloud-free CERES
pixels. Missing data for cloud cover shown in gray and the six selected regions (see text) are
shown in red boxes. Remer et al., [2002] show the full range of MODIS τ0.55.
Figure 1b. Spatial distribution of CERES-derived SWARF over global ocean.
Figure 1c. MODIS retrieved τ0.55 versus CERES SWARF. A second-order polynomial fit is
shown by the solid red line.
Figure 1d. Averaged MODIS τ0.55 vs. CERES SW fluxes for six selected regions. Solid black
line shows the globally averaged values.
Shortwave aerosol radiative forcing from Terra
14
Table 1. Summary of MODIS and CERES derived values for the six selected regions.