Date: 5 th May, 2014 Shri Sanjeev Banzal, Advisor (NSL II), Telecom Regulatory Authority of India (TRAI) Mahanagar Doorsanchar Bhawan Jawaharlal Nehru Marg New Delhi-110002 Subject: Broadband India Forum response to TRAI consultation paper on Allocation & pricing of Microwave Access and Microwave Backbone Carriers dated 28 th March, 2014 Dear Sir At the outset, we wish to thank TRAI for publication of this important consultation paper “Recommendation for allocation and pricing of Microwave Access (MWA) and Microwave Backbone (MWB) RF carriers” dated 28th March 2014. Broadband India Forum is a non profit non political forum which has been set up to advocate, enhance, expand and usher true value of broadband potential for value addition, so that common citizen of India avail of the advantages of the service in their daily life with ease and affordability. To become the primary advocate for developing an eco system for the delivery of broadband in the country, encouraging e-governance, e-commerce and m- commerce, facilitating content development and aggregation networks, providing a platform to discuss and evolve strategies to achieve the shared aspirations of the industry, providing and promoting the effectiveness of interactivity features and educating the communities about the core strengths and competencies of the Broadband Access Technologies. Following the new developments in the cellular network pertaining to rapid growth of data traffic and the arising subsequent need for increasing the backhaul capacity, this consultation paper assumes significant importance. More particularly, the decision to include new high frequency bands in this paper , was extremely well received by all our members comprising of the leading operators viz. Vodafone, Airtel, etc as well as the leading vendors of the Point-to-point and Point-to-Multipoint and those of E band and V band viz. Siklu, Ericsson, Cambridge Broadband etc and also by those who are exclusively designing chipsets for these new “ Millimeter wave technologies “ viz. Broadcom . The entire ecosystem feels that whether it is 3G/4G small cells or WiFi offload, there is also a growing interest in using E Band ( 71-76Ghz, 81-86 Ghz ) as well as 60GHz unlicensed (in many parts of the world) spectrum for high capacity backhaul. Keeping in view the obvious congestion and the constraints in data carrying capacity of traditional legacy Microwave bands , we believe that low cost, small form factor, high capacity E-band and V band systems makes India potentially as one of the world’s largest markets for such next –generation( NG ) wireless backhaul systems which can leapfrog the laggard optical fibre network thereby making India fully data centric. Your initiative in regulating and streamlining this sector we believe, is likely to bring about a big increase in revenue for operators and thereby to the government as well, besides kickstarting even local manufacturing in this sector.
Transcript
Date: 5th May, 2014
Shri Sanjeev Banzal,
Advisor (NSL II),
Telecom Regulatory Authority of India (TRAI)
Mahanagar Doorsanchar Bhawan
Jawaharlal Nehru Marg
New Delhi-110002
Subject: Broadband India Forum response to TRAI consultation paper on Allocation & pricing
of Microwave Access and Microwave Backbone Carriers dated 28th
March, 2014
Dear Sir
At the outset, we wish to thank TRAI for publication of this important consultation paper “Recommendation for allocation and pricing of Microwave Access (MWA) and Microwave Backbone (MWB) RF carriers” dated 28th March 2014. Broadband India Forum is a non profit non political forum which has been set up to advocate, enhance, expand and usher true value of broadband potential for value addition, so that common citizen of India avail of the advantages of the service in their daily life with ease and affordability. To become the primary advocate for developing an eco system for the delivery of broadband in the country, encouraging e-governance, e-commerce and m- commerce, facilitating content development and aggregation networks, providing a platform to discuss and evolve strategies to achieve the shared aspirations of the industry, providing and promoting the effectiveness of interactivity features and educating the communities about the core strengths and competencies of the Broadband Access Technologies.
Following the new developments in the cellular network pertaining to rapid growth of data traffic and
the arising subsequent need for increasing the backhaul capacity, this consultation paper assumes
significant importance. More particularly, the decision to include new high frequency bands in this
paper , was extremely well received by all our members comprising of the leading operators viz.
Vodafone, Airtel, etc as well as the leading vendors of the Point-to-point and Point-to-Multipoint and
those of E band and V band viz. Siklu, Ericsson, Cambridge Broadband etc and also by those who
are exclusively designing chipsets for these new “ Millimeter wave technologies “ viz. Broadcom . The
entire ecosystem feels that whether it is 3G/4G small cells or WiFi offload, there is also a growing
interest in using E Band ( 71-76Ghz, 81-86 Ghz ) as well as 60GHz unlicensed (in many parts of the
world) spectrum for high capacity backhaul. Keeping in view the obvious congestion and the
constraints in data carrying capacity of traditional legacy Microwave bands , we believe that low cost,
small form factor, high capacity E-band and V band systems makes India potentially as one of the
world’s largest markets for such next –generation( NG ) wireless backhaul systems which can
leapfrog the laggard optical fibre network thereby making India fully data centric. Your initiative in
regulating and streamlining this sector we believe, is likely to bring about a big increase in revenue for
operators and thereby to the government as well, besides kickstarting even local manufacturing in this
sector.
After holding a Round Table Discussion with the stake holders on 16 April 2014 and there after
consulting all our members and after several rounds of detailed discussions with them, we are
enclosing the following documents:
1. BIF response to the TRAI Consultation Paper on Allocation & Pricing of MWA/MWB carriers
and
2. White paper on “ Millimeter Wave Technologies “ ( E band, V band & PMP technologies ).
In case of any clarifications, kindly feel free to contact us.
Thanks
Yours sincerely,
Anil Prakash Secretary General Broadband India Forum Suite 304, Gagan Deep 12, Rajendra Place New Delhi- 110008, India Mobile +91-98111 55846, Tel: +91-11-2575 7128 Fax: +91-11-25757129 Skype ID:anil.prakash email. [email protected] , [email protected]
Encl: a/a
BIF RESPONSE ON TRAI CONSULTATION PAPER ON MWA/MWB CARRIERS
BROADBAND INDIA FORUM
The contents of this document are the exclusive privilege of the forum and shall not be replicated
in any form without the exclusive approval of the forum
BIF RESPONSE ON TRAI CONSULTATION PAPER FOR MICROWAVE
ACCESS AND MICROWAVE BACKBONE CARRIERS
CHAPTER-IV: ISSUES FOR CONSULTATION
Q1. How many total Microwave Access and Backbone (MWA/MWB)
carriers should be assigned to a TSP deploying:
a. 2G technology only.
b. 3G technology only.
c. BWA technology only.
d. Both 2G and 3G technologies.
e. 2G and BWA technologies.
f. 2G, 3G and BWA technologies.
Please give rationale & justification for your answer.
BIF Reponse:
Existing DOT guidelines for allocation of MWA and MWB RF carriers for BWA services should
prevail. i.e. % of AGR for MWA carriers and link-by-link for MWB carriers.
In general, total number of carriers to be assigned to a TSP shall be based on a number of factors
viz. aggregate traffic, network topology, growth/spurt in data traffic , number of existing
players , type of technology deployed, the quantum of access spectrum allocated, etc. Also given
the fact that the spectrum usage charges are significantly high, the number of carriers
demanded by a TSP will be for optimum utilisation only .
Taking into account the present utilization of the assigned carriers in various service areas, we
propose 8 MWA carriers in Metro, 4 carriers in A circles, 3 in B&C circles for the existing
operators. The requirements may further increase with evolution of new advanced technologies
requiring additional carriers.
As regards the MWB carriers, since they are deployed to carry backhaul from city to city, 2
carriers will suffice for A,B and C circles to care of the basic minimum requirements for
interference free network.
BIF RESPONSE ON TRAI CONSULTATION PAPER ON MWA/MWB CARRIERS
BROADBAND INDIA FORUM
The contents of this document are the exclusive privilege of the forum and shall not be replicated
in any form without the exclusive approval of the forum
Q2. How many MWA/MWB carriers need to be assigned to TSPs in case
of 2G, 3G and BWA at the start of their services[ i.e. at beginning of
rolling of services] Please justify your answer.
BIF response:
At the beginning of the service, as per existing DOT guidelines, it should be :
-4 carriers in Metros & A circles
-2 carriers in B & C Circles.
However with the spurt/growth in data, the network topology deployed by the operator and
with the overall focus on promotion of broadband, this number may be required to be reviewed.
Q3. Should excess spectrum be withdrawn from existing TSPs?
BIF response:
Since the spectrum usage charges are significantly high, and spectrum allocation is usually made
after proper justification, it is understood that the given spectrum shall be optimally utilised by
the TSP. Also due to huge spurt/growth in data both for 2G and for 3G networks, and given the
operators commitment to the NTP and the BB policy of the GOI , the issue of spectrum
withdrawl just does not arise.
Q4. If yes, what should be the criteria for withdrawal of excess
allocation of MWA and MWB carriers, if any, allocated to the
existing service providers?
BIF response:
No comments-Since answer to Q4 is NO.
Q5. What should be the preferred basis of assignment of MWA/MWB
carriers to the TSPs i.e. ‘exclusive basis assignment’ or ‘link-to-link
based assignment’?
BIF response:
For MWA , it should be on a exclusive basis and for MWB it should be on a link-by-link basis. We
wish to add that for MWB, the assignment on link by basis is justified since the available number
of carriers are limited for assignment (only 8 in 6 GHz and 5 in 7 GHz) to large number of TSPs in
any Service Area and cannot be assigned on exclusive basis. Moreover links deployed are few in
BIF RESPONSE ON TRAI CONSULTATION PAPER ON MWA/MWB CARRIERS
BROADBAND INDIA FORUM
The contents of this document are the exclusive privilege of the forum and shall not be replicated
in any form without the exclusive approval of the forum
numbers being mostly used for inter-city backhaul thus the coordination by WPC will be easy for
interference and subsequent assignment to various operators.
For spectrum in the 10.5, 26, 28Ghz bands used
• For PTP link-by-link basis is preferred
• for PMP, exclusive basis is preferred
Q6. In case ‘exclusive basis’ assignment is preferred, whether MWA and
MWB carriers should be assigned administratively or through
auction. Please comment with full justifications.
BIF response:
No auction. In fact, we suggest that MW spectrum should be bundled along with access
spectrum as a single package. Referring to Table 3.1 of the TRAI paper, we find that MWA
carriers are available in plenty (out of the total 2090 carriers, only 810 carriers have been
assigned and 1280 carriers are available with WPC). The availability can be further increased if
the new frequency bands namely 26 GHz, 28GHz, 32 GHz and 42 GHz in 6-42 GHz range are
explored which are used in other countries for MWA but not being assigned for MW links in
mobile network in India.
TSP after winning the Access Spectrum in auction need the MWA and MWB carriers
immediately to roll out the services without any delay. Hence MW carriers should be
administratively assigned along with Access Spectrum as a critical resource to rollout the access
services to the customers.
Q7. In case ‘link-to-link basis’ assignment is preferred, how the carrier
assignment for different links should be carried out, particularly in
nearby locations?
BIF response:
Carrier assignment for link to link basis has been recommended only for MWB. This requires
coordination by WPC for any interference with the existing operating links of other TSPs. The
operator is required to provide the deployment details like the Geo coordinates of the
connected sites, the link distance, power transmitted and the frequency spot to be deployed etc.
WPC checks with the existing data base of other operators in nearby locations for any
overlap/interference analysis and accordingly assigns the link. In case of any interference issues,
the solutions like use of different polarisation, alternate link paths etc are proposed.
Q8. Considering the fact that different TSPs may require additional
BIF RESPONSE ON TRAI CONSULTATION PAPER ON MWA/MWB CARRIERS
BROADBAND INDIA FORUM
The contents of this document are the exclusive privilege of the forum and shall not be replicated
in any form without the exclusive approval of the forum
carriers at different point of time, what should be the assignment
criteria for allocation of additional carriers for MWA and MWB?
BIF response:
As mentioned in response to Q1, the criteria for additional MWA will largely depend on the
additional BTS/BSC/RNC sites to be installed for coverage & capacity requirements to meet the
growing voice/data traffic and introduction of new generation technologies like LTE/LTE-A. This
will need more MWA carriers to link the newly built sites especially in CBD/dense areas to
connect to the core network. Other limitations like frequency reuse to avoid interference,
mobile network density/ hub density and fibre penetration will also be important. Finally the
TSPs requiring additional carriers must justify his requirement on these criteria.
Q9. How can it be ensured that spectrum carriers assigned are used
optimally and the TSPs are encouraged to move towards the OFC?
BIF response:
Since the spectrum usage charges are significantly high, and spectrum allocation is usually made
after proper justification, it is understood that the given spectrum shall be optimally utilised by
the TSP. Lack of availability of OFC at cell sites/aggregation points and across the entire service
area is a barrier. Government is requested to make OFC available across the city at all cell site
locations. Availability of OFC at reasonable prices would encourage TSPs to switch over.
Fibre rollout being expensive and a slow process due to ROW permissions, etc. the fibre cannot
be expanded at the pace of wireless networks. With the growing number of wireless sites actual
increase in % of fibre pop will take substantial amount of time and cannot be considered today.
The challenges in Fibre laying like road digging by other agencies, widening of roads in urban
areas, shifting of OFC due to Metro tracks in major cities and high maintenance costs are some
of the barriers which discourage going the Fibre way. However many TSPs are already on the job
to replace the MWB links with Fibre wherever feasible and economical.
Q10. Should an upfront charge be levied on the assignment of MWA or
MWB carriers, apart from the annual spectrum charges?
BIF response:
No upfront charges. Only annual spectrum charges.
The entire network (access and backhaul) is an infrastructure, just like roads, and its well-being
promotes the economy. Therefore it is in the regulator’s interest to allow this infrastructure to
BIF RESPONSE ON TRAI CONSULTATION PAPER ON MWA/MWB CARRIERS
BROADBAND INDIA FORUM
The contents of this document are the exclusive privilege of the forum and shall not be replicated
in any form without the exclusive approval of the forum
function the best it could. Since one of the main bottlenecks of this infrastructure happens to be
the backhaul, then the regulator should give the TSPs the motivation to optimize the backhaul of
their network and use his charging policy for that. This includes both the annual spectrum
charge and any additional charge if any. By doing that the regulator should note that the TSPs
have to invest money in deploying equipment to utilize these carriers.
There is a view on Spectrum management that claims that the main asset in great need is the
Access Spectrum (2G/3G/4G), so this is where regulators need to focus on one hand by
allocating more and more spectrum (white space, reverse auction), and on the other hand this
should be the main tool to charge the operator the royalties for the revenues generated from its
use. All other spectrum needs, to build a good and efficient infrastructure for that access
spectrum, should be supplied by the regulator at minimum charges (just cover the cost) so that
infrastructure will help the TSPs generate more revenues which will enable to generate more
revenues to the government
Also it must be borne in mind that all the TSPs have already paid huge spectrum charges for the
access spectrum through the auction route.
Q11. What should be the pricing mechanism for MWA and MWB carriers?
Should the annual spectrum charges be levied as a percentage of
AGR or on link-by-link basis or a combination of the two?
BIF response:
The prevailing pricing mechanism should prevail. For MWA carriers, it should be based on % of
AGR and for MWB carriers, it should be based on link-by-link method.
Q12. In case of percentage AGR based pricing, is there any need to
change the existing slabs prescribed by the DoT in 2006 and 2008?
Please justify your answer.
BIF response:
Yes. In the light of the steep spectrum usage charges for the access spectrum already paid by the
TSP and the significant spectrum charges for the microwave, there is a need to review the price
slabs and make it more reasonable.
Further a lower uniform rate as % of AGR per carrier of 28 MHz bandwidth should be considered
since the SUC is supposed to be marginal to only cover the spectrum management costs. This
uniform rate can be prescribed as 0.05% of AGR per carrier of 28MHz bandwidth (paired) for
both MWA and MWB. The License fee as % of revenue takes care of the increase in revenue and
there is no justification for higher SUC charges.
BIF RESPONSE ON TRAI CONSULTATION PAPER ON MWA/MWB CARRIERS
BROADBAND INDIA FORUM
The contents of this document are the exclusive privilege of the forum and shall not be replicated
in any form without the exclusive approval of the forum
Q13. In case link-by-link based charging mechanism is adopted then:
(a) Should the spectrum be priced differently for different MW
(2) Links in a High Usage Path or in Congested Frequency Band Area
(3) High density geographic location
(*) Note that many countries have the same price in E-Band to any bandwidth
Other metrics to compare to India
When coming to compare the spectrum cost with other countries, we can also look at two more
metrics.
The relative cost of the spectrum compared to the cost of the equipment
Cost of a 100Mbps link in the UK is $4,500 while in India it is $2,800 (from the same vendor). This
difference is coming from the highly competitive nature of the Indian Telecom market, and its high
buying power. This means that even at same cost per link, the relative overhead of the spectrum
fees on the equipment are higher than in the UK. If we also consider the fact that in the UK this
payment is for any channel bandwidth used, that would imply that get to a common ground with
the UK, the annual cost of a 1GHz FDD license should be around 2,500 Rupees
The revenues generated by use of the spectrum
Talking about high capacity links, we discuss mainly the data plans. The cost in the UK is around
£10 per 1Gbyte, which is around 750 Rupees. The cost of 1Gbyte in India is around 600 Rupees in
GSM and already 100 Rupees in CDMA. Since data tariffs in India are at infancy, we can expect an
aggressive price erosion that will bring data tariffs in India to be much lower than in the UK, which
again support our argument that per link prices in India should be lower than UK since they
generate lower revenues.
BIF PERSPECTIVE ON OTHER BANDS ( in 6-42 Ghz )
BIF strongly supports the allocation of the frequency bands 10.15 – 10.65GHz, 24.5 – 26.5GHz and
27.5 – 29.5GHz to point-to-point (PTP) and to point-to-multipoint (PMP)applications. These bands
BIF RESPONSE ON TRAI CONSULTATION PAPER ON MWA/MWB CARRIERS
BROADBAND INDIA FORUM
The contents of this document are the exclusive privilege of the forum and shall not be replicated
in any form without the exclusive approval of the forum
are globally harmonised by the ITU for this applications, and many global companies offer
products conforming to the ITU-R specifications as follows.
10.5GHz 26GHz 28GHz
Rec. F. 1568 [1] Rec. 748-4 Annex 1 [2]
BIF strongly supports the adoption of these ITU-R recommendations as the channel arrangements
for these frequencies.
Introduction to PTMP
Considerations on Point-to-Multipoint (PTMP) for
Regulatory Authorities
Introduction This document gives a high-level overview of modern microwave point-to-multipoint (PTMP)
networks, describing some of the benefits of this technology for common applications such as
mobile broadband backhaul. Yet PMP networks have several drawbacks that limit their use. These
drawbacks compare to standard point-to-point (PTP) system are described as well.
Analysis of the 10.5, 26, 28 GHz bands availability and usage in other countries are summarized in
this document as well.
The recommendation for the regulatory authority is to license the 10.5GHz, 26GHz and 28 GHz
spectrum bands for the use of PTP networks (primary spectrum usage) and of PMP networks
(secondary spectrum usage)
1 10GHz, 26 GHz and 28GHz spectrum use in other countries ITU and ECC recommendations describe both PTP and PMP in these bands for valid deployments
in these discussed bands. Analysis of the use of different countries in these bands shows that:
• Many countries have decided to banned PMP and allocate all the spectrum for PTP
links only. This is due to the limit usage of PMP which will be described later in
this document
• Some countries allocate part of the spectrum for PTP (larger portion of the band)
and part of the spectrum for PMP (smaller portion of the band)
BIF RESPONSE ON TRAI CONSULTATION PAPER ON MWA/MWB CARRIERS
BROADBAND INDIA FORUM
The contents of this document are the exclusive privilege of the forum and shall not be replicated
in any form without the exclusive approval of the forum
• No country found that allocates the entire bands for PMP networks on
• Other bands (different than 10, 26, 28 GHz are not opened for PMP networks at all
In addition to the regulatory bodies implementation, most of today mobile backhaul is done by
PTP links rather than PMP.
1 Why use a point-to-multipoint architecture?
Figure 1: A point-to-multipoint (PTMP) sector serving
five links
The fundamental use case for a PTMP architecture is to create links between a hub site (on the
right in figure 1) and a set of remote sites. Because the hub equipment and the radio frequency
channel between the hub and the remotes are both shared, the cost of the hub equipment and
spectrum is amortised over all the links in the sector. This applies to both capital and operating
expenses.
BIF RESPONSE ON TRAI CONSULTATION PAPER ON MWA/MWB CARRIERS
BROADBAND INDIA FORUM
The contents of this document are the exclusive privilege of the forum and shall not be replicated
in any form without the exclusive approval of the forum
The net result is that, when the average number of links in a sector is more than one, a PTMP
design offers substantially lower per-link costs than alternative designs such as point-to-point
(PTP). PTMP and PTP designs are complementary to one another and it is usually the case that
both technologies will be used in different parts of a backhaul network. A comparison of the
characteristics of the two technologies is shown in figure 2.
Because of this significant cost advantage, PMP has become the dominant network design
paradigm for most types of wireless network. For instance, WiFi networks operate in a PTMP
mode, as do GSM and UMTS (3G) mobile telephony networks. Within the telecom space, PTMP
microwave technology as marketed by CBNL is used by 7 of the top 10 mobile operator groups (as
measured by numbers of subscribers). PTMP in general is therefore a widely-understood and
widely-adopted technology.
Figure 2: PTMP and PTP are complementary technologies
2 Choice of operational frequency As described above, the PTMP paradigm is applicable across a wide range of frequencies, and
equally in licensed or unlicensed spectrum. For backhaul networks and enterprise access there
are certain requirements that guide the choices.
2.1 Licensed or unlicensed?
Because the backhaul network is critical to the operation of a mobile telephony network as a
whole, typically operators will not use unlicensed spectrum for this application. The nature of
unlicensed spectrum is that uncontrolled interference may arise without warning, and without
any recourse. This consequently reduces the availability of the backhaul network if such
interference is received. The type of service is often referred to as ―best effort‖ and is generally
not considered suitable for mobile backhaul other than in exceptional circumstances.
BIF RESPONSE ON TRAI CONSULTATION PAPER ON MWA/MWB CARRIERS
BROADBAND INDIA FORUM
The contents of this document are the exclusive privilege of the forum and shall not be replicated
in any form without the exclusive approval of the forum
In contrast, licensed spectrum is preferred for backhaul, because the licensing process takes into
account the possibility for interference and eliminates it through careful allocation of channels.
Thus a true ―carrier grade‖ service can be expected. This is therefore suitable for mobile
backhaul, and is also preferred for enterprise access applications, where the higher grade of
service will typically lead to reduced customer churn.
2.2 Low frequency or high frequency?
Low frequency RF has certain advantageous physical characteristics in terms of its propagation.
Below approximately 6GHz, RF energy penetrates building materials and diffracts around
obstructions. This makes these spectrum bands desirable for the operation of access networks
such as 2G and 3G. However these characteristics are not generally required for backhaul.
Therefore it is actually disadvantageous to use these bands for backhaul, in general, because the
spectrum rented is economically in competition with access demands.
A particular factor is that, because of the desirability for access application described above, the
spectrum below 6GHz is highly fragmented. It is therefore complex for regulators to aggregate
large contiguous blocks of spectrum for lease to operators, and often would not be economic for
the operator in any case. Finally, many of the currently-free bands in this part of the
electromagnetic spectrum are proposed as extension bands for LTE, and there is therefore a
question mark over the sustainability of use of these bands for the backhaul application.
In contrast, traditional microwave frequencies (approximately between 6GHz and 60GHz) are
generally speaking plentiful, with large contiguous blocks available. Because these frequencies
are not generally useful for mobile access there is less cross-application competition and these
frequencies are likely to remain usable for backhaul for the foreseeable future.
2.3 The 10.5GHz, 26GHz and 28GHz bands
These three bands are globally harmonised by the ITU-R for point-to-multipoint usage according
to the following recommendations:
10.5GHz 26GHz 28GHz
Rec. F. 1568 [1] Rec. 748-4 Annex 1 [2]
Because of this harmonisation, there is a functional, competitive marketplace in the provision of
equipment and services conforming to these standards (as of March 2014 there are at least 6
companies selling such equipment). There are, therefore, clear benefits for all parties in a
territory in aligning to these international standards in terms of enjoyment of the economies of
scale and a competitive marketplace.
For the regulator, specifying these regulations results in the spectrum being more likely to be
used, which raises public revenue from a common good. For the operator, being able to use
readily commercially available technology, with a choice of suppliers, results in competitive
pricing. For vendors, being able to service multiple markets with a single product design is more
BIF RESPONSE ON TRAI CONSULTATION PAPER ON MWA/MWB CARRIERS
BROADBAND INDIA FORUM
The contents of this document are the exclusive privilege of the forum and shall not be replicated
in any form without the exclusive approval of the forum
efficient. These benefits are also enjoyed at a remove by the network end-users and general
public, through the ability of the operator to offer services at a lower price point. As previously
highlighted, adoption of the technology is strong, with 7 out of the top 10 and XX out of the top YY
mobile operator groups using the technology.
3 Efficient use of spectral resources
The electromagnetic spectrum is a finite resource and it is therefore desirable for it to be used as
efficiently as possible. Wasteful use of spectrum can lead to congestion, where insufficient
resources are available to deal with increased demand, and (like traffic congestion on the road
network), this kind of congestion is economically harmful to a country overall.
Figure 3: Actual mobile broadband backhaul traffic with average peak and mean
characteristics
Mobile broadband backhaul traffic is not easy to transport efficiently because of its bursty nature,
illustrated in figure 3. Rather than a smooth, continuous load of a certain number of megabits per
second (Mbps), this type of traffic is characterised by an offered load that varies rapidly with time.
One measure of the degree of burstiness of traffic is the peak-to-mean ratio. For perfectly
smooth traffic of a uniform load, the peak-to-mean ratio is 1: the peak load and the mean load are
identical. The larger the peak-to-mean ratio is when greater than 1, the burstier the traffic is. The
traffic shown in figure 3 has a peak-to-mean ratio of = This is approximately average
for data-dominated mobile broadband traffic in 2014.
To understand why this type of traffic is hard to transport efficiently, let us consider dimensioning
a wireless link to carry this traffic. If I assume that I do not wish to constrain the traffic because of
the size of my link, I must provision as the capacity of the link at least the peak offered load—
24.96Mbps in this case. However, now consider what will be the utilisation of this link; this is
defined as the mean load transported divided by the capacity. Since I only have one source of
traffic, the mean load transported on the link must simply be equal to the mean offered load—
10.23Mbps in this case. My link utilisation, therefore, is the mean load— 10.23Mbps—divided by
the capacity—24.96Mbps—or in other words the reciprocal of the peak-to-mean ratio; in this case
We can see, therefore, that purely because of the traffic characteristics, and not because of any
defect in the technology, a PTP wireless link carrying mobile broadband traffic will operate at a
BIF RESPONSE ON TRAI CONSULTATION PAPER ON MWA/MWB CARRIERS
BROADBAND INDIA FORUM
The contents of this document are the exclusive privilege of the forum and shall not be replicated
in any form without the exclusive approval of the forum
low efficiency. The figures cited in the NGMN Alliance‘s white paper Guidelines for LTE
Backhaul Traffic Estimation [3] suggest a peak-to-mean ratio of as much as 5.6 for LTE serving
cells.
For PMP, the efficiency of spectrum resource utilisation can be dramatically increased. This is
possible because a multipoint system allows multiple access to the shared RF medium, and
therefore there is more than one source of traffic load. To illustrate this, consider figure 4.
Figure 4: Comparison of bandwidth needed to transport identical traffic using PTP and
PTMP
Here we illustrate, using actual data from a live DC-HSPA+ and LTE network, the dramatically
improved efficiency possible with PTMP. On the left, we provision PTP links to carry each of seven
node Bs‘ backhaul traffic, requiring a total of 224Mbps. On the right, we carry exactly the same
traffic in a PTMP sector. Statistically the peaks in bandwidth demand from different node Bs do
not occur simultaneously, and therefore it is improbable that a peak in demand from one node B
will coincide with a peak in demand from another. Therefore the peak of the aggregated traffic is
much less than the sum of the peaks of the individual sources. We can calculate a theoretical
figure for the increase in efficiency, known as the statistical multiplexing gain, by dividing the
sum of the peaks of the individual sources by the peak of the aggregated traffic:
sum of peaks of un aggregated traffic
statistical multiplexing gain for this example
BIF RESPONSE ON TRAI CONSULTATION PAPER FOR MICROWAVE ACCESS AND MICROWAVE
BACKBONE CARRIERS
The statistical multiplexing gain is a measure of how much more efficiently the RF resources are
used by the PTMP system. To illustrate that this is a universal phenomenon, and not a quirk of a
chosen set of node Bs, the graph in figure 5 plots the statistical multiplexing gain for one operator‘s
entire network of 3G and LTE base stations backhauled over PTMP. The abscissa of the graph is the
number of 3G or 3G+LTE sites that are backhauled within a single PTMP sector. The network as a
whole comprises almost 300 PMP sectors and approximately 1200 remote terminals, each co-
located with a 3G or 3G+LTE site.
Figure 5: Statistical multiplexing gain for an entire 3G and LTE network backhauled over
PTMP
It is possible to make a number of observations from this graph. First, as expected, if there is only a
single remote terminal in the sector, there is unity statistical multiplexing gain; this degenerate case
is equivalent to operating the PTMP sector as a PTP link. As the number of remote terminals
increases, the statistical multiplexing gain increases monotonically. This is intuitive – the more
sources of traffic are multiplexed together, the greater the probability that a peak in one source will
―cancel‖ with a trough in another source.
The general trend in mobile networks is for an increasing geographic density of base stations or
node Bs, because this increases the overall capacity of the network, and is one way to meet the
increasing data demands of mobile users. Thus as time goes by, the average statistical multiplexing
gain realised by PMP increases, as the trend is to move towards the right on the graph shown above.
4. Capacity and frequency re-use support in PTP & PMP
PTP is a proven carrier grade technology while PMP technology suffers from several drawbacks that
limit its penetration to the mobile backhaul market.
PMP networks consist of a hub and several remote terminals that connect to the hub. Since the hub
communicates with several terminals its antenna is sectorial antenna which is wide-beam. In
comparison PTP links has narrow beam directional antenna.
The antenna gain of sector antenna is quite low. Typical gain antenna is 16dBi at the main beam. In
comparison typical PTP directional antenna of 1ft has antenna gain of 38dBi at least at the main
BIF RESPONSE ON TRAI CONSULTATION PAPER FOR MICROWAVE ACCESS AND MICROWAVE
BACKBONE CARRIERS
beam. The 22dB difference in hub’s antenna reduces the overall link budget of the PMP link by this
22dB. Such significant lower link budget has several circumstances:
1. Having lower link budget reduces the maximum supported link distance. For
example, the following use case was examined: 28MHz channel BW, 28 GHz
frequency, India rain zone N, link availability of 99.995%, capacity of 220Mbps. The
maximum link distance enabled by PTP is 900 meters for the described use case
while in PMP the maximum link distance is limited to 400 meters
2. Different approach than point #1 is to translate the 22dB different link budget into
different modulation scheme. The modulation scheme difference between PTP and
PMP will be at least 6 modulation orders (each modulation order is ~3dB). This low
modulation order supported by PMP ha significant effect on link capacity and
spectral efficiency. for example taking the same use case as before with a link
distance of 900 meters, the capacity achieved in PTP is 220Mbps while only
90Mbps at PMP.
5. Frequency re-use and spectrum contamination comparison
Another aspect of the PMP Hub’s sector antenna is the poor ability of frequency re-use in the
deployed network area and high spectrum contamination. In addition the Hub’s of different
PMP system strongly interfere to each other due to the wide-beam of their antenna in both
the transmission and reception. Such mutual interference limit the system capacity beyond
the phenomena already described in previous section (section #5) and limit the ability to re-
use same frequency between different PMP systems.
Analysis of the different antenna pattern of PTP and PMP system show that PTP enable
frequency re-use factor which is 3 times higher than PMP systems. This should be taken into
account when considering the pricing of PTP allocation vs. PMP allocation.
6 Pricing for PTMP spectrum While it is possible for a regulator to license PTMP on a link-by-link basis exactly analogously to PTP
licensing, it is more common to license PTMP spectrum on an area basis. A common model,
BIF RESPONSE ON TRAI CONSULTATION PAPER FOR MICROWAVE ACCESS AND MICROWAVE
BACKBONE CARRIERS
explored in ITU-R recommendation ITU-R SM.2012-3 [4], is to charge a fee based on the amount of
bandwidth used, the operating frequency and the area serviced:
fee baseline cost bandwidth in M z
Here, F is a factor that varies with the operational frequency and A is a factor that varies with the
area serviced. Example values for F and A given in the following tables.
Conclusion for PTP and PTMP
PTP networks has higher capacity, support higher link distance, better spectrum re-use factor and
lower interference. All of these make the PTP the Operator’s major choice for mobile backhaul
deployments.
We recommend to open the 10.5GHz, 26GHz and 28 GHz for use in India while allocate the
spectrum primarily to PTP and secondary to PMP. In addition a contamination factor should be
taken into account. The higher contamination factor of PMP networks should make the PMP
frequency channel license fee higher than PTP frequency channel license.
Submitted by:
Anil Prakash
Secretary General
BROADBAND INDIA FORUM Suite 304, Gagan Deep 12, Rajendra Place New Delhi- 110008, India Mobile +91-98111 55846, Tel: +91-11-2575 7128 Fax: +91-11-25757129 Skype ID:anil.prakash email. [email protected] , [email protected]
The motivation to use E-band in India seems stronger than in the rest of the world due to the special conditions
of the Indian Telecom market, that include: very high density in the urban areas, urgent need to increase the
capacity of data services (mobile broadband), the general shortage of microwave spectrum for backhaul and the
need to allocate such spectrum to new operators and rural deployments.
The unique characteristics of the Eband spectrum: The short range (up to 1Km, in the high intensity rain zones of
India while in most of the western world it is up to 2.5Km), the high spectral reuse in dense urban areas, and the
ability to achieve small form factor, coupled with low cost equipment make it ideal for last mile urban
deployments, subject to the existence of an appealing business case to encourage usage of new equipment in
this band.
The aggressive price reduction of microwave equipment, mainly driven by the large Indian Telecom market, has
made the charges for the wireless spectrum/ licenses as a major burden. Most of the countries that have
opened the E-band spectrum, have done so with a pricing policy in which the cost per MHz is 200 to 400 times
less than in the 8-38GHz band!
The major financial benefit to the government from encouraging the use of E-band lies in the large potential of
increasing the overall operator revenues, and hence the revenue share on account of license fee, spectrum
charges (from other spectrum allotments) and other levies that are derived from them, and not from direct
revenue from this unused/ virgin spectrum, which presently is bringing no revenue.
What is expected?
An E-Band Spectrum Policy that will encourage the use of this technology by opening it up at a minimal charge (if
not completely free!) with a technology neutrality specification that will enable a multi-vendor market that will
drive high competition, low prices, and high deployment rates that will accelerate the mobile broadband usage
in India.
• Per link policy where each 2 X 250MHz channel (“spot”) will be around 1,500 Rupees annually.
• During 5 year transition period:
o First 2 years during which frequency will be charged at 80% discount.
o Further 3 years during which the operators will receive 50% discount.
Page 2 of 45
Broadband India Forum 4th May, 2014
2. E-Band Spectrum Mobile operators worldwide are turning to the E-band spectrum specifically the 71-76 GHz, 81-86 GHz bands to
enhance and streamline their backhaul networks. Due to the large allocated spectrum and propagation
characteristics at these frequencies, wireless backhaul systems operating at these frequencies, also referred to
as millimeter-wave wireless systems, can provide up to multi-gigabit capacities for relatively short distances of a
few kilometers. The antennas used in E-band frequencies are highly directional and together with the
propagation limitations, wireless systems operating at the E-band frequencies are highly focused, point-to-point
“pencil beam” links allowing a much higher reuse of the same frequency in a given area.
Utilizing the E-band spectrum, mobile operators can better design their backhaul, allowing a more efficient
frequency plan. Mobile operators are building a layered backhaul network where the 6-38 GHz spectrum will be
used for relatively long-haul transmission and the E-band spectrum for high-capacity, short-haul links particularly
in urban and sub urban deployments. Doing so, mobile operators are able to increase their backhaul capacity
according to their increasing needs without causing frequency congestion. This allows the mobile operators to
introduce new and advanced mobile broadband services to the consumers. The consumers on the other hand
are enjoying the true experience of mobile broadband at their fingertips.
The mm-wave (E-Band) band, with two 5GHz blocks of spectrum allocated at 71-76GHz and 81-86GHz, benefits
from the large channel bandwidth available in this frequency, with typical channel bandwidth of 250MHz, and
channel aggregation that is allowed up to the entire 5GHz of available spectrum. As the operating frequency
increases, the propagation of a radio wave transmitted from a given antenna becomes more directional. In a
dense environment where many links are expected to operate in close proximity, this translates to better spatial
isolation between links, and practically zero interference. Recognizing the minimal risk of interference when
operating in this band, regulators worldwide adopted a new, 'light licensing' paradigm. Under this 'light licensing'
paradigm link licensing is based on quick (mostly online) registration, extremely low spectrum license fees, and
technology neutrality to duplexing (TDD/FDD), channel aggregation and modulation beam. The main limitation
imposed on this band is the requirement for a minimum antenna gain (38/43dBi in EU/US) in order to maintain a
directivity level that will ensure the spatial diversity.
The high sensitivity of this band to rain attenuation, limits the practical ranges of equipment operating in this
technology to 2 – 2.5 Km (and even less than 1 Km in monsoon areas), making it ideal for high density
broadband deployments. Channel aggregation and advanced modulation techniques can scale this technology to
5Gbps and more, while maintaining small form factor and low power consumption.
Commercial equipment working in this band has been available in the last decade, providing GigE wireless links,
mainly for enterprise and vertical applications.
Page 3 of 45
Broadband India Forum 4th May, 2014
3. The Motivation for E-band in India
Allocating the E-band spectrum for use in India will generate additional revenues to the Government of India:
• Revenues from new mobile broadband data services: Allocating and utilizing the E-band spectrum will
enable mobile operators to offer and provide to their customers a wide variety of mobile broadband
services, especially in dense urban areas. These services will generate new and significant additional
revenues to the mobile operators which in turn will pay the Government of India a percentage of these
revenues as agreed in the terms of the license fee and other levies, including enhanced charges for
access and other microwave spectrum. The table below shows the numbers (rupees in crores) for the
first quarter of 2013. It is evident that any increase in revenues contributes more than 10% (close to 15%
in the Metro and A circles) in license fees.
Circle type
GR - Gross Revenue
AGR - Adjusted GR License Fees
Spectrum Charges
Metro 5,900 3,682 371 10.1% 181 4.9%
A 11,489 8,391 839 10.0% 445 5.3%
B 10,614 7,734 621 8.0% 366 4.7%
C 3,672 2,728 164 6.0% 126 4.6%
Total (crores) 31,674 22,535 1,994 8.8% 1,118 5.0%
($M value) 6,694 4,762 421 236
Charges in Crores of rupees for the Quarter ended in March 2013
• Revenues from an unused spectrum: Allocating the E-band would lead to the utilization of a band which
is presently unused / virgin and thus brings “zero” revenues to the Government of India. Its utilization
would bring reasonable revenues for its usage (even at nominal spectrum charges).
Allocating the E-band spectrum in India will facilitate data hungry mobile broadband services while contributing
to release some spectrum in conventional lower microwave bands, which in turn would enable additional
advanced telecommunications and data services to rural areas in India as well.
• Enabling mobile broadband data services: With the dramatically increased capacity requirements by
modern data services and increase of the density of the cell-sites deployed in 3G and 4G networks
mobile operators are turning to the 71-76 / 81-86 GHz E-band spectrum to increase their backhaul
capacity while introducing new and advanced mobile broadband services to the consumers. With the
astonishing large numbers of mobile subscribers that are added each month, it is important that mobile
operators will have the entire necessary spectrum to plan their backhaul network to provide adequate
solutions to the near and long term challenges. As we can see below, the number of broadband
Page 4 of 45
Broadband India Forum 4th May, 2014
subscribers is still very low, and is expected to dramatically increase and surge network backhaul
capacity requirements because of subscriber numbers and various new applications.
• Improving the strength to the Telecom Operators: In an era of falling ARPU’s, data and VAS are the
main source of increasing operator revenues. This kind of services is, and will be highly dependent on
adequate capacity of networks, including backhaul capacity.
• Coping with the spectrum congestion: The increasing number of wireless backhaul links together with
the scarcity of available spectrum is eventually leading to a congestion of the microwave spectrum even
to a point where it will no longer be available for new operators, new links or allocations. Due to the
large allocated spectrum and propagation characteristics of the 71-76 / 81-86 GHz E-band, wireless
backhaul systems operating at these frequencies can provide up to multi-gigabit capacities for relatively
short distances of a few kilometers with a much higher reuse of the same frequency in a given area.
• Contribution for telecommunication and data services in rural India: New mobile operators which are
making an effort to bring broadband services to the rural areas in India have limited 15-18 GHz spots as
these are taken by the established operators. Designing and implementing a backhaul network which
uses the E-band spectrum will allow a more efficient distribution of the 15-18 GHz spots amongst the
established and new operators which is vital for rural deployments.
4. Pricing
Since E-Band links are going to be implemented in urban short overlays over the existing microwave structure, initial deployments will contribute only to part of the operator revenues, therefore royalty based pricing cannot
be practically implemented, as it will result with a too high cost per link when one calculates the circle AGR
versus the number of links to be deployed. The bottom line is that E-Band links cannot be priced on royalty
basis, even at very low percentage.
The current per-link pricing scheme enforced in India is calculated according to the following formula such that a
28 MHz channel, short range (up to 5 km) link would cost 288,000 Rupees (~US$ 5,760): R = M x W x C
Where:
• M – Constant multiplier depending on the distance of the link. The shorter the link the small M is (for
t can be seen that the worst case interference will degrade the noise floor by about 4.2 dB which
leads to approximately 4.2dB lower margin. Even though this amount of degradation cannot be
considered negligible, it is important to note that this calculation considers high transmitting power,
small spatial separation, and no angular separation and no frequency planning in the form of using
adjacent frequency channels or different polarization. It is thus safe to assume that in real life
scenarios interference would be rare, and if it does occur, it should be easy to solve. Additionally, it
should be noted that by using ETSI compliant class 3 antennas in the TDD system, the interference
level can be reduced by 10dB, thus practically eliminating it.
Conclusion
he interference analysis conducted in the previous sections shows that the operating conditions of
wireless equipment at E-band frequencies, and primarily the high-directivity ('pencil-beam')
antennas used in it, enable sharing the band between TDD and FDD systems without need to worry
about near side interference. It has been shown that it suffices to limit the TDD system to +10dBm in
order to ensure it will not cause any significant near-side interference a collocated TDD or FDD
system, even without any frequency planning. When a TDD system is a victim of interference, the
worst case degradation it may suffer from a collocated high-power FDD system is relatively small
(>5dB). Should such degradation occur in practice, it may be easily overcome by using an adjacent
frequency channel, using an alternate polarization, or using ETSI class 3 compliant antennas on the
TDD system.
Page 21 of 45
Broadband India Forum 4th
May, 2014
The vast utilization of microwave links for mobile backhaul and in particular the increase in the
number of those alongside with the increase in no. of cell sites deployed during the last decades of
mobile operations, resulted in spectrum congestion.
At the same time, new generations of broadband and mobile services call to exponentially increase
the available backhaul bandwidth.
Thus, wherever fiber is not an option, service providers will recur to the newly open and regulated E-
band spectrum. The 71-76 GHz and 81-86 GHz bands, allow the introduction of cost-effective
backhaul networks based on a new category of products to deliver the high data rates required by
the transport networks.
Eventually, wireless spectrum is a scarce resource, and a wise spectrum planning will avoid the
congestion of this band in the future to come.
Such wise use will require a thorough consideration of the duplexing mode to be implemented in
any scenario to be deployed.
9.4 Interference risk from Vehicular RADARs in 76-79 GHZ
In this section, we will discuss interference risk from the out-of-band and spurious emissions from
vehicle radar operating in the 76 GHz to 81 GHz range on fixed wireless point-to-point link
operating in the 71-76 and 81-86 GHz band.
Firstly, we define out-of-band emissions and spurious emissions. Out-of-band emissions are
residual emissions related to the intentional emissions radiated by the antennas on the
frequencies immediately outside the permitted range of frequencies which may result from the
modulation process. Spurious emissions are emissions radiated by the antenna or the transmitter
cabinet on a frequency, or frequencies, outside the permitted range of frequencies occupied by
the transmitter. Spurious emissions include harmonic emissions, parasitic emissions,
intermodulation products, but exclude out-of-band emissions
While there is no specific requirement for the minimal level of spurious and out-of-band emissions
from the vehicular radar operating in the 76-77 GHz band that has been specified by the ACMA,
for the purposes of the interference risk analysis, the FCC and ETSI recommended levels [25,26]
will be used. The ACMA may consider including such requirements, or impose more rigorous ones,
within a future revision of the low interference potential device (LIPD) class license to minimize
the risk of interference in adjacent spectrum.
The recommendations for vehicle radar system operation within the band 76-77 GHz are defined
in the FCC report and order [26]. It is specified that the power density of any emission outside the
operating band shall be considered to consist solely of spurious emissions. Furthermore, the limits
for radiated emissions outside the operating band and between 40 GHz and 200 GHz, measured at
a distance of 3 m from the exterior surface of the radiating structure, shall not exceed the limits
given in the Table 7 [26].
Type of vehicle mounted sensors Power density limit [pW/cm2]
Page 22 of 45
Broadband India Forum 4th
May, 2014
forward-looking sensors 600
side-looking or rear-looking sensors 300
Table 7: FCC limits for spurious emissions
The requirements for vehicle radar operation in the frequency range between 76 GHz to 77 GHz
are also specified by ETSI [26]. It is defined that the mean power spectral density radiated outside
the 76 GHz to 77 GHz band shall not exceed the values shown in Table 8 [26].
Frequency range [GHz] Maximum mean power spectral density
(dBm/MHz)
73.5 -76 0
77 – 79.5 0
Table 8: ETSI limits for out of band radiation
In addition, the effective radiated power spectral density of any radiated spurious emission shall
not exceed the values given in Table 9 [26].
Frequency range [GHz] Limit value for spurious radiation
(dBm/MHz)
40 – 100 -30
Table 9: ETSI limit for radiated spurious emissions
The interference risk from the vehicular radars can be reduced by implementing antennas with
narrow-beam radiation pattern for vehicle radar as well as for the link. However, the above limits
will apply only for the fundamental frequency band, for vehicle radar in the 76-77 GHz band.
Furthermore, the radars will operate while vehicle are travelling uphill, downhill, and around
curves, so specifying beam-width limits will not stop the radar beam from illuminating off road
objects.
As a worst case scenario, the link budget calculation is presented in Table 10 when the interferer is
the vehicle radar. The interference analysis is based on the Wireless Communication Association
recommendation [23] when the out-of-band emissions are restricted as in Table 8.
Page 23 of 45
Broadband India Forum 4th
May, 2014
Parameter Link Interferer-to-link
Carrier frequency [GHz] 75.75 75.75
EIRP [dBm] 536 24
Bandwidth [MHz] 250 250
NF [dB] 8
Noise power [dBm] -81.8
Rain attenuation [dB/km] 9
Path length [km] 1.5 1
Received antenna gain [dBi] 50 50
Received power [dBm] -38.0 -56.0
Received C/(N+I) [dB] 18.0
Required SINR [dB] 14
Required T/I [dB] 19.9
Link margin -1.9
Table 10: Interference Risk 6 The value is chosen as the maximum transmitter output level which does not need to employ ATPC based on the WCA
recommendation [23]
The interference analysis is based upon a comparison of C/(N+I) in service with manufacturer-
specified T/I limits for a digital receiver. The static threshold of a digital receiver, T, is defined as
the manually faded (with attenuators) receive carrier level that produces a bit-error-rate (BER) of
10-6
. Values of T/I are roughly 6 dB greater then the theoretical threshold values of C/N under the
assumption that the interferer is a (worst case) thermal-noise like interference with a bandwidth
less or equal to that of the desired signal. Theoretical C/N requirement for some common schemes
Page 24 of 45
Broadband India Forum 4th
May, 2014
include OOK or BPSK (C/N=13 dB), QPSK (13.5), 4FSK (17.5 dB) and 16QAM (20.9 dB), and hence
T/I is taken to be 19.9 dB.
Based on the interference link analysis illustrated in Table 10, if the link is partially affected by
light rain, the received carrier to interference-plus-noise ratio C/(N+I) may fall 1.9 dB below the
required level causing the link to fail. Although, the interference to a link is likely to be restricted
to very short periods of time from an individual vehicle, with increasing traffic flow of vehicles
equipped with automotive radar operating in the 76-77 GHz band, the link availability of wireless
point-to-point link operating in the 71-76 and 81-86 GHz band might be significantly degraded.
The interference risk from vehicular radar can be reduced in several ways. Firstly, by the
implementation of automatic transmit power control (ATPC). In such a way, the ATPC system
could provide protection against rain outage, and in the particular case illustrated in Table 10,
protection against harmful vehicle radar interference.
Secondly, the implementation of guard bands will provide greater opportunity for the natural roll off
of emissions outside the band. It is the implementation of these guard bands as proposed by ETSI
and Ofcom [16, 19] that might explain why interference from vehicular radar is not discussed.
Page 25 of 45
Broadband India Forum 4th
May, 2014
9.5 Interference risk to Radio Astronomy
The 76-86 GHz band is protected with the ITU footnote 5 .149. But, only 81-86 GHz band is
potentially subject to interference from the high capacity fixed point-to-point links. Hence the
protection of the radio astronomy services within the band 81-86 GHz will be the focus of analysis in
this section.
Location
Latitude/Longitude
Frequency band
Spectral power flux-
density
(dB(W/(m2
⋅Hz)))
75-115
2
75-115
2Table 5: Radio astronomy observatories, their locations, geographic co-ordinates,
operating frequency bands and protection requirements 2 Spectral power flux density is determined based on the Recommendation ITU-R RA.769 [29] for the 81-86 GHz band.
In [30], notification zones are defined for apparatus licensed services around radio astronomy
facilities. The purpose was to prescribe a process for notification of prospective frequency
assignment to apparatus licensed services that might impede or degrade the operation of radio
astronomy facilities. However, considering that the 81-86 GHz band is not taken into consideration
in [30] it is necessary to calculate the notification zone radius for the 81-86 GHz band that would
be adequate to avoid possible interference arising from the use of the fixed point-to-point links in
the 71-76 and 81-86 GHz bands.
Based on the Recommendation ITU-R RA.1031-1 [31], transmission loss can be calculated as
Lb ( p) = Pt + Gt + Gr − Pr ( p)
In this analysis, transmission loss comprises free-space propagation loss and atmospheric absorption
loss.
Page 26 of 45
Broadband India Forum 4th
May, 2014
Pt - transmitting power level (dBW) 0dBW
Gt - gain (dBi) of the transmitting antenna in the direction of the radio
astronomy antenna
3Gr - gain (dBi) of the receiving antenna in the direction of the
transmitter 0dBi
4
Pr(p) – maximum permissible interference power (dBW) in the
81-86GHz band to be exceed for no more than p% of time at the
receiver input
-130dBW5
Atmospheric absorption 0.5dB/km
Notification zone radius 25km
Table 6: Input parameters for the notification zone radius calculations 3 Antenna gain is taken as typical from the manufacturer’s product specification lists (Section 3). 4 Based on the Recommendation ITU-R RA.769 [29], for the assessment of interference to radioastronomy from transmitter
used for terrestrial radiocommunications, a value of 0 dBi is adopted for the gain of the radioastronomy antenna in the
direction of the horizon.
5 Many radioastronomy measurements can tolerate levels of interference from a shared service which exceed these
thresholds for 10% of the time. Maximum permissible interference power is found from spectral power flux density [31] for
the 81-86 GHz band.
Page 27 of 45
Broadband India Forum 4th
May, 2014
10, License Considerations
Overseas Licensing arrangements
The unique characteristics of the links operating in the 71-76 GHz and 81-86 GHz bands provide an
opportunity to utilize more flexible licensing arrangements and several different approaches have
been taken overseas.
Flexible Licensing Approach (USA and possibly Canada, Mexico)
The FCC has adopted a flexible and innovative regulatory framework for the 71-76 GHz and 81-86
GHz bands. Rights with regard to specific links are established based upon the date and time of link
registration. herefore, a first-in-time criterion is adopted in order to protect the first-in-time
registered or incumbent links.
Furthermore, all licensees are required to obtain and submit an interference analysis to a third
party manager as a part of link registration. The aim is to minimize the adverse economic impact
on licensees, including those that are small entities. In adopting the interference-analysis
requirements, the cost and benefits of imposing an interference analysis requirement are
considered, especially for small entities. In an FCC survey, it was found that the cost of
performing such analyses would be relatively small, particularly when compared with the benefits
of preventing harmful interference to existing operations for all licensees. Three database
managers, FFI, Micronet and Comsearch use distinct but centralized databases, offering the choice
to the user community while ensuring a centralized format for available link information.
Light Licensing Approach (UK and some other European countries)
The deployment under a license exempt basis could result in unacceptable interference and would
be unlikely to lead to optimal use of the spectrum, particularly considering the high availability
applications proposed to be used in the bands.
On the other hand, the potential for interference is likely to be small in the bands due to the ‘pencil
beam’ signal characteristics of the fixed wireless systems. Therefore, a simple mechanism which
enables individual 70/80 GHz links to gain protection from interference can be accomplished by
the implementation of a centralized database with a registration system with a first come first
served data and time record essentially forming the basis for protection.
Fully Licensed Approach (Finland, Switzerland and Estonia)
The 71-76 and 81-86 GHz bands are fully licensed. The coordination is
necessary to ensure that services neither suffer from, nor cause,
interference.
Page 28 of 45
Broadband India Forum 4th
May, 2014
10.1 Licensing Options in India
Apparatus licensing
Traditionally, apparatus licenses are issued to authorize the operation of fixed point-to-point
services in the microwave bands. Apparatus licenses are usually issued ‘over the counter’, and
require payment of an annual tax as well as an administrative charge. Apparatus licensing for
point-to-point services also involves detailed frequency coordination.
This framework serves to minimize interference between fixed service users and recovers
economic revenue for the use of the public resource commensurate with spectrum denied to others.
An annual tax is applicable for each apparatus license. The tax is based on several factors: the
bandwidth access ($ per kHz), the spectrum location and the geographic location. Apparatus
licenses also attract an issue charge (to cover the cost of frequency assignment and
administration), and a renewal charge in subsequent years. In the case of high capacity fixed links
the issue charge could, based on the existing fee schedule, work out to several (tens of) thousands
of dollars per link. However, the tax component for some apparatus licenses is set at a fixed
amount.
This model applies in India for ISP’s, and the cost for a 28MHz license is Rs 2.88L , and if the same
formulas will be applied to the 250Mhz channels of the E-Band, we could get to numbers between
Rs 5-20L for equipment that can mostly serve ranges of bellow 1Km.
Royalty based licensing
Mobile operators in India get specific microwave channels (“spots”) per circle, for which they pay a
percentage of a “modified” AGR, and the percentage per channel goes up as the operator gets
more channels per circle. In this case no coordination is needed as the operator has his own
channels. With some of the operators use 5-8 channels in cities, the burden of 1.1% to 2.3% is
serious, not to mention the shortage in such channels
Page 29 of 45
Broadband India Forum 4th
May, 2014
Spectrum charges as % of AGRCumulative spectrum
charges as % of AGR
Lower Frequencies (28 MHz,
paired)
Lower Frequencies
(28 MHz, paired)
1st carrier 0.15% 0.15%
2nd carrier 0.20% 0.35%
3rd carrier 0.20% 0.55%
4th carrier 0.25% 0.80%
5th carrier 0.30% 1.10%
6th carrier 0.35% 1.45%
7th carrier 0.40% 1.85%
8th carrier 0.45% 2.30%
9th carrier 0.50% 2.80%
10th carrier 0.55% 3.35%
11th carrier 0.60% 3.95%
This AGR method cannot be used for E-Band for two reasons:
• As we saw in section 8.1, there are not enough channels to give to operators on an
exclusive basis. Due to the extremely wide channels needed in E-band, requiring 2 to 4
channels of 250 MHz each, AGR based scheme cannot be practically implemented as for
lower microwave bands where each operator is assigned specific spots in a circle on
exclusive basis. With 4.75 GHz of spectrum, allowing for 1000 MHz channels (as required by
many vendors) will allow only 4 independent channels per circle, and working with 500
MHz will allow for 9 independent channels.
• Since E-Band links are going to be implemented in urban short overlays over the existing
microwave structure, initial deployments will contribute only to part of the operator
revenues, therefore royalty based pricing cannot be practically implemented, as it will result
with a too high cost per link when one calculates the circle AGR versus the number of links
to be deployed. The bottom line is that E-Band links cannot be priced on royalty basis,
even at very low percentage.
Per link licensing seems to be the only way to benefit from the high re-usability of the spectrum.
Low pricing is needed in order to encourage the usage of this spectrum. The licensing process has
to facilitate for the following requirements:
Page 30 of 45
Broadband India Forum 4th
May, 2014
• Fast and easy online access to register the link
o Registration of the link
o Interference analysis (on line!)
o Online payment
• Easy, online access to issue import licenses
• Channel allocation will be done by the system
o The system will try to populate one channel, or set of adjacent channels, and only
when interference is detected will allocate the next (set of) channel.
Page 31 of 45
Broadband India Forum 4th
May, 2014
10.2 India Pricing
The current per-link pricing scheme enforced in India is calculated according to the following
formula such that a 28 MHz channel, short range (up to 5 km) link would cost 288,000 Rupees
(~US$ 5,760):
R = M x W x C
Where:
• M – Constant multiplier depending on the distance of the link. The shorter the link the small
M is (for example: M=1200 for links up to 5 Km and M=2400 for links up to 25 Km). We
suggest M value of 600 for links of up to 2Km.
• W – Weighting factor decided by the adjacent channel separation of the channeling plan (for
example: W=30 for adjacent channel separation above 2 MHz and W=120 for adjacent
channel separation greater than 7 MHz but less than or equal to 28 MHz (since from 2MHz
to 28MHz W was increased by a factor of 4, a similar proportionate factor when going from
28MHz to 250MHz would be 2.55). We suggest W=360 for a 250MHz Channel
• C – Number of RF channels used. C= 2 for 500MHz TDD or 250MHz FDD systems and 8 for
1000MHz FDD systems
• E – We propose a new correction factor, based on the re-use and spectral efficiency (as
detailed in Annex 11.4 - Method 1) and suggest setting it at 1/300.
• Taking these factors together the per-link pricing scheme suggested for the E-band spectrum
is as follows:
• 500MHz TDD: R = M x W x C x E = 600 x 360 x 2 / 300 = 1,440 (say 1,500) Rupees
(~US$3045)
• 1000MHz FDD: R = M x W x C x E = 600 x 360 x 8 / 300 = 5,760 (say 6,000) Rupees
(~US$120)
Annex 11.4 provides also a sanity check to show in a different way (Method 2) that the same
2*250MHz channel should cost 1,350 Rupees which is along the same numbers as suggested here.
If we want to compare to international pricing (see details in Annex 11.4), as seen in the table in the
next page, we can add a few reasons for the benefit of the low pricing in India. The cost of the
equipment in India is significantly lower than the cost in EU and US, so the annual per link cost
should be proportional to that. The Tariffs in India are the lowest in the world, so the network
Since E-Band links are going to be implemented in urban short overlays over the existing microwave structure,
initial deployments will contribute only to part of the operator revenues, therefore royalty based pricing cannot
be practically implemented, as it will result with a too high cost per link when one calculates the circle AGR
versus the number of links to be deployed. The bottom line is that E-Band links cannot be priced on royalty
basis, even at very low percentage.
Page 32 of 45
Broadband India Forum 4th
May, 2014
generate less revenues per Equipment and per spectrum portion use.
The introduction of regulatory arrangements supporting the use of the 71-76 and 81-86 GHz bands
would facilitate the use of a range of new high bandwidth short range services. However the use
of traditional coordinated bandwidth based fee and license structure would unnecessarily hinder
deployment of these new services.
As we can saw in 9.2, in FY 2012 VAS revenues accounted for 12%-15% of total operator revenues,
although broadband subscribers accounted for only 1.5% of mobile subscriber base.
The AGR part of Broadband (VAS) can be assumed as 13% of the total AGR So, In terms of 2012
numbers the AGR generated from VAS/Broadband is listed below (in red):
2012 AGR VAS 2013 VAS AGR
Rs CR % Rs CR $M
87,127 13% 11,327 2,265
Current license and Spectrum charges range from 15% in metro and A circles to 13% in B,C circles.
Even if we consider the unified license fees of 6% in the future (new telecom Policy), than with the
Spectrum Charges, we will get a 10% of AGR as Government fees
Assuming that free opening of the E-Band can drive Number of installed E-Band links
Number of installed E-Band links can drive: ≤1,000 5,000 10,000 50,000 100,000
Broadband Subscribers number multiplied by: 1 2 5 8 10
AGR part of Broadband multiplied by 1 1.2 2 3 4
In the following table, we give an estimate to the potential number of E-Band links as a function of
the annual per link spectrum charge that will be decided for this band (grey). We use this number
of E-Band links to extrapolate the increase in VAS/Broadband AGR that results from the increase in
Broadband subscriptions.
Annual Per Link
Charge
Market
potential of
E-Band Links
per Link
Charges
Annual
Government
Spectrum
Charges
VAS &
Broadband
revenue
Increase
factor
Spectrum
&
Licence
Annual
Government
Broadband
Income
Rs
LAKHS $ # Rs Cr $M % Rs Cr $M
5.00 10,000 500 25.00 5.0 1 10% 0 0
Page 34 of 45
Broadband India Forum 4th
May, 2014
1.50 3,000 1,000 15.00 3.0 1 10% 0 0
0.25 500 5,000 12.50 2.5 1.2 10% 227 45
0.10 200 10,000 10.00 2.0 2 10% 1,133 227
0.02 30 50,000 7.50 1.5 3 10% 2,265 453
0.00 0 100,000 0.00 0.0 4 10% 3,398 680
We can clearly see that the Government income from increase in Broadband AGR is by far bigger
than any direct income from direct Spectrum Charges, so it’s not worthwhile to heavily tax
Spectrum charges. Any increase in the direct spectrum charges will risk a huge reduction in income
from broadband AGR.
The type of license and access cost for these bands under the proposed management framework
would be influenced by a number of factors:
• The nature of propagation in the millimeter wave bands and the possibility of employing
highly directional “pencil beam” signal characteristics mean that applications can
be implemented with minimal interference concerns, allowing a potentially highly
efficient re-use of the spectrum. Thus, reducing co-ordination requirements.
• The availability of wide bandwidths supporting large capacity data rates, with sufficient
bandwidth for terrestrial links to compete with or complement fiber optic based access
networks.
• Operating path lengths of 1-2 km with high (>99.9%) availability.
• Availability of WPC database for the self-coordination purposes. The WPC database
would hold and make available the relevant information required to enable
licensees to plan and self-coordinate links in the 71-76 and 81-86 GHz bands. This
database would also serve as the reference point for the data and time a link is
registered, thereby establishing the time priority of links. Further issues associated with
the WPC database implementation for the purposes of the 71-76 and 81-86 GHz band
link registration might require further investigation.
• The degree to which the WPC/TEC would become involved in any interference
mediation.
.
Page 35 of 45
Broadband India Forum 4th
May, 2014
.
Page 36 of 45
Broadband India Forum 4th
May, 2014
11.1 Summary of the Recommendations for E Band
India has the potential to be the biggest user of E-Band technology while it is shaping up. This will
both drive the mobile broadband infrastructure in India, and also create an opportunity to the Indian
market to influence this industry. Since the 71-76 and 81-86 GHz bands are allocated for Fixed
Services in the NFAP 2011, the following is suggested:
1. A flexible channel plan should be adopted in a manner that would enable any existing and
future equipment of any bandwidth and modulation.
2. Technical Regulations should be drafted in a manner that will facilitate the future use of a
very dense overlay of links, especially in the urban areas. It is advised to encourage low
power devices, and mandate QoS based Adaptive Rate mechanism to cope with rain
attenuation, and provide Technology Neutrality that will enable competition and
innovation.
3. A licensing framework based on a link registration system should be adopted recognizing
the value and high spectrum reuse potential of the bands. This framework should also be
able to guarantee interference free operation of licensees.
4. The WPC database should be the basis for the registration system.
5. To encourage commercial development and efficient use of the 71-76 and 81-86 GHz
bands, a fixed fee approach, at a cost of no more than Rs 1,500 per 2X250MHz Channel.
6. To avoid spectrum hoarding made possible by the low fee structure, a rollout obligation
should be attached to licenses and a 12 month time limit for achieving the rollout goal
might be proposed.
Page 37 of 45
Broadband India Forum 4th
May, 2014
Point-to-Multipoint Technology systems ( 10.5, 26, 28Ghz )
Introduction
This document gives a high-level overview of modern microwave point-to-multipoint (PMP)
networks, describing some of the benefits of this technology for common applications such as
mobile broadband backhaul. . Yet PMP networks have several drawbacks that limit their use. These
drawbacks compare to standard point-to-point (PTP) system are described as well.
Analysis of the 10.5, 26, 28 GHz bands availability and usage in other countries are summarized in
this document as well.
The recommendation for the regulatory authority is to license the 10.5GHz, 26GHz and 28 GHz
spectrum bands for the use of PTP networks (primary spectrum usage) and of PMP networks
(secondary spectrum usage)
1. 10GHz, 26 GHz and 28GHz spectrum use in other countries
2. ITU and ECC recommendations describe both PTP and
PMP in these bands for valid deployments in these
discussed bands. Analysis of the use of different countries
in these bands shows that: • Many countries have decided to banned PMP and allocate all the spectrum for PTP
links only. This is due to the limit usage of PMP which will be described later in this
document
• Some countries allocate part of the spectrum for PTP (larger portion of the band)
and part of the spectrum for PMP (smaller portion of the band)
• No country found that allocates the entire bands for PMP networks on
• Other bands (different than 10, 26, 28 GHz are not opened for PMP networks at all
In addition to the regulatory bodies implementation, most of today mobile backhaul is done by PTP
links rather than PMP.
3. Why use a point-to-multipoint architecture?
Page 38 of 45
Broadband India Forum 4th
May, 2014
Figure 1: A point-to-multipoint (PMP) sector serving five links
The fundamental use case for a PMP architecture is to create links between a hub site (on the right
in figure 1) and a set of remote sites. Because the hub equipment and the radio frequency channel
between the hub and the remotes are both shared, the cost of the hub equipment and spectrum is
amortised over all the links in the sector. This applies to both capital and operating expenses.
The net result is that, when the average number of links in a sector is more than one, a PMP design
offers substantially lower per-link costs than alternative designs such as point-to-point (PTP). PMP
and PTP designs are complementary to one another and it is usually the case that both technologies
will be used in different parts of a backhaul network. A comparison of the characteristics of the two
technologies is shown in figure 2.
Because of this significant cost advantage, PMP has become the dominant network design paradigm
for most types of wireless network. For instance, WiFi networks operate in a PMP mode, as do GSM
and UMTS (3G) mobile telephony networks. Within the telecom space, PMP microwave technology
as marketed by CBNL is used by 7 of the top 10 mobile operator groups (as measured by numbers of
subscribers). PMP in general is therefore a widely-understood and widely-adopted technology.
Page 39 of 45
Broadband India Forum 4th
May, 2014
Figure 2: PMP and PTP are complementary technologies
4. Choice of operational frequency As described above, the PMP paradigm is applicable across a wide range of frequencies, and equally
in licensed or unlicensed spectrum. For backhaul networks and enterprise access there are certain
requirements that guide the choices.
4.1 Licensed or unlicensed? Because the backhaul network is critical to the operation of a mobile telephony network as a whole,
typically operators will not use unlicensed spectrum for this application. The nature of unlicensed
spectrum is that uncontrolled interference may arise without warning, and without any recourse.
This consequently reduces the availability of the backhaul network if such interference is received.
The type of service is often referred to as ―best effort‖ and is generally not considered suitable for
mobile backhaul other than in exceptional circumstances.
In contrast, licensed spectrum is preferred for backhaul, because the licensing process takes into
account the possibility for interference and eliminates it through careful allocation of channels.
Thus a true ―carrier grade‖ service can be expected. This is therefore suitable for mobile backhaul,
and is also preferred for enterprise access applications, where the higher grade of service will
typically lead to reduced customer churn.
4.2 Low frequency or high frequency? Low frequency RF has certain advantageous physical characteristics in terms of its propagation.
Below approximately 6GHz, RF energy penetrates building materials and diffracts around
Page 40 of 45
Broadband India Forum 4th
May, 2014
obstructions. This makes these spectrum bands desirable for the operation of access networks such
as 2G and 3G. However these characteristics are not generally required for backhaul. Therefore it is
actually disadvantageous to use these bands for backhaul, in general, because the spectrum rented
is economically in competition with access demands.
A particular factor is that, because of the desirability for access application described above, the
spectrum below 6GHz is highly fragmented. It is therefore complex for regulators to aggregate large
contiguous blocks of spectrum for lease to operators, and often would not be economic for the
operator in any case. Finally, many of the currently-free bands in this part of the electromagnetic
spectrum are proposed as extension bands for LTE, and there is therefore a question mark over the
sustainability of use of these bands for the backhaul application.
In contrast, traditional microwave frequencies (approximately between 6GHz and 60GHz) are
generally speaking plentiful, with large contiguous blocks available. Because these frequencies are
not generally useful for mobile access there is less cross-application competition and these
frequencies are likely to remain usable for backhaul for the foreseeable future.
4.3 The 10.5GHz, 26GHz and 28GHz bands These three bands are globally harmonised by the ITU-R for point-to-multipoint usage according to
the following recommendations:
10.5GHz 26GHz 28GHz
Rec. F. 1568 [1] Rec. 748-4 Annex 1 [2]
Because of this harmonisation, there is a functional, competitive marketplace in the provision of
equipment and services conforming to these standards. There are, therefore, clear benefits for all
parties in a territory in aligning to these international standards in terms of enjoyment of the
economies of scale and a competitive marketplace.
For the regulator, specifying these regulations results in the spectrum being more likely to be used,
which raises public revenue from a common good. For the operator, being able to use readily
commercially available technology, with a choice of suppliers, results in competitive pricing. For
vendors, being able to service multiple markets with a single product design is more efficient. These
benefits are also enjoyed at a remove by the network end-users and general public, through the
ability of the operator to offer services at a lower price point.
5. Efficient use of spectral resources The electromagnetic spectrum is a finite resource and it is therefore desirable for it to be used as
efficiently as possible. Wasteful use of spectrum can lead to congestion, where insufficient
resources are available to deal with increased demand, and (like traffic congestion on the road
Page 41 of 45
Broadband India Forum 4th
May, 2014
network), this kind of congestion is economically harmful to a country overall.
Figure 3: Actual mobile broadband backhaul traffic with average peak and mean
characteristics
Mobile broadband backhaul traffic is not easy to transport efficiently because of its bursty nature,
illustrated in figure 3. Rather than a smooth, continuous load of a certain number of megabits per
second (Mbps), this type of traffic is characterised by an offered load that varies rapidly with time.
One measure of the degree of burstiness of traffic is the peak-to-mean ratio. For perfectly smooth
traffic of a uniform load, the peak-to-mean ratio is 1: the peak load and the mean load are identical.
The larger the peak-to-mean ratio is when greater than 1, the burstier the traffic is. The traffic
shown in figure 3 has a peak-to-mean ratio of = This is approximately average for data-
dominated mobile broadband traffic in 2014.
To understand why this type of traffic is hard to transport efficiently, let us consider dimensioning a
wireless link to carry this traffic. If I assume that I do not wish to constrain the traffic because of the
size of my link, I must provision as the capacity of the link at least the peak offered load—
24.96Mbps in this case. However, now consider what will be the utilisation of this link; this is
defined as the mean load transported divided by the capacity. Since I only have one source of
traffic, the mean load transported on the link must simply be equal to the mean offered load—
10.23Mbps in this case. My link utilisation, therefore, is the mean load— 10.23Mbps—divided by
the capacity—24.96Mbps—or in other words the reciprocal of the peak-to-mean ratio; in this case
We can see, therefore, that purely because of the traffic characteristics, and not because of any
defect in the technology, a PTP wireless link carrying mobile broadband traffic will operate at a low
efficiency. The figures cited in the NGMN Alliance‘s white paper Guidelines for LTE Backhaul
Traffic Estimation [3] suggest a peakto-mean ratio of as much as 5.6 for LTE serving cells.
For PMP, the efficiency of spectrum resource utilisation can be dramatically increased. This is
possible because a multipoint system allows multiple access to the shared RF medium, and
therefore there is more than one source of traffic load. To illustrate this, consider figure 4.
Page 42 of 45
Broadband India Forum 4th
May, 2014
Figure 4: Comparison of bandwidth needed to transport identical traffic using PTP and
PMP
Here we illustrate, using actual data from a live DC-HSPA+ and LTE network, the dramatically
improved efficiency possible with PMP. On the left, we provision PTP links to carry each of seven
node Bs‘ backhaul traffic, requiring a total of 224Mbps. On the right, we carry exactly the same
traffic in a PMP sector. Statistically the peaks in bandwidth demand from different node Bs do not
occur simultaneously, and therefore it is improbable that a peak in demand from one node B will
coincide with a peak in demand from another. Therefore the peak of the aggregated traffic is much
less than the sum of the peaks of the individual sources. We can calculate a theoretical figure for
the increase in efficiency, known as the statistical multiplexing gain, by dividing the sum of the
peaks of the individual sources by the peak of the aggregated traffic:
sum of peaks of un aggregated traffic
statistical multiplexing gain for this example
The statistical multiplexing gain is a measure of how much more efficiently the RF resources are
used by the PMP system. To illustrate that this is a universal phenomenon, and not a quirk of a
chosen set of node Bs, the graph in figure 5 plots the statistical multiplexing gain for one operator‘s
entire network of 3G and LTE base stations backhauled over PMP. The abscissa of the graph is the
number of 3G or 3G+LTE sites that are backhauled within a single PMP sector. The network as a
whole comprises just under 300 PMP sectors and approximately 1200 remote terminals, each co-
located with a 3G or 3G+LTE site.
Page 43 of 45
Broadband India Forum 4th
May, 2014
Figure 5: Statistical multiplexing gain for an entire 3G and LTE network backhauled
over PMP
It is possible to make a number of observations from this graph. First, as expected, if there is only a
single remote terminal in the sector, there is unity statistical multiplexing gain – this degenerate
case is equivalent to operating the PMP sector as a PTP link. On the other hand, as the number of
remote terminals increases, the statistical multiplexing gain increases monotonically. This is
intuitive – the more sources of traffic are multiplexed together, the greater the probability that a
peak in one source will ―cancel‖ with a trough in another source.
The general trend in mobile networks is for an increasing geographic density of base stations or
node Bs, because this increases the overall capacity of the network, and is one way to meet the
increasing data demands of mobile users. Thus as time goes by, the average statistical multiplexing
gain realised by PMP increases, as the trend is to move towards the right on the graph shown
above.
6. Capacity and frequency re-use support in PTP & PMP PTP is a proven carrier grade technology while PMP technology suffers from several drawbacks that
limit its penetration to the mobile backhaul market.
PMP networks consist of a hub and several remote terminals that connect to the hub. Since the hub
communicates with several terminals its antenna is sectorial antenna which is wide-beam. In
comparison PTP links has narrow beam directional antenna.
The antenna gain of sector antenna is quite low. Typical gain antenna is 16dBi at the main beam. In
comparison typical PTP directional antenna of 1ft has antenna gain of 38dBi at least at the main
beam. The 22dB difference in hub’s antenna reduces the overall link budget of the PMP link by this
22dB. Such significant lower link budget has several circumstances:
1. Having lower link budget reduces the maximum supported link distance. For
example, the following use case was examined: 28MHz channel BW, 28 GHz
frequency, India rain zone N, link availability of 99.995%, capacity of 220Mbps. The
maximum link distance enabled by PTP is 900 meters for the described use case
while in PMP the maximum link distance is limited to 400 meters
Page 44 of 45
Broadband India Forum 4th
May, 2014
2. Different approach than point #1 is to translate the 22dB different link budget into
different modulation scheme. The modulation scheme difference between PTP
and PMP will be at least 6 modulation orders (each modulation order is ~3dB). This
low modulation order supported by PMP ha significant effect on link capacity and
spectral efficiency. for example taking the same use case as before with a link
distance of 900 meters, the capacity achieved in PTP is 220Mbps while only
90Mbps at PMP.
6.1 Frequency re-use and spectrum contamination comparison
Another aspect of the PMP Hub’s sector antenna is the poor ability of frequency re-use in the
deployed network area and high spectrum contamination. In addition the Hub’s of different
PMP system strongly interfere to each other due to the wide-beam of their antenna in both
the transmission and reception. Such mutual interference limit the system capacity beyond
the phenomena already described in previous section (section #5) and limit the ability to re-
use same frequency between different PMP systems.
Analysis of the different antenna pattern of PTP and PMP system show that PTP enable
frequency re-use factor which is 3 times higher than PMP systems. This should be taken into
account when considering the pricing of PTP allocation vs. PMP allocation.
7. Pricing for PMP spectrum While it is possible for a regulator to license PMP on a link-by-link basis exactly analogously to PTP
licensing, it is more common to license PMP spectrum on an area basis. A common model, explored
in ITU-R recommendation ITU-R SM.2012-3 [4], is to charge a fee based on the amount of
bandwidth used, the operating frequency and the area serviced:
fee baseline cost bandwidth in M z
Here, F is a factor that varies with the operational frequency and A is a factor that varies with the
area serviced. Example values for F and A given in the following tables.
Page 45 of 45
Broadband India Forum 4th
May, 2014
Conclusion for PTP and PMP systems
PTP networks has higher capacity, support higher link distance, better spectrum re-use factor and
lower interference. All of these make the PTP the Operator’s major choice for mobile backhaul
deployments.
We recommend to open the 10.5GHz, 26GHz and 28 GHz for use in India while allocate the
spectrum primarily to PTP and secondary to PMP. IN addition a contamination factor should be
taken into account which makes the PMP frequency channel fee higher than PTP frequency


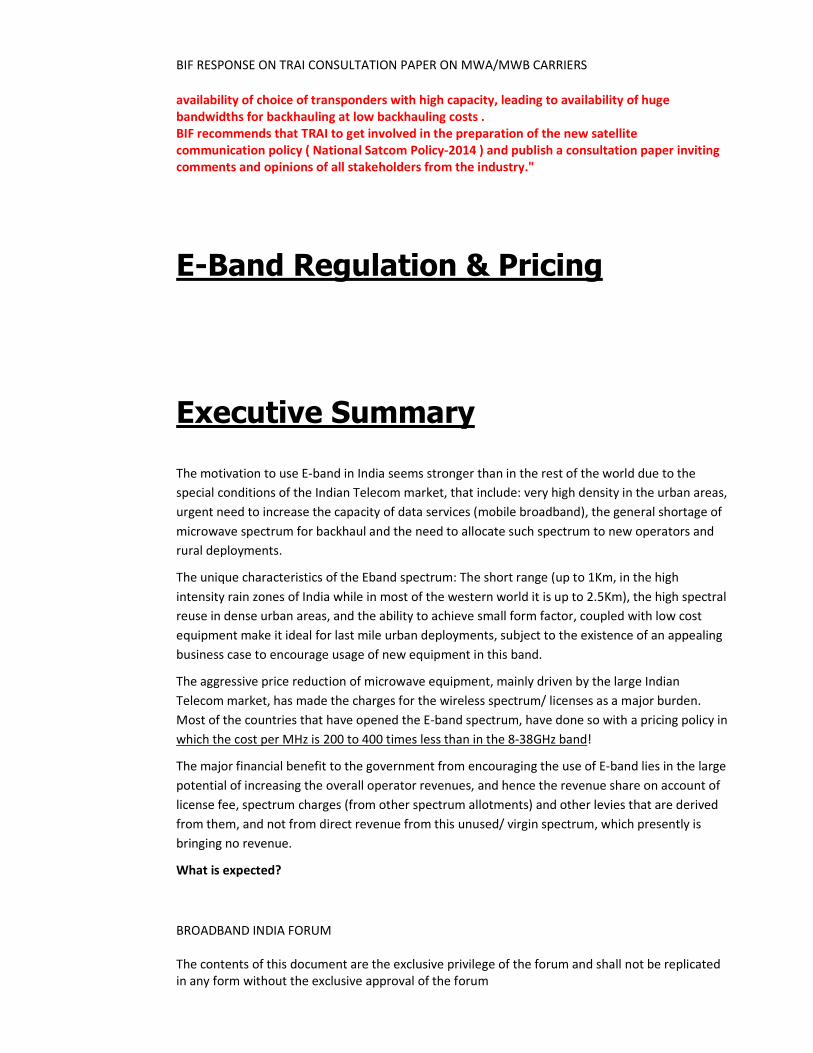


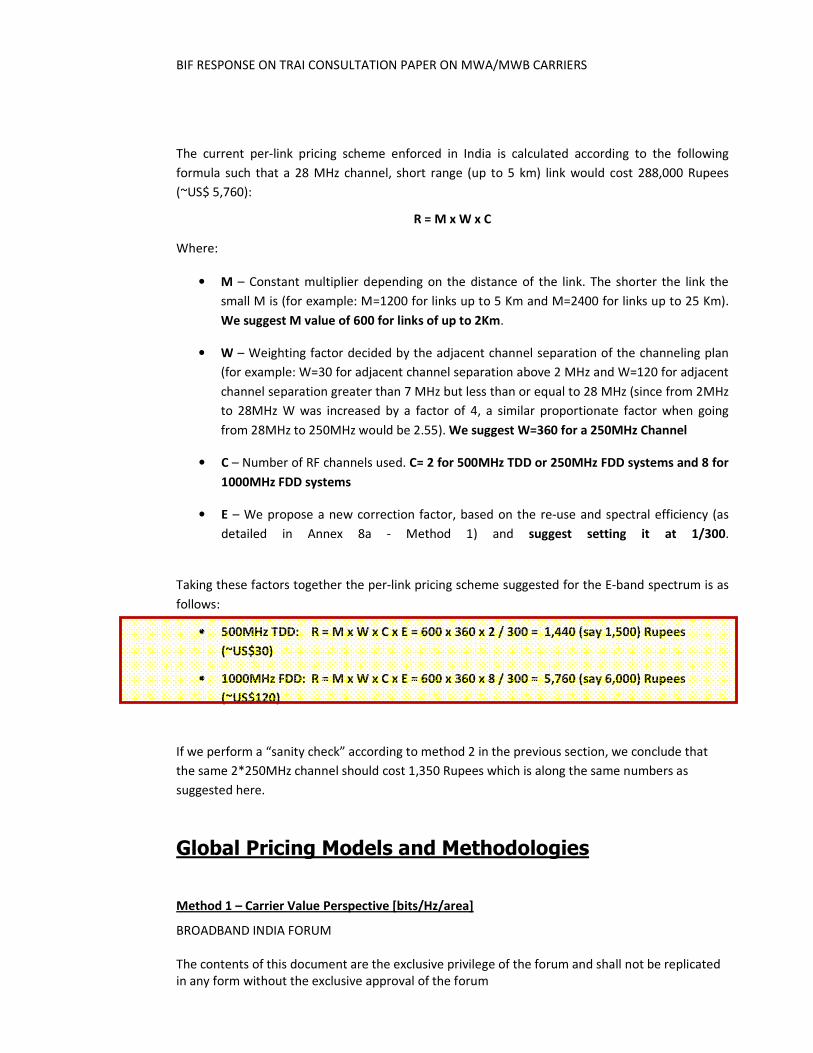

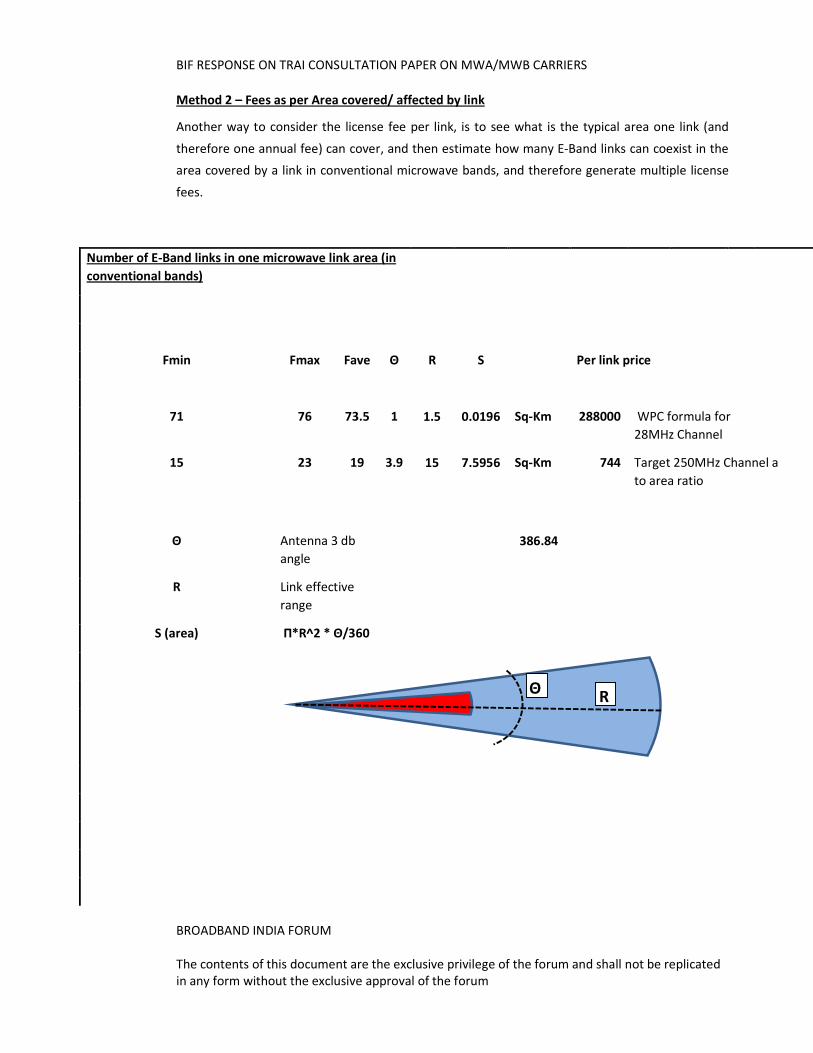


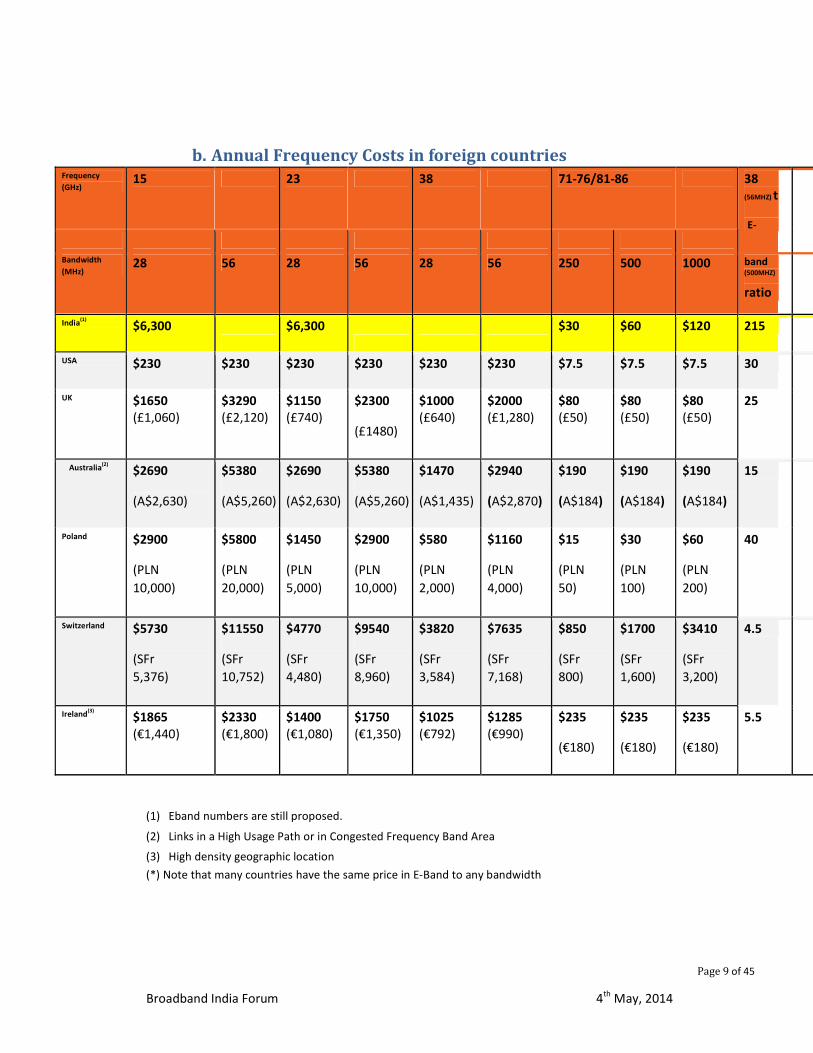

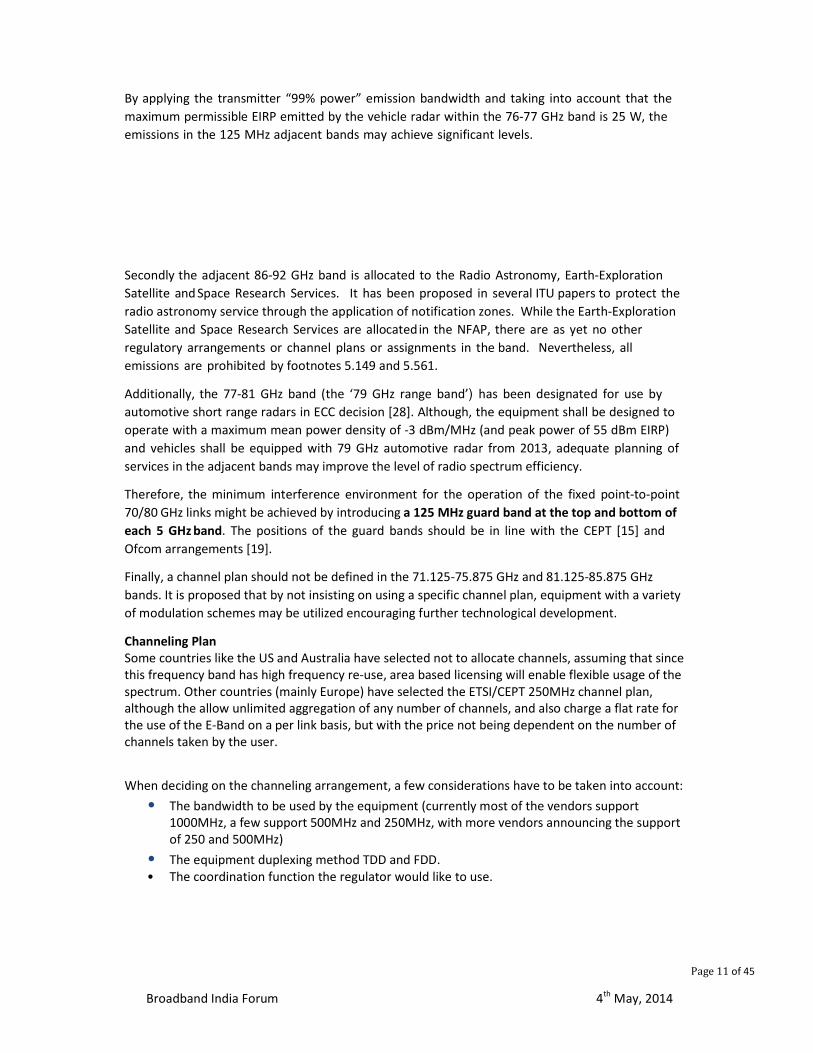


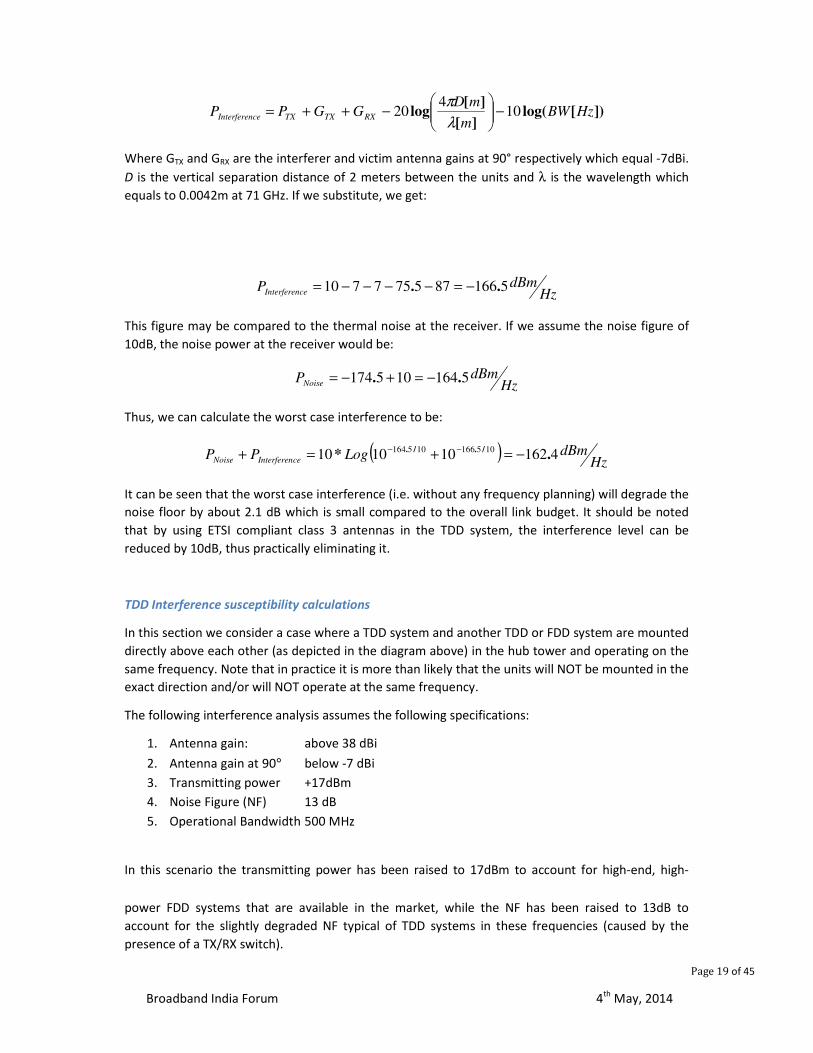


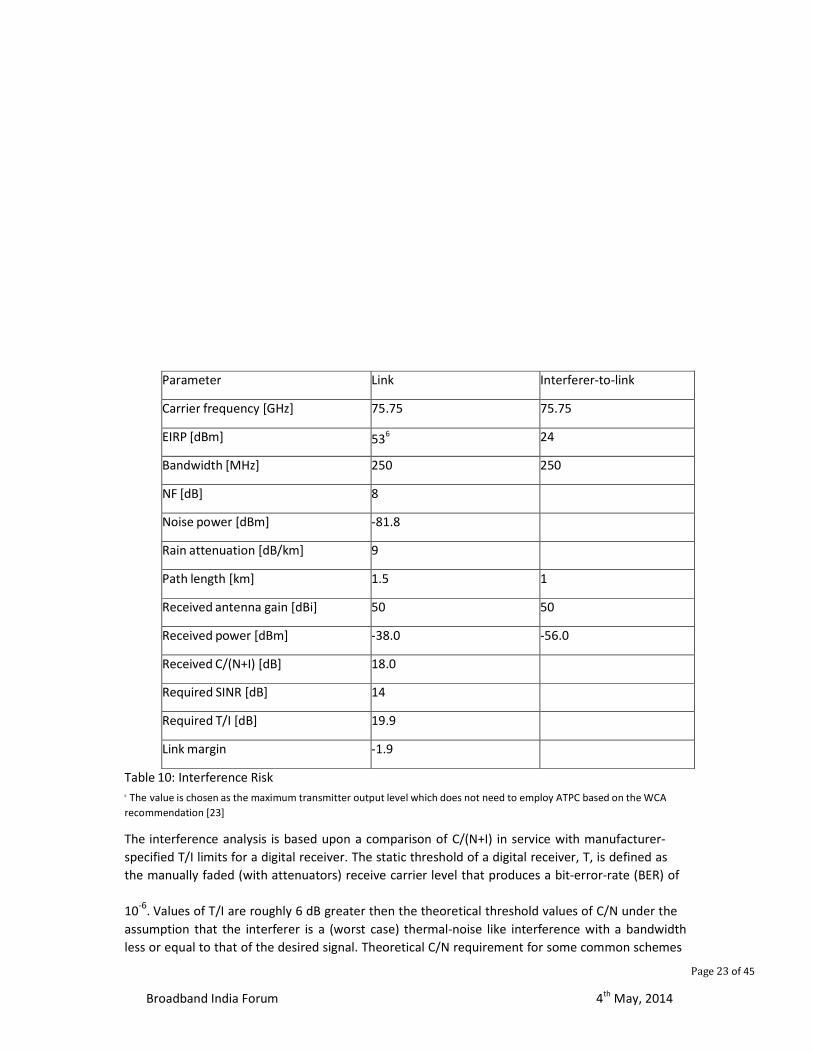
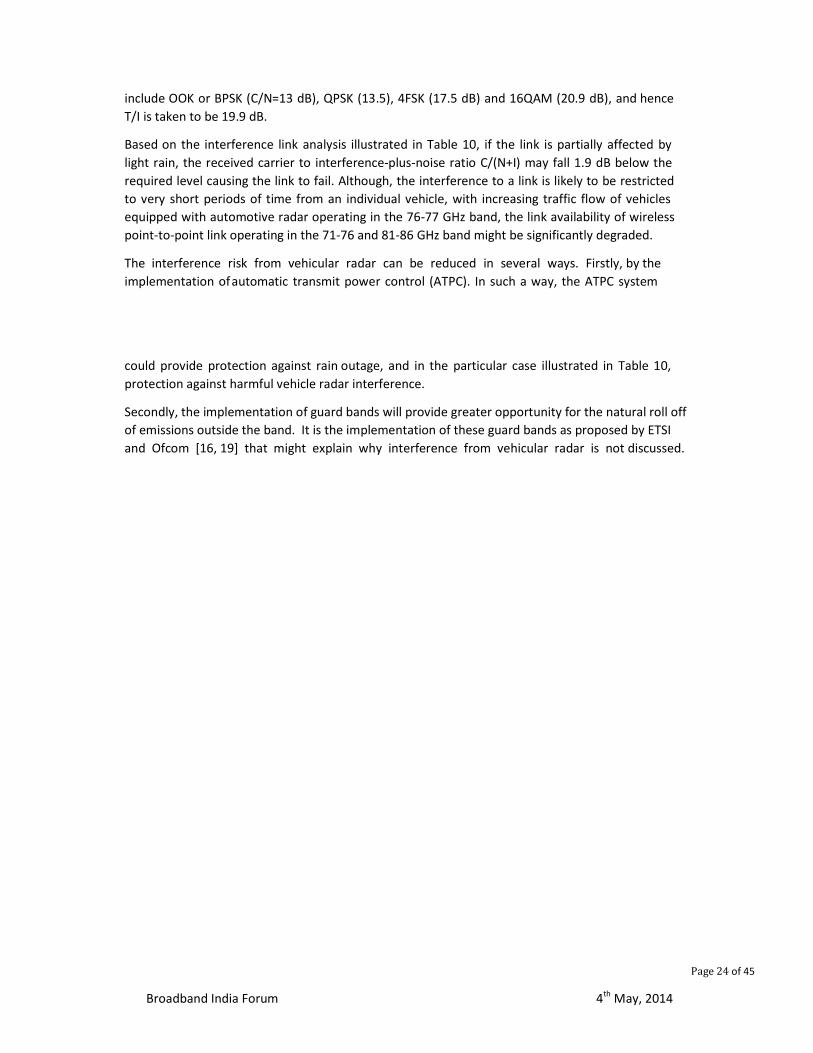

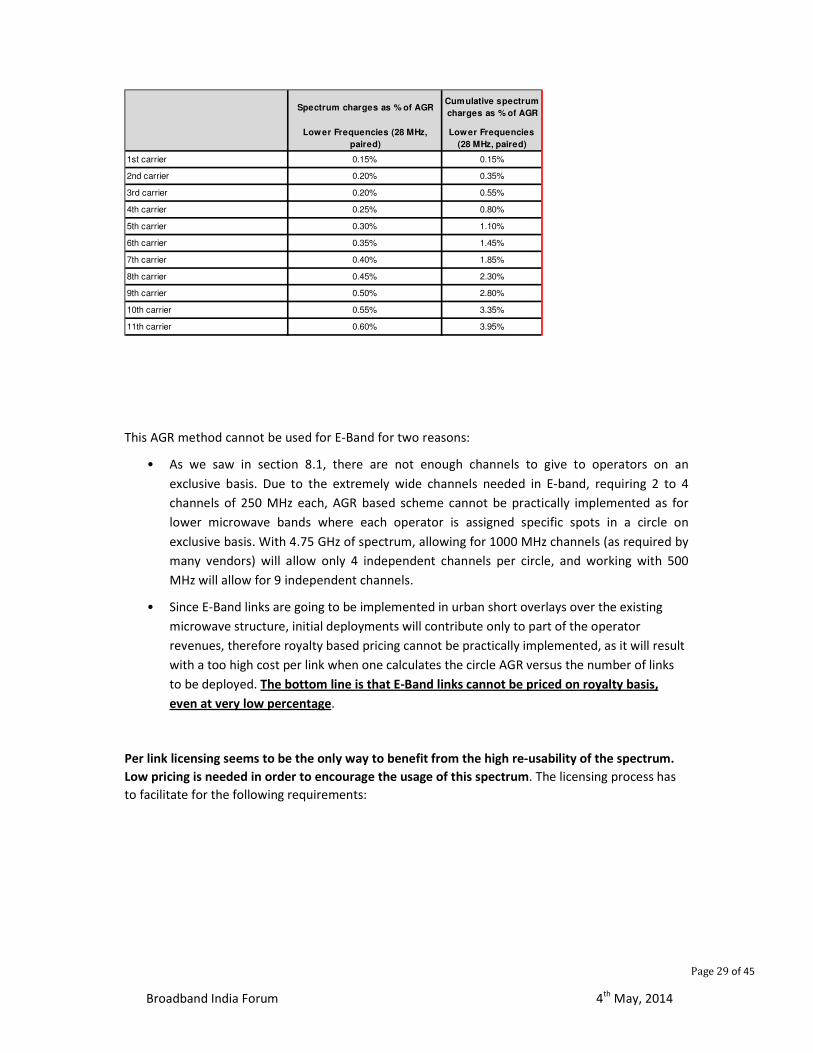

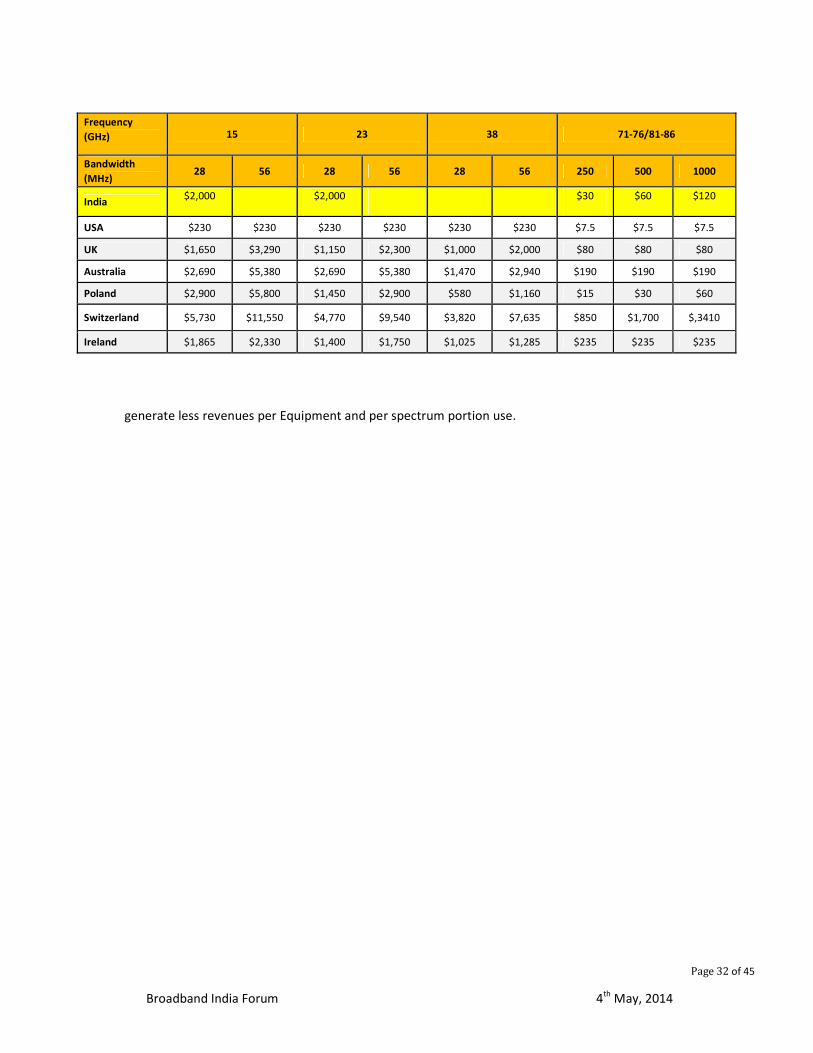

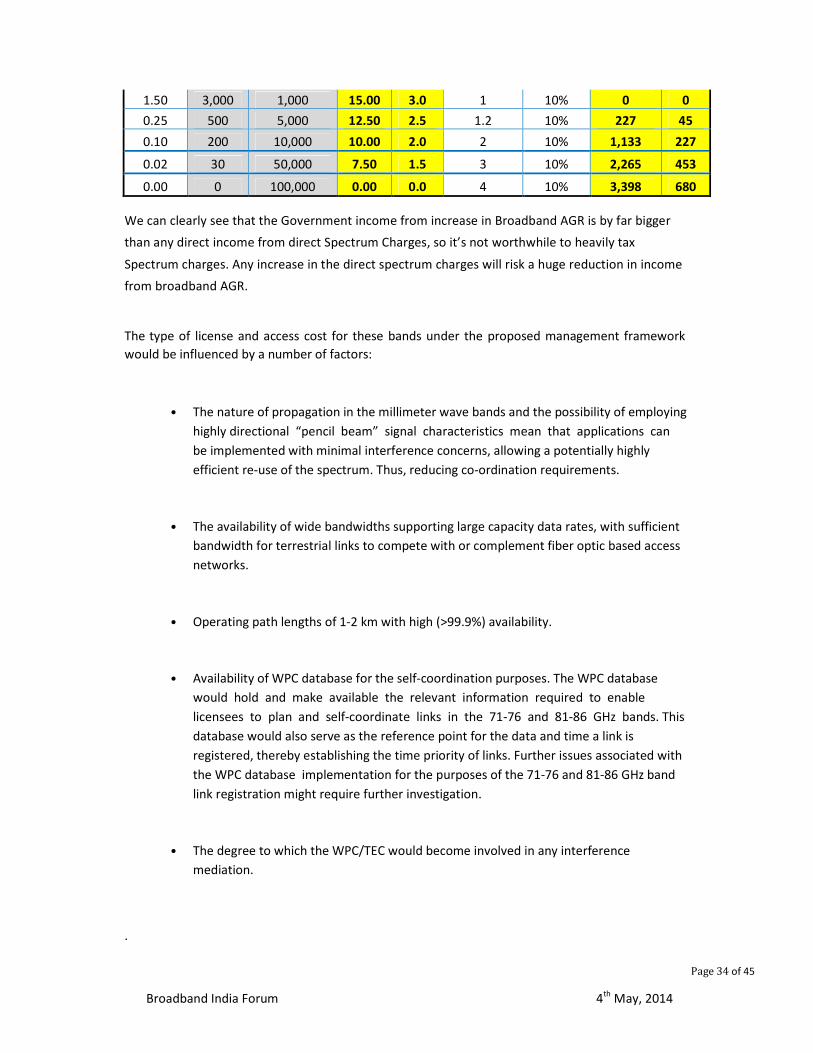


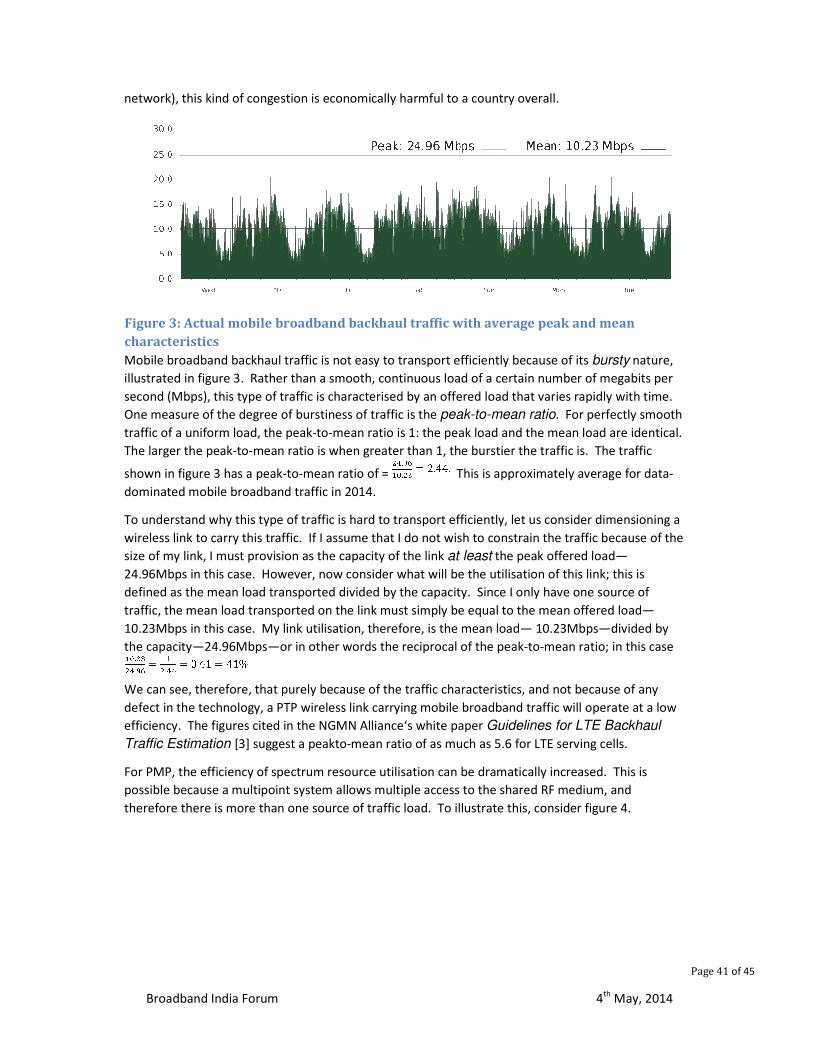


![Rigging & Lifting Handbook [NSL]](https://static.documents.pub/doc/80x56/55cf9d1d550346d033ac4bbc/rigging-lifting-handbook-nsl.jpg)


