SHRI VIDHYABHARATHI MAT. HR. SEC. SCHOOL, SAKKARAMPALAYAM 99655-31727 Page 1 SHRI VIDHYABHARATHI MATRIC HR.SEC.SCHOOL SAKKARAMPALAYAM , AGARAM (PO) ELACHIPALAYAM TIRUCHENGODE(TK), NAMAKKAL (DT) PIN-637202 Cell : 99655-31727, 94432-31727 COMMON QUARTERLY EXAMINATION 2018 STD: XI 22.09.2018 SUBJECT: ECONOMICS ANSWER KEY MARKS : 90 Q. NO ANSWER KEY MARKS SECTION - I 1. c) Scarcity 20x1=20 2. d) Ceteris paribus 3. d) Environmental economics 4. c) Marshall 5. a) Ordinal approach 6. b) Higher subsidy 7. b) It is mobile 8. b) Must be lesser than average product 9. b) Implicit cost 10. c) TFC / Q 11. c) 243 12. c) Product differentiation 13. a) Joan Robinson 14. c) Advertisement cost 15. b) Theory of factor pricing 16. a) S + BC + DH + DI 17. b) Precautionary motive 18. a) Kolar 19. b) Ethical foundation 20. a) 1998 SECTION - II 7x2=14 21. Good and Services Goods Service Goods are produced Services are performed Goods are tangible and homogeneous in nature Services are intangible and heterogeneous in nature Goods are physical things and involves production Services are more like a process 2 22. Utility I. Utility, the simple meaning of ‘utility is usefulness’. II. In Economics utility is the capacity of a commodity to satisfy human wants 2
Transcript
SHRI VIDHYABHARATHI MAT. HR. SEC. SCHOOL, SAKKARAMPALAYAM 99655-31727 Page 1
SHRI VIDHYABHARATHI MATRIC HR.SEC.SCHOOL
SAKKARAMPALAYAM , AGARAM (PO) ELACHIPALAYAM
TIRUCHENGODE(TK), NAMAKKAL (DT) PIN-637202
Cell : 99655-31727, 94432-31727
COMMON QUARTERLY EXAMINATION 2018
STD: XI 22.09.2018
SUBJECT: ECONOMICS ANSWER KEY MARKS : 90
Q.
NO
ANSWER KEY MARKS
SECTION - I
1. c) Scarcity 20x1=20
2. d) Ceteris paribus
3. d) Environmental economics
4. c) Marshall
5. a) Ordinal approach
6. b) Higher subsidy
7. b) It is mobile
8. b) Must be lesser than average product
9. b) Implicit cost
10. c) TFC / Q
11. c) 243
12. c) Product differentiation
13. a) Joan Robinson
14. c) Advertisement cost
15. b) Theory of factor pricing
16. a) S + BC + DH + DI
17. b) Precautionary motive
18. a) Kolar
19. b) Ethical foundation
20. a) 1998
SECTION - II 7x2=14
21. Good and Services Goods Service
Goods are produced Services are performed Goods are tangible and homogeneous in nature
Services are intangible and heterogeneous in nature
Goods are physical things and involves production
Services are more like a process
2
22. Utility I. Utility, the simple meaning of ‘utility is usefulness’.
II. In Economics utility is the capacity of a commodity to satisfy human wants 2
24. The conditions for producer’s equilibrium. The two conditions that are to be fulfilled for the attainment of producer equilibrium.
I. The ISO cost line must be tangent to ISO quant curve. II. At point of tangency, the ISO quant curve must be convex to the origin or MRTSLK
must be declining
2
25. Sunk cost I. A cost incurred in the past and cannot be recovered anymore in future is called a
sunk cost. II. This is historical but irrelevant for future business
2
26. Types of Income. I. Total Revenue
II. Average Revenue III. Marginal Revenue
2
27. The essential future of pure competition I. Large number of buyer and sellers.
II. Homogeneous product and uniform price. III. Free Entry and Exit IV. Absence of transport cost. V. Perfect knowledge of the market
2
28. The meaning of liquidity preference. I. Liquidity preference means the preference of the people to hold wealth in the
form of liquid cash. II. Other non liquid assets like bonds, securities, bill of exchanges, land, building,
gold, etc.
2
29. Quasi - Rent. “Quasi - Rent is the income derived from machines and other appliances made by man”. - Alfred Marshall
2
30. Feature of Indian Economy I. India has a mixed economy
II. Agriculture plays the key role III. An emerging market IV. Emerging Economy V. Fast Growing Economy
VI. Fast growing Service Sector VII. Large Domestic consumption
(any two
points) 2
SECTION - III 7x3=21
31. The crucial decisions involving What is should be produced. I. Whether to produce more food or more luxury goods.
II. Whether to have more agricultural goods or industrial goods. III. Whether to use more resources in education and health or more in military services. IV. Whether to have more consumption goods or investment goods. V. Whether to use more resources in education and health.
SHRI VIDHYABHARATHI MAT. HR. SEC. SCHOOL, SAKKARAMPALAYAM 99655-31727 Page 3
32. Importance of Micro Economics. I. To understand the operation of an economy.
II. To provide tools for economic policies. III. To examine the condition of economic welfare IV. Efficient utilization of resources V. Useful in international trade
VI. Useful in decision making VII. Optimal resource allocation
VIII. Basis for prediction IX. Price determination
(Any three
points) 3
33. Properties of Indifference curves. I. Indifference curve must have negative slope.
II. Indifference curve are convex to the origin. III. Indifference curve cannot intersect. IV. Indifference curve do not touch the horizontal or vertical axis
3
34. Q Elasticity of supply. I. Elasticity of supply may be defined as the degree of responsiveness of change in
supply to change in price on the part of sellers.
II. ES = ∆QS
QS /
∆P
P ; ES =
∆QS
QP x
P
QS
III. Q = Quantity, P = Price, ∆ = Changes. QS = Represents the supply
3
35. The Cobb Douglas production function. I. The Cobb - Douglas production function was developed by Charles W. Cobb and
paul H. Douglas. II. The production function explains that with the proportionate increase in the
factors, the output also increased in the same proportion. III. It implies constant returns to scale. IV. Cobb Douglas production function considered only two factors like labour and
capital. V. Labour contributes three-fourth of production and capital contributes one-
fourth of production. VI. The elasticity of substitution between the factors is equal to one.
VII. Q = Al 𝛼K𝛽
3
36. Opportunity cost and Provide an example. I. It refers to the cost of next best alternative use.
II. In other words. It is the value of the next best alternative. III. It is also called as ‘Alternative cost’ or ‘Transfer cost’ For Example.
I. A farmer can cultivate both paddy and sugarcane in a farm land. II. If he cultivates paddy the opportunity cost of paddy output is the amount of
sugarcane output given up.
3
37. The degrees of price discrimination. i) First degree price discrimination. A monopolist charges the maximum price that a buyer is willing to pay. This is called as perfect price discrimination. ii) Second degree price discrimination. Under this degree, buyers are charges prices in such a way that a part of their consumer’s surplus is taken away by the sellers. This is called as imperfect price discrimination. iii) Third degree price discrimination. The monopolist splits the entire market into few sub-market and charges different price in each sub-market.
SHRI VIDHYABHARATHI MAT. HR. SEC. SCHOOL, SAKKARAMPALAYAM 99655-31727 Page 4
I. Very short period market or Market Period. II. Short period market
III. Long period market IV. Very long period market ( or a Secular Period Market)
39. The motives of demand for money. The Transaction Motive:
i. The transaction motive relates to the desire of the people to hold cash for the current transaction.
ii. The amount saved under this motive depends on the level of income iii. Mt = 𝑓(𝑦) The Precautionary Motive
i. The precautionary motives relates to the desire of the people to hold cash to meet unexpected or unforeseen expenditures.
ii. For Example: Sickness, accidents, fire and theft. iii. Mp = 𝑓(𝑦) The Speculative Motive
i. The speculative motive relates to the desire of the people to hold cash in order to take advantage of market movements regarding the future changes in the price of bond and securities in the capital market.
ii. Ms = 𝑓(𝑖)
3
40. The strategy Jawaharlal Nehru in India’s planning. Jawaharlal Nehru was responsible for the introduction of planning in our
country. To Jawaharlal Nehru, the plan was essentially an integrated approach for
development. He said, “the essence of planning is to find the best way to utilize all resources of
man power, of money and so on. Planning for Nehru was essentially linked up with industrialization and eventual self reliance for the country’s economic growth on a self -accelerating growth”
Nehru carried through this basic strategy of planned development.
3
SECTION - IV 7x5=35
41. Marshall’s Definition vs Robbin’s Definition Marshall’s Definition Robbin’s Definition
“Economics is the study of man in the ordinary business of life.” It examines that part of individual and social action, which is most closely connected with the attainment and with the use of material requisites of well being.
“Economic is the science which studies human behavior as a relationship between multiple ends and scarce means, which have alternative uses.”
Similarities between Robbins & Marshall’s Definition. Human Behaviour: (i) Both the definitions are concerned with human behaviour (ii) Marshall’s and Robbin’s definitions are concentrate on optimization. (iii) According to Marshall, wealth is the basic source of maximization of material welfare. Robbins is the opinion that maximize our satisfaction by scarce resources. Differences between Marshall’s & Ribbin’s Definition. 1. Economic activity - Material / Immaterial 2. Social Science / Natural Science 3. Practical / Theoretical 4. Welfare / Scarcity
SHRI VIDHYABHARATHI MAT. HR. SEC. SCHOOL, SAKKARAMPALAYAM 99655-31727 Page 5
(OR) Merits of production possibility curve;
The problem of choice The Notion of Scarcity Solution of central problems.
1. The device of PPC curve can be used for many analystical purpose 2. “PPC” is the locus of the combination of the goods the problem of choice will not arise when we choose any point on “PPC”. 3. The production possibility curve reflects the constraints imposed by the elements of economic activity. 4. The central problems of an economy can be explained with the help of PPC. The solution of problem of what to produce involves the decision regarding the choice of location on the production possibility curve.
5
42. Methods of Measuring elasticity demand. There are four methods of measuring price elasticity of demand.
The Percentage Method Total Qutlay Method. Point (or) Geometrical Elasticity Are Method.
The Percentage Method
ep = ∆Q
∆P x
P
Q
It is also known as ratio method, when we measure the ratio as:
ep = %∆Q
%∆P
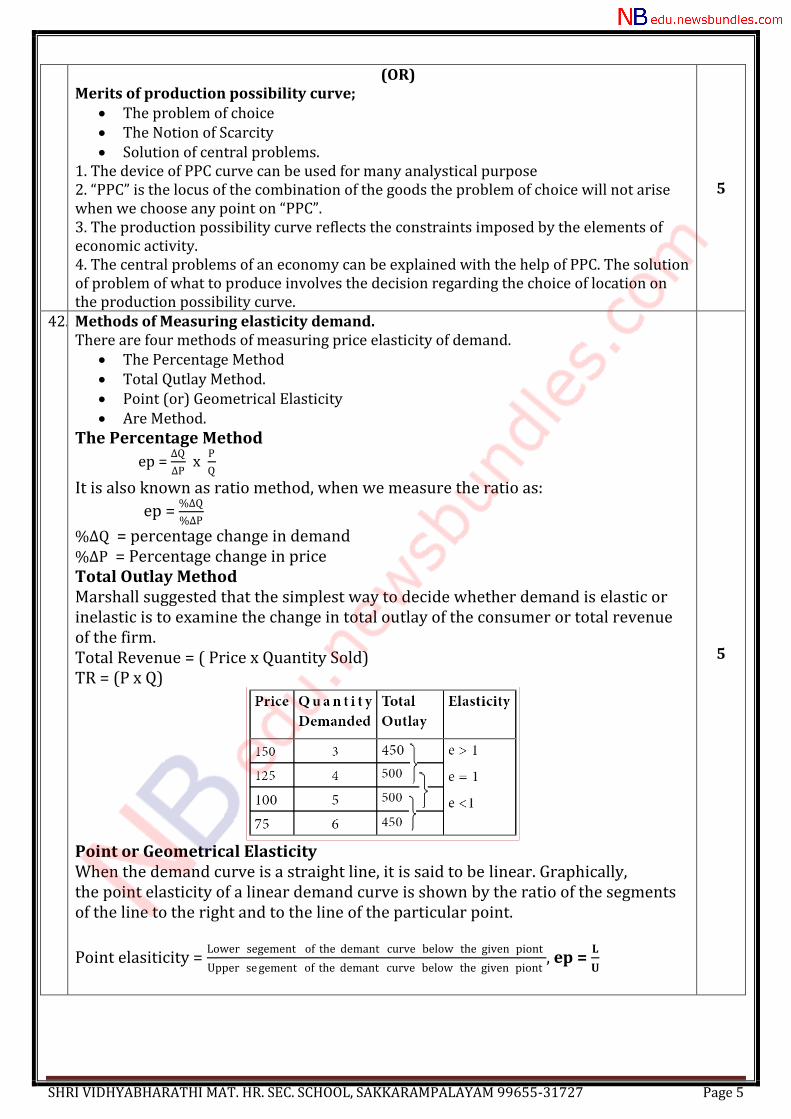
%∆Q = percentage change in demand %∆P = Percentage change in price Total Outlay Method Marshall suggested that the simplest way to decide whether demand is elastic or inelastic is to examine the change in total outlay of the consumer or total revenue of the firm. Total Revenue = ( Price x Quantity Sold) TR = (P x Q)
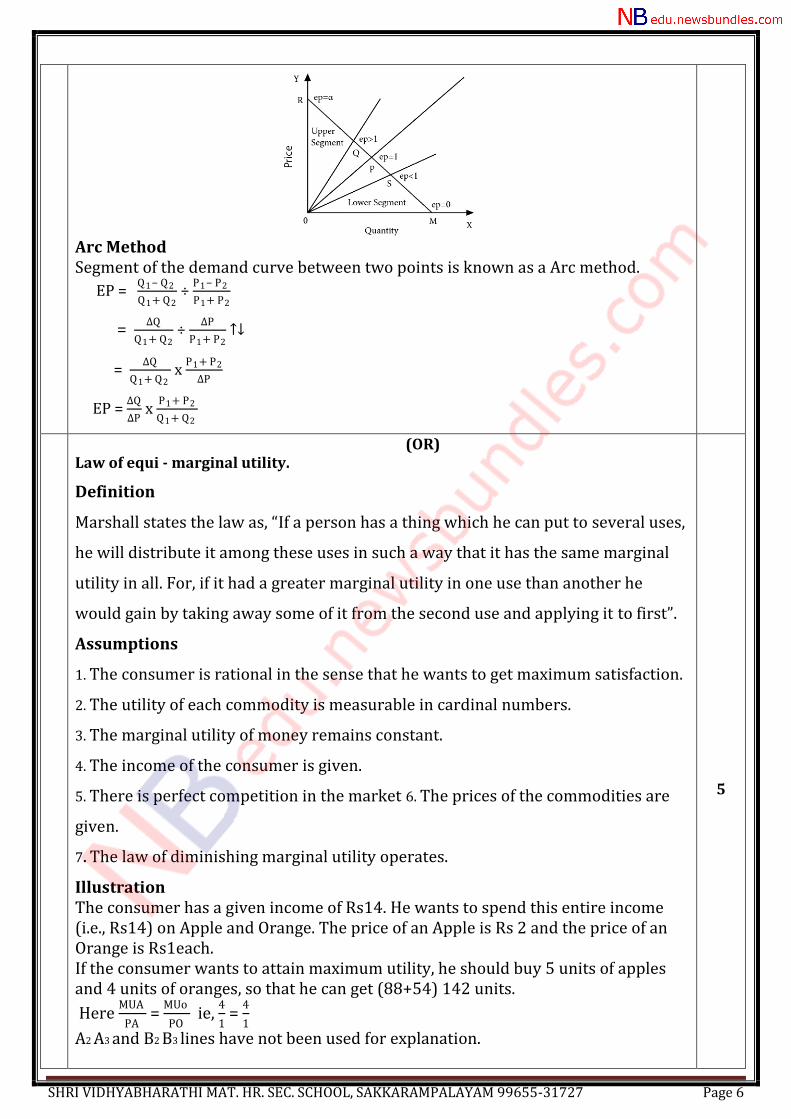
Point or Geometrical Elasticity When the demand curve is a straight line, it is said to be linear. Graphically, the point elasticity of a linear demand curve is shown by the ratio of the segments of the line to the right and to the line of the particular point.
Point elasiticity = Lower segement of the demant curve below the given piont
Upper se gement of the demant curve below the given piont, ep =
SHRI VIDHYABHARATHI MAT. HR. SEC. SCHOOL, SAKKARAMPALAYAM 99655-31727 Page 6
Arc Method Segment of the demand curve between two points is known as a Arc method.
EP = Q1− Q2
Q1+ Q2 ÷
P1− P2
P1+ P2
= ∆Q
Q1+ Q2 ÷
∆P
P1+ P2 ↑↓
= ∆Q
Q1+ Q2 x
P1+ P2
∆P
EP = ∆Q
∆P x
P1+ P2
Q1+ Q2
(OR) Law of equi - marginal utility.
Definition
Marshall states the law as, “If a person has a thing which he can put to several uses,
he will distribute it among these uses in such a way that it has the same marginal
utility in all. For, if it had a greater marginal utility in one use than another he
would gain by taking away some of it from the second use and applying it to first”.
Assumptions
1. The consumer is rational in the sense that he wants to get maximum satisfaction.
2. The utility of each commodity is measurable in cardinal numbers.
3. The marginal utility of money remains constant.
4. The income of the consumer is given.
5. There is perfect competition in the market 6. The prices of the commodities are
given.
7. The law of diminishing marginal utility operates.
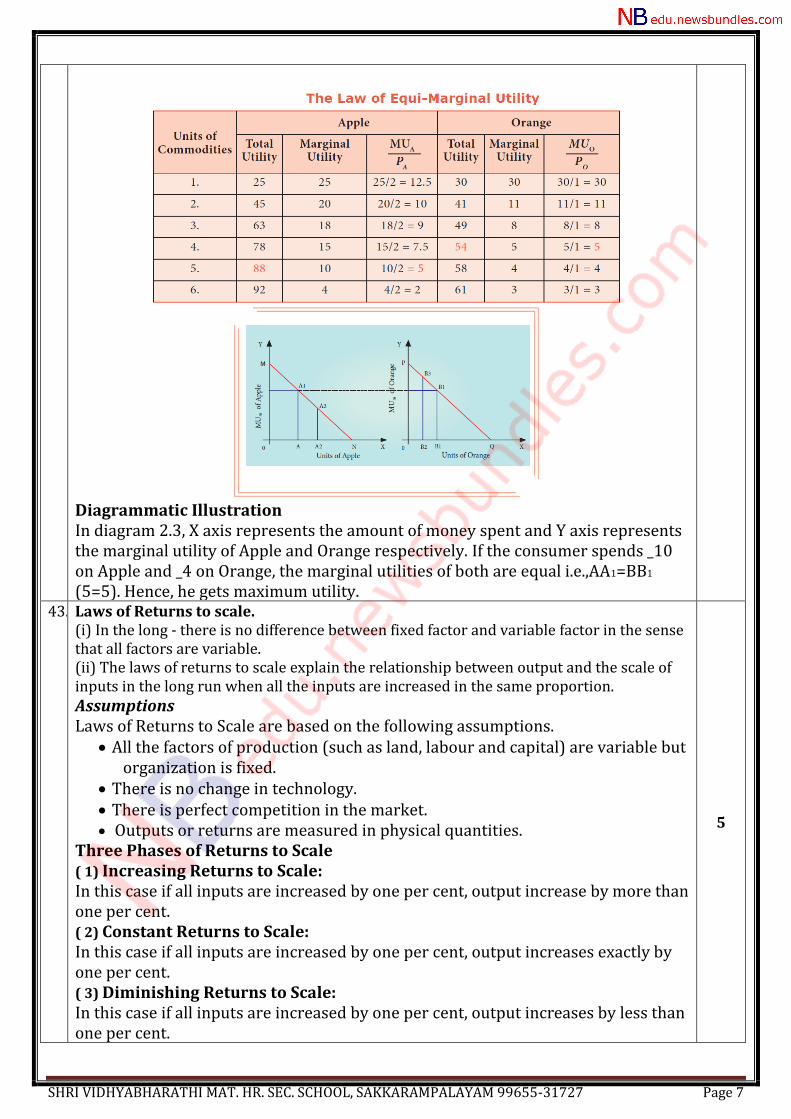
Illustration The consumer has a given income of Rs14. He wants to spend this entire income (i.e., Rs14) on Apple and Orange. The price of an Apple is Rs 2 and the price of an Orange is Rs1each. If the consumer wants to attain maximum utility, he should buy 5 units of apples and 4 units of oranges, so that he can get (88+54) 142 units.
Here MUA
PA =
MUo
PO ie,
4
1 =
4
1
A2 A3 and B2 B3 lines have not been used for explanation.
SHRI VIDHYABHARATHI MAT. HR. SEC. SCHOOL, SAKKARAMPALAYAM 99655-31727 Page 7
Diagrammatic Illustration In diagram 2.3, X axis represents the amount of money spent and Y axis represents the marginal utility of Apple and Orange respectively. If the consumer spends _10 on Apple and _4 on Orange, the marginal utilities of both are equal i.e.,AA1=BB1
(5=5). Hence, he gets maximum utility. 43. Laws of Returns to scale.
(i) In the long - there is no difference between fixed factor and variable factor in the sense that all factors are variable. (ii) The laws of returns to scale explain the relationship between output and the scale of inputs in the long run when all the inputs are increased in the same proportion. Assumptions Laws of Returns to Scale are based on the following assumptions.
All the factors of production (such as land, labour and capital) are variable but organization is fixed.
There is no change in technology. There is perfect competition in the market. Outputs or returns are measured in physical quantities.
Three Phases of Returns to Scale ( 1) Increasing Returns to Scale: In this case if all inputs are increased by one per cent, output increase by more than one per cent. ( 2) Constant Returns to Scale: In this case if all inputs are increased by one per cent, output increases exactly by one per cent. ( 3) Diminishing Returns to Scale: In this case if all inputs are increased by one per cent, output increases by less than one per cent.
SHRI VIDHYABHARATHI MAT. HR. SEC. SCHOOL, SAKKARAMPALAYAM 99655-31727 Page 8
Diagrammatic Illustration The three laws of returns to scale can be explained with the help of the diagram below.The movement from point a to point b represents increasing returns to scale. Because, between these two points output has doubled, but output has tripled. The law of constant returns to scale is implied by the movement from the point b to point c. Because, between these two points inputs have doubled and output also has doubled. Decreasing returns to scale are denoted by the movement from the point c to point d since doubling the factors from 4 units to 8 units produce less than the increase in inputs, that is, by only 33.33%. (OR) Diseconomies of Scale
The diseconomies of the scale are a disadvantage to a firm or an industry or an
organization. This necessarily increases the cost of production of a commodity or
service. Further it delays the speed of the supply of the product to the market.
These diseconomies are of two types:
a ) Internal Diseconomies of Scale: and
b ) External Diseconomies of Scale
Internal Diseconomies of Scale
When the scale of production increases beyond optimum limit, its efficiency may
come down.
External Diseconomies of Scale
The term “External diseconomies of scale” refers to the threat or disturbance to a
firm or an industry from factor lying outside it. For example a bus strike prevents
the easy and correct entry of the workers into a firm. Similarly the rent of a firm
increases very much if new economic units are established in the locality.
SHRI VIDHYABHARATHI MAT. HR. SEC. SCHOOL, SAKKARAMPALAYAM 99655-31727 Page 9
44. Total Fixed Cost (TFC) Total Fixed Cost All payments for the fixed factors of production are known as Total Fixed Cost.
Total Variable Cost (TVC) All payments to the variable factors of production is called as Total Variable Cost. Total Variable Cost
Total Cost Curves Total Cost means the sum total of all payments made in the production. It is also called as Total Cost of Production. Total Cost Curves
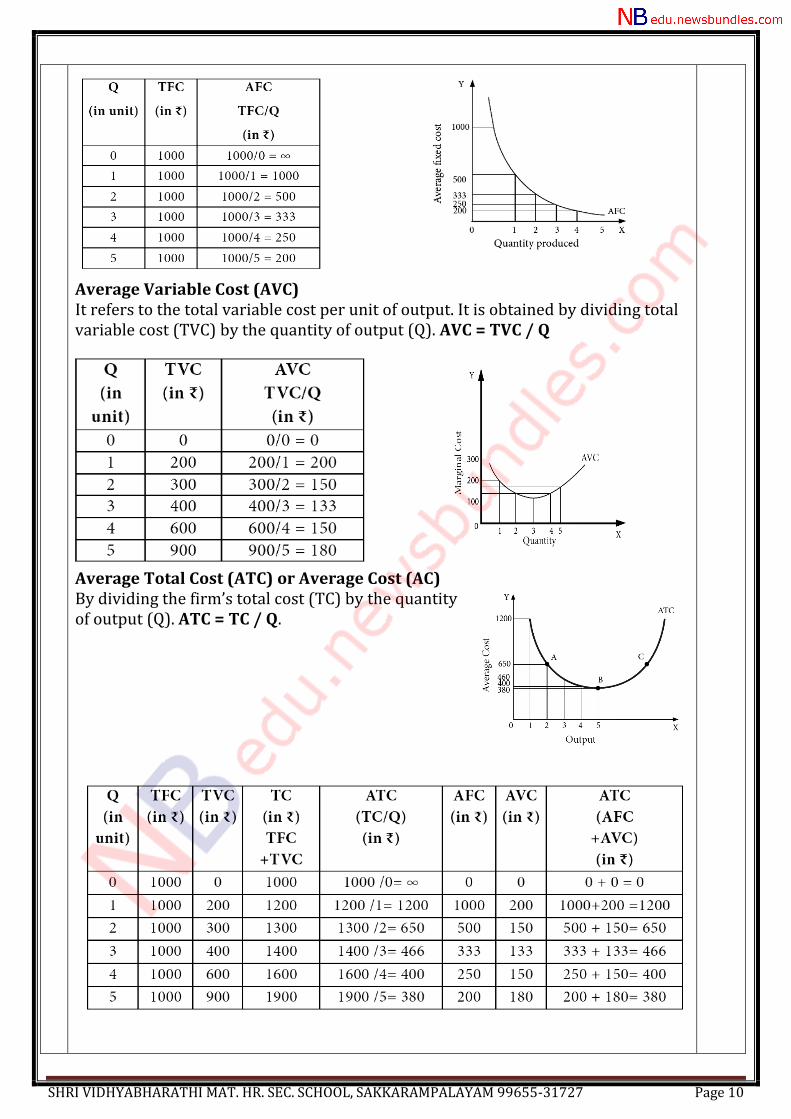
Average Fixed Cost (AFC) It refers to the _xed cost per unit of output. It is obtained by dividing the total _xed cost by the quantity of output. AFC = TFC / Q Average Fixed Cost
SHRI VIDHYABHARATHI MAT. HR. SEC. SCHOOL, SAKKARAMPALAYAM 99655-31727 Page 10
Average Variable Cost (AVC) It refers to the total variable cost per unit of output. It is obtained by dividing total variable cost (TVC) by the quantity of output (Q). AVC = TVC / Q
Average Total Cost (ATC) or Average Cost (AC) By dividing the firm’s total cost (TC) by the quantity of output (Q). ATC = TC / Q.
SHRI VIDHYABHARATHI MAT. HR. SEC. SCHOOL, SAKKARAMPALAYAM 99655-31727 Page 11
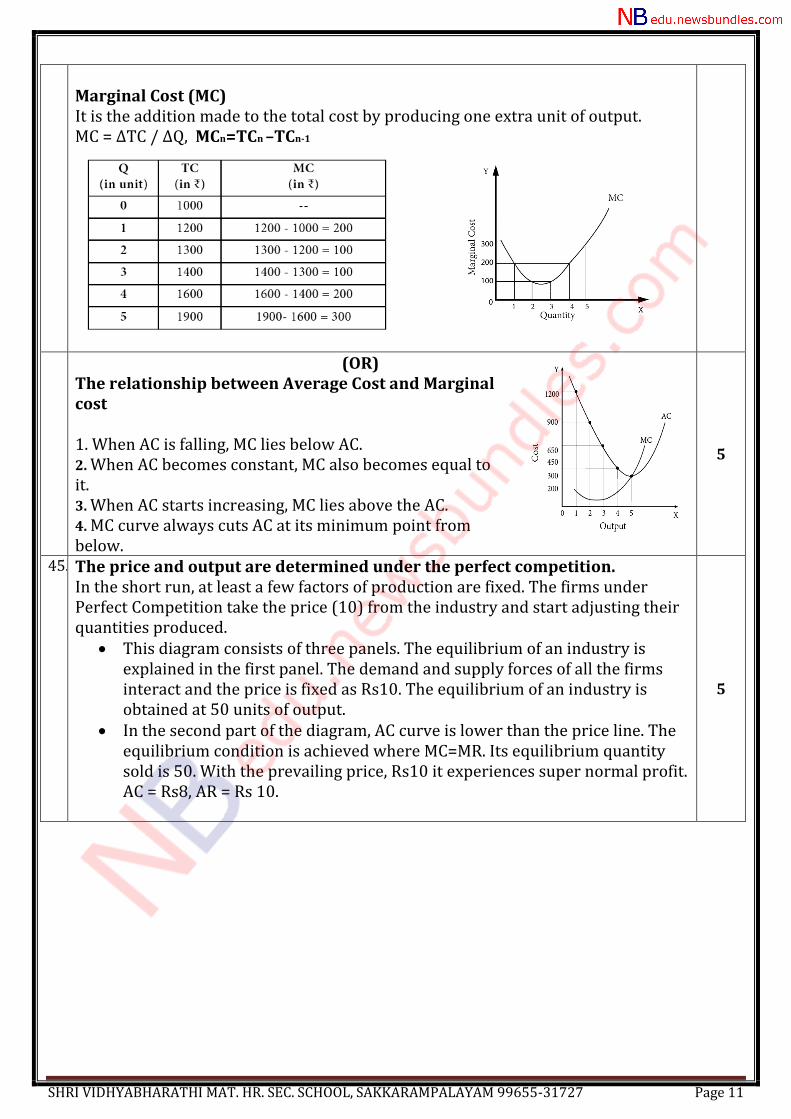
Marginal Cost (MC) It is the addition made to the total cost by producing one extra unit of output. MC = ∆TC / ∆Q, MCn=TCn –TCn-1
(OR) The relationship between Average Cost and Marginal cost 1. When AC is falling, MC lies below AC. 2. When AC becomes constant, MC also becomes equal to it. 3. When AC starts increasing, MC lies above the AC. 4. MC curve always cuts AC at its minimum point from below.
5
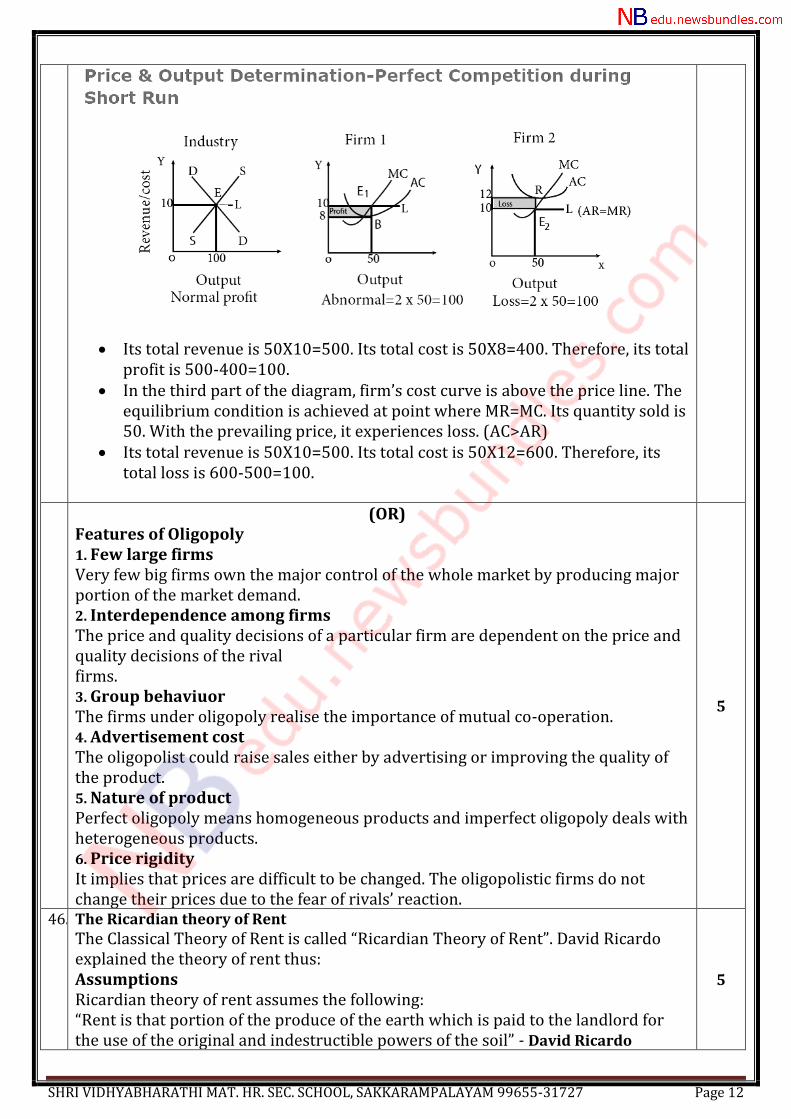
45. The price and output are determined under the perfect competition. In the short run, at least a few factors of production are fixed. The firms under Perfect Competition take the price (10) from the industry and start adjusting their quantities produced.
This diagram consists of three panels. The equilibrium of an industry is explained in the first panel. The demand and supply forces of all the firms interact and the price is fixed as Rs10. The equilibrium of an industry is obtained at 50 units of output.
In the second part of the diagram, AC curve is lower than the price line. The equilibrium condition is achieved where MC=MR. Its equilibrium quantity sold is 50. With the prevailing price, Rs10 it experiences super normal profit. AC = Rs8, AR = Rs 10.
SHRI VIDHYABHARATHI MAT. HR. SEC. SCHOOL, SAKKARAMPALAYAM 99655-31727 Page 12
Its total revenue is 50X10=500. Its total cost is 50X8=400. Therefore, its total profit is 500-400=100.
In the third part of the diagram, firm’s cost curve is above the price line. The equilibrium condition is achieved at point where MR=MC. Its quantity sold is 50. With the prevailing price, it experiences loss. (AC>AR)
Its total revenue is 50X10=500. Its total cost is 50X12=600. Therefore, its total loss is 600-500=100.
(OR) Features of Oligopoly 1. Few large firms Very few big firms own the major control of the whole market by producing major portion of the market demand. 2. Interdependence among firms The price and quality decisions of a particular firm are dependent on the price and quality decisions of the rival firms. 3. Group behaviuor The firms under oligopoly realise the importance of mutual co-operation. 4. Advertisement cost The oligopolist could raise sales either by advertising or improving the quality of the product. 5. Nature of product Perfect oligopoly means homogeneous products and imperfect oligopoly deals with heterogeneous products. 6. Price rigidity It implies that prices are difficult to be changed. The oligopolistic firms do not change their prices due to the fear of rivals’ reaction.
5
46. The Ricardian theory of Rent The Classical Theory of Rent is called “Ricardian Theory of Rent”. David Ricardo explained the theory of rent thus: Assumptions Ricardian theory of rent assumes the following: “Rent is that portion of the produce of the earth which is paid to the landlord for the use of the original and indestructible powers of the soil” - David Ricardo
SHRI VIDHYABHARATHI MAT. HR. SEC. SCHOOL, SAKKARAMPALAYAM 99655-31727 Page 13
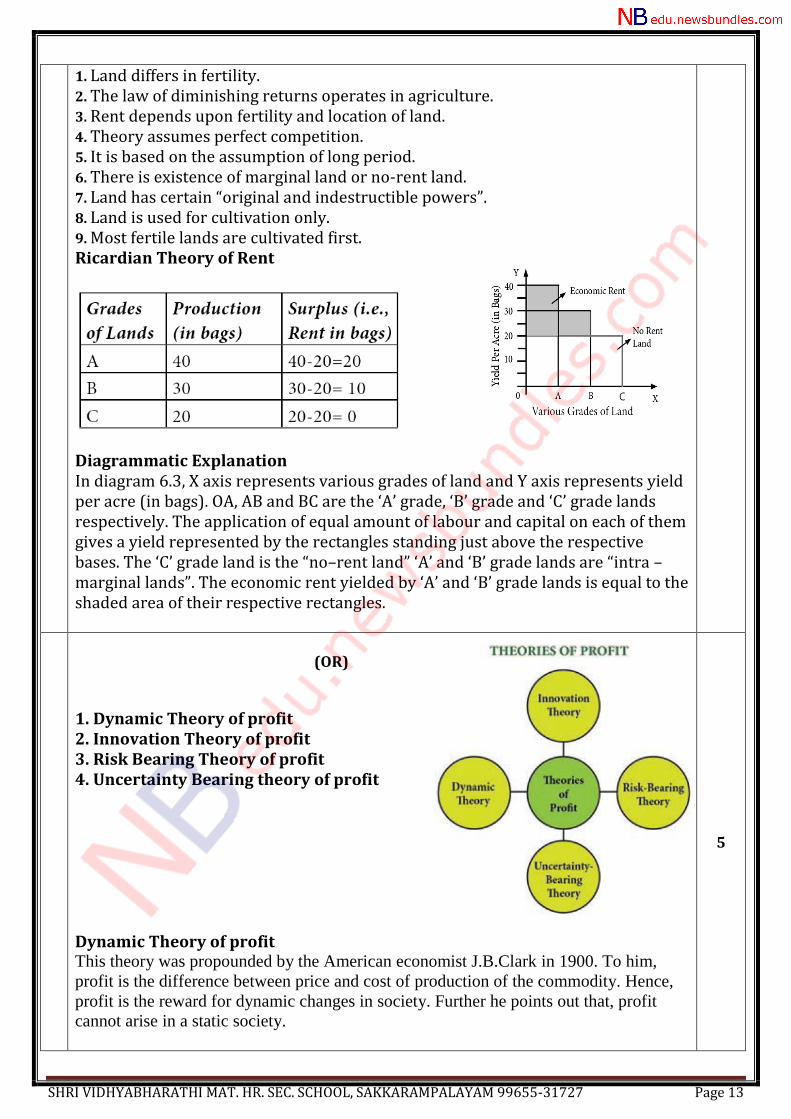
1. Land differs in fertility. 2. The law of diminishing returns operates in agriculture. 3. Rent depends upon fertility and location of land. 4. Theory assumes perfect competition. 5. It is based on the assumption of long period. 6. There is existence of marginal land or no-rent land. 7. Land has certain “original and indestructible powers”. 8. Land is used for cultivation only. 9. Most fertile lands are cultivated first. Ricardian Theory of Rent
Diagrammatic Explanation In diagram 6.3, X axis represents various grades of land and Y axis represents yield per acre (in bags). OA, AB and BC are the ‘A’ grade, ‘B’ grade and ‘C’ grade lands respectively. The application of equal amount of labour and capital on each of them gives a yield represented by the rectangles standing just above the respective bases. The ‘C’ grade land is the “no–rent land” ‘A’ and ‘B’ grade lands are “intra –marginal lands”. The economic rent yielded by ‘A’ and ‘B’ grade lands is equal to the shaded area of their respective rectangles. (OR) 1. Dynamic Theory of profit 2. Innovation Theory of profit 3. Risk Bearing Theory of profit 4. Uncertainty Bearing theory of profit Dynamic Theory of profit This theory was propounded by the American economist J.B.Clark in 1900. To him,
profit is the difference between price and cost of production of the commodity. Hence,
profit is the reward for dynamic changes in society. Further he points out that, profit
SHRI VIDHYABHARATHI MAT. HR. SEC. SCHOOL, SAKKARAMPALAYAM 99655-31727 Page 14
Static society is one where everything is stationary or stagnant and there is no change at
all. Therefore, there is no role for an entrepreneur in a static society. The price of the
commodities in a static society would be equal to their cost of production. So, there
would be no profit for the entrepreneur. The entrepreneur only gets wages for
management and interest on his capital.
Innovation Theory of profit Innovation theory of profit was propounded by Joesph. A.Schumpeter. To Schumpeter,
an entrepreneur is not only an undertaker of a business, but also an innovator in the
process of production. To him, profit is the reward for “innovation”. Innovation means
invention put into commercial practice.
Risk Bearing Theory of profit Risk bearing theory of profit was propounded by the American economist F.B.Hawley
in 1907. According to him, profit is the reward for “risk taking” in business. Risk taking
is an essential function of the entrepreneur and is the basis of profit. It is a well known
fact that every business involves some risks.
Uncertainty Bearing theory of profit Uncertainty theory was propounded by the American economist Frank H.Knight. To
him, profit is the reward for “uncertainty bearing”. He distinguishes between “insurable”
and “non-insurable” risks.
1. Insurable Risks 2. Non-Insurable Risks
47. Importance of Mineral Resources a. Iron-Ore India possesses high quality iron-ore in abundance. The total reserves of iron-ore in the country are about 14.630 million tonnes of haematite and 10,619 million tonnes of magnetite. Hematite iron is mainly found in Chattisgarh, Jharkhand, Odisha, Goa and Karnataka.The major deposit of magnetite iron is available at western coast of Karnataka. Some deposits of iron ore are also found in Kerala, Tamil Nadu and Andhra Pradesh. b . Coal and Lignite Coal is the largest available mineral resource. India ranks third in the world after China and USA in coal production. The main centres of coal in India are the West Bengal, Bihar, Madhya Pradesh, Maharashtra,Odisha and Andhra Pradesh. Bulk of the coal production comes from Bengal-Jharkhand coalfields. c. Bauxite Bauxite is a main source of metal like aluminium. Major reserves are concentrated in the East Coast bauxite deposits of Odisha and Andhra Pradesh. d. Mica Mica is a heat resisting mineral which is also a bad conductor of electricity. It is used in electrical equipments as an insulator. India stands first in sheet mica production and contributes 60% of mica trade in the world. The important mica bearing pegmatite is found in Andhra Pradesh, Jharkhand, Bihar and Rajasthan. e. Crude Oil Oil is being explored in India at many places of Assam and Gujarat. Digboi, Badarpur, Naharkatia, Kasimpur, Palliaria, Rudrapur, Shivsagar, Mourn (All in Assam) and Hay of Khambhat, Ankaleshwar and Kalol (All in Gujarat) are the important places of oil exploration in India. f. G old India possesses only a limited gold reserve. There are only three main gold mine regionsKolar Gold_eld, Kolar district and Hutti Gold_eld in Raichur district (both in Karnataka) and Ramgiri Gold_eld in Anantpur district (Andhra Pradesh). g. Diamond As per UNECE the total reserves of diamond is estimated at around 4582, thousand carats which are mostly available in Panna(Madhya Pradesh),Rammallakota of Kurnur district of
SHRI VIDHYABHARATHI MAT. HR. SEC. SCHOOL, SAKKARAMPALAYAM 99655-31727 Page 15
Andhra Pradesh and also in the Basin of Krishna River.The new Kimberlile fields have been discovered in Raipur and Pastar districts of Chattisgarh, Nuapada and Bargarh districts of Odisha, Narayanpet – Maddur Krishna areas of Andhra Pradesh and Raichur-Gulbarga districts of Karnataka. Weakness of Indian Economy 1. Large Population India stands second in terms of size of population next to China and our country is likely to overtake china in near future. Population growth rate of India is very high and this is always a hurdle to growth rate. The population growth rate in India is as high as 1.7 per 1000.The annual addition of population equals the total population of Australia. 2. Inequality and poverty There exists a huge economic disparity in the Indian economy. The proportion of income and assets owned by top 10% of Indians goes on increasing. This has led to an increase in the poverty level in the society and still a higher percentage of individuals are living Below Poverty Line (BPL). As a result of unequal distribution of the rich becomes richer and poor becomes poorer. 3. Increasing Prices of Essential Goods Even though there has been a constant growth in the GDP and growth there have been steady increase in the prices of essential goods. The continuous rise in prices erodes the purchasing power and adversely affects the poor people, whose income is not protected. 4. Weak Infrastructure Even though there has been a gradual improvement in the infrastructural development in the past few decades, there is still a scarcity of the basic infrastructure like power, transport, storage etc. 5. Inadequate Employment generation With growing youth population, there is a huge need of the employment opportunities. The growth in production is not accompanied by creation of job. The Indian economy is characterized by ‘jobless growth’. 6. Outdated technology The level of technology in agriculture and small scale industries is still outdated and obsolete.