70
SHRINKAGE: A COLLABORATIVE APPROACH TO REDUCING STOCK LOSS IN THE SUPPLY CHAIN UNIVERSITY School of Management
SHRINKAGE: A COLLABORATIVE APPROACHTO REDUCING STOCK LOSS INTHE SUPPLY CHAIN
UNIVERSITY
School of Management
Shrinkage: A Collaborative Approach
to Reducing Stock Loss in the Supply Chain
Shrinkage book 2003 Final**** 8/5/03 4:28 pm Page 1

S T O C K L O S S I N E U R O P E
Printed in the U.K. by AnchorPrint Group Limited. www.anchorprint.co.uk
Shrinkage book 2003 Final**** 8/5/03 4:28 pm Page 2
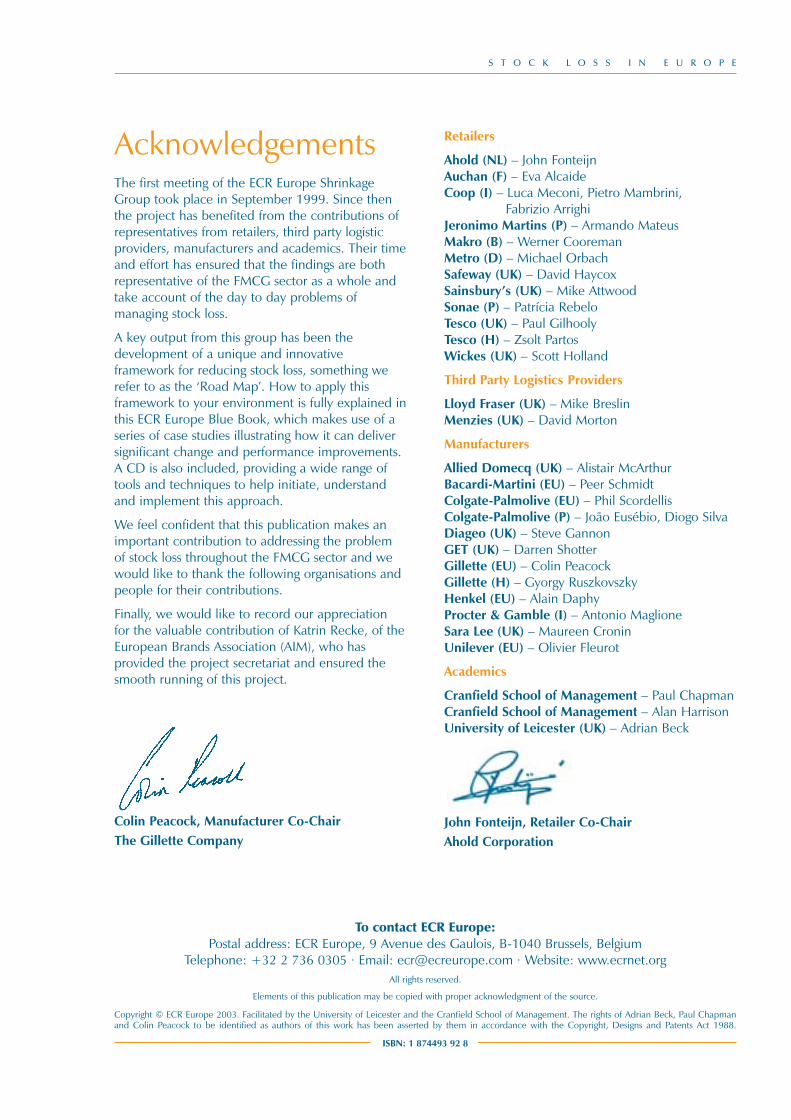
AcknowledgementsThe first meeting of the ECR Europe ShrinkageGroup took place in September 1999. Since thenthe project has benefited from the contributions ofrepresentatives from retailers, third party logisticproviders, manufacturers and academics. Their timeand effort has ensured that the findings are bothrepresentative of the FMCG sector as a whole andtake account of the day to day problems ofmanaging stock loss.
A key output from this group has been thedevelopment of a unique and innovativeframework for reducing stock loss, something werefer to as the ‘Road Map’. How to apply thisframework to your environment is fully explained inthis ECR Europe Blue Book, which makes use of aseries of case studies illustrating how it can deliversignificant change and performance improvements.A CD is also included, providing a wide range oftools and techniques to help initiate, understandand implement this approach.
We feel confident that this publication makes animportant contribution to addressing the problemof stock loss throughout the FMCG sector and wewould like to thank the following organisations andpeople for their contributions.
Finally, we would like to record our appreciationfor the valuable contribution of Katrin Recke, of theEuropean Brands Association (AIM), who hasprovided the project secretariat and ensured thesmooth running of this project.
Retailers
Ahold (NL) – John FonteijnAuchan (F) – Eva AlcaideCoop (I) – Luca Meconi, Pietro Mambrini,
Fabrizio ArrighiJeronimo Martins (P) – Armando MateusMakro (B) – Werner CooremanMetro (D) – Michael OrbachSafeway (UK) – David HaycoxSainsbury’s (UK) – Mike AttwoodSonae (P) – Patrícia RebeloTesco (UK) – Paul GilhoolyTesco (H) – Zsolt PartosWickes (UK) – Scott Holland
Third Party Logistics Providers
Lloyd Fraser (UK) – Mike BreslinMenzies (UK) – David Morton
Manufacturers
Allied Domecq (UK) – Alistair McArthurBacardi-Martini (EU) – Peer SchmidtColgate-Palmolive (EU) – Phil ScordellisColgate-Palmolive (P) – João Eusébio, Diogo SilvaDiageo (UK) – Steve GannonGET (UK) – Darren ShotterGillette (EU) – Colin PeacockGillette (H) – Gyorgy RuszkovszkyHenkel (EU) – Alain DaphyProcter & Gamble (I) – Antonio MaglioneSara Lee (UK) – Maureen CroninUnilever (EU) – Olivier Fleurot
Academics
Cranfield School of Management – Paul ChapmanCranfield School of Management – Alan HarrisonUniversity of Leicester (UK) – Adrian Beck
S T O C K L O S S I N E U R O P E
To contact ECR Europe:Postal address: ECR Europe, 9 Avenue des Gaulois, B-1040 Brussels, Belgium
Telephone: +32 2 736 0305 · Email: [email protected] · Website: www.ecrnet.orgAll rights reserved.
Elements of this publication may be copied with proper acknowledgment of the source.
Copyright © ECR Europe 2003. Facilitated by the University of Leicester and the Cranfield School of Management. The rights of Adrian Beck, Paul Chapmanand Colin Peacock to be identified as authors of this work has been asserted by them in accordance with the Copyright, Designs and Patents Act 1988.
ISBN: 1 874493 92 8
Colin Peacock, Manufacturer Co-Chair The Gillette Company
John Fonteijn, Retailer Co-ChairAhold Corporation
Shrinkage book 2003 Final**** 8/5/03 4:28 pm Page 3
S T O C K L O S S I N E U R O P E
Management Summary
There is an increasing recognition of the scale and extent of the problem of shrinkage in the FMCGsector. Current estimates suggest that in Europe alone it accounts for €18 billion a year. There is also agrowing realisation that existing approaches to tackle this problem have been piecemeal, partial andlargely ineffective. As we outline in this book, on average European retailer profits could be 29 per centhigher if they could reduce their losses through shrinkage by one half. In addition, some of theconsequences of shrinkage, such as out of stocks and restricted product availability, impact directlyupon shopper satisfaction.
Over the past three years the ECR Europe Shrinkage Group has developed a new approach to tacklingthe problem of stock loss, based upon genuine inter-company collaboration throughout the supplychain. The outcome of this work has been the development of the Shrinkage Reduction Road Map –an approach that is both systemic and systematic and designed to deliver real benefits to thecompanies using it.
It is important to recognise, however, that the Road Map needs to be incorporated into a shrinkagereduction strategy that is itself fully integrated into the overall corporate policy of the company.Companies therefore must appreciate that unless and until they give shrinkage management the sameweight and importance as other functions within the business such as sales, distribution and marketing,they will continue to suffer unacceptably high levels of loss.
An integrated shrinkage policy that is committed to ongoing improvement, recognises the value ofworking with partners throughout the supply chain, and uses the ECR Road Map to deliver targetedsolutions to particular problems, will make a significant contribution to the overall profitability of thebusiness.
The case studies presented in this Blue Book offer real examples of how the Road Map can be used todevelop and deploy end to end solutions – it has been tried and tested to show it is practical, easy touse, robust and capable of delivering results in just a few weeks. Detailed in this book and theaccompanying CD is the rationale for adopting this approach and the tools and techniques that can beused to implement the Road Map.
Above all, the application of this approach to managing shrinkage can bring companies a realopportunity to increase profits and customer satisfaction – a win-win outcome that should make thisBlue Book essential reading for the FMCG sector!
Shrinkage book 2003 Final**** 8/5/03 4:28 pm Page 4
Table of ContentsIntroduction ...................................................................................................1
Managing Shrinkage: A Missed Opportunity ...............................................3
Defining Shrinkage..................................................................................5
Counting the Cost...................................................................................5
The Shrinkage Iceberg ............................................................................6
Causes of Shrinkage ................................................................................6
Lack of Co-operation ..............................................................................7
Problems of Managing Shrinkage ............................................................8
Time to Take Action................................................................................8
Integrating Shrinkage into Corporate Policy ................................................9
Defining Accountability for Shrinkage Reduction...................................11
Responsibility for Shrinkage ..................................................................12
Contextualise Shrinkage Against Corporate Objectives ..........................12
Developing Detailed Measures of Shrinkage .........................................14
Implementing Best Practice...................................................................15
Developing Policy in a Structured Way .................................................17
Recognising the Need for Ongoing Improvement..................................18
The Shrinkage Reduction Road Map ..........................................................21
Step 1: Develop a Project Plan .............................................................24
Step 2: Map Key Processes & Gather Measures ....................................27
Step 3: Analyse Risk and Identify Root Causes ......................................29
Step 4: Develop Solutions and Prioritise Actions ...................................32
Step 5: Implement and Trial Solutions...................................................34
Step 6: Evaluate Implementation ..........................................................37
Road Map Epilogue ..............................................................................38
Shrinkage Reduction Case Studies .............................................................39
Sonae and Colgate Palmolive ................................................................43
Sainsbury’s and a Consortium of Branded Spirits Suppliers ..................47
Tesco and Gillette .................................................................................53
Wickes, Lloyd Fraser and GET...............................................................57
Coop Italia and Procter & Gamble ........................................................60
CD Table of Contents
Case Study Presentations and Videos ...................................................CD
Shrinkage Reduction Toolbox...............................................................CD
Supporting Documents ........................................................................CD
S T O C K L O S S I N E U R O P E
Shrinkage book 2003 Final**** 8/5/03 4:28 pm Page 5

S T O C K L O S S I N E U R O P E
Shrinkage book 2003 Final**** 8/5/03 4:28 pm Page 6
S T O C K L O S S I N E U R O P E
IntroductionThe aim of the ECR Europe shrinkage project was toidentify the scale and extent of stock loss in the FastMoving Consumer Goods (FMCG) sector, anddevelop a joint vision on how retailers,manufacturers and distributors could work togetherto reduce the problem of shrinkage.
In recognition of the complex nature of the stock lossproblem, two academic organisations were selectedto manage the research programme. The Universityof Leicester was chosen for their expertise in the areaof security and retail crime while the CranfieldSchool of Management was chosen for theirspecialism in the field of supply chain managementand logistics. Working together these two groups ofexperts have combined their knowledge to bringfresh thinking to the FMCG sector in an effort toachieve a coherent and comprehensive approach totackling stock loss. This study breaks much newground with the first pan-European study of stockloss in the FMCG supply chain and the developmentand validation of the Road Map – a collaborativeand systematic approach to reducing stock loss.
This report is intended to be a concise document,focused on convincing the industry to adopt theRoad Map. It draws on an earlier report by theUniversity of Leicester dealing with the size andnature of the stock loss problem within the FMCGsector, based upon a pan-European survey ofretailers and manufacturers1, and research carriedout by Cranfield School of Management on thesupply chains of 23 European companies.
If collaborative efforts are increased, the industry could start to reduce
its losses significantly
Looking forward there is good reason to believethat collaborative efforts, guided by the Road Map,can contribute to total systems efficiency throughoutthe supply chain. While the evidence shows thatthere are opportunities for increased internalcollaboration in all areas of the supply chain, it is thecollaborative efforts between retailers, distributorsand manufacturers working to reduce stock losswithin retail stores where the most impact is likely tobe made. Companies along the supply chain need to
work together to identify improvements in a widerange of areas including: product design, packaging,administration, logistics, stock control, replenishmentplanning, stock room management, store layout,shelf design and people management. Getting it rightrequires teamwork, a structured approach and harddata on the extent and nature of stock lossthroughout the entire supply chain: a paradigm shiftaway from where many companies are today. But ifthis is done, all parties, not least the shopper, whowill see greater availability and choice on the shelf,will benefit. This in turn will increase sales and profitsfor both retailers and manufacturers.
Getting it right will require teamwork,a structured approach and hard data
on the extent and nature of stockloss throughout the entire supply chain
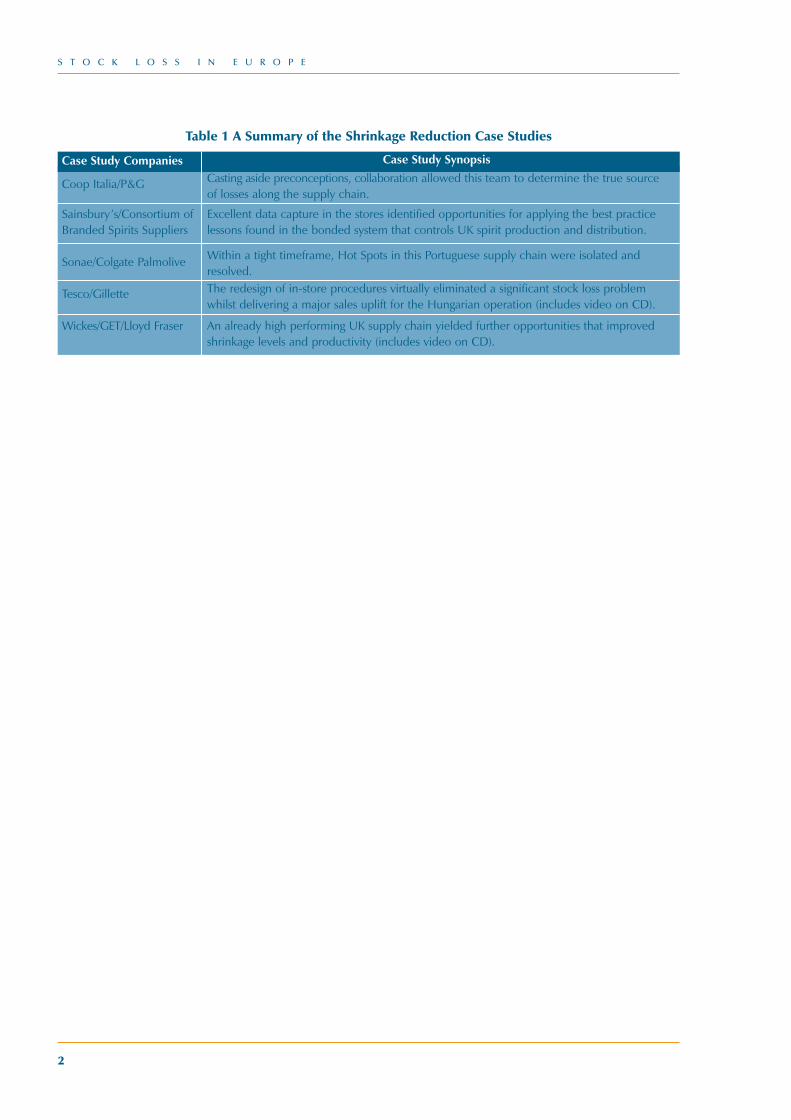
A CD-ROM accompanies this ECR Blue Book. Thiscontains material that provides practical assistancefor teams undertaking a loss reduction project. Thisincludes tools and techniques that help the teamfollow the steps in the Road Map and come invarious forms, including questionnaires, check-sheets and spreadsheets. The CD also includes aseries of case studies taken from projects carriedout by companies in the ECR movement, consistingof a presentation from the project teams. It alsoincludes two videos. A brief synopsis of each case ispresented in Table 1 overleaf.
1
1 This report is available from Adrian Beck at [email protected].
Shrinkage book 2003 Final**** 8/5/03 4:28 pm Page 1
S T O C K L O S S I N E U R O P E
2
Table 1 A Summary of the Shrinkage Reduction Case Studies
Case Study Synopsis
Casting aside preconceptions, collaboration allowed this team to determine the true sourceof losses along the supply chain.
Excellent data capture in the stores identified opportunities for applying the best practicelessons found in the bonded system that controls UK spirit production and distribution.
Within a tight timeframe, Hot Spots in this Portuguese supply chain were isolated andresolved.The redesign of in-store procedures virtually eliminated a significant stock loss problemwhilst delivering a major sales uplift for the Hungarian operation (includes video on CD).
An already high performing UK supply chain yielded further opportunities that improvedshrinkage levels and productivity (includes video on CD).
Case Study Companies
Coop Italia/P&G
Sainsbury’s/Consortium of Branded Spirits Suppliers
Sonae/Colgate Palmolive
Tesco/Gillette
Wickes/GET/Lloyd Fraser
Shrinkage book 2003 Final**** 8/5/03 4:28 pm Page 2

Managing Shrinkage: A Missed Opportunity
Shrinkage book 2003 Final**** 8/5/03 4:28 pm Page 3

S T O C K L O S S I N E U R O P E
Shrinkage book 2003 Final**** 8/5/03 4:28 pm Page 4
S T O C K L O S S I N E U R O P E
5
Managing Shrinkage:A MissedOpportunityDefining Shrinkage In order to resolve shrinkage, it is important to haveclarity about what it is. The ECR team considersshrinkage as consisting of four elements, as shownbelow.
Process failures can occur in the physical flow ofgoods along the supply chain, in informationsystems or in finance systems. The effect of failurein any one of these systems is that stock will be lostand/or payment for goods is incorrect. Whenconsidering fresh product, process failure is likely tobe the biggest cause of shrinkage. Inter-companyfraud leads to shrinkage when trading partnersintentionally deliver the wrong quantities and/orcharge for goods to their advantage. This tends tooccur when poor processes, procedures or controlsare exploited. Whilst the effect is similar, theft iscategorised as being either internal, e.g. byemployees or contracted staff, or external, e.g. shopthieves or burglars. The ways theft occurs can varysignificantly although in many instances it is aconsequence of poor processes, procedures orcontrols within a company. Theft accounts for asignificant proportion of shrinkage in the FMCGsector with ‘Hot Products’2 being particularlyvulnerable.
Counting the CostThe FMCG sector in Europe is big business with acombined market turnover of over €820 billion.The groundbreaking research carried out on behalfof ECR Europe showed that shrinkage is a majorthreat to the efficiency and effectiveness of thesector. In 2000, retailers lost €13.4 billion due toshrinkage, equating to 1.75% of turnover or €258million a week. Manufacturers are not immunefrom this problem and lost €4.6 billion, accountingfor 0.56% of turnover or €89 million a week. Takentogether, the FMCG sector is haemorrhaging €18billion a year due to stock loss. In addition, retailersalone are spending €2.14 billion trying to tackle thisproblem. The impact on profitability is dramaticand retail profits could be 29% higher if companiesreduced losses due to shrinkage by 50%.3
Table 2. Stock Loss in Europe
2 Hot products are described as ‘CRAVED’ by thieves: Concealable; Removable, Available, Valuable, Enjoyable, and Disposable. See Clarke, R.V. (1999) Hot products: understanding,anticipating and reducing demand for stolen goods, Home Office Police Research Series paper 112, HMSO, London.
3 Based upon data provided by ECR Europe on the average profit margin for retailers operating in the FMCG sector.
Figure 1. Defining Shrinkage
ProcessFailures
Shrinkage
Inter-CompanyFraud
Internal Theft
External Theft
Sector Loss as percentage Valueof sales (€ billions)
Retailers 1.75 13.4Manufacturers 0.56 4.6Total 2.31 18.0
Shrinkage book 2003 Final**** 8/5/03 4:28 pm Page 5
The FMCG sector is losing €50 million a day due to shrinkage. Annually this
is equivalent to the GDP ofLuxembourg
The FMCG sector is highly complex with manymanufacturers having logistical webs covering all ofEurope, while many retailers have product rangesbetween 40,000-250,000 SKUs. Research showsthat all points of the logistical chain are vulnerableto loss not just the retail store. In 2000, €6.1 billionof stock was lost even before it made it to stores.
The Shrinkage IcebergInformation on stock loss is shrouded in ignoranceand hearsay. At best, company information on thisproblem is partial and incomplete and at worstnon-existent. Research carried out for ECR Europefound that most retail companies do not knowwhere, how or when the majority of their lossesoccurred. Manufacturers can only boast a slightlybetter record although even they cannot accountfor over 40% of their losses. In 2000, retailers wereunable to explain how €7.9 billion of stock waslost, while manufacturers were unable to pinpointhow €1.9 billion of their products ‘disappeared’.Taken together, the FMCG sector cannot accountfor nearly €10 billion of stock.
Gathering high quality data that is reliable, timelyand complete needs to be a priority for any futurestock loss reduction strategy. At the moment, whilea number of companies regularly collectcomputerised information on process failures, veryfew keep track of all the shrinkage threats, inparticular theft. If a problem is not recorded and
analysed, it is highly unlikely that it will beunderstood or tackled effectively. Retailers andmanufacturers do not know where, how or whenthey lose €192 million a week.
Without doubt, a paucity of data plays a pivotal part in producing
poor product protection
Causes of ShrinkageHighlighting how stock is lost is a vital part of anyeffective stock loss reduction strategy – it can identifypriorities and enable responses to be tailored tospecific needs. The research showed that for retailers,the biggest perceived threat came from theft – over€8 billion or over 60% of all stock loss was thought to
S T O C K L O S S I N E U R O P E
6
Retail
KNOWN
UNKNOWN
41%
41%
59%
59%
Manufacturers
Figure 2. The Shrinkage Iceberg: Known and Unknown Loss
Figure 3. Shrinkage in the European Fast Moving Consumer Goods Sector
26%Manufacturer Distribution
€12 Billion
8% Retail Distribution
66% Retail Stores
€4.6 Billion €1.5 Billion
TOTAL€18 Billion=
Shrinkage book 2003 Final**** 8/5/03 4:28 pm Page 6
be due to staff and ‘customers’ thieving from theirorganisations. Process failures were seen as the nextmajor cause of shrinkage – €3.6 billion lost due toproducts being ‘misplaced’ in the supply chain,getting damaged or going out of date. Formanufacturers, the biggest culprit was process failureswith over three-quarters of all losses being seen as aconsequence of this. For them theft was less of anissue although it still accounted for over €1 billion ofloss in 2000. Theft is thought to account for over €9billion of loss in the FMCG sector
Lack of Co-operationShrinkage is a problem that transcendsdepartmental and company boundaries – it is acommon problem requiring shared solutions. TheECR Europe research showed a lack of co-operation not only within companies, but alsobetween companies who are involved in the supplychain. For the most part retailers see stock loss asthe exclusive responsibility of the security/lossprevention and audit departments, and storemanagement, while manufacturers tend to put theonus upon the logistics team to deal with thisproblem. Few other departments are highly
involved, with retailers rarely involving buyers,marketing, the IT department or indeed the Boardof Directors. Similarly, manufacturers rarely makeuse of the research and development team, salesand marketing or human resources.
The picture is even gloomier when inter-companyco-operation is considered. For retailers, thecurrent climate is characterised by an emphasis onreactive collaboration with security providers andthe police. Relatively few pointed to work withindividual manufacturers or their representativeorganisations. Manufacturers were even moreisolated with less than 1 in 3 working withindividual retailers on issues of stock loss and mostfocusing their co-operative efforts on third partylogistics service providers.
S T O C K L O S S I N E U R O P E
7
Inter-Company Fraud 12% Process Failures 27%
Internal Theft 24%External Theft 37%
Internal Theft 11% Process Failures 78%
External Theft 11%
Figure 4. Causes of Stock Loss in the Retail Sector
Figure 5. Causes of Stock Loss in theManufacturing Sector
0 20 40 60 80 100
0 20 40 60 80 100
Store Mangt
Human Resources
Supply Chain Mangt
Finance & Auditing
New Store Planning
Logistics
Board of Directors
Buying/Trading
IT Department
Marketing
Legal Department
Finance & Auditing
Factory/DC Mangt
Factory & DC Planning
Security Department
Board of Directors
Product Design
Sales
Marketing
Legal Department
Research & Development
IT Department
Human Resources
Highly Involved Regularly Involved Hardly Involved
Retailers
Manufacturers
Figure 6. Intra Company Co-operation for BothRetailers and Manufacturers
Shrinkage book 2003 Final**** 8/5/03 4:28 pm Page 7
Problems of Managing ShrinkageThe management of shrinkage has suffered from anumber of inter-related problems that havecombined to limit its effectiveness in dealing withan issue that is costing businesses billions of Euro ayear both in terms of losses and expenditure on socalled ‘solutions’.
Unfortunately Necessary
Shrinkage management suffers from an imageproblem within organisations. Too often it is notseen as actively contributing to bottom lineprofitability. It is seen as a regrettable consequenceof doing business or a function that can be calledupon when things have gone badly wrong, such asa break-in, when products have been contaminatedor a member of staff has been attacked. To thisend, it is often seen as the task that requires skillssimilar to those used in public policing, i.e.detaining offenders and employing guards.
Juggling Priorities
The roles and responsibilities of security/lossprevention departments are often many and varied,ranging from issues of health and safety, throughmonitoring contract guarding companies, toresponding to kidnap attempts on senior membersof the organisation. Some of this myriad of dutiesare statutory requirements. Non-compliance canresult in substantial penalties, which means thatstock loss receives a lower priority from thosepeople tasked with its management.
Solutions Searching for a Problem
Many of the methods and approaches currentlyadopted by shrinkage managers focus on oneparticular problem: shoplifting, coupled with analmost obsessive belief that the answer can befound in a quick fix technological panacea. As thedata presented above has shown, retail shrinkagemanagers themselves suggest that only about one-third of loss is caused by external theft, and yet asone senior manager put it: ‘tackling shopliftingaccounts for about 95 per cent of our securitybudget’. In addition, security services andtechnology providers have been able to drive thestock loss agenda on a ‘we have a solution, can wenow find a problem’ basis.
‘Tackling shoplifting accounts for about 95 per cent of our
security budget’(Senior Retail Manager)
Myopic Management
Many shrinkage practitioners have a tendency tosee the problem as only occurring at the end of thesupply chain – after the products eventually reachthe store. This is in part a function of theprioritisation of shoplifting as the primary cause ofstock loss. The store is the point at which customersinteract with the products and where many of thecurrent technology ‘solutions’ are most easilyapplied. But as shown above, up to one third ofloss takes place before the goods have reached theretail outlet, highlighting the need to look at lossesof goods in transit and while being stored indistribution centres. Certainly the stores are a veryvulnerable part of the supply chain, but they areonly a part of the chain and stock loss practitionersneed to look beyond the retail outlet and recognisethat good loss prevention is about securing theentire supply chain.
Time to Take ActionThe research carried out for ECR Europe clearlyshows that to date the FMCG sector has neglectedthe problem of shrinkage and its effectivemanagement. It is a sector suffering enormouslosses, lacking any detailed understanding of theextent and nature of the problem, with existingapproaches tending to be ad hoc, piecemeal,partial and lacking in intra- and inter- company co-operation. It is time for the FMCG sector to act andtackle this problem through a systematic and co-ordinated approach. The consequence of not doingthis is an ever-increasing bill for shrinkage, whichcurrently stands at €18 billion per year.
S T O C K L O S S I N E U R O P E
8
Shrinkage book 2003 Final**** 8/5/03 4:28 pm Page 8

Integrating Shrinkage into Corporate Policy
Shrinkage book 2003 Final**** 8/5/03 4:28 pm Page 9

S T O C K L O S S I N E U R O P E
10
Shrinkage book 2003 Final**** 8/5/03 4:28 pm Page 10
Integrating Shrinkageinto Corporate PolicyRecent research carried out by ECR Europeexamined the causes of shrinkage, looking at 12FMCG supply chains. Each supply chain wasinvestigated from supplier right through to the shelfin the retailers’ store. A key phenomenon observedin the approaches adopted to tackle shrinkage wasthat they tended to be crisis driven – resource andattention was only applied when a significant eventhad occurred or extraordinary levels of loss hadcome to light. The response was ad-hoc and usuallydriven by a series of well-worn anecdotes –‘shoplifters must be the problem’.
This research also showed that while a multitude ofalternative solutions to shrinkage exist, lossprevention specialists often prioritised those thatinvolved the use of technology. In addition, it wasfound that efforts to reduce shrinkage typicallyfailed to consider the impact they have on otherbusiness objectives, for instance sales, stockavailability and customer satisfaction. Solutionswere often imposed unilaterally by one party in thesupply chain without considering the impact onother groups; something which is clearly at oddswith the collaborative approach supported by ECR.
Finally the implementation of solutions was notfollowed by an analysis of their effectiveness – therewas little evidence of the collection of hard data onwhat impact the intervention had had within thesupply chain. In stark contrast to good practicesobserved elsewhere in the FMCG industry,shrinkage reduction cannot claim to be part of the‘knowledge economy.’ The lack of data on theimpact of previous shrinkage solutions thereforeundermines the ability of businesses to make soundbusiness decisions. When the next crisis occurs theold cycle continues: ad-hoc reactions based onanecdotes emphasising the problem of shopliftingand the usefulness of technology-based solutions.
Traditional approaches to shrinkagemanagement are crisis driven
In order to break out of this cycle, the managementof shrinkage needs to be fully integrated into overallcorporate policy, giving it the same weight andimportance as other functions within the business
such as sales, distribution and marketing. Inaddition, it needs to develop a corporate shrinkagepolicy that extends beyond the company toeffectively incorporate all supply chain partners. Anintegrated shrinkage policy needs to be properlyresourced, it needs appropriate channels ofaccountability and it needs to incorporate themechanisms to capture high quality shrinkage dataso that key performance indicators can bedeveloped and the value of solutions assessed.
Through adopting such an approach, companiesare far more likely to develop and deploy bestpractice in reducing shrinkage throughout thesupply chain. This Blue Book is designed to helpwith this process. The ECR Shrinkage ReductionRoad Map described in detail later in this book is atried and tested tool to help companies to developa corporate shrinkage strategy committed toongoing improvement and recognised ascontributing to the overall profitability of thebusiness. The key components of developing anintegrated shrinkage policy are outlined below.
Defining Accountability for Shrinkage ReductionTo deliver the opportunity that shrinkage reductionpresents for profit enhancement, there needs to bea senior manager or ‘champion’ accountable for it.This person co-ordinates the development of theshrinkage policy, ensuring that the knowledge andexperience of stakeholders from across the supplychain are incorporated. They then oversee itsmanagement within their company and ensurecollaboration with supply chain partners. Morespecifically, this person ensures the followingactions are undertaken:
• Set and agree policy:
– Internally with the senior management team.
– Externally in collaboration with supply chainpartners.
• Set KPIs:
– Identify the metrics needed to make informed decisions on shrinkage issues.
– Design a system to collect and collate the necessary information.
• Allocate responsibility to deliver the policy:
– Collect data.
S T O C K L O S S I N E U R O P E
11
Shrinkage book 2003 Final**** 8/5/03 4:28 pm Page 11
– Research/mine data.
– Plan and undertake actions to reduce loss.
• Monitor performance and adherence to thepolicy and revise as appropriate.
These activities require resources and naturally nomanagement team should make such acommitment lightly. However the ECR researchfound that companies employing dedicatedsecurity/loss prevention departments and auditdepartments suffered much lower losses due toshrinkage. For those retailers with a security/lossprevention department, the level of stock loss was27% lower. Similarly, manufacturers with such aspecialist department also benefited fromsignificantly lower levels of loss. The impact ofdedicated audit departments was even moredramatic – retailers with such a function had losses39% lower than those companies without such adepartment. Once again, this picture was mirroredin the data from manufacturers. It was also foundthat having the opportunity to report directly to theBoard of Directors significantly improved theperformance of these specialist teams. Theconclusion is that having specialist teams that reportdirectly to the Board of Directors can significantlyreduce losses from shrinkage.
Responsibility for ShrinkageWhilst it is necessary to assign accountability fordelivering results at a senior level in theorganisation, responsibility for undertaking the tasksnecessary to reduce losses should be devolved tooperational managers throughout the organisation.Stock loss is a cross-functional problem andexamples of poor management that lead to stockloss can be seen in most areas. For example:
• Logistics managers failing to follow receiving anddispatch procedures.
• Operations managers storing vulnerable productsin locations that are difficult to supervise.
• HR managers failing to carry out routine checkson new employees.
• Facilities managers failing to liase with architectsto design out well-known problems in storelayout and warehouse design.
• Product designers failing to ensure packagingprotects its contents.
• Category mangers failing to set up productattributes correctly.
• Sales managers overstocking shelves andpromoting vulnerable products withoutconsidering the impact on losses.
It is therefore necessary for managers in these andall other functions to be aware of theirresponsibility to reduce shrinkage. Their rolesshould therefore include an obligation to collateand act upon data on stock loss within their sphereof influence. Results from action to resolveoutstanding issues are then reported up themanagement structure to the person accountablefor shrinkage.
Contextualise Shrinkage AgainstCorporate ObjectivesSuccessful shrinkage management requires it to berecognised and prioritised as a key componentwithin the objectives of the corporation. To beeffective, shrinkage results should becommunicated regularly at board level, not hiddenfrom view amongst the general cost of doingbusiness. Shrinkage justifies this need formanagerial attention because of two factors:
• Impact of shrinkage on corporate results.
• Impact of shrinkage on shopper satisfaction.
Impact of Shrinkage on Corporate Results
Shrinkage thwarts the efforts of retailers andmanufacturers to deliver their financial objectives asthe cost of shrinkage is both significant and has anegative impact upon sales. Considering the cost ofshrinkage, the most significant element is typicallythe cost of lost stock. Described in detail earlier, itis worth recapping that the FMCG sector is losing2.31% of the value of its turnover to shrinkage. Thesignificance cost of shrinkage becomes clearerwhen considered in terms of retailer profitability. Areview of 25 European supermarket chains’ annualreports for year 2000 revealed an average profitmargin of 3%, while the cost of shrinkage wascalculated at 1.75% of turnover. If the cost ofshrinkage was halved, the retail sector couldincrease its average profitability from 3% to 3.88%,a growth of nearly one-third (Figure 7).
S T O C K L O S S I N E U R O P E
12
Shrinkage book 2003 Final**** 8/5/03 4:28 pm Page 12
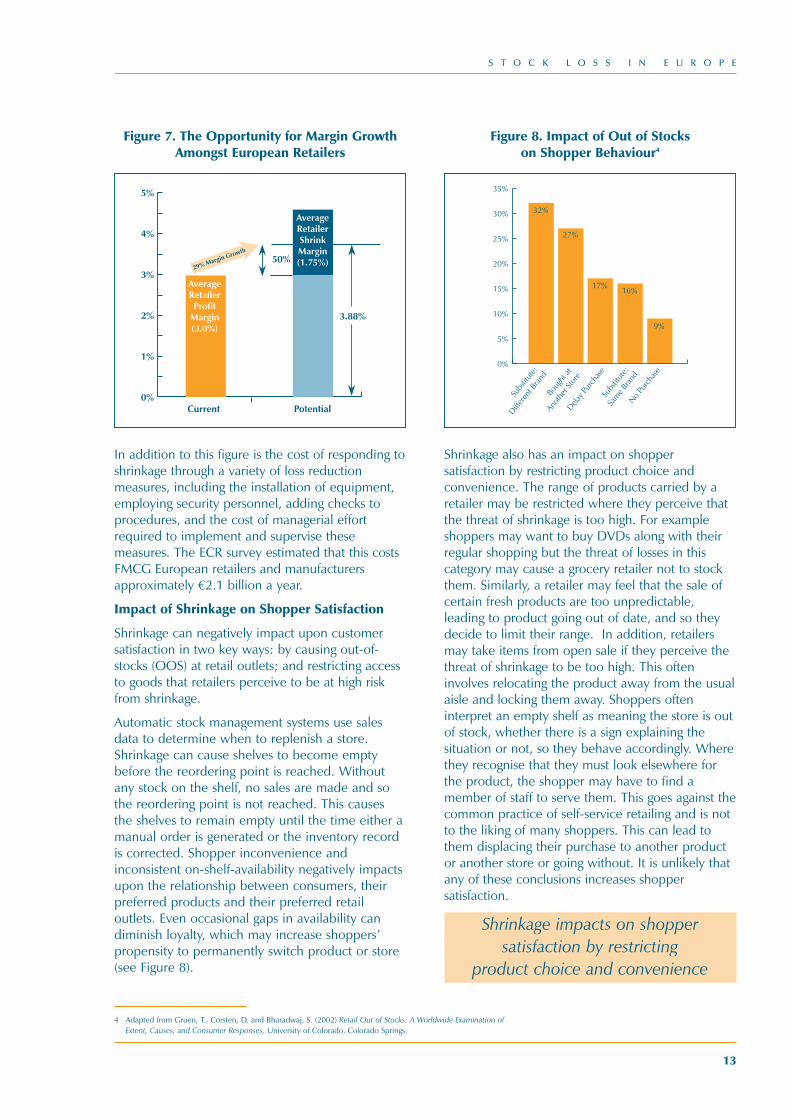
Figure 7. The Opportunity for Margin GrowthAmongst European Retailers
In addition to this figure is the cost of responding toshrinkage through a variety of loss reductionmeasures, including the installation of equipment,employing security personnel, adding checks toprocedures, and the cost of managerial effortrequired to implement and supervise thesemeasures. The ECR survey estimated that this costsFMCG European retailers and manufacturersapproximately €2.1 billion a year.
Impact of Shrinkage on Shopper Satisfaction
Shrinkage can negatively impact upon customersatisfaction in two key ways: by causing out-of-stocks (OOS) at retail outlets; and restricting accessto goods that retailers perceive to be at high riskfrom shrinkage.
Automatic stock management systems use salesdata to determine when to replenish a store.Shrinkage can cause shelves to become emptybefore the reordering point is reached. Withoutany stock on the shelf, no sales are made and sothe reordering point is not reached. This causesthe shelves to remain empty until the time either amanual order is generated or the inventory recordis corrected. Shopper inconvenience andinconsistent on-shelf-availability negatively impactsupon the relationship between consumers, theirpreferred products and their preferred retailoutlets. Even occasional gaps in availability candiminish loyalty, which may increase shoppers’propensity to permanently switch product or store(see Figure 8).
Figure 8. Impact of Out of Stocks on Shopper Behaviour4
Shrinkage also has an impact on shoppersatisfaction by restricting product choice andconvenience. The range of products carried by aretailer may be restricted where they perceive thatthe threat of shrinkage is too high. For exampleshoppers may want to buy DVDs along with theirregular shopping but the threat of losses in thiscategory may cause a grocery retailer not to stockthem. Similarly, a retailer may feel that the sale ofcertain fresh products are too unpredictable,leading to product going out of date, and so theydecide to limit their range. In addition, retailersmay take items from open sale if they perceive thethreat of shrinkage to be too high. This ofteninvolves relocating the product away from the usualaisle and locking them away. Shoppers ofteninterpret an empty shelf as meaning the store is outof stock, whether there is a sign explaining thesituation or not, so they behave accordingly. Wherethey recognise that they must look elsewhere forthe product, the shopper may have to find amember of staff to serve them. This goes against thecommon practice of self-service retailing and is notto the liking of many shoppers. This can lead tothem displacing their purchase to another productor another store or going without. It is unlikely thatany of these conclusions increases shoppersatisfaction.
Shrinkage impacts on shopper satisfaction by restricting
product choice and convenience
S T O C K L O S S I N E U R O P E
13
0%
5%
10%
15%
20%
25%
30%
35%
No Pu
rchas
e
Subs
titut
e:
Sam
e Bra
nd
Delay P
urch
ase
Boug
ht at
Anot
her S
tore
9%
Subs
titut
e:
Differe
nt B
rand
32%
16%17%
27%
0%
1%
2%
3%
4%
5%
3.88%
AverageRetailerShrinkMargin(1.75%)
AverageRetailerProfit
Margin(3.0%)
50%29% Margin Growth
Current Potential
4 Adapted from Gruen, T., Corsten, D. and Bharadwaj, S. (2002) Retail Out of Stocks: A Worldwide Examination ofExtent, Causes, and Consumer Responses, University of Colorado, Colorado Springs.
Shrinkage book 2003 Final**** 8/5/03 4:28 pm Page 13
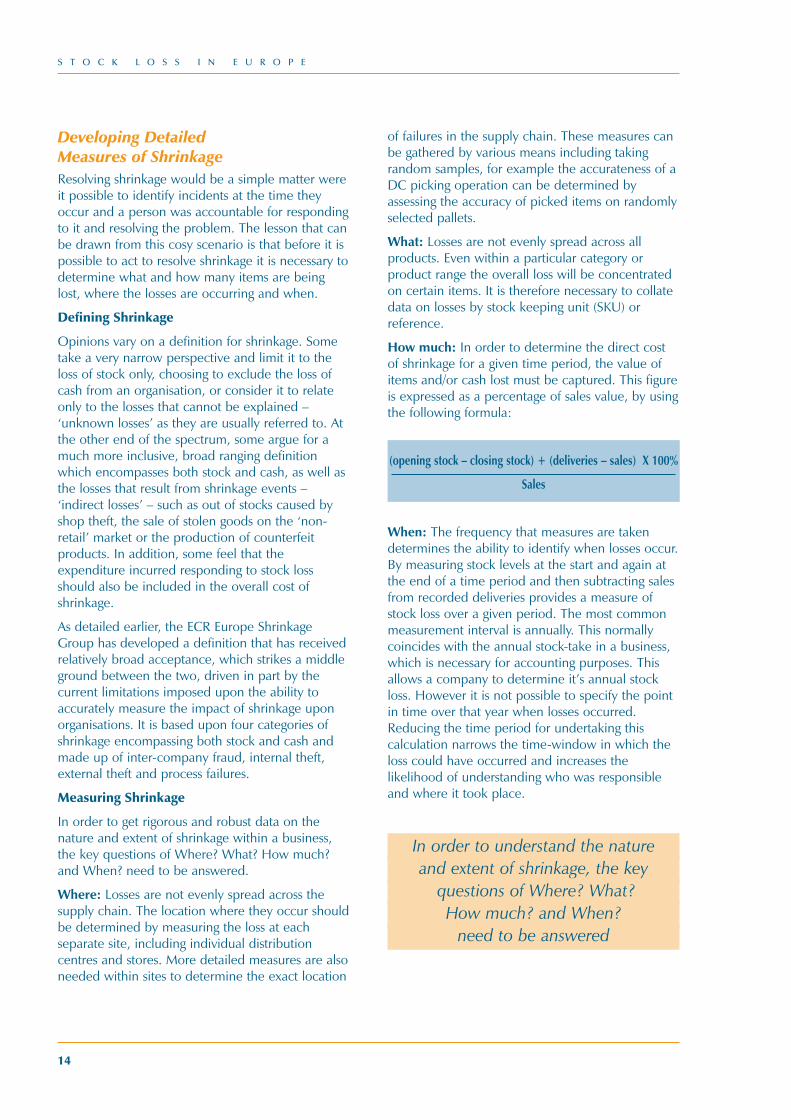
Developing Detailed Measures of ShrinkageResolving shrinkage would be a simple matter wereit possible to identify incidents at the time theyoccur and a person was accountable for respondingto it and resolving the problem. The lesson that canbe drawn from this cosy scenario is that before it ispossible to act to resolve shrinkage it is necessary todetermine what and how many items are beinglost, where the losses are occurring and when.
Defining Shrinkage
Opinions vary on a definition for shrinkage. Sometake a very narrow perspective and limit it to theloss of stock only, choosing to exclude the loss ofcash from an organisation, or consider it to relateonly to the losses that cannot be explained –‘unknown losses’ as they are usually referred to. Atthe other end of the spectrum, some argue for amuch more inclusive, broad ranging definitionwhich encompasses both stock and cash, as well asthe losses that result from shrinkage events –‘indirect losses’ – such as out of stocks caused byshop theft, the sale of stolen goods on the ‘non-retail’ market or the production of counterfeitproducts. In addition, some feel that theexpenditure incurred responding to stock lossshould also be included in the overall cost ofshrinkage.
As detailed earlier, the ECR Europe ShrinkageGroup has developed a definition that has receivedrelatively broad acceptance, which strikes a middleground between the two, driven in part by thecurrent limitations imposed upon the ability toaccurately measure the impact of shrinkage uponorganisations. It is based upon four categories ofshrinkage encompassing both stock and cash andmade up of inter-company fraud, internal theft,external theft and process failures.
Measuring Shrinkage
In order to get rigorous and robust data on thenature and extent of shrinkage within a business,the key questions of Where? What? How much?and When? need to be answered.
Where: Losses are not evenly spread across thesupply chain. The location where they occur shouldbe determined by measuring the loss at eachseparate site, including individual distributioncentres and stores. More detailed measures are alsoneeded within sites to determine the exact location
of failures in the supply chain. These measures canbe gathered by various means including takingrandom samples, for example the accurateness of aDC picking operation can be determined byassessing the accuracy of picked items on randomlyselected pallets.
What: Losses are not evenly spread across allproducts. Even within a particular category orproduct range the overall loss will be concentratedon certain items. It is therefore necessary to collatedata on losses by stock keeping unit (SKU) orreference.
How much: In order to determine the direct costof shrinkage for a given time period, the value ofitems and/or cash lost must be captured. This figureis expressed as a percentage of sales value, by usingthe following formula:
(opening stock – closing stock) + (deliveries – sales) X 100%
Sales
When: The frequency that measures are takendetermines the ability to identify when losses occur.By measuring stock levels at the start and again atthe end of a time period and then subtracting salesfrom recorded deliveries provides a measure ofstock loss over a given period. The most commonmeasurement interval is annually. This normallycoincides with the annual stock-take in a business,which is necessary for accounting purposes. Thisallows a company to determine it’s annual stockloss. However it is not possible to specify the pointin time over that year when losses occurred.Reducing the time period for undertaking thiscalculation narrows the time-window in which theloss could have occurred and increases thelikelihood of understanding who was responsibleand where it took place.
In order to understand the nature and extent of shrinkage, the key
questions of Where? What? How much? and When?
need to be answered
S T O C K L O S S I N E U R O P E
14
Shrinkage book 2003 Final**** 8/5/03 4:28 pm Page 14
CASE STUDY EXAMPLE 1
In the Sainsbury’s BWS Case Study, data wasgathered at the following intervals:
• Diageo’s DC counts inventory in a storagelocation the day after it had been moved.
• Allied Domecq’s DC ‘blind checks’ theinventory in a pick location every timeproduct is picked from it.
• Sainsbury’s stores count their spirits everymorning.
In each of these three operations, informationis gathered very frequently. Where losses arefound to occur it is therefore possible for theperson accountable for stock loss to investigateeach incident and act to resolve it.
Methods for Data Analysis
Having gathered the stock loss data it is necessary todetermine the causes of losses in order to take actionto reduce future problems. Not all causes of stockloss are easy to determine. Many occur intermittentlyand prove difficult to uncover. Thorough research ofthe causes of loss often requires the in-depth analysisof a large amount of data. This may need to becollated from a variety of sources and locations overan extended period of time.
The ECR research found that within the FMCGsector, most retailers keep records of inter-companyfraud and process failures, but few keptcomputerised records of internal and external theft,either at a company or store level. Manufacturerswere found to keep computerised records ofprocess failures, but few recorded any form of thefton a computerised system. The majority kept eitherno record whatsoever or only paper files. It is onlythrough the use of computerised databases thattrends can be identified and a more information-led strategic approach can be adopted to deal withall the elements that account for shrinkage.
It is clear that the methods used to store andcommunicate information need to be rigorous,robust and reliable. For example, in order todetermine which stores in a retail chain areresponsible for a disproportionate amount of loss itis necessary to collect loss metrics in a commonway, capture this information electronically andstore it centrally.
Implementing Best PracticeAt the heart of any corporate policy is the need fora business to make sufficient profit to ensure itssurvival. Europe’s €18 billion stock loss problempresents a substantial opportunity to achieve thismost basic of aims. Adopting available best practicehas the potential to make a significant contributionto releasing this opportunity for all the sectors’stakeholders including shoppers, retailers andmanufacturers.
Lessons learnt from the ECR case studies identifythe following practices as ones that helporganisations deliver improvements and that appearto have universal applicability in a range of differentcircumstances:
• Take a collaborative approach to reducingshrinkage.
• Focus effort on Hot Products; Hot Stores; andHot Spots in the supply chain.
• Capture and share best practice.
Take a Collaborative Approach to Reducing Shrinkage
At the core of the ECR movement is theadvancement of robust management methods inretailing. In loss prevention this means information-led decision making in collaboration with supplychain partners. Operationalising this approachrequires the systematic investigation of the rootcauses of shrinkage. Undertaking this along thesupply chain brings a holistic approach to theproblem. A prerequisite for success is to have acommitment to collaboration betweenmanufacturers, logistics service providers andretailers along the supply chain. Thereforecompanies should seek to drive the delivery ofthese benefits on two fronts:
• Throughout their organisation.
• Across the supply chain.
Collaboration within a company provides themeans to resolve problems beyond the scope ofindividual functions to solve.
Methods used to store andcommunicate information need to be rigorous, robust and reliable
S T O C K L O S S I N E U R O P E
15
Shrinkage book 2003 Final**** 8/5/03 4:28 pm Page 15
Collaboration is therefore necessary betweendepartments, such as operations, buying, logistics,marketing, IT, security and finance.
Likewise, collaboration between companiesresolves problems that are beyond the scope ofseparate companies to solve. Inter-companycollaboration within the ECR movementtraditionally involves vertical supply chain partnersworking together, i.e. customers and suppliers. Asthe ECR shrinkage case studies show collaborationshould extend to include logistics service providersas well. Collaboration can also be amongstcompeting organisations, for example where theywork within the remit of a trade body to resolvecommon issues.
The results of this work will be to:
• Design loss prevention solutions into the fabric ofprocesses and facilities.
• Ensure that these solutions effectively contributeto total supply chain efficiency, instead of solvinga problem at only one end of the chain.
• Implement simpler and cheaper controls tominimise loss.
Reducing stock loss presents asubstantial opportunity for performance improvement
throughout the supply chain
Focus Effort on Hot Products, Hot Stores andHot Spots in the Supply Chain
Manufacturing, distribution sites and retail outletscontain a wide range of product items. Rather thaninvestigating all the different items it is appropriatein the initial cycle of analysis to focus on ‘HotProducts’. Following the path of these few ‘risky’products through the supply chain can help toillustrate the general features of the process and theassociated problems. ‘Hot products’ is a conceptthat many retailers and manufacturers areintuitively familiar with, and generally refers tothose products most attractive to thieves. If retailersand manufacturers were to gain a better idea ofwhat makes a product ‘hot’, then this could, byreducing the levels of the theft element within stockloss, help dramatically to reduce levels of shrinkagewithin the whole supply chain.
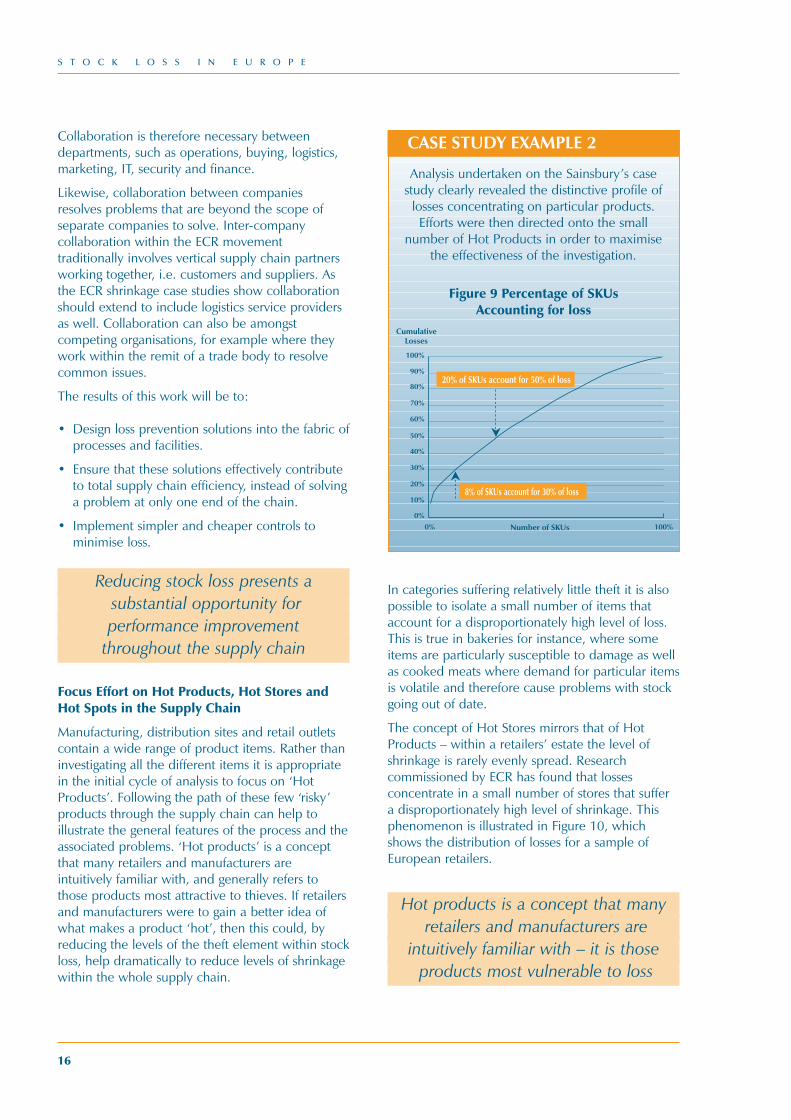
CASE STUDY EXAMPLE 2
Analysis undertaken on the Sainsbury’s casestudy clearly revealed the distinctive profile of
losses concentrating on particular products.Efforts were then directed onto the small
number of Hot Products in order to maximisethe effectiveness of the investigation.
In categories suffering relatively little theft it is alsopossible to isolate a small number of items thataccount for a disproportionately high level of loss.This is true in bakeries for instance, where someitems are particularly susceptible to damage as wellas cooked meats where demand for particular itemsis volatile and therefore cause problems with stockgoing out of date.
The concept of Hot Stores mirrors that of HotProducts – within a retailers’ estate the level ofshrinkage is rarely evenly spread. Researchcommissioned by ECR has found that lossesconcentrate in a small number of stores that suffera disproportionately high level of shrinkage. Thisphenomenon is illustrated in Figure 10, whichshows the distribution of losses for a sample ofEuropean retailers.
Hot products is a concept that manyretailers and manufacturers are
intuitively familiar with – it is thoseproducts most vulnerable to loss
S T O C K L O S S I N E U R O P E
16
0%
10%
20%
30%
40%
50%
60%
70%
80%
90%
100%
Number of SKUs0%
CumulativeLosses
8% of SKUs account for 30% of loss
100%
20% of SKUs account for 50% of loss
Figure 9 Percentage of SKUs Accounting for loss
Shrinkage book 2003 Final**** 8/5/03 4:28 pm Page 16
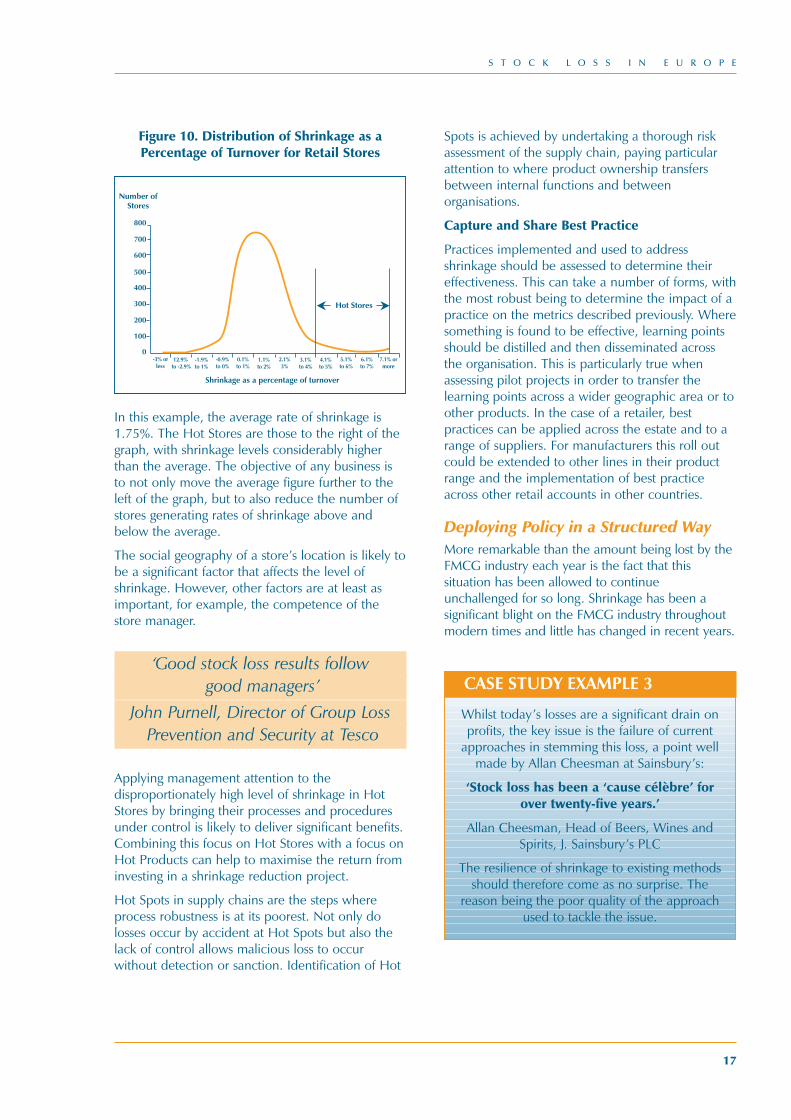
Figure 10. Distribution of Shrinkage as aPercentage of Turnover for Retail Stores
In this example, the average rate of shrinkage is1.75%. The Hot Stores are those to the right of thegraph, with shrinkage levels considerably higherthan the average. The objective of any business isto not only move the average figure further to theleft of the graph, but to also reduce the number ofstores generating rates of shrinkage above andbelow the average.
The social geography of a store’s location is likely tobe a significant factor that affects the level ofshrinkage. However, other factors are at least asimportant, for example, the competence of thestore manager.
‘Good stock loss results followgood managers’
John Purnell, Director of Group LossPrevention and Security at Tesco
Applying management attention to thedisproportionately high level of shrinkage in HotStores by bringing their processes and proceduresunder control is likely to deliver significant benefits.Combining this focus on Hot Stores with a focus onHot Products can help to maximise the return frominvesting in a shrinkage reduction project.
Hot Spots in supply chains are the steps whereprocess robustness is at its poorest. Not only dolosses occur by accident at Hot Spots but also thelack of control allows malicious loss to occurwithout detection or sanction. Identification of Hot
Spots is achieved by undertaking a thorough riskassessment of the supply chain, paying particularattention to where product ownership transfersbetween internal functions and betweenorganisations.
Capture and Share Best Practice
Practices implemented and used to addressshrinkage should be assessed to determine theireffectiveness. This can take a number of forms, withthe most robust being to determine the impact of apractice on the metrics described previously. Wheresomething is found to be effective, learning pointsshould be distilled and then disseminated acrossthe organisation. This is particularly true whenassessing pilot projects in order to transfer thelearning points across a wider geographic area or toother products. In the case of a retailer, bestpractices can be applied across the estate and to arange of suppliers. For manufacturers this roll outcould be extended to other lines in their productrange and the implementation of best practiceacross other retail accounts in other countries.
Deploying Policy in a Structured WayMore remarkable than the amount being lost by theFMCG industry each year is the fact that thissituation has been allowed to continueunchallenged for so long. Shrinkage has been asignificant blight on the FMCG industry throughoutmodern times and little has changed in recent years.
CASE STUDY EXAMPLE 3
Whilst today’s losses are a significant drain onprofits, the key issue is the failure of current
approaches in stemming this loss, a point wellmade by Allan Cheesman at Sainsbury’s:
‘Stock loss has been a ‘cause célèbre’ forover twenty-five years.’
Allan Cheesman, Head of Beers, Wines andSpirits, J. Sainsbury’s PLC
The resilience of shrinkage to existing methodsshould therefore come as no surprise. The
reason being the poor quality of the approachused to tackle the issue.
S T O C K L O S S I N E U R O P E
17
0
100
200
300
400
500
600
700
800
Shrinkage as a percentage of turnover
-3% or less
Number ofStores
-1.9%to 1%
12.9% to -2.9%
-0.9%to 0%
0.1%to 1%
1.1%to 2%
2.1%3%
3.1%to 4%
4.1%to 5%
5.1%to 6%
6.1%to 7%
7.1% ormore
Hot Stores
Shrinkage book 2003 Final**** 8/5/03 4:28 pm Page 17
The ECR Shrinkage Reduction Road Map providesa structured approach to collaborating with supplychain partners on loss reduction projects. Theprinciple advantage of the Road Map is the focus itprovides. This allows significant improvements to bedelivered, as demonstrated in the case studies thataccompany this Blue Book.
The Road Map is capable of delivering results incompressed timeframes (often as little as a fewweeks), even when deployed by teams of peoplewho are not improvement ‘experts’. Theseimpressive results are achieved by incorporating aseries of simple, effective tools within a structuredseries of steps that the team can put to workquickly and easily.
The ECR Road Map provides a structured approach to collaborating
with supply chain partners – it iscapable of delivering results in
compressed timeframes using a series of simple and effective tools
Recognise Need for OngoingImprovement
Key to successful integration of shrinkage reductioninto corporate policy is to ensure that: gainsidentified by the deployment of the Road Map aresustained; best practice is propagated; and furtherimprovement sought on an ongoing basis.
Making significant inroads into the opportunity todeliver better service to shoppers and streamlineoperations requires time and effort. Henceimprovement projects need to be undertaken onan ongoing basis. Such projects involve acombination of:
• ‘Holding the gains,’ i.e. maintaining benefits byensuring compliance to procedures and practicesdesigned to prevent loss.
• ‘More of the same’ i.e. disseminating bestpractices identified by project teams.
• ‘Innovate and adapt’ i.e. respond to new threatsand opportunities.
The learning gained through undertaking ongoingimprovement efforts provides an important input topolicy development, and highlights the need todevelop the corporate policy itself over time. Forexample the underlying causes of shrinkage aredynamic, which means that the metrics used totrack it may need to change over time in line withprevailing threats and opportunities.
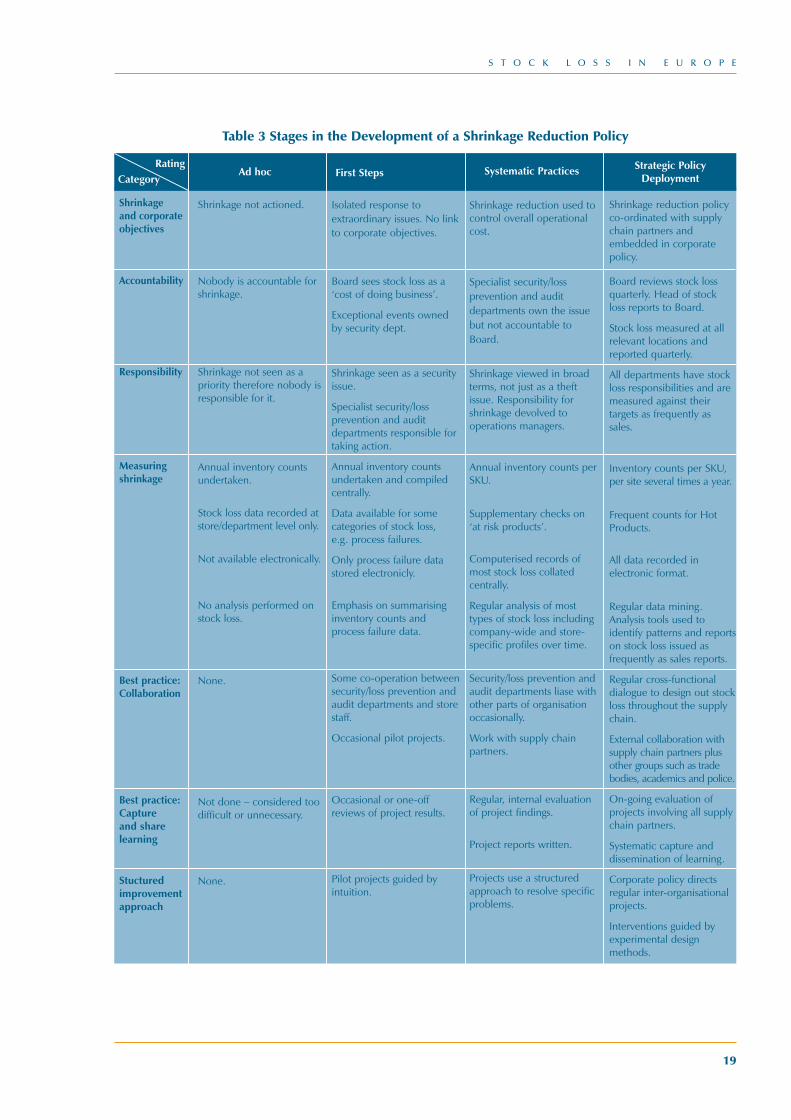
To help organisations review and develop theiroverall approach to stock loss reduction Table 3provides a benchmarking tool to gauge theadoption of practices. This ‘look in the mirror’ is animportant step in recognising how the overallshrinkage policy compares against best practice, aswell as identifying the gaps between what ispresently done and what needs to be achieved inthe future.
S T O C K L O S S I N E U R O P E
18
Shrinkage book 2003 Final**** 8/5/03 4:28 pm Page 18
S T O C K L O S S I N E U R O P E
19
Table 3 Stages in the Development of a Shrinkage Reduction Policy
RatingCategory
Shrinkage and corporateobjectives
Accountability
Responsibility
Measuringshrinkage
Best practice:Collaboration
Best practice:Capture and sharelearning
Stucturedimprovementapproach
Ad hoc
Shrinkage not actioned.
Nobody is accountable forshrinkage.
Shrinkage not seen as apriority therefore nobody isresponsible for it.
Annual inventory countsundertaken.
Stock loss data recorded atstore/department level only.
Not available electronically.
No analysis performed onstock loss.
None.
Not done – considered toodifficult or unnecessary.
None.
First Steps
Isolated response toextraordinary issues. No linkto corporate objectives.
Board sees stock loss as a‘cost of doing business’.
Exceptional events ownedby security dept.
Shrinkage seen as a securityissue.
Specialist security/lossprevention and auditdepartments responsible fortaking action.
Annual inventory countsundertaken and compiledcentrally.
Data available for somecategories of stock loss, e.g. process failures.
Only process failure datastored electronicly.
Emphasis on summarisinginventory counts andprocess failure data.
Some co-operation betweensecurity/loss prevention andaudit departments and storestaff.
Occasional pilot projects.
Occasional or one-offreviews of project results.
Pilot projects guided byintuition.
Systematic Practices
Shrinkage reduction used tocontrol overall operationalcost.
Specialist security/lossprevention and auditdepartments own the issuebut not accountable toBoard.
Shrinkage viewed in broadterms, not just as a theftissue. Responsibility forshrinkage devolved tooperations managers.
Annual inventory counts perSKU.
Supplementary checks on‘at risk products’.
Computerised records ofmost stock loss collatedcentrally.
Regular analysis of mosttypes of stock loss includingcompany-wide and store-specific profiles over time.
Security/loss prevention andaudit departments liase withother parts of organisationoccasionally.
Work with supply chainpartners.
Regular, internal evaluationof project findings.
Project reports written.
Projects use a structuredapproach to resolve specificproblems.
Strategic Policy Deployment
Shrinkage reduction policyco-ordinated with supplychain partners andembedded in corporatepolicy.
Board reviews stock lossquarterly. Head of stock loss reports to Board.
Stock loss measured at allrelevant locations andreported quarterly.
All departments have stockloss responsibilities and aremeasured against theirtargets as frequently assales.
Inventory counts per SKU,per site several times a year.
Frequent counts for HotProducts.
All data recorded inelectronic format.
Regular data mining.Analysis tools used toidentify patterns and reportson stock loss issued asfrequently as sales reports.
Regular cross-functionaldialogue to design out stockloss throughout the supplychain.
External collaboration withsupply chain partners plusother groups such as tradebodies, academics and police.
On-going evaluation ofprojects involving all supplychain partners.
Systematic capture anddissemination of learning.
Corporate policy directsregular inter-organisationalprojects.
Interventions guided byexperimental designmethods.
Shrinkage book 2003 Final**** 8/5/03 4:28 pm Page 19

S T O C K L O S S I N E U R O P E
20
Shrinkage book 2003 Final**** 8/5/03 4:28 pm Page 20

S T O C K L O S S I N E U R O P E
21
The ShrinkageReduction Road Map
Shrinkage book 2003 Final**** 8/5/03 4:28 pm Page 21

S T O C K L O S S I N E U R O P E
22
Shrinkage book 2003 Final**** 8/5/03 4:28 pm Page 22
S T O C K L O S S I N E U R O P E
23
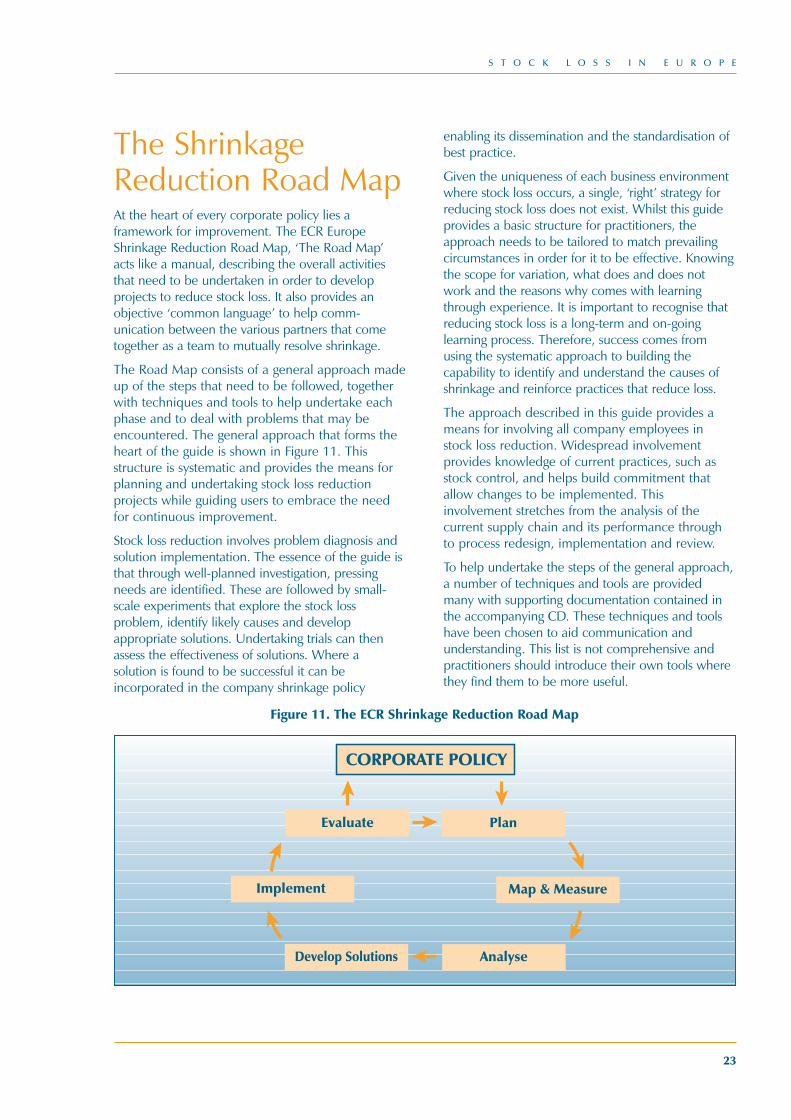
The ShrinkageReduction Road MapAt the heart of every corporate policy lies aframework for improvement. The ECR EuropeShrinkage Reduction Road Map, ‘The Road Map’acts like a manual, describing the overall activitiesthat need to be undertaken in order to developprojects to reduce stock loss. It also provides anobjective ‘common language’ to help comm-unication between the various partners that cometogether as a team to mutually resolve shrinkage.
The Road Map consists of a general approach madeup of the steps that need to be followed, togetherwith techniques and tools to help undertake eachphase and to deal with problems that may beencountered. The general approach that forms theheart of the guide is shown in Figure 11. Thisstructure is systematic and provides the means forplanning and undertaking stock loss reductionprojects while guiding users to embrace the needfor continuous improvement.
Stock loss reduction involves problem diagnosis andsolution implementation. The essence of the guide isthat through well-planned investigation, pressingneeds are identified. These are followed by small-scale experiments that explore the stock lossproblem, identify likely causes and developappropriate solutions. Undertaking trials can thenassess the effectiveness of solutions. Where asolution is found to be successful it can beincorporated in the company shrinkage policy
enabling its dissemination and the standardisation ofbest practice.
Given the uniqueness of each business environmentwhere stock loss occurs, a single, ‘right’ strategy forreducing stock loss does not exist. Whilst this guideprovides a basic structure for practitioners, theapproach needs to be tailored to match prevailingcircumstances in order for it to be effective. Knowingthe scope for variation, what does and does notwork and the reasons why comes with learningthrough experience. It is important to recognise thatreducing stock loss is a long-term and on-goinglearning process. Therefore, success comes fromusing the systematic approach to building thecapability to identify and understand the causes ofshrinkage and reinforce practices that reduce loss.
The approach described in this guide provides ameans for involving all company employees instock loss reduction. Widespread involvementprovides knowledge of current practices, such asstock control, and helps build commitment thatallow changes to be implemented. Thisinvolvement stretches from the analysis of thecurrent supply chain and its performance throughto process redesign, implementation and review.
To help undertake the steps of the general approach,a number of techniques and tools are providedmany with supporting documentation contained inthe accompanying CD. These techniques and toolshave been chosen to aid communication andunderstanding. This list is not comprehensive andpractitioners should introduce their own tools wherethey find them to be more useful.
Develop Solutions Analyse
PlanEvaluate
Implement Map & Measure
CORPORATE POLICY
Figure 11. The ECR Shrinkage Reduction Road Map
Shrinkage book 2003 Final**** 8/5/03 4:28 pm Page 23
S T O C K L O S S I N E U R O P E
24
Step 1: Develop a Project Plan
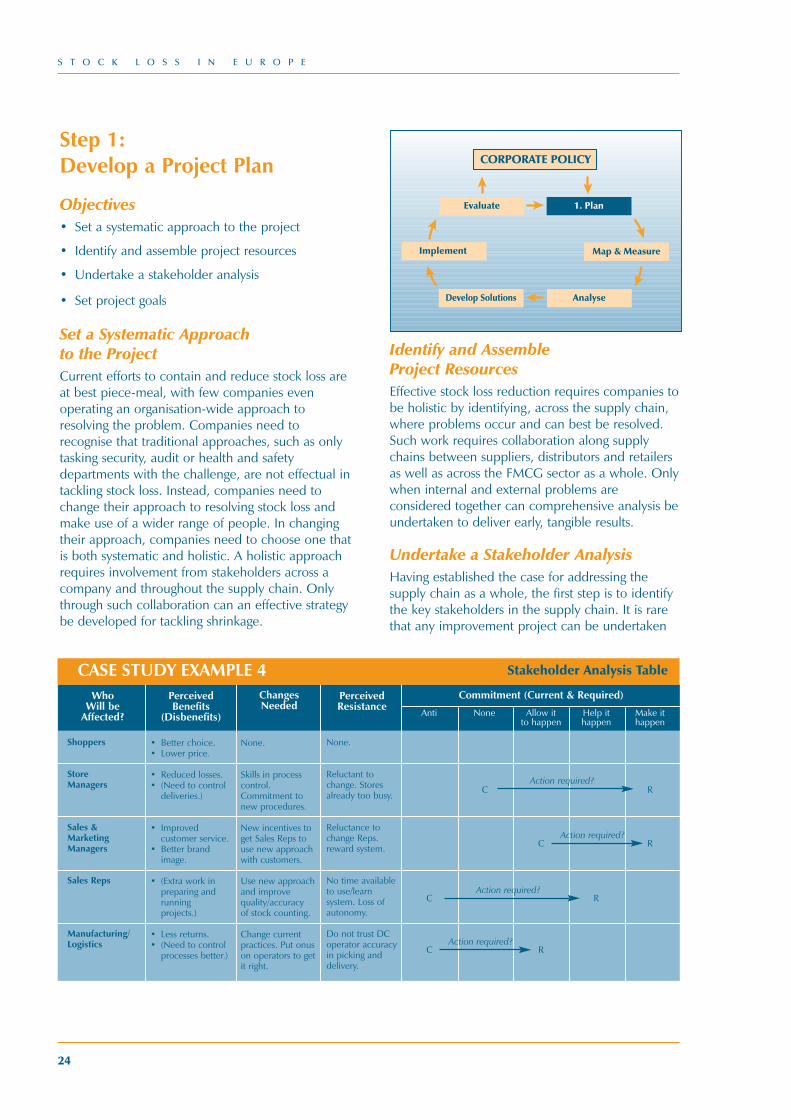
Objectives• Set a systematic approach to the project
• Identify and assemble project resources
• Undertake a stakeholder analysis
• Set project goals
Set a Systematic Approach to the ProjectCurrent efforts to contain and reduce stock loss areat best piece-meal, with few companies evenoperating an organisation-wide approach toresolving the problem. Companies need torecognise that traditional approaches, such as onlytasking security, audit or health and safetydepartments with the challenge, are not effectual intackling stock loss. Instead, companies need tochange their approach to resolving stock loss andmake use of a wider range of people. In changingtheir approach, companies need to choose one thatis both systematic and holistic. A holistic approachrequires involvement from stakeholders across acompany and throughout the supply chain. Onlythrough such collaboration can an effective strategybe developed for tackling shrinkage.
Identify and Assemble Project ResourcesEffective stock loss reduction requires companies tobe holistic by identifying, across the supply chain,where problems occur and can best be resolved.Such work requires collaboration along supplychains between suppliers, distributors and retailersas well as across the FMCG sector as a whole. Onlywhen internal and external problems areconsidered together can comprehensive analysis beundertaken to deliver early, tangible results.
Undertake a Stakeholder AnalysisHaving established the case for addressing thesupply chain as a whole, the first step is to identifythe key stakeholders in the supply chain. It is rarethat any improvement project can be undertaken
CORPORATE POLICY
Develop Solutions Analyse
1. PlanEvaluate
Implement Map & Measure
WhoWill be
Affected?
Perceived Benefits
(Disbenefits)
ChangesNeeded
PerceivedResistance
Commitment (Current & Required)
Shoppers
StoreManagers
Sales &MarketingManagers
Sales Reps
Manufacturing/Logistics
• Better choice.• Lower price.
• Reduced losses.• (Need to control
deliveries.)
• Improved customer service.
• Better brandimage.
• (Extra work inpreparing andrunning projects.)
• Less returns.• (Need to control
processes better.)
None.
Skills in process control.Commitment to new procedures.
New incentives toget Sales Reps to use new approachwith customers.
Use new approachand improve quality/accuracy of stock counting.
Change current practices. Put onuson operators to getit right.
None.
Reluctant to change. Stores already too busy.
Reluctance to change Reps. reward system.
No time available to use/learn system. Loss of autonomy.
Do not trust DC operator accuracy in picking and delivery.
Anti None Allow it Help it Make itto happen happen happen
C R
C R
C R
C R
Action required?
Action required?
Action required?
Action required?
CASE STUDY EXAMPLE 4 Stakeholder Analysis Table
Shrinkage book 2003 Final**** 8/5/03 4:28 pm Page 24
Sponsers:
Steering Group:
Project Managers:
Team Managers
Support:
Retailer Supplier
Board Level Director
Senior Manager
Project Manager
Buyer; Store Operations;Store Manager;
Supply Chain Manager
Board Level Director
Senior Manager
Project Manager
Account Manager;Supply Chain Manager
Internal Audit;IT; Finance
Internal Audit;IT; Finance
CASE STUDY EXAMPLE 5
S T O C K L O S S I N E U R O P E
25
without an appreciation of social and culturalorganisational dynamics. This is particularly truewhen seeking to reduce shrinkage as many of theconcerns associated with it are ‘people’ issues.
A stakeholder analysis identifies thepeople in an organisation and across
the supply chain who will be affected by efforts to reduce shrinkage
Case Study Example 4 maps the effects that a lossreduction project will have on the stakeholdersacross a supply chain. The perception of thebenefits and problems of these efforts are capturedalong with the various perceptions of the changesthat will occur and the likely resistance to them.Finally, a judgement of current levels ofcommitment as well as those required to deliverthe project is made. Efforts to resolve gaps betweencurrent and required levels of commitment mustthen be incorporated into the plan by the projectteam.
The results of the stakeholder analysis provide avaluable insight into which stakeholder groups needto be represented on the project team and wherelines of communication need to be established.
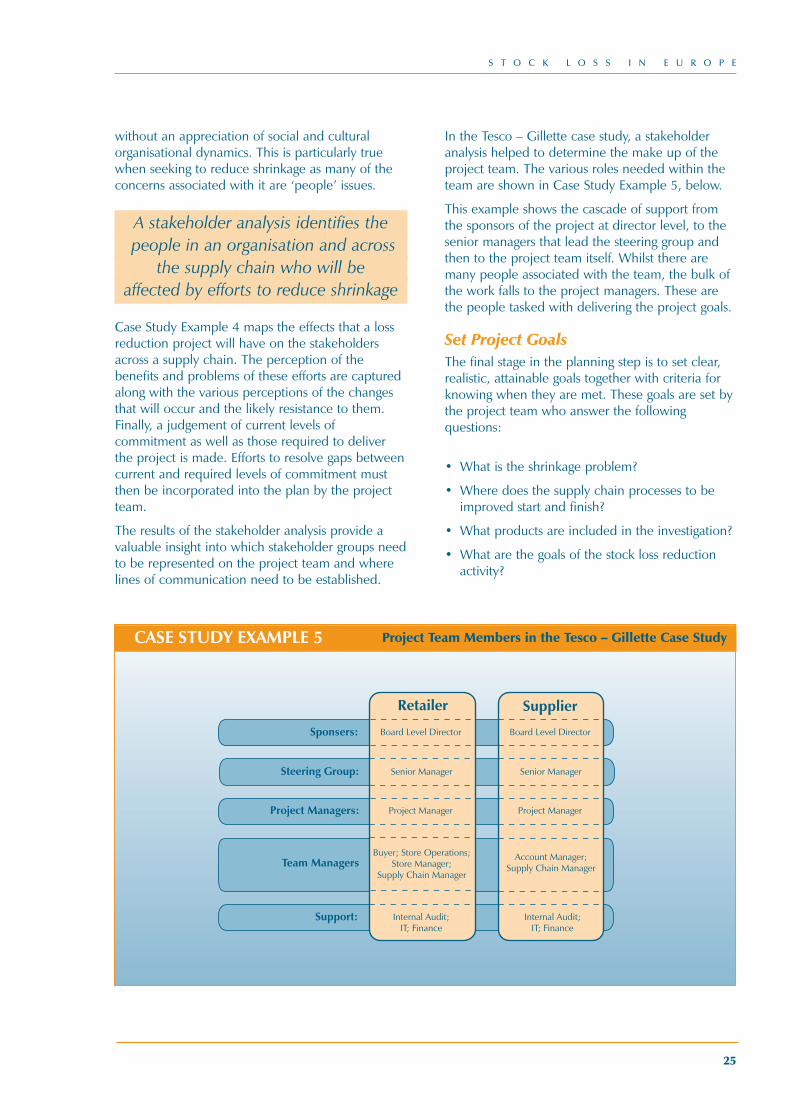
In the Tesco – Gillette case study, a stakeholderanalysis helped to determine the make up of theproject team. The various roles needed within theteam are shown in Case Study Example 5, below.
This example shows the cascade of support fromthe sponsors of the project at director level, to thesenior managers that lead the steering group andthen to the project team itself. Whilst there aremany people associated with the team, the bulk ofthe work falls to the project managers. These arethe people tasked with delivering the project goals.
Set Project GoalsThe final stage in the planning step is to set clear,realistic, attainable goals together with criteria forknowing when they are met. These goals are set bythe project team who answer the followingquestions:
• What is the shrinkage problem?
• Where does the supply chain processes to beimproved start and finish?
• What products are included in the investigation?
• What are the goals of the stock loss reductionactivity?
Project Team Members in the Tesco – Gillette Case Study
Shrinkage book 2003 Final**** 8/5/03 4:28 pm Page 25

• When is the date by which some benefits mustbe felt?
• What are the constraints to improvement?
The answers to these questions guide the projectteam’s activities towards achieving their goals.Starting the project in this way is especiallyimportant in cross-functional projects where theeffectiveness and efficiency with which projectresources are used dramatically improves with up-front investment in planning.
Planning for a project involves setting clear, realistic and
attainable goals
S T O C K L O S S I N E U R O P E
26
Shrinkage book 2003 Final**** 8/5/03 4:28 pm Page 26
S T O C K L O S S I N E U R O P E
27
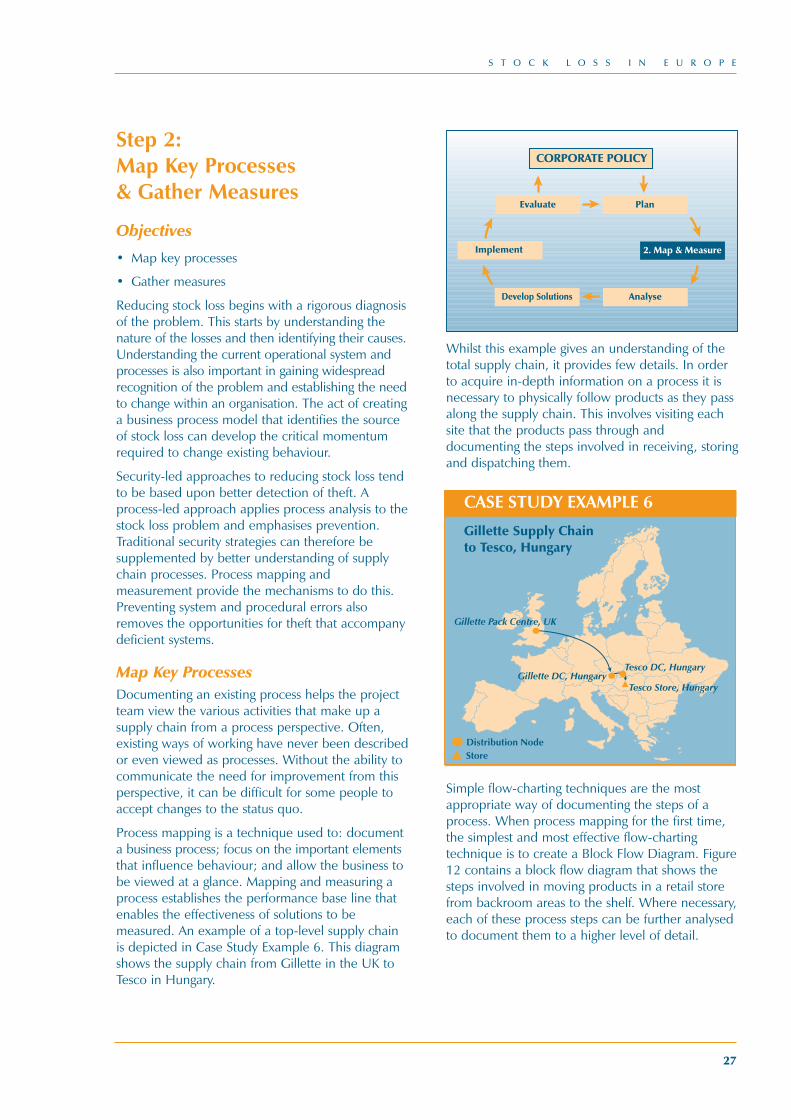
Step 2: Map Key Processes & Gather Measures
Objectives
• Map key processes
• Gather measures
Reducing stock loss begins with a rigorous diagnosisof the problem. This starts by understanding thenature of the losses and then identifying their causes.Understanding the current operational system andprocesses is also important in gaining widespreadrecognition of the problem and establishing the needto change within an organisation. The act of creatinga business process model that identifies the sourceof stock loss can develop the critical momentumrequired to change existing behaviour.
Security-led approaches to reducing stock loss tendto be based upon better detection of theft. Aprocess-led approach applies process analysis to thestock loss problem and emphasises prevention.Traditional security strategies can therefore besupplemented by better understanding of supplychain processes. Process mapping andmeasurement provide the mechanisms to do this.Preventing system and procedural errors alsoremoves the opportunities for theft that accompanydeficient systems.
Map Key ProcessesDocumenting an existing process helps the projectteam view the various activities that make up asupply chain from a process perspective. Often,existing ways of working have never been describedor even viewed as processes. Without the ability tocommunicate the need for improvement from thisperspective, it can be difficult for some people toaccept changes to the status quo.
Process mapping is a technique used to: documenta business process; focus on the important elementsthat influence behaviour; and allow the business tobe viewed at a glance. Mapping and measuring aprocess establishes the performance base line thatenables the effectiveness of solutions to bemeasured. An example of a top-level supply chainis depicted in Case Study Example 6. This diagramshows the supply chain from Gillette in the UK toTesco in Hungary.
Whilst this example gives an understanding of thetotal supply chain, it provides few details. In orderto acquire in-depth information on a process it isnecessary to physically follow products as they passalong the supply chain. This involves visiting eachsite that the products pass through anddocumenting the steps involved in receiving, storingand dispatching them.
Simple flow-charting techniques are the mostappropriate way of documenting the steps of aprocess. When process mapping for the first time,the simplest and most effective flow-chartingtechnique is to create a Block Flow Diagram. Figure12 contains a block flow diagram that shows thesteps involved in moving products in a retail storefrom backroom areas to the shelf. Where necessary,each of these process steps can be further analysedto document them to a higher level of detail.
Distribution NodeStore
Gillette Pack Centre, UK
Gillette DC, HungaryTesco DC, Hungary
Tesco Store, Hungary
CORPORATE POLICY
Develop Solutions Analyse
PlanEvaluate
Implement 2. Map & Measure
Gillette Supply Chain to Tesco, Hungary
CASE STUDY EXAMPLE 6
Shrinkage book 2003 Final**** 8/5/03 4:28 pm Page 27
S T O C K L O S S I N E U R O P E
28
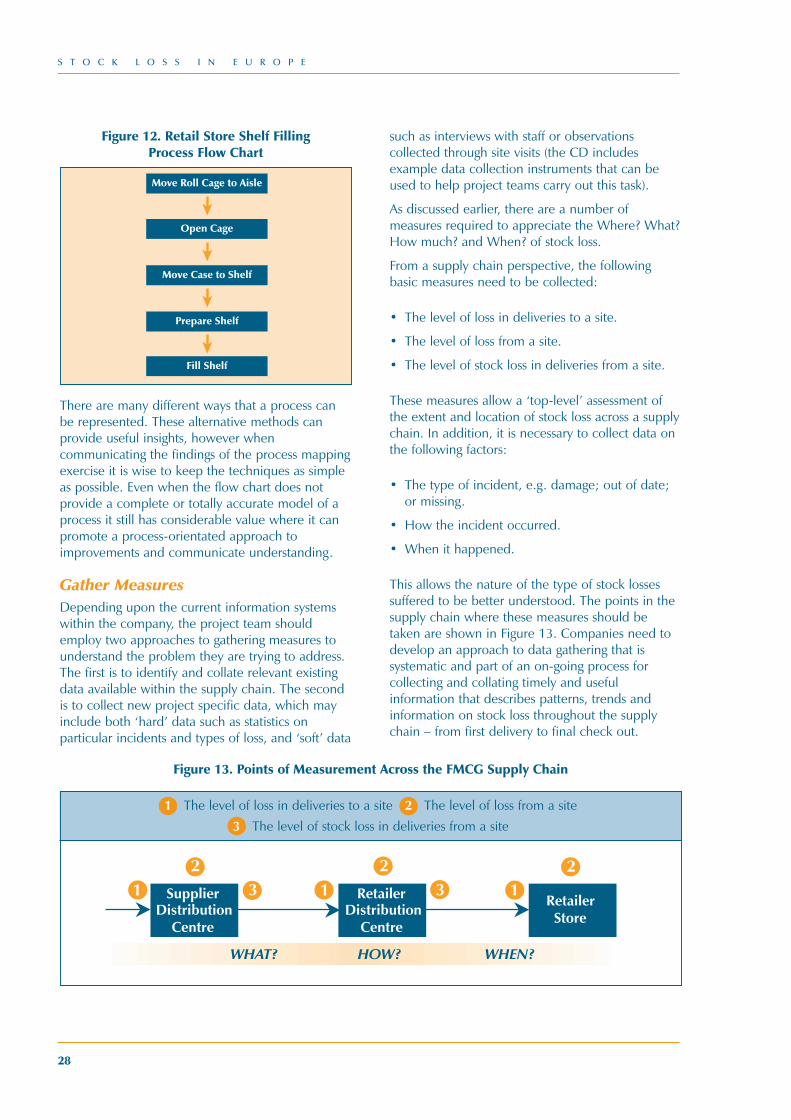
Figure 12. Retail Store Shelf Filling Process Flow Chart
There are many different ways that a process canbe represented. These alternative methods canprovide useful insights, however whencommunicating the findings of the process mappingexercise it is wise to keep the techniques as simpleas possible. Even when the flow chart does notprovide a complete or totally accurate model of aprocess it still has considerable value where it canpromote a process-orientated approach toimprovements and communicate understanding.
Gather Measures Depending upon the current information systemswithin the company, the project team shouldemploy two approaches to gathering measures tounderstand the problem they are trying to address.The first is to identify and collate relevant existingdata available within the supply chain. The secondis to collect new project specific data, which mayinclude both ‘hard’ data such as statistics onparticular incidents and types of loss, and ‘soft’ data
such as interviews with staff or observationscollected through site visits (the CD includesexample data collection instruments that can beused to help project teams carry out this task).
As discussed earlier, there are a number ofmeasures required to appreciate the Where? What?How much? and When? of stock loss.
From a supply chain perspective, the followingbasic measures need to be collected:
• The level of loss in deliveries to a site.
• The level of loss from a site.
• The level of stock loss in deliveries from a site.
These measures allow a ‘top-level’ assessment ofthe extent and location of stock loss across a supplychain. In addition, it is necessary to collect data onthe following factors:
• The type of incident, e.g. damage; out of date;or missing.
• How the incident occurred.
• When it happened.
This allows the nature of the type of stock lossessuffered to be better understood. The points in thesupply chain where these measures should betaken are shown in Figure 13. Companies need todevelop an approach to data gathering that issystematic and part of an on-going process forcollecting and collating timely and usefulinformation that describes patterns, trends andinformation on stock loss throughout the supplychain – from first delivery to final check out.
Move Roll Cage to Aisle
Open Cage
Move Case to Shelf
Prepare Shelf
Fill Shelf
Figure 13. Points of Measurement Across the FMCG Supply Chain
RetailerStore
RetailerDistribution
Centre
SupplierDistribution
Centre
12
3 12
3 12
WHAT? HOW? WHEN?
1 The level of loss in deliveries to a site 2 The level of loss from a site
3 The level of stock loss in deliveries from a site
Shrinkage book 2003 Final**** 8/5/03 4:28 pm Page 28
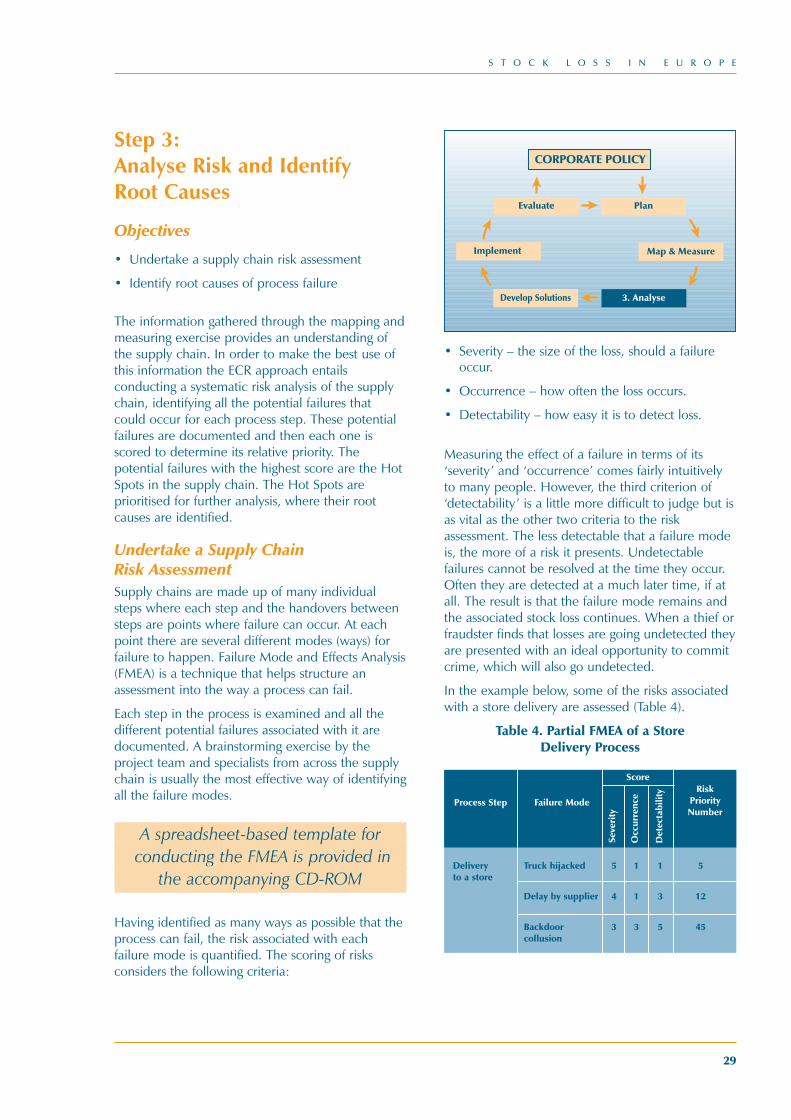
Step 3: Analyse Risk and Identify Root Causes
Objectives
• Undertake a supply chain risk assessment
• Identify root causes of process failure
The information gathered through the mapping andmeasuring exercise provides an understanding ofthe supply chain. In order to make the best use ofthis information the ECR approach entailsconducting a systematic risk analysis of the supplychain, identifying all the potential failures thatcould occur for each process step. These potentialfailures are documented and then each one isscored to determine its relative priority. Thepotential failures with the highest score are the HotSpots in the supply chain. The Hot Spots areprioritised for further analysis, where their rootcauses are identified.
Undertake a Supply Chain Risk AssessmentSupply chains are made up of many individualsteps where each step and the handovers betweensteps are points where failure can occur. At eachpoint there are several different modes (ways) forfailure to happen. Failure Mode and Effects Analysis(FMEA) is a technique that helps structure anassessment into the way a process can fail.
Each step in the process is examined and all thedifferent potential failures associated with it aredocumented. A brainstorming exercise by theproject team and specialists from across the supplychain is usually the most effective way of identifyingall the failure modes.
A spreadsheet-based template forconducting the FMEA is provided in
the accompanying CD-ROM
Having identified as many ways as possible that theprocess can fail, the risk associated with eachfailure mode is quantified. The scoring of risksconsiders the following criteria:
• Severity – the size of the loss, should a failureoccur.
• Occurrence – how often the loss occurs.
• Detectability – how easy it is to detect loss.
Measuring the effect of a failure in terms of its‘severity’ and ‘occurrence’ comes fairly intuitivelyto many people. However, the third criterion of‘detectability’ is a little more difficult to judge but isas vital as the other two criteria to the riskassessment. The less detectable that a failure modeis, the more of a risk it presents. Undetectablefailures cannot be resolved at the time they occur.Often they are detected at a much later time, if atall. The result is that the failure mode remains andthe associated stock loss continues. When a thief orfraudster finds that losses are going undetected theyare presented with an ideal opportunity to commitcrime, which will also go undetected.
In the example below, some of the risks associatedwith a store delivery are assessed (Table 4).
Table 4. Partial FMEA of a Store Delivery Process
S T O C K L O S S I N E U R O P E
29
CORPORATE POLICY
Develop Solutions 3. Analyse
PlanEvaluate
Implement Map & Measure
Delivery Truck hijacked 5 1 1 5 to a store
Delay by supplier 4 1 3 12
Backdoor 3 3 5 45 collusion
Score
Process Step Failure Mode
Seve
rity
Occ
urre
nce
Det
ecta
bilit
y Risk PriorityNumber
Shrinkage book 2003 Final**** 8/5/03 4:28 pm Page 29
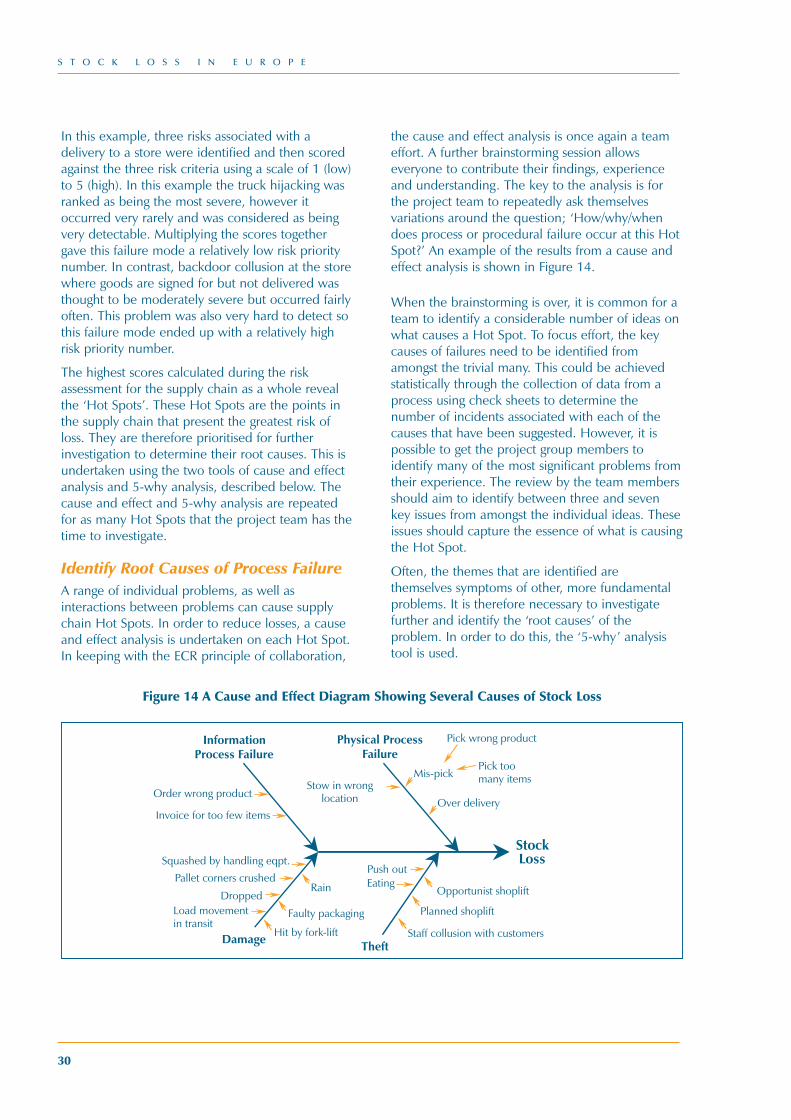
S T O C K L O S S I N E U R O P E
30
In this example, three risks associated with adelivery to a store were identified and then scoredagainst the three risk criteria using a scale of 1 (low)to 5 (high). In this example the truck hijacking wasranked as being the most severe, however itoccurred very rarely and was considered as beingvery detectable. Multiplying the scores togethergave this failure mode a relatively low risk prioritynumber. In contrast, backdoor collusion at the storewhere goods are signed for but not delivered wasthought to be moderately severe but occurred fairlyoften. This problem was also very hard to detect sothis failure mode ended up with a relatively highrisk priority number.
The highest scores calculated during the riskassessment for the supply chain as a whole revealthe ‘Hot Spots’. These Hot Spots are the points inthe supply chain that present the greatest risk ofloss. They are therefore prioritised for furtherinvestigation to determine their root causes. This isundertaken using the two tools of cause and effectanalysis and 5-why analysis, described below. Thecause and effect and 5-why analysis are repeatedfor as many Hot Spots that the project team has thetime to investigate.
Identify Root Causes of Process FailureA range of individual problems, as well asinteractions between problems can cause supplychain Hot Spots. In order to reduce losses, a causeand effect analysis is undertaken on each Hot Spot.In keeping with the ECR principle of collaboration,
the cause and effect analysis is once again a teameffort. A further brainstorming session allowseveryone to contribute their findings, experienceand understanding. The key to the analysis is forthe project team to repeatedly ask themselvesvariations around the question; ‘How/why/whendoes process or procedural failure occur at this HotSpot?’ An example of the results from a cause andeffect analysis is shown in Figure 14.
When the brainstorming is over, it is common for ateam to identify a considerable number of ideas onwhat causes a Hot Spot. To focus effort, the keycauses of failures need to be identified fromamongst the trivial many. This could be achievedstatistically through the collection of data from aprocess using check sheets to determine thenumber of incidents associated with each of thecauses that have been suggested. However, it ispossible to get the project group members toidentify many of the most significant problems fromtheir experience. The review by the team membersshould aim to identify between three and sevenkey issues from amongst the individual ideas. Theseissues should capture the essence of what is causingthe Hot Spot.
Often, the themes that are identified arethemselves symptoms of other, more fundamentalproblems. It is therefore necessary to investigatefurther and identify the ‘root causes’ of theproblem. In order to do this, the ‘5-why’ analysistool is used.
StockLoss
InformationProcess Failure
Damage Theft
Order wrong product
Rain
Invoice for too few items
Squashed by handling eqpt.
Load movement in transit
Dropped
Pallet corners crushed
Faulty packaging
EatingPush out
Opportunist shoplift
Planned shoplift
Staff collusion with customers
Over delivery
Mis-pick
Pick wrong product
Pick too many itemsStow in wrong
location
Physical ProcessFailure
Hit by fork-lift
Figure 14 A Cause and Effect Diagram Showing Several Causes of Stock Loss
Shrinkage book 2003 Final**** 8/5/03 4:28 pm Page 30
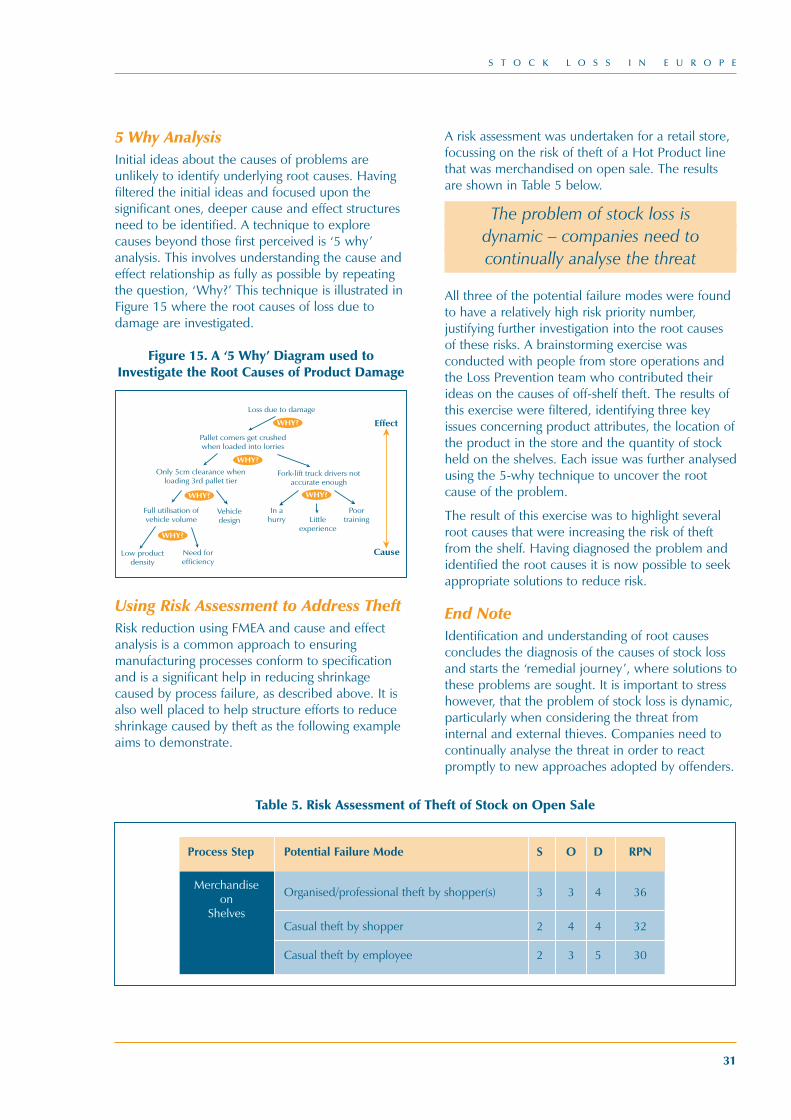
S T O C K L O S S I N E U R O P E
31
5 Why AnalysisInitial ideas about the causes of problems areunlikely to identify underlying root causes. Havingfiltered the initial ideas and focused upon thesignificant ones, deeper cause and effect structuresneed to be identified. A technique to explorecauses beyond those first perceived is ‘5 why’analysis. This involves understanding the cause andeffect relationship as fully as possible by repeatingthe question, ‘Why?’ This technique is illustrated inFigure 15 where the root causes of loss due todamage are investigated.
Figure 15. A ‘5 Why’ Diagram used toInvestigate the Root Causes of Product Damage
Using Risk Assessment to Address TheftRisk reduction using FMEA and cause and effectanalysis is a common approach to ensuringmanufacturing processes conform to specificationand is a significant help in reducing shrinkagecaused by process failure, as described above. It isalso well placed to help structure efforts to reduceshrinkage caused by theft as the following exampleaims to demonstrate.
A risk assessment was undertaken for a retail store,focussing on the risk of theft of a Hot Product linethat was merchandised on open sale. The resultsare shown in Table 5 below.
The problem of stock loss is dynamic – companies need to continually analyse the threat
All three of the potential failure modes were foundto have a relatively high risk priority number,justifying further investigation into the root causesof these risks. A brainstorming exercise wasconducted with people from store operations andthe Loss Prevention team who contributed theirideas on the causes of off-shelf theft. The results ofthis exercise were filtered, identifying three keyissues concerning product attributes, the location ofthe product in the store and the quantity of stockheld on the shelves. Each issue was further analysedusing the 5-why technique to uncover the rootcause of the problem.
The result of this exercise was to highlight severalroot causes that were increasing the risk of theftfrom the shelf. Having diagnosed the problem andidentified the root causes it is now possible to seekappropriate solutions to reduce risk.
End NoteIdentification and understanding of root causesconcludes the diagnosis of the causes of stock lossand starts the ‘remedial journey’, where solutions tothese problems are sought. It is important to stresshowever, that the problem of stock loss is dynamic,particularly when considering the threat frominternal and external thieves. Companies need tocontinually analyse the threat in order to reactpromptly to new approaches adopted by offenders.
Effect
Cause
WHY?
Loss due to damage
Pallet corners get crushed when loaded into lorries
Only 5cm clearance when loading 3rd pallet tier
Fork-lift truck drivers not accurate enough
Full utilisation of vehicle volume
Vehicledesign
Low product density
Need forefficiency
In a hurry Little
experience
Poortraining
WHY?
WHY?
WHY?
WHY?
Process Step Potential Failure Mode S O D RPN
Organised/professional theft by shopper(s) 3 3 4 36
Casual theft by shopper 2 4 4 32
Casual theft by employee 2 3 5 30
Merchandiseon
Shelves
Table 5. Risk Assessment of Theft of Stock on Open Sale
Shrinkage book 2003 Final**** 8/5/03 4:28 pm Page 31
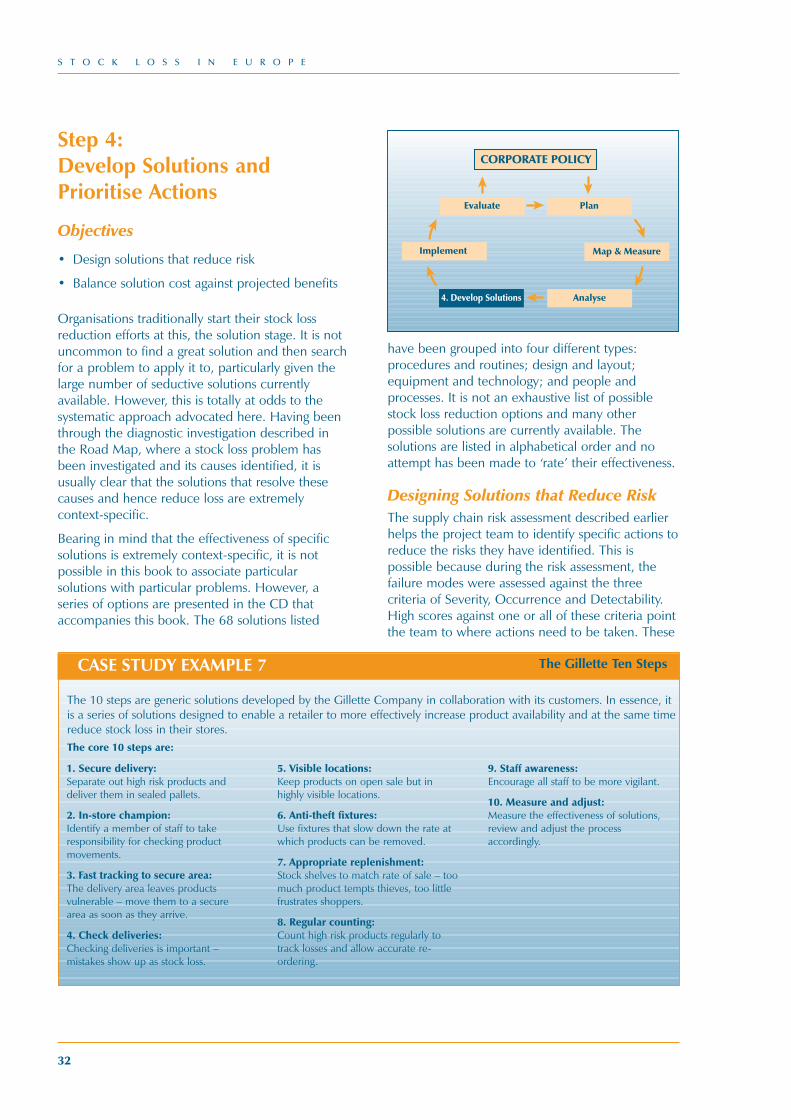
CASE STUDY EXAMPLE 7
Step 4: Develop Solutions andPrioritise Actions
Objectives
• Design solutions that reduce risk
• Balance solution cost against projected benefits
Organisations traditionally start their stock lossreduction efforts at this, the solution stage. It is notuncommon to find a great solution and then searchfor a problem to apply it to, particularly given thelarge number of seductive solutions currentlyavailable. However, this is totally at odds to thesystematic approach advocated here. Having beenthrough the diagnostic investigation described inthe Road Map, where a stock loss problem hasbeen investigated and its causes identified, it isusually clear that the solutions that resolve thesecauses and hence reduce loss are extremelycontext-specific.
Bearing in mind that the effectiveness of specificsolutions is extremely context-specific, it is notpossible in this book to associate particularsolutions with particular problems. However, aseries of options are presented in the CD thataccompanies this book. The 68 solutions listed
have been grouped into four different types:procedures and routines; design and layout;equipment and technology; and people andprocesses. It is not an exhaustive list of possiblestock loss reduction options and many otherpossible solutions are currently available. Thesolutions are listed in alphabetical order and noattempt has been made to ‘rate’ their effectiveness.
Designing Solutions that Reduce RiskThe supply chain risk assessment described earlierhelps the project team to identify specific actions toreduce the risks they have identified. This ispossible because during the risk assessment, thefailure modes were assessed against the threecriteria of Severity, Occurrence and Detectability.High scores against one or all of these criteria pointthe team to where actions need to be taken. These
S T O C K L O S S I N E U R O P E
32
CORPORATE POLICY
4. Develop Solutions Analyse
PlanEvaluate
Implement Map & Measure
1. Secure delivery: Separate out high risk products anddeliver them in sealed pallets.
2. In-store champion: Identify a member of staff to takeresponsibility for checking productmovements.
3. Fast tracking to secure area:The delivery area leaves productsvulnerable – move them to a securearea as soon as they arrive.
4. Check deliveries:Checking deliveries is important –mistakes show up as stock loss.
5. Visible locations:Keep products on open sale but inhighly visible locations.
6. Anti-theft fixtures:Use fixtures that slow down the rate atwhich products can be removed.
7. Appropriate replenishment:Stock shelves to match rate of sale – toomuch product tempts thieves, too littlefrustrates shoppers.
8. Regular counting:Count high risk products regularly totrack losses and allow accurate re-ordering.
9. Staff awareness:Encourage all staff to be more vigilant.
10. Measure and adjust:Measure the effectiveness of solutions,review and adjust the processaccordingly.
The 10 steps are generic solutions developed by the Gillette Company in collaboration with its customers. In essence, itis a series of solutions designed to enable a retailer to more effectively increase product availability and at the same timereduce stock loss in their stores.The core 10 steps are:
The Gillette Ten Steps
Shrinkage book 2003 Final**** 8/5/03 4:28 pm Page 32
S T O C K L O S S I N E U R O P E
33
actions are usually context specific, for example, inthe Gillette/Tesco case study, there was a supplychain Hot Spot where product could be lost whenstored in the back of a store. Risks relating todetectability and severity of this failure mode wereboth assessed as being high. This pointed theproject team to take action to improve thedetectability of loss by introducing a daily stockcount. The action taken to reduce the severity ofloss was to minimise the amount of stock held inthe back of the store and increase detectabilitythrough regular checks (See Case Study Example 7).
Balancing Solution Cost AgainstProjected BenefitsGood solutions strike a balance between thebenefits they deliver in reducing loss and the costof achieving these benefits. In order to estimate thisbalance it is necessary to quantify the costs, both interms of capital costs (such as buying equipmentand training staff) and recurrent costs (such asmaintenance or extra staff time).
The project team then need to calculate thebenefits brought about through the introduction ofthe solution. For most projects this will bemeasured by the amount shrinkage is reduced andpossibly increased sales. These benefits are likely tobe recurring but may diminish over time dependingupon the nature of the intervention. The projectteam needs to estimate what the likelihood is thatthe expected benefits will be sustained and overwhat time period.
COST BENEFIT EXAMPLE
Having investigated a supply chain, a project teamidentified a particular solution that removes one ofthe root causes of shrinkage for a Hot Spot. Thissolution has the potential to reduce shrinkageeach year by €40,000. It is thought that 75% ofthis potential reduction can be realisticallyachieved in the first year. The team expects theeffectiveness of the solution to decrease by 10% insubsequent years. The initial cost to implementthe solution will be €20,000 and it costs €15,000each year to keep operating the solution.
Year 1: Expected Benefit – Cost of Implementation = Net Contribution
(€40,000 x 0.75) – €35,000 = -€5,000
Year 2: Expected Benefit – Running Costs = Net Contribution
(€40,000 x 0.75) x 0.9 – €15,000 = €12,000
The overall net benefit is that the solution has bothpaid for its implementation and saved thecompany €7,000 within the first two years.
Shrinkage book 2003 Final**** 8/5/03 4:28 pm Page 33
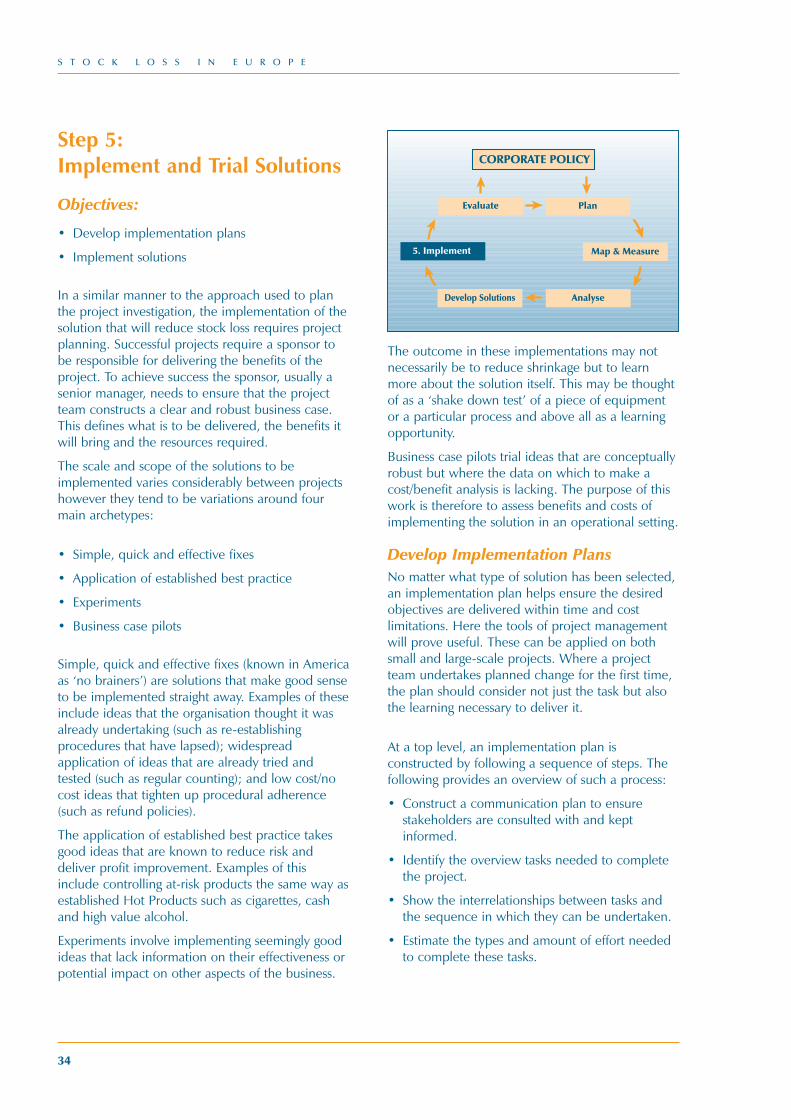
Step 5: Implement and Trial Solutions
Objectives:
• Develop implementation plans
• Implement solutions
In a similar manner to the approach used to planthe project investigation, the implementation of thesolution that will reduce stock loss requires projectplanning. Successful projects require a sponsor tobe responsible for delivering the benefits of theproject. To achieve success the sponsor, usually asenior manager, needs to ensure that the projectteam constructs a clear and robust business case.This defines what is to be delivered, the benefits itwill bring and the resources required.
The scale and scope of the solutions to beimplemented varies considerably between projectshowever they tend to be variations around fourmain archetypes:
• Simple, quick and effective fixes
• Application of established best practice
• Experiments
• Business case pilots
Simple, quick and effective fixes (known in Americaas ‘no brainers’) are solutions that make good senseto be implemented straight away. Examples of theseinclude ideas that the organisation thought it wasalready undertaking (such as re-establishingprocedures that have lapsed); widespreadapplication of ideas that are already tried andtested (such as regular counting); and low cost/nocost ideas that tighten up procedural adherence(such as refund policies).
The application of established best practice takesgood ideas that are known to reduce risk anddeliver profit improvement. Examples of thisinclude controlling at-risk products the same way asestablished Hot Products such as cigarettes, cashand high value alcohol.
Experiments involve implementing seemingly goodideas that lack information on their effectiveness orpotential impact on other aspects of the business.
The outcome in these implementations may notnecessarily be to reduce shrinkage but to learnmore about the solution itself. This may be thoughtof as a ‘shake down test’ of a piece of equipmentor a particular process and above all as a learningopportunity.
Business case pilots trial ideas that are conceptuallyrobust but where the data on which to make acost/benefit analysis is lacking. The purpose of thiswork is therefore to assess benefits and costs ofimplementing the solution in an operational setting.
Develop Implementation PlansNo matter what type of solution has been selected,an implementation plan helps ensure the desiredobjectives are delivered within time and costlimitations. Here the tools of project managementwill prove useful. These can be applied on bothsmall and large-scale projects. Where a projectteam undertakes planned change for the first time,the plan should consider not just the task but alsothe learning necessary to deliver it.
At a top level, an implementation plan isconstructed by following a sequence of steps. Thefollowing provides an overview of such a process:
• Construct a communication plan to ensurestakeholders are consulted with and keptinformed.
• Identify the overview tasks needed to completethe project.
• Show the interrelationships between tasks andthe sequence in which they can be undertaken.
• Estimate the types and amount of effort neededto complete these tasks.
S T O C K L O S S I N E U R O P E
34
CORPORATE POLICY
Develop Solutions Analyse
PlanEvaluate
5. Implement Map & Measure
Shrinkage book 2003 Final**** 8/5/03 4:28 pm Page 34
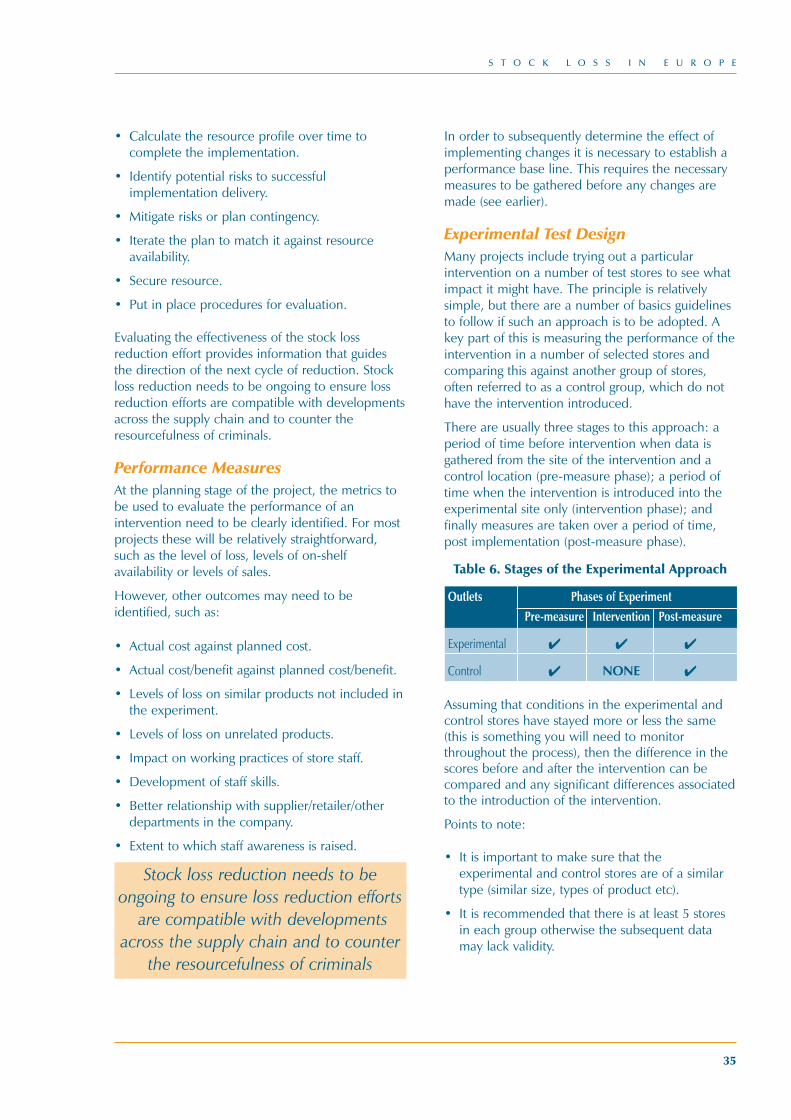
S T O C K L O S S I N E U R O P E
35
• Calculate the resource profile over time tocomplete the implementation.
• Identify potential risks to successfulimplementation delivery.
• Mitigate risks or plan contingency.
• Iterate the plan to match it against resourceavailability.
• Secure resource.
• Put in place procedures for evaluation.
Evaluating the effectiveness of the stock lossreduction effort provides information that guidesthe direction of the next cycle of reduction. Stockloss reduction needs to be ongoing to ensure lossreduction efforts are compatible with developmentsacross the supply chain and to counter theresourcefulness of criminals.
Performance MeasuresAt the planning stage of the project, the metrics tobe used to evaluate the performance of anintervention need to be clearly identified. For mostprojects these will be relatively straightforward,such as the level of loss, levels of on-shelfavailability or levels of sales.
However, other outcomes may need to beidentified, such as:
• Actual cost against planned cost.
• Actual cost/benefit against planned cost/benefit.
• Levels of loss on similar products not included inthe experiment.
• Levels of loss on unrelated products.
• Impact on working practices of store staff.
• Development of staff skills.
• Better relationship with supplier/retailer/otherdepartments in the company.
• Extent to which staff awareness is raised.
Stock loss reduction needs to be ongoing to ensure loss reduction efforts
are compatible with developments across the supply chain and to counter
the resourcefulness of criminals
In order to subsequently determine the effect ofimplementing changes it is necessary to establish aperformance base line. This requires the necessarymeasures to be gathered before any changes aremade (see earlier).
Experimental Test DesignMany projects include trying out a particularintervention on a number of test stores to see whatimpact it might have. The principle is relativelysimple, but there are a number of basics guidelinesto follow if such an approach is to be adopted. Akey part of this is measuring the performance of theintervention in a number of selected stores andcomparing this against another group of stores,often referred to as a control group, which do nothave the intervention introduced.
There are usually three stages to this approach: aperiod of time before intervention when data isgathered from the site of the intervention and acontrol location (pre-measure phase); a period oftime when the intervention is introduced into theexperimental site only (intervention phase); andfinally measures are taken over a period of time,post implementation (post-measure phase).
Table 6. Stages of the Experimental Approach
Outlets Phases of Experiment Pre-measure Intervention Post-measure
Experimental � � �
Control � NONE �
Assuming that conditions in the experimental andcontrol stores have stayed more or less the same(this is something you will need to monitorthroughout the process), then the difference in thescores before and after the intervention can becompared and any significant differences associatedto the introduction of the intervention.
Points to note:
• It is important to make sure that theexperimental and control stores are of a similartype (similar size, types of product etc).
• It is recommended that there is at least 5 storesin each group otherwise the subsequent datamay lack validity.
Shrinkage book 2003 Final**** 8/5/03 4:28 pm Page 35
• The period of time to measure before and afterthe intervention should be a minimum of threemonths and where possible, longer.
• Because of the seasonality of the FMCG sector,where possible comparable data from theprevious year should be used.
• Do not start the post measurement phase untilall the experimental stores have had theintervention introduced, tested and whereappropriate, staff trained to use it.
One possible problem with carrying outexperiments is the ‘Hawthorne Effect’. This iswhere changes in the KPIs occur not because of theintervention itself but simply because anexperiment was being carried out. For instance thepresence of project staff in the experimental storesor the requirement of store staff to collect newdata, may have an impact on the KPIs – store staffmay become generally more vigilant because theyknow they are part of an experiment.
Therefore, it is important to consider continuing tomeasure the performance of the intervention afterthe official experimental period is over. In addition,the performance of an initiative can change as its‘environment’ alters. For instance criminals maygradually find ways of defeating the newly adoptedapproach or changes in product range or levels ofstaffing might reduce its effectiveness. Therefore,periodic reviews of newly adopted measures mayneed to be carried out in order to gauge theireffectiveness over time and to evaluate whetherany corrective measures need to be taken.
Above all, it is vital to recognise that the learningfrom undertaking the project and the conclusionsdrawn are very valuable. At a strategic level, theselessons provide a key input to informing theongoing development of corporate policy. At theoperational level, the findings can direct the projectteam to new opportunities for improvement. Bothwill have further impacts on the competitiveness ofthe organisation and support its ongoing drive toimprove shopper satisfaction.
It is vital to recognise that the learningfrom undertaking a project and the
conclusions drawn are invaluable indeveloping a strategic corporate
shrinkage plan
Implement SolutionsThe actual pilot project itself involves installing thesolutions that were developed in response to theopportunities for loss reduction that were identifiedin the risk assessment. Gaining the support of thepeople involved in the operation and who will haveto make use of the solution is important. Theyshould therefore be consulted on and involved inany changes to their activities. Where necessary,training must be provided not only at the start ofthe project, but also over time due to staff turnoverand complacency.
S T O C K L O S S I N E U R O P E
36
Shrinkage book 2003 Final**** 8/5/03 4:28 pm Page 36
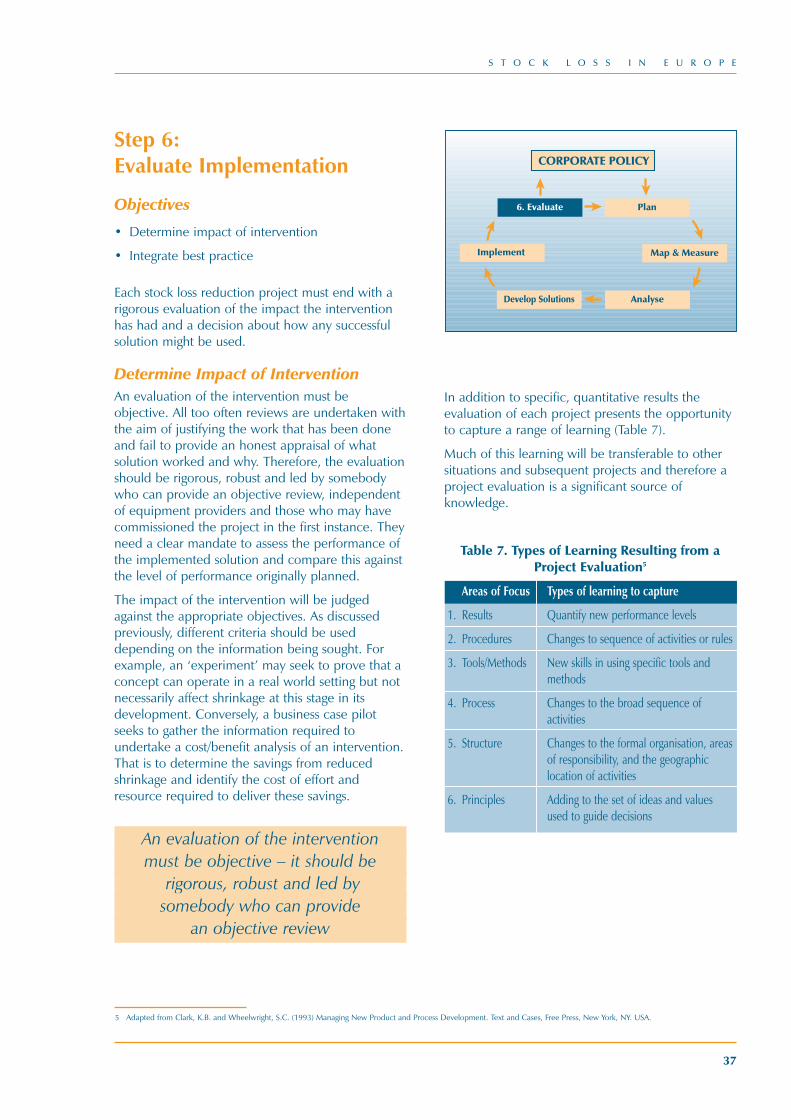
S T O C K L O S S I N E U R O P E
37
Step 6: Evaluate Implementation
Objectives
• Determine impact of intervention
• Integrate best practice
Each stock loss reduction project must end with arigorous evaluation of the impact the interventionhas had and a decision about how any successfulsolution might be used.
Determine Impact of InterventionAn evaluation of the intervention must beobjective. All too often reviews are undertaken withthe aim of justifying the work that has been doneand fail to provide an honest appraisal of whatsolution worked and why. Therefore, the evaluationshould be rigorous, robust and led by somebodywho can provide an objective review, independentof equipment providers and those who may havecommissioned the project in the first instance. Theyneed a clear mandate to assess the performance ofthe implemented solution and compare this againstthe level of performance originally planned.
The impact of the intervention will be judgedagainst the appropriate objectives. As discussedpreviously, different criteria should be useddepending on the information being sought. Forexample, an ‘experiment’ may seek to prove that aconcept can operate in a real world setting but notnecessarily affect shrinkage at this stage in itsdevelopment. Conversely, a business case pilotseeks to gather the information required toundertake a cost/benefit analysis of an intervention.That is to determine the savings from reducedshrinkage and identify the cost of effort andresource required to deliver these savings.
An evaluation of the intervention must be objective – it should be
rigorous, robust and led by somebody who can provide
an objective review
In addition to specific, quantitative results theevaluation of each project presents the opportunityto capture a range of learning (Table 7).
Much of this learning will be transferable to othersituations and subsequent projects and therefore aproject evaluation is a significant source ofknowledge.
Table 7. Types of Learning Resulting from aProject Evaluation5
Areas of Focus Types of learning to capture
1. Results Quantify new performance levels
2. Procedures Changes to sequence of activities or rules
3. Tools/Methods New skills in using specific tools and methods
4. Process Changes to the broad sequence of activities
5. Structure Changes to the formal organisation, areas of responsibility, and the geographic location of activities
6. Principles Adding to the set of ideas and values used to guide decisions
CORPORATE POLICY
Develop Solutions Analyse
Plan6. Evaluate
Implement Map & Measure
5 Adapted from Clark, K.B. and Wheelwright, S.C. (1993) Managing New Product and Process Development. Text and Cases, Free Press, New York, NY. USA.
Shrinkage book 2003 Final**** 8/5/03 4:29 pm Page 37
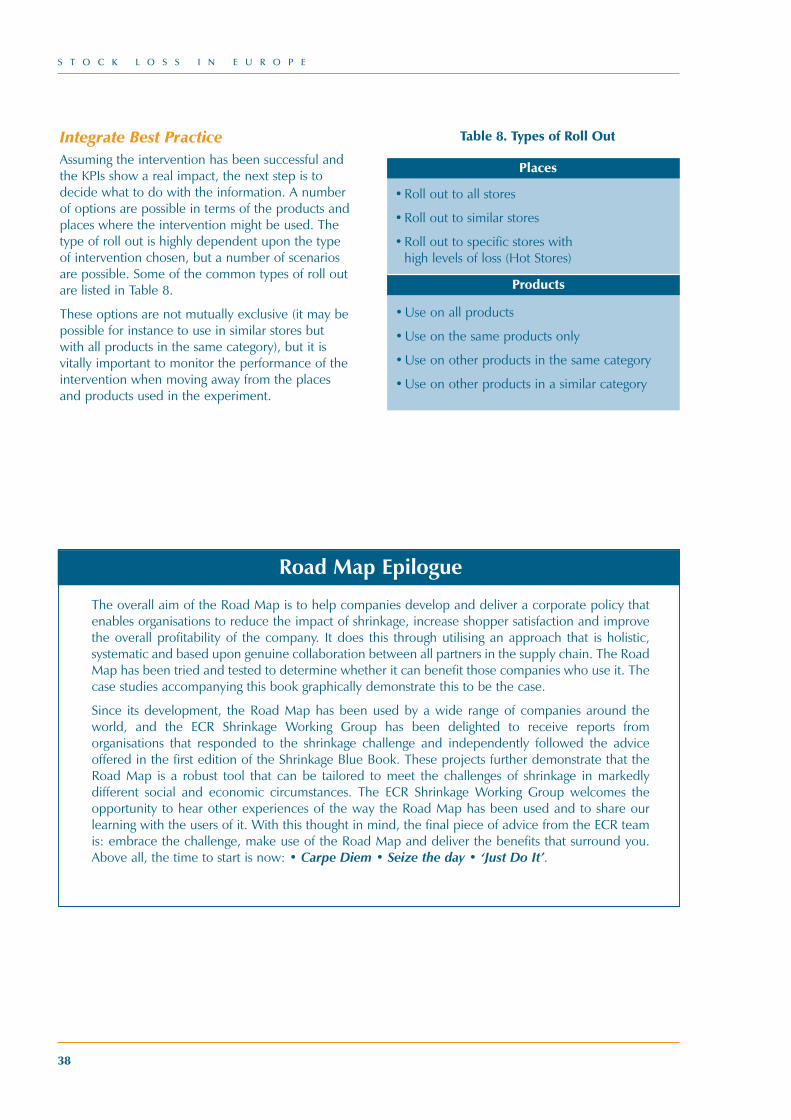
S T O C K L O S S I N E U R O P E
38
Integrate Best PracticeAssuming the intervention has been successful andthe KPIs show a real impact, the next step is todecide what to do with the information. A numberof options are possible in terms of the products andplaces where the intervention might be used. Thetype of roll out is highly dependent upon the typeof intervention chosen, but a number of scenariosare possible. Some of the common types of roll outare listed in Table 8.
These options are not mutually exclusive (it may bepossible for instance to use in similar stores butwith all products in the same category), but it isvitally important to monitor the performance of theintervention when moving away from the placesand products used in the experiment.
Road Map Epilogue
The overall aim of the Road Map is to help companies develop and deliver a corporate policy thatenables organisations to reduce the impact of shrinkage, increase shopper satisfaction and improvethe overall profitability of the company. It does this through utilising an approach that is holistic,systematic and based upon genuine collaboration between all partners in the supply chain. The RoadMap has been tried and tested to determine whether it can benefit those companies who use it. Thecase studies accompanying this book graphically demonstrate this to be the case.
Since its development, the Road Map has been used by a wide range of companies around theworld, and the ECR Shrinkage Working Group has been delighted to receive reports fromorganisations that responded to the shrinkage challenge and independently followed the adviceoffered in the first edition of the Shrinkage Blue Book. These projects further demonstrate that theRoad Map is a robust tool that can be tailored to meet the challenges of shrinkage in markedlydifferent social and economic circumstances. The ECR Shrinkage Working Group welcomes theopportunity to hear other experiences of the way the Road Map has been used and to share ourlearning with the users of it. With this thought in mind, the final piece of advice from the ECR teamis: embrace the challenge, make use of the Road Map and deliver the benefits that surround you.Above all, the time to start is now: • Carpe Diem • Seize the day • ‘Just Do It’.
Places
•Roll out to all stores
•Roll out to similar stores
•Roll out to specific stores with high levels of loss (Hot Stores)
Table 8. Types of Roll Out
•Use on all products
•Use on the same products only
•Use on other products in the same category
•Use on other products in a similar category
Products
Shrinkage book 2003 Final**** 8/5/03 4:29 pm Page 38
S T O C K L O S S I N E U R O P E
39
Shrinkage Reduction Case Studies
Shrinkage book 2003 Final**** 8/5/03 4:29 pm Page 39

S T O C K L O S S I N E U R O P E
40
Shrinkage book 2003 Final**** 8/5/03 4:29 pm Page 40
S T O C K L O S S I N E U R O P E
41
Shrinkage ReductionCase StudiesThe first phase of work by the ECR EuropeShrinkage Working Group shed light on the scale ofshrinkage in Europe, confirming that it is a majorissue for the FMCG industry. In addition, acollaborative approach to reducing shrinkage andreleasing benefits for shoppers and businesses alikewas devised. The ECR Advisory Board recognisedthe opportunity for improvement the approachpresented. Accordingly the Advisory Boardcommissioned the Shrinkage Working Group tolaunch a series of pilot projects to determinewhether this faith could be justified.
A number of companies proposed projects to theShrinkage Working Group, who selected four ofthem. The pilot projects were selected to ensurepilots were drawn from a range of countries,companies, product categories and retail sectors.An additional, fifth case was undertaken withSainsbury’s and a consortium of branded spiritssuppliers, who funded a project between them.The five case studies are summarised below inTable 9.
The Working Group acted as an advisory board tothe projects. They ensured that the projects weretreated in an objective manner in order to assess
the efficacy of the collaborative approach toshrinkage reduction whilst meeting the aim of thecompanies, i.e. to resolve specific problems.
The remit of the support provided to project teamsthrough ECR Europe was to ensure a consistentapplication of the approach developed by the ECRShrinkage Working Group, as described in thisbook. For example, where members of the projectteam executed their obligation to secure maximumbenefits for their company then the independentteam member from ECR acted to highlight wherecollaborative behaviour was being subverted. Theother principle task of the ECR support was toquantify the effects of the application of theapproach on business performance.
A review of each of the five case studies is providedbelow. In addition, each case study iscomplemented by a presentation, which can befound on the CD. These presentations werecompiled and delivered by the project teams anddelivered at ECR congresses. They consist of aPowerPoint presentation with both slides andaccompanying notes. Two of the case studies havesupporting videos, which are also on the CD.
Case Study Companies Country Product Category
Retailer Logistics Service Supplier
Sonae Colgate Palmolive Portugal Oral Care
Sainsbury’s Diageo; UK SpiritsAllied Domecq;Bacardi Martini;
First Drinks Brands;Maxxium;
Pernod Ricard
Tesco Gillette Hungary Grooming
Wickes Lloyd Fraser GET UK Home Improvement
Coop Italia P&G Italy Health & Beauty
Table 9. Characteristics of the Five Shrinkage Reduction Case Studies
Shrinkage book 2003 Final**** 8/5/03 4:29 pm Page 41

S T O C K L O S S I N E U R O P E
42
Shrinkage book 2003 Final**** 8/5/03 4:29 pm Page 42
S H R I N K A G E R E D U C T I O N C A S E S T U D I E S
43
Lessons for the ECR Community
The Sonae/Colgate Palmolive shrinkage reductionproject delivered a 29% reduction in shrinkage inthe six stores where the pilot project wasundertaken. In addition to providing strongevidence to support the claim that, ‘The ECR RoadMap works,’ there are several lessons that should beuseful to the wider ECR community:
The root causes of shrinkage were identified asbeing failures in supply chain processes andoperational procedures. By following the Road Mapthe project team revealed where majoropportunities for shrinkage lay. The team calledthese the ‘Hot Spots’ in the supply chain.
The solutions developed and implemented by theproject team targeted the Hot Spots. The reductionsin shrinkage were achieved by reducing the risk ofprocess failure and removing the opportunity forlosses to go undetected at the Hot Spots.
By approaching shrinkage in a systematic manner,the project team delivered reliable and robustfindings in a shorter time period than if they hadapproached their work in an ad-hoc manner.
The knowledge gained from this project is beingleveraged by Sonae through applying it to othersuppliers’ products and by Colgate Palmolivethrough applying it to other retail chains.
Introduction: Shrinkage Threatens Actibrush Success
Colgate Palmolive stole a march on theircompetitors in the oral-care category with theintroduction of Actibrush in year 2000. Thisbattery-powered toothbrush provides consumerswith many of the benefits of regular electrictoothbrushes but at a substantially lower price,opening up a market niche in which Colgate had‘first mover’ advantage. In a competitive category,Colgate sought to consolidate their position with asuccession of product and promotional
enhancements, such as the introduction ofcoloured and themed variants to complement theoriginal, white model. A significant addition to theproduct range was the introduction of ‘Bzzz’, achildren’s version. The success of this model washelped in no small part by an agreement to use thecharacters from Harry Potter. However,unbeknown to Colgate Palmolive, the samecharacteristics that made Actibrush a commercialsuccess were also making it a ‘Hot Product’.
Close Commercial Relationship Strained by Profit Slump
The relationship between Sonae and ColgatePalmolive is symbiotic. As Portugal’s leading groceryretailer, Sonae is a key account for ColgatePalmolive. Conversely, Colgate Palmolive productsare a major sales generator for Sonae, with theColgate range especially significant in the oral-carecategory. When the profitability of retailingActibrush was hit by a notable rise in shrinkage, thisbecame a key concern for Sonae’s buying team.
Veiled Threats Highlight Need for Action
Rather than suffer alone, Sonae took the naturalstep of drawing the shrinkage problem to theattention of Colgate Palmolive’s sales team. Tounderline their concerns, Sonae made it clear thatlosses must be quickly brought under controlotherwise draconian actions would be imposed.Possible actions under consideration, to preventfurther margin erosion, included defensivemerchandising, e.g. taking Actibrush off opensale, and/or seeking ‘compensation’ from ColgatePalmolive for a proportion of the value of thelosses. Thus the scene was set. The need toreduce the level of shrinkage was clear and therewas motivation at both Sonae and ColgatePalmolive to quickly resolve the issue. Failure torespond to the situation was not an option at apersonal level, bonuses were at stake, and neithercompany could benefit from soured relations.
Sonae and Colgate PalmolivePortugal
Shrinkage book 2003 Final**** 8/5/03 4:29 pm Page 43
S H R I N K A G E R E D U C T I O N C A S E S T U D I E S
44
ECR Road Map Shows the Way Forward
Enthusiasm the Order of the Day
The circumstances faced by Sonae and ColgatePalmolive are similar to those faced by many buyingand sales teams across Europe, where shrinkagespirals out of control and an obvious solution is notavailable. This is exactly the situation that proves tobe a fertile ground for successful application of theECR shrinkage reduction Road Map. The Road Mapbrought to the Sonae/Colgate Palmolive projectteam a structured approach to solving the problemthey faced, into which they could invest theirenthusiasm and industry knowledge. As the teamfollowed the steps of the Road Map, theeffectiveness of their actions increased by using thetools and techniques that accompany the RoadMap.
Personal Commitment Required
In addition to bringing shrinkage under control, theSonae/Colgate Palmolive team aimed to be true tothe ECR principle of collaboration whilst alsodelivering the necessary results rapidly. Deliveringthese three objectives became the responsibility ofthe category buyer at Sonae, Patrícia and two keyaccount managers at Colgate Palmolive, Diogo andJoão. This core team was supported by specialists, forexample from logistics and store operations, as wellas Cranfield School of Management who providedguidance on applying the Road Map approach.
The ability of the project team to deliver theirobjectives was enhanced by the clear support ofsenior management at both Sonae and ColgatePalmolive. These managers gave support andguidance to their own people as well as meetingtogether on an occasional basis to help progress theproject. This personal commitment to delivering theobjectives from a variety of management levelsmaintained the impetus behind the project andappeared instrumental in delivering thorough resultsin a condensed time-frame.
Collaboration Delivers Rapid Results
As the team themselves said, ‘Speed was our buzzword.’ In just nine days of hands-on effort, spreadover a period of nine weeks, the teamsystematically followed the Road Map. In theirinvestigation of the Distribution Centres for both
Colgate Palmolive and Sonae and a selection ofSonae stores, the team mapped the supply chainand gathered the performance data necessary toundertake a thorough analysis of the supply chain.
Using Failure Mode and Effects Analysis, FMEA,three ‘Hot Spots’ in the supply chain werediscovered where control of products and clarity ofinformation was poor. These Hot Spots were majorpoints of risk where the supply chain operationlacked adequate control, risked failing andprovided the opportunity for organised theft andpilferage. The three Hot Spots occurred in thefollowing steps of the supply chain:
• Picking and dispatch operation at the Sonae DC.
• Receiving and warehousing operation at theSonae stores.
• The shelf in the stores.
Having demonstrated where the major risk of stockloss existed, the team worked to develop solutionsthat resolved these problems. Decisions made atthis step in the Road Map can have significantcommercial implications, which can cause tensionsto arise in the project team. This is where adheringto the ECR principle of collaboration pays thegreatest dividend. Team members should strive toget the best deal for their own company andrecognise that in the long term those solutions thatdeliver win-win returns will be the ones that survivein the long term.
Focus on Severity, Occurrenceand Detectability to Reduce Risk
The key to the successful reduction in shrinkagewas to be pragmatic and seek solutions that (i)reduced the severity of losses, (ii) reduced thenumber of times that losses occurred and (iii)increased the ability of a loss to be detected at thetime it happened. Applying these principles, theSonae/Colgate Palmolive team developed a seriesof solutions that improved logistics flow andprocedures. These were adopted across the supplychain: at Colgate Palmolive’s DC; at Sonae’s DC;and in the stores themselves. In order to respond tothe threat of theft from the shelves of the stores, anumber of security measures were implemented.
In the supply chain, the solutions included isolating
Shrinkage book 2003 Final**** 8/5/03 4:29 pm Page 44
S H R I N K A G E R E D U C T I O N C A S E S T U D I E S
45
Hot Products such as Actibrush from other productsand rigorously controlling their storage andmovement. For example, the movement betweenSonae’s DC and stores was undertaken in a HotBox. Although only cardboard, the box was clearlyidentified and it’s contents listed. The Hot Box wasloaded onto the delivery truck last and its contentsverified beforehand. Upon receipt at the store, theHot Box was unloaded first and it’s contents line-checked and verified. Discrepancies were thereforeimmediately alerted. From delivery, the contents ofthe Hot Box were immediately merchandised ontothe shelves, avoiding any delay in the vulnerableback-of-store area. Should there be excess stock,this was stored in a secure location under lock andkey with a single person accountable for theinventory. On the shop-floor, the amount ofinventory of Hot Products is kept to a minimum,with daily store replenishment removing the needfor large quantities to be held. An inventory countis undertaken at least daily so theft can beimmediately discovered. When this is discovered,CCTV footage of the area is reviewed to identifypossible suspects. The identity of these people istracked over time and action taken to preventreoccurrence through raised shop-floor staff andsecurity personnel awareness.
Holistic Supply-Chain Response Delivers Results
Having viewed shrinkage as something more thanjust shoplifting from stores, the Sonae/ColgatePalmolive team were able to deliver a holisticresponse to the problem they faced. Theeffectiveness of their approach and the solutionsthey implemented is evaluated by considering theeffect this had on shrinkage. A trial of the solutionsdeveloped by the Sonae/Colgate Palmolive teamwas undertaken in the two companies’ DCs and insix stores, which resulted in a 29% reduction inshrinkage.
The effectiveness of the solutions in reducingshrinkage has led to Sonae deciding to roll-out thein-store solutions to all their stores. This programmeis not restricted to Colgate Palmolive products suchas Actibrush. Sonae believe the benefits of theirwork with Colgate Palmolive will apply to HotProducts in general. They are therefore beginning
to roll out the ECR Road Map approach and thesolutions they have already developed to includeother suppliers, not just in the oral-care category. Ina similar vein, Colgate Palmolive is applying theknowledge gained from following the ECR RoadMap to collaborate with other key customers.
Shrinkage book 2003 Final**** 8/5/03 4:29 pm Page 45

S H R I N K A G E R E D U C T I O N C A S E S T U D I E S
46
Shrinkage book 2003 Final**** 8/5/03 4:29 pm Page 46
S H R I N K A G E R E D U C T I O N C A S E S T U D I E S
47
Lessons for the ECR Community
The objective of this project was to understand thenature of the threat posed to branded spirits in theSainsbury’s supply chain and propose actions forSainsbury’s and the brand owners to reduce stockloss. To the satisfaction of all parties, a number ofinsights were identified and a few myths dispelled.These should prove interesting reading for the ECRcommunity at large.
The spirits supply chain provides great insights intothe nature of stock loss. Firstly, the bonded supplychain was found to be virtually ‘water tight’ –almost nothing is lost from it. Conversely whilstbranded spirits are a major driver of retail sales, thelosses experienced by Sainsbury’s in this categorywere significant. This research summarised thereasons why the bonded system works so well, froma loss prevention perspective, and applied theselessons to the retail outlets. Put simply, successfulloss prevention in the spirits supply chain is not anaccident. It results from a person accountable forstock loss using information on loss incidents toprevent further occurrences.
Applying this lesson to retail stores reveals the needto assign accountability for stock loss to a memberof staff. Information is needed to determine whichproducts are the Hot Products and where the HotSpots in the supply chain lie. Action can then beapplied to these products and places to preventfurther occurrence of loss.
Introduction: A Rude Awakening
Sainsbury’s are paving the way for the rejuvenationof their fortunes through a significant investmentprogramme. In addition to an impressive newheadquarters and spending a reported €800 million(£500 million) on its distribution network, thecompany has outsourced a significant element of itsICT capability to Accenture, a management
consultancy. This arrangement led to a majorupgrading in Sainsbury’s management informationsystems. With its new ICT systems in place,Sainsbury’s now has the capability to capturedetailed data on operational performance. Withwhat appears to be industry best practice, stock lossdata can be collated on a weekly basis, by store, bystock keeping unit (SKU/reference).
Whilst the data gathering capability of Sainsbury’ssystems is impressive, the information it compiledcame as a rude shock to Allan Cheesman,Sainsbury’s Head of Beer, Wine and Spirits. For thefirst time Allan came face-to-face with the details ofwhere shrinkage was slicing an annual sum of €8million (£5m) from his category’s profits. Oneaction taken by Allan and Sainsbury’s LossPrevention department was to turn to the six keysuppliers whose products accounted for themajority of in-store shrinkage and ask them howthey intended to respond to the problems that hadbeen uncovered.
Whilst losses at Sainsbury’s significantly affects itsown profitability, the effect of these losses is also feltby the BWS brand owners. Although the brandowners may be insulated by the retailer from thedirect impact of this loss, they are under increasingpressure to become involved in methods to reducethe cost of shrinkage (such as EAS source tagging10).
For the ECR community as a whole, levels of stockloss are quite frankly alarming and demandsimmediate action. However this case study of lossesin Sainsbury’s BWS category highlights the mainproblem facing retailers and suppliers at large. Thetelling symptom, as highlighted by Allan Cheesman,is that, ‘stock loss has been a ‘cause célèbre’ forover twenty-five years.’ Whilst today’s losses are asignificant drain on profits, the key issue is thefailure of current approaches in stemming this loss.
Sainsbury’s and a Consortium of BrandedSpirits Suppliers9
United Kingdom
9 This project was funded by Sainsbury’s, Diageo, Allied Domecq, Bacardi Martini, Pernod Ricard, First Drinks Brands and Maxxium.
10 EAS – Electronic Article Surveillance – is the term used for a range of technologies and methods where tags are attached to products. These tags are intended to set offalarms at store exits unless they are disabled when the goods are purchased.
Shrinkage book 2003 Final**** 8/5/03 4:29 pm Page 47
S H R I N K A G E R E D U C T I O N C A S E S T U D I E S
48
Waking up to the need for a new approach to lossprevention, Sainsbury’s and their key BWSsuppliers chose to undertake a comprehensivereview of BWS losses across the supply chain usingthe ECR approach. Working to an ambitioustimescale, effort was focussed on ‘Hot Products’,i.e. those that appear in Sainsbury’s top 10 list oflost SKUs, from Allied Domecq and Diageo. Thiseffort was also limited to an investigation of tworetail outlets.
ECR Road Map Points the Way
The project was undertaken with Sainsbury’s,Diageo and Allied Domecq as contributors andBacardi Martini, Pernod Ricard, First Drinks Brandsand Maxxium as additional sponsors. The projectmade full use of the ECR shrinkage reduction RoadMap, embracing its emphasis on loss preventionthrough increasing supply chain integrity. Byremoving loss caused by administrative errors anddamage, the opportunity for theft and fraud isreduced and attempts to undertake criminal activitybecome more visible. Thus the approach attacks allthe key causes of loss.
Application of the ‘Map and Measure’, ‘Analyse’and ‘Develop Solutions’ steps of the Road Map wasundertaken at the production facilities, distributioncentres and two stores in line with the requirementsspecified in the project brief. The steps of the RoadMap were undertaken as follows:
Map and Measure: Physically visit each facilityalong the supply chain and identify and classify thestock loss risks associated with process failure andtheft from the facility.
Analyse: Undertake ‘Failure Modes and EffectsAnalysis’ of the process to identify key risks toprocess robustness. Undertake a Cause and EffectsAnalysis of the key risks to identify underlyingcauses of key risks.
Develop Solutions: Develop solutions and compilethem into a list of provisional recommendations onactions that, when implemented, should remove ormitigate the underlying causes of a number of thekey risks to process robustness.
Understanding Effects on Operational Robustness
As products move through the supply chain, three keyfactors compound the degree to which they are atrisk: the number of SKUs, the degree to whichirregularities are visible to the organisation and theextent to which audit checks are carried out.
At the head of the supply chain, in the bottlingplant, the number of SKUs being produced isrelatively small (usually less than 150). In addition,products are produced specifically to fulfil aparticular customer order. In the case of the SKU’sfollowed along the Sainsbury’s BWS supply chain,these orders are produced, stored and shipped infull truck quantities. With each case on each palletalready assigned to a customer, combined with astraight forward process of supply, errors are quicklynoticed. In addition to this operational visibility is aculture of auditing and checking products thatresults from the necessities of complying with andbeing accountable to HM Customs and Excise(HMC&E).
The production operations at both Allied Domecqand Diageo proved to be exemplars of operationalrobustness where opportunities for process failureand theft are minimised and the few errors anddiscrepancies that do occur are easily identified andresolved. The advantages of these characteristicsare becoming increasingly sought by a variety ofcompanies, a number of which have paid thecomplement of benchmarking their operationsagainst the ones investigated here.
When products reach the supplier DC, thecomplexity of the supply chain generally increasesfor example through greater numbers of SKUs beingheld in the warehouse. This increase in complexityslightly increases the risk of process failure andtheft, although the influence of Customs and Exciseremains and auditing of stock is seen as a highpriority. Maintaining robust control of the stockcontinues to result in low levels of loss.
A more diverse and larger range of SKUs are held ina bonded retail DC. Operational complexityincreases once again as deliveries are received froma number of different providers. The number of‘customers’ is also much higher as is the frequency
Shrinkage book 2003 Final**** 8/5/03 4:29 pm Page 48
S H R I N K A G E R E D U C T I O N C A S E S T U D I E S
49
of deliveries. Most outgoing orders are based uponcases, not pallets so the number of handlingoperations conducted in this environment increasessignificantly. However, the Customs and Exciseinfluence continues to prevail and the checking ofin-bound stock, stock held in the warehouse andoutgoing orders is still a priority. While losses at thisstage of the supply chain are higher than in previousstages, they are still relatively low.
A critical watershed in process robustness isreached when stock is either moved to anunbonded retail DC or to a store. In both types offacility the number of SKUs rises dramatically asdoes the normality of seeing open cases around thefacility and individual items being handled. Hencethe ability to spot irregularities is considerablyreduced. At the same time, the degree to whichaudits and checks are carried out reduces.Therefore the risk of process failures is higher whilstthe practices to identify, trace and resolve them arepoorer.
The Impact of Customs and Excise – A Culture of Accountability
The responsibilities imposed by the necessity tomeet the rigorous and potentially costlyrequirements of the auditable standards of Customsand Excise should not be underestimated. Suppliersand bonded retail DCs operate in an environmentwhere any losses need to be quickly identified andrecorded otherwise the financial penalties can besevere. This has created a culture of accountabilityand checking where good quality inventory recordsare seen as an absolute necessity. The same cannotbe said for stock held in unbonded environments.
There are a number of factors that maketransferring such a culture to the store environmentdifficult, not least the added complications of thesheer number of SKUs in stock and the greaterdifficulty of physically tracking stock and noticingloss. However, there is a strong argument forinvestigating how a HMC&E type culture might beimposed upon the post bonded retail environment.
Site Threats
In addition to the factors outlined previously, twopairs of operational features of the supply chain areimportant in understanding the risk of theft. These
are (i) motivation and opportunity and (ii) risk andconsequences.
Motivation
Motivation is an important factor in affecting thelikelihood to offend by those working in the supplychain. There are three factors which need to beconsidered when assessing motivation:acceptability, neutralisation (or excuses) andmarginalisation. Acceptability is associated withwhether the dishonest act is perceived by theoffender to be wrong. For instance, if staff do notconsider particular practices to be dishonest, orthey see managers or supervisors behaving in adishonest manner, such as eating stock on display,then this can legitimise the act. Offenders mayutilise a form of neutralisation whereby the theft ofgoods or money is considered to be victimless andhence nobody really suffers. Thieves who seek toneutralise the effects of their crimes often excusetheir act by using explanations such as ‘well thecompany can afford it’. Finally, marginalisationwithin the company may have a role to play inexplaining why some staff become dishonest. Staffwho are on short-term or part-time contracts, or seeno obvious path of promotion may considerthemselves ‘temporary’ employees within the workenvironment and hence perceive themselves tohave less to lose if they are caught committingdishonest acts. Those most frequently caught forstaff theft include young, part-time employees whohave been with the company for a relatively shorttime and do not see themselves staying with theorganisation for very long. This perception of anemployee’s position within the company may bethe critical variable in explaining their likelihood tobecome dishonest.
Opportunity
Opportunity is of critical importance and is basedupon three significant factors: space, time andposition. Space is associated with opportunitiesprovided by particular parts of the workingenvironment – a survey of retail staff found that amajority identified ‘backroom’ areas as offering anideal opportunity to steal goods, primarily becausestaff were often on their own. Similarly, managerslegitimately enter all parts of the store withoutraising suspicion. For external thieves, ‘blind spots’
Shrinkage book 2003 Final**** 8/5/03 4:29 pm Page 49
S H R I N K A G E R E D U C T I O N C A S E S T U D I E S
50
within stores, such as behind pillars or areas that arenot readily observable by staff or CCTV can provideopportunities for theft. Time is also an importantfactor of opportunity. If particular members of staffwork at times when there are either lower levels ofsupervision or there are very few or no other staffpresent (such as night shifts), then their opportunityto steal is higher. In addition, shoplifters may chosetimes when they know a retail store has very fewstaff working, or when the store is particularly busy,when other shoppers provide ‘cover’ for theiroffending. Finally, position or role in the companycan provide staff with the opportunity to commitcrime. Positions of responsibility and orspecialisation can offer staff the opportunity to bedishonest (for instance buyers or IT staff).
Risks and Consequences
Sanctions or disincentives to commit crimeinfluence the likelihood to offend. These are theperceived chances of being caught and theconsequences of any subsequent punishment. Ifoffenders consider the risk of being caught as lowthen this acts positively to encourage dishonesty.Similarly, if the punishment is relatively lenient thenthis also acts positively to encourage theft.Alternatively, if potential offenders considerthemselves at significant risk of being caught andappreciate that the punishment will be severe (lossof job for instance or a criminal record) then thisacts as a powerful disincentive. In addition,offenders need to decide whether the rewards aresufficient and the prospects of being caught lowenough to proceed with the offence.
Quantifying Site Threat
Taken together these variables help explain andquantify the threat of theft by staff. It is important toremember that these factors work both in isolationand in combination depending on the particularoffender and the circumstances surrounding theincident. Indeed, for some offenders there arepowerful factors that act positively to encouragedishonesty while at the same time other factors actin the opposite direction and in effect cancel eachother out.
When these factors are applied to quantify thethreat of theft at the various stages of Sainsbury’sBWS supply chain, it can be seen that as products
move along the chain there is an inverse linearrelationship between the four factors and thelocation of the product.
• Motivation to commit offences increases.
• Opportunity to commit offences increases.
• The perceived risk of being caught committingan offence reduces.
• The perceived consequences of being caughtcommitting an offence reduces.
Losses Concentrate on Hot Products and in Hot Stores
Examining the distribution for loss per SKU acrossthe range of individual products revealed a tellingprofile. This is the signature of the ‘Hot Product’phenomena. In this project, 30% of losses werefound to occur on 8% of the items stocked and 50%of loss incurred on 20% of items. When seeking tocontrol and eliminate loss, it makes sense to applyeffort on these few, vulnerable stock items
In addition to the ‘Hot Product’ phenomenaobserved for the BWS category, examination of thelevel of loss per store reveals another phenomena:the ‘Hot Store’. This indicates that across the estate,the distribution of loss is skewed onto a smallnumber of stores. Specifically it seems that half of allspirits losses occur in 18% of stores. This being thecase it would seem that focussing attention ontothese stores in the first instance would deliver thegreatest return.
Conclusions
On the basis of this examination across the supplychain it was clear that the supply chain frombottling plant to store is generally secure. In thecase of the supply chain operations, we drew ourconclusions mainly on the basis of an examinationof process robustness as there was an insufficientdata on the levels of loss in the retail distributionchain. Despite this, it was felt safe to conclude that,‘the store is the problem,’ indicating that this iswhere the weight of attention should be applied.
Considering the practices employed in the stores toprevent loss from the perspective of bothoperational efficiency and loss prevention, itappears that they are generally not effective.
Shrinkage book 2003 Final**** 8/5/03 4:29 pm Page 50
S H R I N K A G E R E D U C T I O N C A S E S T U D I E S
51
Turning Research into Action
Most criminological research shows that shopliftersare deterred by increasing their perceived risk ofbeing caught and subsequently punished. There areseveral elements within the store that need to beconsidered to achieve this increase in risk:
1. Accountability for stock loss in the BWSdepartment needs to be assigned. This personwill ensure that loss prevention practices andprocedures, such the recommendations listedbelow, are implemented and maintained.Making the BWS department leader a moresenior position would help achieve betterownership of the need to drive sales up andlower losses. The recent introduction of ‘Off-Licence’ Managers to selected stores (pres-umably with profit and loss responsibility) meetsthis need for the allocation of accountability.
2. Staff need information on which products sufferstock loss for them to take appropriate action.They need to know which SKUs are mostvulnerable to loss (through access to high qualityloss data) so that they can be ‘present in the aislewith a purpose’, increasing their likelihood todeter offenders.
3. A good way to make sure staff are aware of thevulnerability of particular products is throughgathering data. Store staff were undertaking apractice of counting the stock on the shelves andrecording the quantities put out on display, thenumber of items sold and the number that werelost. However the procedure for recording thesenumbers was ad-hoc and not always undertaken.For this laudable procedure to be effective, itneeds to be systematic and undertakenconsistently. Therefore the store staff require amore professional, centralised and properlyresourced approach. Not least, the staff need aproper log-book in which to record the data andthey need to have easy access to sales data.Finally they need to review the information theycollect, at least every week, to identify incidentsand trends and to plan how they will take actionto tackle problems. These plans should bereported to the store manager on a weekly basis.
4. Using the in-store CCTV system in conjunctionwith the data on losses gathered through the
counting helps identify persistent offenders.Shelf counting reduces the time between losshappening and store staff becoming aware of it.By knowing the time window in which the lossoccurred allows CCTV footage to be reviewedwith the aim of linking likely offenders withmissing stock.
5. Use the in-store security guard to carry out theabove process, which will provide a moreinteresting mix of activities for the guard andincrease their motivation.
6. Store staff were undertaking a practice ofstamping high value spirits with the storenumber and address. There was no evidencethat this has the effects that store staff implied ithad, e.g. ‘enables police to recover stolen stockto the right store,’ ‘stops offenders claiming thestolen stock was purchased at anotherSainsbury’s store’. The savings in staff time couldbe used to more effectively audit the stock onthe shelves.
7. The use of EAS tags was found to be whollyineffective in dealing with the off-shelf theft ofbottled spirits by customers for a number ofreasons:
• The tags and the alarm system are poorlyadvertised, hence offer little deterrent.
• The tags/alarm system is easy to defeat bydisabling the tag or shielding it from the alarmgates.
• The tags are easily overlooked by till staff, whofail to disable them, which causes the system tobe inadvertently activated and further reducestaff confidence in the system.
8. Finally, it seems appropriate to consider bottledspirits as candidates for trials with EAS ‘hardtags’. The hard tags seem to address many of theproblems highlighted above. Hard tags are largeitems, therefore they offer a visible deterrent totheft. They are also of stout construction,making them difficult to disable. Being fairlylarge, these tags should not be overlooked bythe check-out staff and therefore are more likelyto be removed, preventing false activations ofthe alarms.
Shrinkage book 2003 Final**** 8/5/03 4:29 pm Page 51
S H R I N K A G E R E D U C T I O N C A S E S T U D I E S
52
Implementing Recommendations
Trial Changes to Operations, New Methods and Technologies
The comments made, conclusions drawn andrecommendations suggested were intended tostimulate thought and promote action amongstSainsbury’s and their BWS suppliers. It washowever necessary to add a health warning to thisresearch, which applies to all companies seeking toreduce stock loss. The deployment of new thinkingneeds to be both embraced and treated withcaution. This is also true when the action is not tostart something new but to cease something that iscurrently being undertaken, for example to stop thestamping of spirits bottles with the Sainsbury’s storenumber.
Accordingly, the recommendation was made thatoperational changes should be deployed firstly in aplanned series of rigorously performedexperiments, in keeping with the methodsdescribed in the ECR Road Map.
Perform Rigorous Experiments
In order to reveal the true effect of new approachesto loss prevention it is imperative to break awayfrom the age-old loss prevention culture of opinionand anecdote. Decisions need to be made on thebasis of robust, data rich evidence. The first stage ofthese ‘experiments’ is to perform a thorough ‘shakedown’ test on these new ideas. Put simply, theyneed to show they can stand up to the rigours of theworkplace. The second stage is to acquire‘investment grade’ data. Key to getting thenecessary data on which investments can be madewith confidence is to ensure robust experimentaldesign. This requires the construction of a propertrial, with a control group, and the results assessedwith appropriate statistical tools.
Quantify Impact on Losses and Sales
Finally, having made the investment in time andmoney, the financial impacts of the ideas need tobe audited in order to learn and move forward totackle new challenges.
Shrinkage book 2003 Final**** 8/5/03 4:29 pm Page 52
S H R I N K A G E R E D U C T I O N C A S E S T U D I E S
53
Lessons for the ECR Community
The Tesco/Gillette project demonstrated impressiveresults. Sales increased by 288% and stock lossreduced by 74% in the three stores where the pilotproject was undertaken. Both companies consideredthe project was a success and the solutionsdeveloped by the project team are being rolled outacross Tesco’s estate in Hungary.
In addition to the benefits to Tesco and Gillette, thisproject provides several lessons that should beuseful to the wider ECR community. These relate tothe role of collaboration, the factors that influencedsuccess in the project and the need for objectiveperformance measurement.
The collaborative approach is not an excuse foravoiding the key issue of delivering quantifiedfinancial benefits. As Tesco and Gillette clearlydemonstrate, collaboration is an enabler for raisingeach company’s individual profitability.
The Road Map provides a pragmatic approach toimproving product availability. The success of thisapproach lay in its ability to generate commitmentamongst the people who become involved with theproject. This commitment is a key factor in ensuringthe success with which solutions are implemented.
In order to make sound business decisions,particularly when faced by the emotive subject ofshrinkage, objective performance measurement isvital. This is true at the start of a project as well asthe evaluation step at the end.
Introduction: A Trio of Success – Retailer,Supplier and Nation
The success of Tesco, and indeed theirs is a story ofretail success, is based on a ruthless focus ondelivering shopper satisfaction. Critical to thesuccess of this mass appeal retailer is their ability toachieve:
• Economies of scale.
• Minimised operational cost.
Economies of scale only come by attracting andretaining shoppers. These customers are the heartof the business, around which the infrastructure toserve them in the most cost efficient manner isbuilt. In common with other mass appeal retailers,Tesco underpins the ability to serve shoppers in acost efficient manner with an efficient distributionnetwork and extensive estate of hyper and supersize stores.
In a parallel story of success, the Gillette Groupestablished and maintains a healthy position in thegrooming category through the appeal of itsproducts. A series of product innovations hascaptured consumers’ imaginations leading to highlevels of loyalty for Gillette’s premium brandsshaving systems such as Mach 3 and Venus.
The third element in the trio of success is Hungaryitself. Following the end of the Cold War,symbolically represented by the Berlin Wall comingdown, both Tesco and Gillette were keen to bringtheir respective expertise to the people of Central-Eastern Europe. Amongst the first countries toembrace democracy and free market economicswas Hungary. With a well-educated, multi-lingualand motivated people the Hungarian economydemonstrates strong growth with GDP per headlevels increasing rapidly.
Crisis on the Shop-Floor
Against the steady and impressive progressexperienced by Tesco and Gillette in Hungaryloomed a crisis. Losses of Mach 3 replacementblades, Gillette’s premium male grooming productand Tesco’s major sales generator in the men’sgrooming category, were running at dramatic levelsin a number of stores. Tesco were not just losingmargin on listing these items, they were losingmoney. Taking a pragmatic view, many Tesco storemanagers were defensively merchandising Gillette’spremium products by taking them off open sale.However not only did this action significantlyreduce sales, shrinkage continued to run atunacceptable levels. As a final response to this
Tesco and GilletteHungary
Shrinkage book 2003 Final**** 8/5/03 4:29 pm Page 53
S H R I N K A G E R E D U C T I O N C A S E S T U D I E S
54
problem Tesco’s senior managers concluded thatunless matters were turned around within 14 daysGillette’s premium products would be delisted.
What happened to Collaboration?
Collaboration is the mantra of the ECR movement.Both Tesco and Gillette are keen supporters of ECR.However, collaboration seemed an unaffordableluxury with profits at stake, which is why Tesco wasprepared to stem their losses in such a dramaticfashion. With hindsight, it was clear a definition ofcollaboration was needed. The solution was foundto be:
Collaboration: ‘Businesses achieving their individualgoal of maximum appropriation of value, mutually.’
Send in the Road Map
Tesco and Gillette had a considerable amount ofcommon ground, not least:
• Focus on financial results: A need to deliverprofits in line with targets.
• Need for solution: doing nothing was not anoption.
• Action must be taken quickly and decisively.
This common ground set the context in which theECR shrinkage reduction Road Map was used.
The Road Map responds to the real-lifecircumstances faced by retailers and suppliers. Thisproject was no different. Above all, the Road Mapensures that an investigation into an emotionallycharged circumstance is undertaken in a systematicand robust manner. This ensures that the truenature of the shrinkage problem is highlighted, theunderlying causes of stock loss are identified andappropriate solutions developed and implemented.Collaboration is a key element in the success of thisapproach and was achieved in this project bydrawing together a capable team with people fromboth companies and who had access to additionalsubject experts as required.
The investigation into the losses at Tesco started byfirst mapping and measuring the supply chain. Thisinvestigation revealed that losses were concentratedon just a few items (references; SKUs). Thieves wereclearly targeting these Hot Products. Furtheranalysis revealed that the loss of these items wasconcentrated in a few stores, the so-called Hot
Stores. This focussed the efforts of the project teamonto responding to the losses of Hot Products inthese Hot Stores. This involved conducting adetailed examination at these Hot Stores into:
• The ordering process and inventory recordingsystem.
• The physical supply of goods into the store.
• The storage and protection of goods inside thestore.
The systematic review of the supply chain from theGillette Distribution Centre, to the Tesco Depot (adistribution centre), to the stores and finally to theshelves revealed a total of 150 areas of risk. Theseoccurred at various points in the supply chainwhere the process and its associated procedureslacked control. The risk at these points was thatproduct could be lost through process failure. Therisk that process failure can occur provided theopportunity for theft to occur and not bediscovered.
Solving the Problem in 10 Easy Steps
The work of the Tesco/Gillette team is captured inthe solutions they developed. Clearly illustrated inthe video that accompanies this case study (seeCD), the 10 steps are grouped into three areas:
• Secure the ‘Hot Product’ Supply Chain.
• Secure In-Store Handling.
• Define Ownership and Control of Loss.
Secure ‘Hot Product’ Supply Chain
Hot Products are the focus of attention byindividuals who shoplift or pilfer for their own useor use by acquaintances. Hot Products are also thetarget for organised theft, whose aim is to convertthe product into cash. The strong brand awarenessand product loyalty that was established by Gillettefor their Mach 3 line made it a target at Tesco. Inorder to deny organised thieves the opportunity tosteal large quantities from the supply chain it wasnecessary to secure the supply chain. Threemeasures were implemented to achieve this:
1. Sealed pallets from DC to outlets.
2. Each product movement checked &documented.
Shrinkage book 2003 Final**** 8/5/03 4:29 pm Page 54
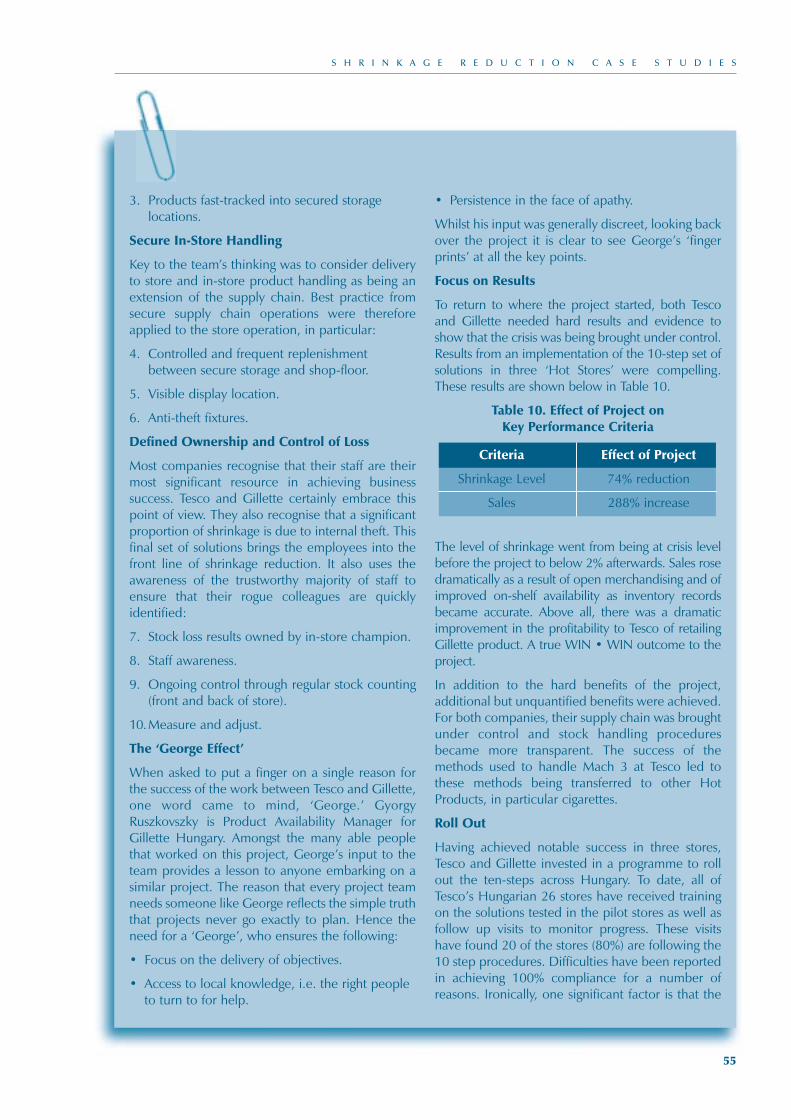
S H R I N K A G E R E D U C T I O N C A S E S T U D I E S
55
3. Products fast-tracked into secured storagelocations.
Secure In-Store Handling
Key to the team’s thinking was to consider deliveryto store and in-store product handling as being anextension of the supply chain. Best practice fromsecure supply chain operations were thereforeapplied to the store operation, in particular:
4. Controlled and frequent replenishmentbetween secure storage and shop-floor.
5. Visible display location.
6. Anti-theft fixtures.
Defined Ownership and Control of Loss
Most companies recognise that their staff are theirmost significant resource in achieving businesssuccess. Tesco and Gillette certainly embrace thispoint of view. They also recognise that a significantproportion of shrinkage is due to internal theft. Thisfinal set of solutions brings the employees into thefront line of shrinkage reduction. It also uses theawareness of the trustworthy majority of staff toensure that their rogue colleagues are quicklyidentified:
7. Stock loss results owned by in-store champion.
8. Staff awareness.
9. Ongoing control through regular stock counting(front and back of store).
10.Measure and adjust.
The ‘George Effect’
When asked to put a finger on a single reason forthe success of the work between Tesco and Gillette,one word came to mind, ‘George.’ GyorgyRuszkovszky is Product Availability Manager forGillette Hungary. Amongst the many able peoplethat worked on this project, George’s input to theteam provides a lesson to anyone embarking on asimilar project. The reason that every project teamneeds someone like George reflects the simple truththat projects never go exactly to plan. Hence theneed for a ‘George’, who ensures the following:
• Focus on the delivery of objectives.
• Access to local knowledge, i.e. the right peopleto turn to for help.
• Persistence in the face of apathy.
Whilst his input was generally discreet, looking backover the project it is clear to see George’s ‘fingerprints’ at all the key points.
Focus on Results
To return to where the project started, both Tescoand Gillette needed hard results and evidence toshow that the crisis was being brought under control.Results from an implementation of the 10-step set ofsolutions in three ‘Hot Stores’ were compelling.These results are shown below in Table 10.
Table 10. Effect of Project on Key Performance Criteria
The level of shrinkage went from being at crisis levelbefore the project to below 2% afterwards. Sales rosedramatically as a result of open merchandising and ofimproved on-shelf availability as inventory recordsbecame accurate. Above all, there was a dramaticimprovement in the profitability to Tesco of retailingGillette product. A true WIN • WIN outcome to theproject.
In addition to the hard benefits of the project,additional but unquantified benefits were achieved.For both companies, their supply chain was broughtunder control and stock handling proceduresbecame more transparent. The success of themethods used to handle Mach 3 at Tesco led tothese methods being transferred to other HotProducts, in particular cigarettes.
Roll Out
Having achieved notable success in three stores,Tesco and Gillette invested in a programme to rollout the ten-steps across Hungary. To date, all ofTesco’s Hungarian 26 stores have received trainingon the solutions tested in the pilot stores as well asfollow up visits to monitor progress. These visitshave found 20 of the stores (80%) are following the10 step procedures. Difficulties have been reportedin achieving 100% compliance for a number ofreasons. Ironically, one significant factor is that the
Criteria Effect of Project
Shrinkage Level 74% reduction
Sales 288% increase
Shrinkage book 2003 Final**** 8/5/03 4:29 pm Page 55

S H R I N K A G E R E D U C T I O N C A S E S T U D I E S
56
success achieved by implementing the solutionsmeans that management attention diverts on tohigher priority issues. The challenge is therefore tomaintain over time the procedures that ensureproduct remains availabile and losses continue tobe prevented.
Shrinkage book 2003 Final**** 8/5/03 4:29 pm Page 56
S H R I N K A G E R E D U C T I O N C A S E S T U D I E S
57
Lessons for the ECR Community
For Wickes, GET and Lloyd Fraser their ECR projectproved effective in reducing shrinkage. In additionto this key result, each company found additional,spin-off benefits from their investigation, whichthey attributed to having followed the Road Map.For example Lloyd Fraser found that GET disposesof the same type of cardboard boxes that it buys.Now the two companies exchange these boxes, ina mutually beneficial arrangement. GET alsobenefited by benchmarking Lloyd Fraser, acquiringnew ideas for its warehousing operations. Bycollaborating on this project all three companieswere able to achieve a range of benefits. Clearly anexample of WIN • WIN • WIN.
This project was undertaken on a supply chain forhome improvement (DIY) products. By undertakingthis work in a new sector, the project serves as anexample of the ability of ECR to benefit companiesbeyond its traditional constituency in the FMCGand grocery sector. The project also reveals thebenefits of extending collaboration to include thethird-party logistics service provider (3PL) in an ECRproject, in addition to the usual combination ofretailer and supplier.
Introduction: ECR Breaks New Ground
The project work by Wickes, Lloyd Fraser and GETbroke new ground for the ECR community in twoimportant ways. Firstly, this project focussed on thehome improvement sector, a welcome addition toECR’s traditional constituency of FMCG groceryretailing. Secondly, this project extended the ECRprinciple of collaboration beyond the usual pairingof retailer (Wickes) and supplier (GET) to includethe third-party logistics service provider – 3PL(Lloyd Fraser).
98% of the products sold by Wickes are own-branded, which avoids the excesses of shrinkageassociated with strongly branded product linesusually found in the FMCG sector. This own-brandstrategy also offers a degree of protection against
product being stolen from Wickes and then soldthrough other retail outlets. The own-brandapproach also prevents non-Wickes products beingreturned to Wickes for refunds. However, inkeeping with other retailers, some productcategories carried by Wickes suffer above normallosses and within categories losses tend toconcentrate on a few Hot Products.
GET are a major supplier of electrical items toWickes, other home improvement retailers and thebuilding trade in general. Within their productrange, some items are small in size, high in valueand have a broad range of domestic andcommercial uses. The ability to dispose of theseproducts into the professional building trade makesthem targets of organised theft whilst theirusefulness in DIY projects means they are also atrisk from pilferage.
The third organisation in the project is Lloyd Fraser,who manage and operate the warehousing anddistribution services for Wickes. They areaccountable for ensuring the integrity of the supplychain and protecting assets from the pick-up fromGET through to delivery to Wickes stores. They arealso a key contributor of knowledge to the projectteam given their understanding of supply chainoperations and the associated interactions betweenretailer and supplier.
Shrinkage Crisis Shock – There Wasn’t One!
Unlike the majority of shrinkage reduction projectsbrought to the attention of the ECR ShrinkageGroup, the genesis of this project was not a crisis.Instead, Wickes had recognised and highlightedshrinkage as an opportunity for tighter cost control.More to the point, Wickes launched their projectwith stock loss levels below the target that mostretailers aspired to achieve.
Despite their already impressively low levels ofshrinkage, a steering group of directors from allthree companies agreed that reducing shrinkage stillfurther would bring financial benefits. This tri-
Wickes, Lloyd Fraser and GETUnited Kingdom
Shrinkage book 2003 Final**** 8/5/03 4:29 pm Page 57
S H R I N K A G E R E D U C T I O N C A S E S T U D I E S
58
company steering group set the brief for the projectand held regular meetings to review progress inachieving the project’s objectives. Responsibility fordelivering the objectives was devolved to a projectteam made up of a single, senior manager fromeach team. A good account of this team structureand the motivation of the three companies to investresource into the project is given in the video thataccompanies this case study (included in the CD).
With hindsight it is clear to see the benefits thatarose from this choice of project team membershipand the reporting structures with the projectsteering committee. By having a small core team,communication within the team was very effective.Staffing the team with senior managers put theirexperience and knowledge at the heart of the team,instead of at the periphery. These were also theright people to call on their informal network ofcontacts within their own companies who couldprovide specialist inputs when the need arose.
The role of the steering committee was to co-ordinate the project across the three companies ata supply chain level, monitor progress, release thenecessary resources so they were available to theproject team and to look to the project team toinform their thinking.
Hot Spots in Well-Run Supply Chain
Following the Road Map, the team meticulouslydocumented the physical flow of product throughthe supply chain as well as the paths thatinformation took. Measures were taken ofdiscrepancies in deliveries between sites and in theinventory counts within individual sites. These werecomplemented by assessments of the other keyperformance indicators such as put-away andpicking accuracy within warehouses.
The information gathered during the Mapping &Measurement step of the Road Map was indeedthorough. When the project team presented theirwork at the 2002 ECR Congress in Barcelona, a 4-metre long process map greeted delegates. Thisprocess map illustrated what the project teamachieved by their thorough research: a uniqueinsight into the structure and performance of theirsupply chain. The team themselves made thetongue-in-cheek remark, ‘It’s a wonder that wemanage to deliver anything.’
Systematically analysing the information gatheredrevealed a key finding:
Even within a well-run supply chain, there areHot Spots where products can be lost.
In keeping with the underlying philosophy of theRoad Map, these supply chain Hot Spots are theplaces where stock is lost through process failure,which in turn provides the opportunity for lossthrough theft and the possibility of fraud.
Investigation into the root causes of why Hot Spotsexisted led the project team to construct a list of 44recommendations. These recommendations can besummarised under four heading:
• Introduction of new product handling andinformation gathering procedures.
• Enhancements to IT systems.
• Re-brief existing best practice.
• Change existing priorities for investment and development.
In general these findings fall into two groups, newunderstandings and things that the companies alreadyknew. The new understanding occurred by followingthe ECR Road Map approach of taking a holistic viewacross the whole supply chain. This revealedsituations such as where each company thought theother was doing vital checks on deliveries, when infact none of them were. In some cases the processwas fine but the accompanying procedures were notbeing followed correctly. To ensure the supply chainwas robust, it was clear that both product flow andthe accompanying information flows needed to besynchronised.
In many cases the companies were already aware ofthe issues and had practices that were able tocontrol them. However a number of the issues wereviewed in isolation and best practice was not beingfollowed consistently. Taking a holistic viewhighlighted the need for best practice to beuniversally implemented and for high standards ofcontrol to be ubiquitous across the distribution andstore network. In order to achieve widespread bestpractice some existing investment plans wererescheduled.
Shrinkage book 2003 Final**** 8/5/03 4:29 pm Page 58
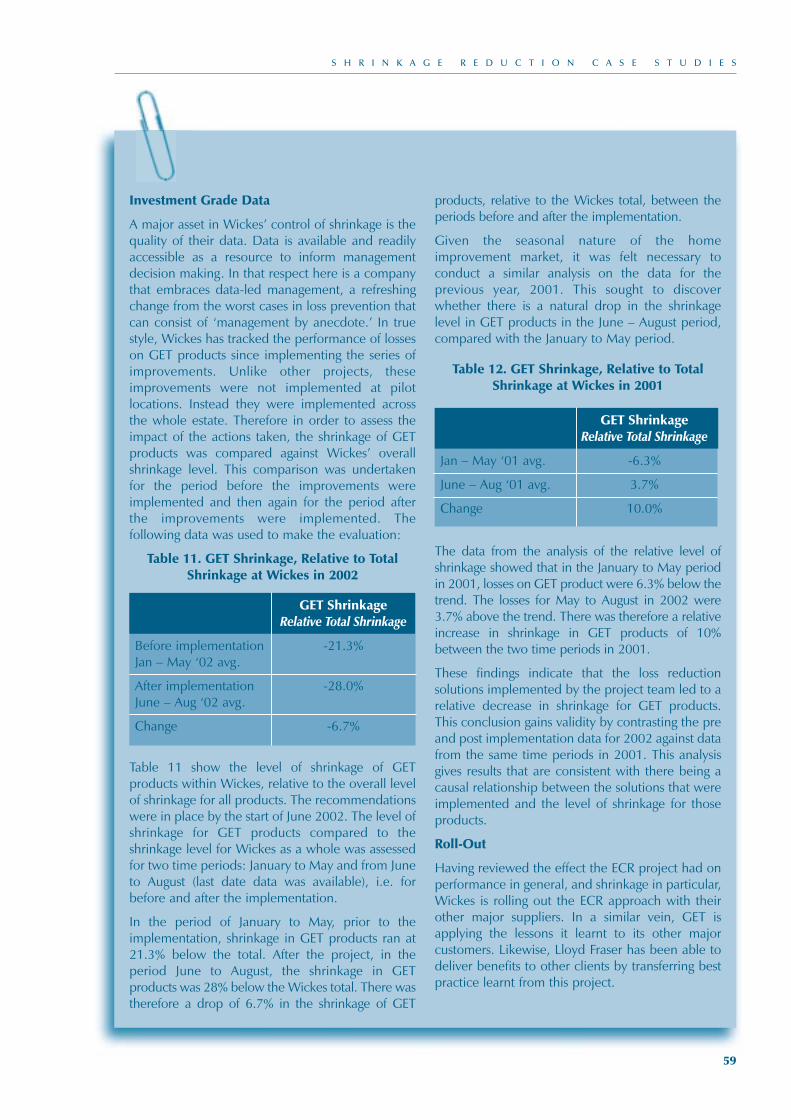
S H R I N K A G E R E D U C T I O N C A S E S T U D I E S
59
Investment Grade Data
A major asset in Wickes’ control of shrinkage is thequality of their data. Data is available and readilyaccessible as a resource to inform managementdecision making. In that respect here is a companythat embraces data-led management, a refreshingchange from the worst cases in loss prevention thatcan consist of ‘management by anecdote.’ In truestyle, Wickes has tracked the performance of losseson GET products since implementing the series ofimprovements. Unlike other projects, theseimprovements were not implemented at pilotlocations. Instead they were implemented acrossthe whole estate. Therefore in order to assess theimpact of the actions taken, the shrinkage of GETproducts was compared against Wickes’ overallshrinkage level. This comparison was undertakenfor the period before the improvements wereimplemented and then again for the period afterthe improvements were implemented. Thefollowing data was used to make the evaluation:
Table 11. GET Shrinkage, Relative to TotalShrinkage at Wickes in 2002
Table 11 show the level of shrinkage of GETproducts within Wickes, relative to the overall levelof shrinkage for all products. The recommendationswere in place by the start of June 2002. The level ofshrinkage for GET products compared to theshrinkage level for Wickes as a whole was assessedfor two time periods: January to May and from Juneto August (last date data was available), i.e. forbefore and after the implementation.
In the period of January to May, prior to theimplementation, shrinkage in GET products ran at21.3% below the total. After the project, in theperiod June to August, the shrinkage in GETproducts was 28% below the Wickes total. There wastherefore a drop of 6.7% in the shrinkage of GET
products, relative to the Wickes total, between theperiods before and after the implementation.
Given the seasonal nature of the homeimprovement market, it was felt necessary toconduct a similar analysis on the data for theprevious year, 2001. This sought to discoverwhether there is a natural drop in the shrinkagelevel in GET products in the June – August period,compared with the January to May period.
Table 12. GET Shrinkage, Relative to TotalShrinkage at Wickes in 2001
The data from the analysis of the relative level ofshrinkage showed that in the January to May periodin 2001, losses on GET product were 6.3% below thetrend. The losses for May to August in 2002 were3.7% above the trend. There was therefore a relativeincrease in shrinkage in GET products of 10%between the two time periods in 2001.
These findings indicate that the loss reductionsolutions implemented by the project team led to arelative decrease in shrinkage for GET products.This conclusion gains validity by contrasting the preand post implementation data for 2002 against datafrom the same time periods in 2001. This analysisgives results that are consistent with there being acausal relationship between the solutions that wereimplemented and the level of shrinkage for thoseproducts.
Roll-Out
Having reviewed the effect the ECR project had onperformance in general, and shrinkage in particular,Wickes is rolling out the ECR approach with theirother major suppliers. In a similar vein, GET isapplying the lessons it learnt to its other majorcustomers. Likewise, Lloyd Fraser has been able todeliver benefits to other clients by transferring bestpractice learnt from this project.
GET ShrinkageRelative Total Shrinkage
Before implementation -21.3%Jan – May ‘02 avg.
After implementation -28.0%June – Aug ‘02 avg.
Change -6.7%
GET ShrinkageRelative Total Shrinkage
Jan – May ‘01 avg. -6.3%
June – Aug ‘01 avg. 3.7%
Change 10.0%
Shrinkage book 2003 Final**** 8/5/03 4:29 pm Page 59
S H R I N K A G E R E D U C T I O N C A S E S T U D I E S
60
Lessons for the ECR Community
Although it was not possible to measure the effectof their efforts in terms of changes in stock loss andsales both Coop Italia and P&G point to a numberof benefits from conducting their ECR pilot project.Undoubtedly the project team benefitedconsiderably from containing a broad range ofpeople with experience from across the supplychain. Using this level of people was a majorcommitment by Coop and P&G but a commitmentthat proved to be worthwhile.
A finding that should be noted by others in the ECRcommunity relates to the applicability of EAStagging as a method of loss prevention/reduction inthis project. Whist Coop began the project with thepreconception that EAS6 tagging was the answer,their investigation of the supply chain revealed thatthe major causes of shrinkage were not off-shelftheft. Instead the major problem was found to bepoor process control in the supply chain. EAS wasshown to be only one of many solutions to aproblem that these companies faced in only aminor way.
Only through their holistic approach to understandingshrinkage was the project team able to gather theinformation and undertake the analysis necessary toidentify the sources of stock loss. Having done this,efforts are being brought to bear on the supply chainHot Spots and appropriate solutions developed. Ingeneral these solutions involved bringing the supplychain under control through process and proceduralimprovements.
Introduction: Cultural Diversity
The Italian grocery sector is a reflection of Italyitself: diverse and sophisticated. Coop Italia is thebiggest retailer in Italy. The Coop culture devolvescontrol of the business to autonomous businessunits. The head office role is therefore not one ofcommand and control. Instead, the head office co-ordinates areas of mutual interest on behalf of its
members, for example to leverage economies ofscale in purchasing and to promote and support theachievement of standards.
P&G is one of a handful of FMCG/CPG7 suppliersthat is truly multinational. They possess the capabilityto supply market-leading brands throughout theworld with a ubiquitously, high level of service. Thecompany’s corporate structure reflects the need tolive up to these values throughout their value chain,throughout the world.
Willingness to Use the Road Map
Coop Italia and P&G have a tradition of co-operation on a range of business initiatives andpromotional campaigns. The objective in workingtogether on a shrinkage project was set by Coop toresolve a stubborn problem of shrinkage in P&G’sInfasil product line. At the outset of the projectthere was a perception at Coop that the problemwould be solved through the use of ElectronicArticle Surveillance (EAS) technology. Despite thisthe team avoided jumping to conclusions byembracing the ECR shrinkage reduction Road Map,using it as a structured approach to direct theirproblem solving efforts.
The challenge facing the Coop/P&G team was theneed to conclude their project with compellingrecommendations. The Coop culture of devolvingdecision-making means that individual storemanagers have a major influence over theimplementation of recommendations made by theproject team. The systematic, holistic approach ofthe Road Map was therefore vital in being able tocreate recommendations that can be justified tothese decision-makers. Likewise, the project teamneeded to be made up of people with the respectand trust of their peers. For this reason, the projectteam included people from across the P&G andCoop operations. This broad team contained peoplewith experience and expertise in the areas of supplychain, IT systems, security and store operations.
Coop Italia and Procter & GambleItaly
6 EAS – Electronic Article Surveillance – is the term used for a range of technologies and methods where tags are attached to products. These tags are intended to set offalarms at store exits unless they are disabled when the goods are purchased.
7 FMCG/CPG – Fast Moving Consumer Goods/Consumer Packaged Goods.
Shrinkage book 2003 Final**** 8/5/03 4:29 pm Page 60
S H R I N K A G E R E D U C T I O N C A S E S T U D I E S
61
Data-Led Decision Making
The investigation involved a holistic review of thesupply chain. As a result of this investigation, theteam identified 143 steps in the process from theP&G distribution centre through to the shelves ofCoop stores. Undertaking a Failure Modes andEffects Analysis of the process, 40 steps (almost 30%of the total) were identified as containing risks. Bygoing through the process step by step, the teamidentified numerous weaknesses that could lead toshrinkage through process failure. The significance ofthis finding was not lost on the project team. As theteam members themselves said,
‘To be honest, if we had more timewe could have been even more
detailed in our investigation.However, even with the limited time
we had we are sure that all thepeople that contributed to theproject and that manage the
operations are now more consciousof the consequences that poor
process standards and poormanagement have on losses along
the supply chain.’
Tackling Shrinkage Through Process Control
The challenge facing the Coop/P&G team was tomake an effective impact on the shrinkage problem.Having gained an understanding of the risks in thesupply chain and analysed the root causes of theserisks the team used a series of criteria to guide them.These guiding criteria were:
• Focus on biggest problems.
• Develop solutions requiring Coop – P&Gcollaboration.
• Look for process and procedure simplification.
• Focus on solutions that are quick to implement.
The biggest problems in the supply chain were asmall number of Hot Spots. In general, the HotSpots were points in the supply chain whereaccountability for the products changed hands andalso where process control was poor. The teamchose to deal with issues that needed collaborationbetween the companies. Issues that were entirelywithin the control of one company or the otherwere noted but left to internal improvement teamsto respond to.
Having focussed their attention on the supply chainHot Spots, the project team looked for solutionsbased around process and procedural simplification.The rationale was that a simple process is easier tocontrol and more productive. Failure in a simpleprocess is easier to detect, which make it easier torespond to and bring back within control. Simplicityis also a benefit to those people working in theprocess, so they are more likely to welcome andembrace the change. Finally, simplification is likelyto require actions that are quick to implement,leading to rapid improvement.
The team identified a range of solutions, withpriority given to the following four:
• Change Order Picking Procedures in P&G.
• Introduction of Sealing of trucks leaving P&GD.C.
• Change of Sealing Procedure of trucks in CoopD.C.
• Randomly checking seals on trucks leavingCoop D.C.
In addition to these solutions, the team identifiedareas where they needed to improve theirunderstanding. In particular the nature of in-storelosses lacked information. To help fill thisknowledge gap two experiments were launchedlooking into the effect of:
• A warning message label on Infasil Deo.
• EAS tags applied at P&G to Infasil Deo.
Project Evaluation
Key to shrinkage reduction is to measure the effectof solutions that are implemented. In the case of theCoop/P&G project it was not possible to gather
Shrinkage book 2003 Final**** 8/5/03 4:29 pm Page 61
S H R I N K A G E R E D U C T I O N C A S E S T U D I E S
62
reliable information on the effect on shrinkage atthe distribution centres or the stores involved in theproject. Confidence in the shrinkage data that wascollected is low and it was decided not to use thisas the basis on which to draw conclusions on theproject. In light of a lack of auditable results, it ispossible to look to other metrics on which to judgethe effectiveness of a project. These areas are listedbelow in Table 9.
As already mentioned, the auditable results werepoor so it was difficult to quantify the newperformance levels. However in terms of the othercriteria, namely through the introduction of robustprocedures, use of new tools and methods,
introduction of new process and reinforcing of ECRand company principles, the project deliverednotable results. This success is reflected in terms ofthe soft results that were identified, where it wasclear that the project resulted in:
• Relationship build up.
• Holistic operation understanding within eachcompany and across the supply chain.
• Potential future collaboration on other projects.
• These results indicate that the project should beconsidered as being a success.
Ares of Focus Types of changes to capture learning
1. Results Reliable results data not available
2. Procedures Identified Hot Spots in the supply chain deserving further attention
3. Tools/Methods Learnt how to use the Road Map and gain a holistic understanding of the supply chain
4. Process No significant change
5. Structure Same management structure
6. Principles Reinforced principles of collaboration between companies
8 See Clark and Wheelwright (1993) op. cit.
Table 9. Areas of Focus for Judging the Effectiveness of a Project8
Shrinkage book 2003 Final**** 8/5/03 4:29 pm Page 62