Si lattice parameter measurement bycentimeter X-ray interferometry
Luca Ferroglio1,2, Giovanni Mana2, and Enrico Massa1,∗1Politecnico di Torino, c.so Duca degli Abruzzi 24, 10129 Torino Italy
2INRIM – Istituto Nazionale di Ricerca Metrologica, str. delle cacce 91, 10135 Torino Italy∗Corresponding author: [email protected]
Abstract: A combined X-ray and optical interferometer capable ofcentimeter displacements has been made to measure the lattice parameterof Si crystals to within a 3× 10⁻⁹ relative uncertainty. This paper relatesthe results of test measurements carried out to assess the capabilities of theapparatus.
References and links1. P. Becker, P. de Bievre, K. Fujii, M. Glaeser, B. Inglis, H. Luebbig, and G. Mana, “Considerations on future
redefinitions of the kilogram, the mole and of other units,” Metrologia 44, 1-14 (2007).2. P. Becker, “Tracing the definition of the kilogram to the Avogadro constant using a silicon single crystal,”
Metrologia 40, 366-375 (2003).3. G. Basile, A. Bergamin, G. Cavagnero, G. Mana, E. Vittone, and G. Zosi, “A measurement of the silicon (220)
lattice spacing,” Phys. Rev. Lett. 72, 3133-3136 (1994).4. A. Bergamin, G. Cavagnero, L. Cordiali, G. Mana, and G. Zosi, “Scanning X-ray interferometry and the silicon
lattice parameter: towards 10−9 relative uncertainty?” Eur. Phys. J. B 9, 225-232 (1999).5. G. Cavagnero, H. Fujimoto, G. Mana, E. Massa, and K. Nakayama, “Measurement repetitions of the Si(220)
lattice spacing,” Metrologia 41, 56-64 (2004); ibid. at 445-447 (2204).6. P. Becker, G. Cavagnero, U. Kuetgens, G. Mana, and E. Massa, “Confirmation of the INRiM and PTB determi-
nations of the Si lattice parameter,” IEEE Trans. Instrum. Meas. 56, (230-234) (2007).7. U. Bonse, W. Graeff, and G. Materlik, “X-ray interferometry and lattice parameter investigation,” Rev Phys.
Appl. 11, 83-87 (1976).8. G. Basile, A. Bergamin, G. Cavagnero, G. Mana, and G. Zosi, “Progress at IMGC in the absolute determination
of the silicon d220 lattice spacing,” IEEE Trans. Instrum. Meas. 38, 210-216 (1989).9. P. Becker and G. Mana, “The lattice parameter of silicon: a survey,” Metrologia 31, 203-209 (1994).
10. A. Bergamin, G. Cavagnero, and G. Mana, “A displacement-angle interferometer with sub-atomic resolution,”Rev. Sci. Instrum. 64, 3076-3081 (1993).
11. A. Bergamin, G. Cavagnero, L. Cordiali, G. Mana, and G. Zosi, “Scanning X-Ray Interferometry Over a Mil-limeter Baseline,” IEEE Trans. Instru. Meas. 46, 576-579 (1997).
12. A. Bergamin, G. Cavagnero, G. Durando, G. Mana, and E. Massa, “A two-axis tip-tilt platform for x-ray inter-ferometry,” Meas. Sci. Technol. 14, 717723 (2003).
13. D. Windisch and P. Becker, “Silicon lattice parameter as an absolute scale of length for high precision measure-ment of fundamental constants,” Phys. Stat. Sol. A 118, 379-388 (1990).
14. H. Siegert and P. Becker, “Systematic uncertainties in the determination of the lattice spacing d(220) in silicon,”in Precision Measurement and Fundamental Constants II, B. N. Taylor and W. D. Phillips, eds. Natl. Bur. Stand.,Spec. Publ. 617, (U.S. GPO, Washington, 1984), pp. 321-324.
15. A. Bergamin, G. Cavagnero, L. Cordiali, and G. Mana, “A Fourier optics model of two-beam scanning laserinterferometers,” Eur. Phys. J. D 5, 433-440 (1999).
16. G. Mana and E. Vittone, “Scanning LLL X-ray interferometry II. Aberration analysis,” Z. Phys. B 102, 197-206(1997).
17. A. Bergamin, G. Cavagnero, and G. Mana, “Observation of Fresnel diffraction in a two-beam laser interferome-ter,” Phys. Rev. A 49, 2167-2172 (1994).
#98057 - $15.00 USD Received 1 Jul 2008; revised 1 Sep 2008; accepted 19 Sep 2008; published 8 Oct 2008
(C) 2008 OSA 13 October 2008 / Vol. 16, No. 21 / OPTICS EXPRESS 16877
1. Introduction
In the framework of an international cooperation to determine the Avogadro constant to anaccuracy allowing the kilogram definition to be based on the 12C mass [1, 2], the relative un-certainty of the (220) Si lattice-plane spacing measurement by combined X-ray and opticalinterferometry must be reduced to 3×10⁻⁹. With this in view, we developed a guide capable ofdisplacements up to 5 cm with guiding errors commensurate with the requirements of atomic-scale positioning and alignment of the interferometer crystals. This breakthrough extends bymore than an order of magnitude the operation range and the measurement capabilities of anypreceding X-ray interferometer. In order to test our apparatus, assess its performances, and linkthe measurement values to the previous ones [3, 4, 5, 6], we integrated in it our MO*4 referencecrystals and carried out a series of test measurements.
The operation of a combined X-ray and optical interferometer is described in [7, 8, 9]. Asis shown in Fig. 1, an X-ray interferometer consists of three flat and parallel crystals cut insuch a way that the (220) planes are orthogonal to the crystal surfaces. X rays from a conven-tional 17 keV Mo Kα source, with a (10×0.1) mm2 line focus, are split by the first crystal andare recombined, via two transmission mirrors, by the third, called the analyzer. When the ana-lyzer crystal is moved in a direction orthogonal to the (220) planes, a periodic variation of thetransmitted and diffracted X-ray intensities is observed, the period being the diffracting-planespacing. The analyzer crystal embeds front and rear mirrors, so that its displacement is meas-ured by optical interferometry; the necessary picometer resolution is achieved by polarizationencoding and phase modulation. According to the measurement equation
d220 = (m/n)λ/2, (1)
where n is the number of X-ray fringes of d 220 period observed in a crystal displacement span-ning m optical fringes of λ/2 period, large displacements ensure definite advantages, in termsof both sensitivity and accuracy assessment. The successful operation of a separate-crystal in-
Fig. 1. Left: the combined X-ray and optical interferometer. Right: the interferometer slide.On the top of the L shaped carriage is an active tripod, electronically controlled to compen-sate for sliding errors. The tripod supports the analyzer (XINT) and the reference electrodeof a capacitive transducer. The analyzer front-surface is the movable mirror of the opticalinterferometer.
#98057 - $15.00 USD Received 1 Jul 2008; revised 1 Sep 2008; accepted 19 Sep 2008; published 8 Oct 2008
(C) 2008 OSA 13 October 2008 / Vol. 16, No. 21 / OPTICS EXPRESS 16878
terferometer is a challenge: the fixed and movable crystals must be so faced to allow the atomsto recover their exact position in the initial single crystal and they must be kept aligned notwith-standing the analyzer displacement.
2. Experimental apparatus
The progress of X-ray and optical interferometry involved the continual development of morepowerful techniques for finer control over experimental conditions, thus making more numer-ous effects visible and reproducible. With respect to our 2004 apparatus [5, 6], the key develop-ment is an interferometer guide (see Fig. 1), where an L shaped carriage slides on a quasi-opticalrail. An active tripod with three piezoelectric legs rests on the carriage. Each leg expands ver-tically as well it shears in the two, x and y, transverse directions, thus allowing compensationof the sliding errors and electronic positioning of the X-ray interferometer over six degrees offreedom to atomic-scale accuracy. Crystal displacement, parasitic rotations, and transverse mo-tions are sensed via laser interferometry and by capacitive transducers. Feedback loops providepicometer positioning, nanoradian alignment, and nanometer straightness. After step-by-stepimprovements – mainly to address stiffness deficiencies, stick-and-slip motion, and creep whenthe carriage stopped – we achieved measurement capabilities with crystal displacements up to
-3
0
3
6
(d22
0 -
<d 22
0>)
/ am
10-8d220
x / mm
(d22
0 -
1920
1500
0 am
) am
5×10⁻⁹d220
546
548
550
0 5 10 15 20 25
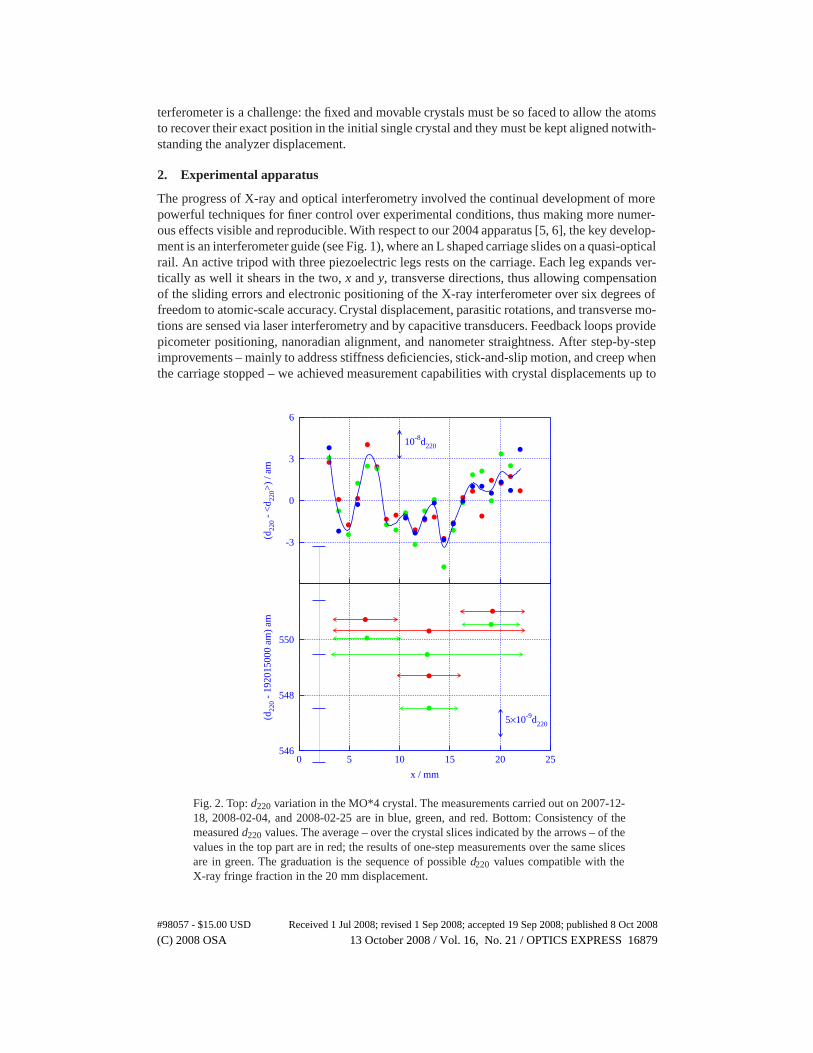
Fig. 2. Top: d220 variation in the MO*4 crystal. The measurements carried out on 2007-12-18, 2008-02-04, and 2008-02-25 are in blue, green, and red. Bottom: Consistency of themeasured d220 values. The average – over the crystal slices indicated by the arrows – of thevalues in the top part are in red; the results of one-step measurements over the same slicesare in green. The graduation is the sequence of possible d220 values compatible with theX-ray fringe fraction in the 20 mm displacement.
#98057 - $15.00 USD Received 1 Jul 2008; revised 1 Sep 2008; accepted 19 Sep 2008; published 8 Oct 2008
(C) 2008 OSA 13 October 2008 / Vol. 16, No. 21 / OPTICS EXPRESS 16879
x / mm
z / m
m
-505101520253035
-10
-5
0
5
10
15
20
25
30
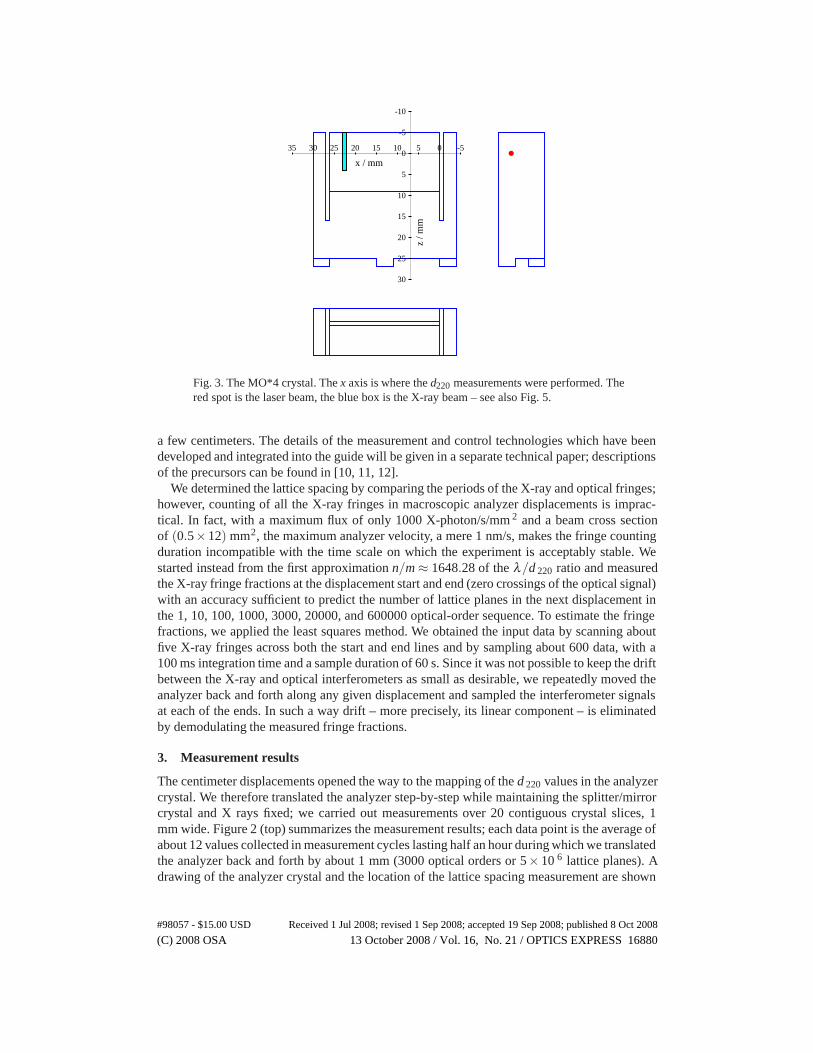
Fig. 3. The MO*4 crystal. The x axis is where the d220 measurements were performed. Thered spot is the laser beam, the blue box is the X-ray beam – see also Fig. 5.
a few centimeters. The details of the measurement and control technologies which have beendeveloped and integrated into the guide will be given in a separate technical paper; descriptionsof the precursors can be found in [10, 11, 12].
We determined the lattice spacing by comparing the periods of the X-ray and optical fringes;however, counting of all the X-ray fringes in macroscopic analyzer displacements is imprac-tical. In fact, with a maximum flux of only 1000 X-photon/s/mm 2 and a beam cross sectionof (0.5×12) mm2, the maximum analyzer velocity, a mere 1 nm/s, makes the fringe countingduration incompatible with the time scale on which the experiment is acceptably stable. Westarted instead from the first approximation n/m ≈ 1648.28 of the λ/d 220 ratio and measuredthe X-ray fringe fractions at the displacement start and end (zero crossings of the optical signal)with an accuracy sufficient to predict the number of lattice planes in the next displacement inthe 1, 10, 100, 1000, 3000, 20000, and 600000 optical-order sequence. To estimate the fringefractions, we applied the least squares method. We obtained the input data by scanning aboutfive X-ray fringes across both the start and end lines and by sampling about 600 data, with a100 ms integration time and a sample duration of 60 s. Since it was not possible to keep the driftbetween the X-ray and optical interferometers as small as desirable, we repeatedly moved theanalyzer back and forth along any given displacement and sampled the interferometer signalsat each of the ends. In such a way drift – more precisely, its linear component – is eliminatedby demodulating the measured fringe fractions.
3. Measurement results
The centimeter displacements opened the way to the mapping of the d 220 values in the analyzercrystal. We therefore translated the analyzer step-by-step while maintaining the splitter/mirrorcrystal and X rays fixed; we carried out measurements over 20 contiguous crystal slices, 1mm wide. Figure 2 (top) summarizes the measurement results; each data point is the average ofabout 12 values collected in measurement cycles lasting half an hour during which we translatedthe analyzer back and forth by about 1 mm (3000 optical orders or 5× 10 6 lattice planes). Adrawing of the analyzer crystal and the location of the lattice spacing measurement are shown
#98057 - $15.00 USD Received 1 Jul 2008; revised 1 Sep 2008; accepted 19 Sep 2008; published 8 Oct 2008
(C) 2008 OSA 13 October 2008 / Vol. 16, No. 21 / OPTICS EXPRESS 16880
(d220 - 192015000 am) am
20 × 1 mm
20 × 1 mm 3 × 7 mm
1 × 20 mm1 × 20 mm
20 × 1 mm
Dec 07
Jan 08
Feb 08
546 548 550 552 554
Fig. 4. Measurement repetitions of the mean (220) lattice spacing in the MO*4 crystal.
in Fig. 3. According to what reported in [13], the large d 220 variations – already, though not soclearly as now, observed – are ascribed to a non-uniform distribution of carbon, which highlycontaminates the MO*4 crystal [5]. As we did in past measurements, we obtained the latticespacing value by averaging the values shown in Fig. 2.
Subsequently, we fully exploited the centimeter displacement capabilities and carried outmeasurements by translating the analyzer by about 7 mm (20000 optical orders or 35× 10 6
lattice planes) and 20 mm (60000 optical orders or 1× 10 8 lattice planes). We measured themean d220 value over three adjacent crystal slices 7 mm wide and over one single 20 mmslice; results are given in Fig. 2 (bottom). In order to check the consistency of the measuredvalues, the figure compares these measurement results – indicated by green bullets – with thearithmetic means – indicated by red bullets – of the relevant values in the d 220 map. Since onlythe fractional part of the n X-ray fringes in the mλ/2 displacement can be observed, our actualresult is a sequence of possible d220 values, spaced by d220/n. The true value was selected onthe basis of prior knowledge, obtained via measurements carried on over shorter scans, wherethe value gap is larger than the prior uncertainty and where the d 220 non-uniqueness is nota problem. As shown in Fig. 2 (bottom), when measurements are performed over centimeterdisplacements, to select the true d220 value requires high resolution and repeatability.
We made six determinations of the mean lattice spacing in the MO*4 crystal, shown in Fig.4. Three are the averages of 21 values obtained over adjacent 3000 optical-order scans, one isthe average of 3 values obtained over adjacent 20000 optical-order scans, and two are the valuesobtained over 60000 optical-order scans. After we took into account of the corrections listed inTable I, the final lattice-spacing value in a vacuum and at 22.5 ◦C,
d220 = 192.0155508(12) pm, (2)
is the average of these values.
#98057 - $15.00 USD Received 1 Jul 2008; revised 1 Sep 2008; accepted 19 Sep 2008; published 8 Oct 2008
(C) 2008 OSA 13 October 2008 / Vol. 16, No. 21 / OPTICS EXPRESS 16881
Table 1. Crystal MO*4 – corrections and uncertainties of d220.
contribution correction/10−9 uncertainty/10−9
statistic 0.0 1.3
wavelength −3.0 1.5
laser beam diffraction 7.2 2.9
laser beam alignment 1.3 1.8
Abbe’s error 0.0 2.5
trajectory 0.0 1.5
temperature 1.0 3.0
aberrations 0.0 2.0
total 6.5 6.1
4. Uncertainty budget
The error analysis was performed in the same way as described in [4, 5, 14]; the error budgetis given in Table I. In order to compare our present 6×10⁻⁹d220 uncertainty with the targeted3×10−9d220 value, the following points deserve to be considered.
4.1. Statistics
The statistical contribution to the error budget is much larger than we expected from the photoncounting and optical interferometer noises. Actually, it reflects both the d 220 inhomogeneityand measurement repeatability. Inhomogeneities (real or apparent) are related to contaminationand local geometrical imperfections of the analyzer, which should be, ideally, a plane parallelcrystal slab; repeatability is related to still unexplained variations of the measured value.
4.2. Wavelength
The frequency of the laser source (an external-cavity single-mode diode laser) is stabilizedwith respect to the 127I2 (f) = 632 991 212.6(1) fm reference wavelength. The measurementis carried out in a vacuum to eliminate the air-refraction effect on the laser beam wavelength,about 3×10⁻⁹λ Pa−1. The relevant correction and uncertainty takes our present poor vacuum,into account; to reduce the residual pressure, about 1 Pa, by a factor of ten is not a problem.
4.3. Laser beam diffraction
We calculated the effect of diffraction on the basis of an on-line divergence measurement [15],but we set the calculation uncertainty cautiously to a larger value because of the anomalies,which will be related in §5. In order to achieve higher confidence in our capability to cope withdiffraction, we are planning detailed investigations into wavefront aberrations and measurementrepetitions with a different collimation of the laser beam.
4.4. Laser beam alignment
We directed the laser beam orthogonally to the analyzer front mirror by means of a tiltingmirror; subsequently we checked orthogonality by remotely tilting the laser beam – in boththe horizontal and vertical planes – and by repeating the d 220 measurements. Since the effect
#98057 - $15.00 USD Received 1 Jul 2008; revised 1 Sep 2008; accepted 19 Sep 2008; published 8 Oct 2008
(C) 2008 OSA 13 October 2008 / Vol. 16, No. 21 / OPTICS EXPRESS 16882
1.5 mm
1.5
mm
10 m
m
Fig. 5. Schemes of the quadrant (left) and multianode (right) detectors. The spacings be-tween the centers of the analyzer areas imaged by the quadrants and anodes are 1.5 mmand 1.4 mm – see also Fig. 3. Hypothetical optical and X-ray interference patterns – withenhanced misalignment fringes – are also rendered by scatter plots.
of misalignment is quadratic, we identified the orthogonal condition by fitting a parabola tothe data and by looking for the maximum measurement value [4]. Accordingly, the laser beamalignment can be further improved by increasing the measurement resolution.
4.5. Abbe’s errors
Centimeter displacements and electronic control made the Abbe’s errors, differential displace-ments sensed by the X-ray and optical interferometers and caused by parasitic rotations andoffsets between the centers of the interference patterns, almost harmless. These displacementsare given by z0Δρ and y0Δθ , where Δρ and Δθ are the pitch and yaw rotations and z0 and y0
are the relevant, vertical and horizontal, offsets.To cope with the Abbe’s error, the X-ray interference pattern was detected by means of a
multianode photomultiplier equipped with a vertical pile of eight NaI(Tl) scintillator crystals(see Fig. 5). In order to eliminate this error, the virtual anode having a zero offset was identified
-6
-4
-2
0
2
4
6
-100 -50 0 50
analyzer displacement / pm
anod
e lo
catio
n -
z / m
m
(d220 - 192015000 am) / am
546 548 550 552
Fig. 6. Left: Analyzer displacements in the anodes of the photomultiplier tube – at thecoordinates zi ≈ {−4.2,−2.8,−1.4,0,1.4,2.8,4.2,5.6} mm – when it is pitched (red) andyawed (green) about the center of the laser-beam spot. Right: d220 values measured in theanodes of the photomultiplier tube.
#98057 - $15.00 USD Received 1 Jul 2008; revised 1 Sep 2008; accepted 19 Sep 2008; published 8 Oct 2008
(C) 2008 OSA 13 October 2008 / Vol. 16, No. 21 / OPTICS EXPRESS 16883
by electronically pitching and yawing – but with a null displacement – the analyzer aboutthe center of the laser-beam spot by Δρ = Δθ = 15 nrad. Figure 6 (left) shows the analyzerdisplacements in the different anodes. The dots and lines can be thought representing a row ofatoms and the relevant lattice plane after the pitch (red) and yaw (green) rotations; the samebeing initially in a vertical position. For the pitch rotation, since any anode has a differentvertical location zi and, therefore, it senses a different displacement, the intersection of thebest-fit line with the null displacement axis indicates the location z0 of the virtual anode witha zero vertical offset. For the yaw rotation, since all the anodes have the same y 0 offset, a non-zero Abbe’s error appears as a parallel displacement of the lattice planes. The horizontal offsetwas nullified by translating the laser beam into the horizontal plane until no displacement wasobserved. The result is shown in Fig. 6 (left); from these data |y 0| ≤ 0.25 mm. The slightlydifferent displacements in different anodes – which, when yawing, are not expected – are dueto a small coupling, less than 10%, between the yaw and pitch rotations.
As Fig. 6 (right) shows, the d220 values measured in each anode were then interpolated toobtain the d220 value in z = z0, which is the location of the virtual anode with a zero offset.Significant reduction of the Abbe’s error requires understanding of the inconsistencies relatedin §5 between the optical and X-ray measurements of the analyzer rotations.
4.6. Trajectory
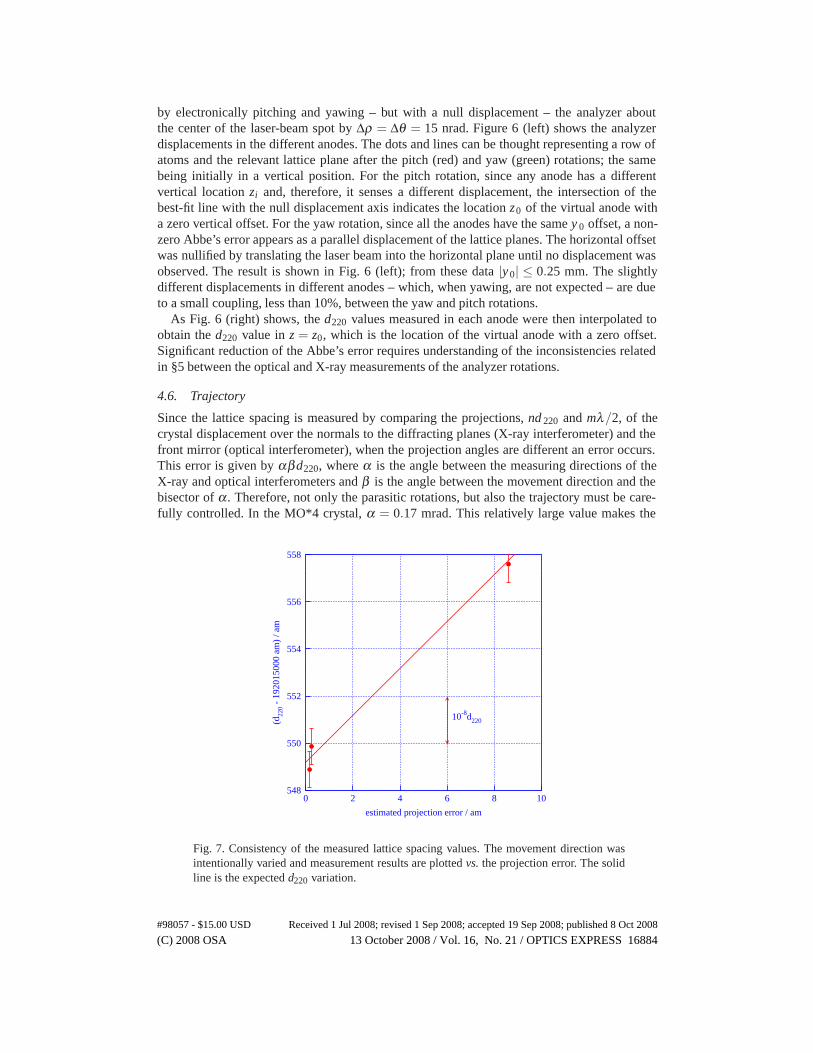
Since the lattice spacing is measured by comparing the projections, nd 220 and mλ/2, of thecrystal displacement over the normals to the diffracting planes (X-ray interferometer) and thefront mirror (optical interferometer), when the projection angles are different an error occurs.This error is given by αβd220, where α is the angle between the measuring directions of theX-ray and optical interferometers and β is the angle between the movement direction and thebisector of α . Therefore, not only the parasitic rotations, but also the trajectory must be care-fully controlled. In the MO*4 crystal, α = 0.17 mrad. This relatively large value makes the
estimated projection error / am
(d22
0 -
1920
1500
0 am
) / a
m
10-8d220
548
550
552
554
556
558
0 2 4 6 8 10
Fig. 7. Consistency of the measured lattice spacing values. The movement direction wasintentionally varied and measurement results are plotted vs. the projection error. The solidline is the expected d220 variation.
#98057 - $15.00 USD Received 1 Jul 2008; revised 1 Sep 2008; accepted 19 Sep 2008; published 8 Oct 2008
(C) 2008 OSA 13 October 2008 / Vol. 16, No. 21 / OPTICS EXPRESS 16884
interferometer quite sensitive to movement straightness and direction; we took advantage ofthis sensitivity to test our motion control capabilities.
In the first place, we measured the average lattice spacing in the same crystal slice, but withdifferent locations of the interferometer guide. Measurements were made possible by translat-ing the X-ray source and detectors to different positions; then we moved the analyzer to placethe same crystal slice again in front of X rays. No significant difference between the measuredvalues was observed, to within the present ±5× 10⁻⁹d220 sensitivity. In the second place, wevaried the movement direction and changed the bisection error from β = 6 μrad to β = 0.26mrad. The figure 7 compares the measured d220 values with the αβd220 error; the nearly per-fect agreement between the d220 variations and the expected error confirms our excellent motioncontrol.
In the recently machined prototype of the 28Si interferometer, we demonstrated a parallelismbetween the crystal front mirror and diffracting planes better than 10 μrad, to be compared withthe 170 μrad error in the MO*4 crystal; this good parallelism will further reduce the error by afactor of higher than ten.
4.7. Temperature
The volumetric expansion of Si is about 8× 10⁻⁹ mK−1. Consequently, in order to determinethe Avogadro constant to within the targeted 2× 10⁻⁸ relative uncertainty, the cell and mo-lar volumes – which are separately measured by the INRIM and the Physikalisch-TechnischeBundesanstalt (PTB) – must refer to the same temperature to within 0.5 mK. Our tempera-ture measurement capability was tested by circulation of a 20 ◦C electronic reference betweenthe PTB and INRIM. Results demonstrated that the temperature measurements are presentlyconsistent to within 1 mK.
4.8. Aberrations
Variations in the analyzer thickness, ΔTA, and analyzer to mirror distance (defocusing), ΔF ,cause additional phase shifts of the X-ray fringes, which are detected as variations of (220)plane spacing. With a 0.8 mm thickness of the analyzer and the use of the 17 keV radiation,sensitivities to defocusing and analyzer thickness are
Δd220
d220= 2×10⁻⁶ ΔF
mλ/2
andΔd220
d220= 10−6 ΔTA
mλ/2,
respectively [16]. For instance, with 1 mm measurement baseline, 1 μm error causes an appar-ent lattice spacing variation slightly larger than 10−9d220. Centimeter interferometry, togetherwith accurate manufacturing and dimensional characterization – e.g., by a coordinate measuringmachine – can relieve this problem. Additionally, the 28Si interferometer is so designed as toallow it to operate also in reverse; in this way, we can compare obverse and reverse measure-ment results and increase our confidence in the assessment of these errors.
4.9. C and O contamination
Since the purpose of the present investigation was to assess the performances of our apparatusand check the consistency of the measured d220 value with the previous ones, we are not cor-recting the result for carbon and oxygen contamination of the MO*4 crystal and, consequently,the relevant contribution to the error budget is not taken into account.
#98057 - $15.00 USD Received 1 Jul 2008; revised 1 Sep 2008; accepted 19 Sep 2008; published 8 Oct 2008
(C) 2008 OSA 13 October 2008 / Vol. 16, No. 21 / OPTICS EXPRESS 16885
5. Measurement anomalies
The centimeter scan capability allowed us to investigate anomalies already suggested by theuse of our previous apparatus.
The first anomaly is related to aberrations of the laser beam wavefront. The electronic controlof the analyzer parasitic-rotations relies on the displacement of four points, spaced by about 1.5mm, of the front mirror surface; these displacements are sensed with the aid of a quadrant de-tector (see Fig. 5). The displacements in the top-bottom and left-right quadrant pairs are madeidentical to within picometers by the electronic control of the analyzer attitude, but nothingimposes that these two – vertical and horizontal – displacement pairs must be identical. There-fore, the comparison between the d220 values in the vertical and horizontal quadrants deliversinformation about aberrations in the optical interferometer. If the interfering wavefronts areperfectly plane or spherical, no difference should be observed. On the contrary, results in Fig.8 show a modulated difference between the effective wavelength in different parts of the laserbeam, the origin of which is, at present, unknown.
The second anomaly is related to a discrepancy between X-ray and optical measurements ofthe analyzer pitch. In Fig. 6 (right), the slope of the best-fit line to the observed d 220 values,which is expected zero, delivers information about the congruity of the analyzer pitch and (220)plane tilts. In fact, the measured d220 value in the i-th analyzer slice – mλ/2 wide and centeredat {xi,zk}, where xi is the slide position and zk is the anode offset – is
d(xi,zk) = d0
[1+
zkΔρmλ/2
], (3)
where d0 is the actual d220 value, zkΔρ(xi) is the Abbe’s differential displacement betweenthe centers of the {xi,zk} slice and the laser beam spot, and Δρ(xi) is the analyzer (or lattice-plane) pitching. Therefore, Δρ(xi) can be obtained from the slope of the best-fit line to thed(xi,zk) values. The sum ρ(xn) = ∑n
i Δρ(xi) of each partial rotation, which is shown in Fig.
x / mm
(d22
0
VE
RT -
d22
0
HO
R)
/ am
10-8d220
-4
-2
0
2
4
0 5 10 15 20 25
Fig. 8. Difference between the d220 values in the vertical and horizontal pairs of the quad-rant detector; measurements carried out on 2007-12-18 and 2008-02-04 are in blue andgreen.
#98057 - $15.00 USD Received 1 Jul 2008; revised 1 Sep 2008; accepted 19 Sep 2008; published 8 Oct 2008
(C) 2008 OSA 13 October 2008 / Vol. 16, No. 21 / OPTICS EXPRESS 16886
-30
-10
10
pitc
h ro
tatio
n / n
rad
x / mm
pitc
h ro
tatio
n / n
rad
-10
0
10
0 5 10 15 20 25
Fig. 9. Top: Analyzer or (220) plane pitching – as sensed by the X-ray interferometer –when the analyzer pitch – as sensed by the optical interferometer – is kept to zero. Measure-ments carried out on 2008-02-04 and 2008-02-25 are in green and red. Bottom: Residualsfrom the best-fit line to the data.
9 (top), displays the intrinsic tilt of (220) planes – if we trust the optical measurement of theanalyzer pitch. On the contrary, if we assume that the analyzer lattice is perfect, the same sumdiscloses errors in the optical measurement. As yet, we have no hints about an unambiguouschoice between these two hypotheses. Clearly, the linear trend of the data in Fig. 9 (top) is notdue to lattice deformations; it is caused by non-orthogonal incidence of the laser beam on theanalyzer front mirror [17]. If the laser beam is imperfectly aligned, when the analyzer is movedover the mλ/2 distance, the interfering beams drift by γmλ , where γ is the deviation fromorthogonality. Owing to the wavefront curvature, this drift gives rise to an interference patternimitating the pattern originated by the analyzer pitch. In this case, we detect and compensatefor a non-existent pitch ρ = γmλ/(2R), where R≈ 50 m is the wavefront curvature-radius [17].In Fig. 9 (top), the worst slope is 15 nrad/cm, to which a possible alignment error of 50 μradwill correspond. The plane tilt after the trend has been removed, shown in the bottom part ofFig. 9, is a better candidate to display lattice deformation.
6. Conclusions
The test measurements of the lattice parameter of INRIM’s MO*4 reference crystal demonstratethat the new combined X-ray and optical interferometer, capable of centimeter displacements,was successfully put into operation. The results of measurement carried out over displacementsfrom less than 1 mm to more than 1 cm proved excellent consistency, better than 10 −8d220.
#98057 - $15.00 USD Received 1 Jul 2008; revised 1 Sep 2008; accepted 19 Sep 2008; published 8 Oct 2008
(C) 2008 OSA 13 October 2008 / Vol. 16, No. 21 / OPTICS EXPRESS 16887
(d220 - 192015000) am
year 10-8d220
0.1 mm scan [3]1 degree of freedom control
2 mm scan [4]3 degrees of freedom control
5 degrees of freedom control2 mm scan [5,6]
20 mm scan [this paper]6 degrees of freedom control
1990
1995
2000
2005
2010
545 550 555 560
Fig. 10. History of the measurements of the mean (220) lattice spacing in the MO*4 crystal.The labels record the increasing scan-length and control-capability; numbers in brackets arethe relevant references.
Figure 10 illustrates the history of our progress towards the 3×10⁻⁹d220 accuracy necessary toobtain a kilogram prototype made by a 1 kg 28Si crystal-sphere.
The new apparatus allows us to investigate finer points in the interferometer operation, forwhich we have no satisfactory explanations. The determination of the Avogadro constant willbe carried out with the aid of a highly enriched 28Si crystal; the design and manufacturing ofthe relevant X-ray interferometer are under way. In the near future we will integrate and testinto the experimental apparatus a prototype of the 28Si interferometer having an unusually longanalyzer, to exploit the large displacement capabilities of our apparatus.
Acknowledgments
This work received funds from the European Community’s Seventh Framework ProgrammeERA-NET Plus – grant 217257, from the Regione Piemonte – grant D64, and from the Com-pagnia di San Paolo.
#98057 - $15.00 USD Received 1 Jul 2008; revised 1 Sep 2008; accepted 19 Sep 2008; published 8 Oct 2008
(C) 2008 OSA 13 October 2008 / Vol. 16, No. 21 / OPTICS EXPRESS 16888