ETDP SiC High-speed MV Direct Drive vs. Si Low-speed MV Drive in Compressor Applications Fred Wang and Leon Tolbert University of Tennessee, Knoxville Oak Ridge National Laboratory HMW Drive Workshop II NIST, Gaithersburg, MD September 4, 2014
Transcript
ETDP
SiC High-speed MV Direct Drive vs. Si Low-speed MV Drive
in Compressor Applications Fred Wang and Leon Tolbert University of Tennessee, Knoxville
Oak Ridge National Laboratory
HMW Drive Workshop II NIST, Gaithersburg, MD
September 4, 2014
ETDP
Summary of Survey Results The latest HV SiC data available from commercial vendors were collected
Voltage ratings are in the range of 3.3 kV to 22.5 kV with current ratings below 50 A
The most popular device types are SiC MOSFET and JBS Schottky diodes
SiC devices exhibit significantly better conduction and switching characteristics
Si MV drive applications and technologies were summarized Pumps, fans, compressors dominate traditional applications
Renewables and transportations are emerging applications
LV IGBT based CHB and MV IGBT/IGCT based multi-level NPC are most popular inverter
topologies; multi-pulse diode rectifiers and PWM active rectifiers are widely used front-end
Benefits of HV SiC can be realized in four ways Direct substitution – improved efficiency and power density
Simplified topology – further loss reduction and increased power density
Enable high speed motor drive
Improve front-end rectifier
The high speed direct drive compressor with transformer-less front-end
rectifier is identified as a suitable “killer” application for HV SiC devices
2
ETDP
Outline
• Objective
• Technical Approach
• Comparison Transformer and front end rectifier Inverter Motor, gearbox, and compressor system
• Summary
• Research Needs
3
ETDP
Technical Approach
• Select a benchmark system • Compare Si based low-speed MV drive solution to a
SiC based MV direct drive solution Divide the comparison into three parts:
1. transformer and front end rectifier 2. inverter 3. motor and gearbox (compressor)
Select the best available solution for each part for both Si and SiC technologies
Perform comparison through design as well as using available product and prototype information
Focus on efficiency, power density, and footprint • Determine the key design parameters for SiC MV drive
4
ETDP
Benchmark System
Power Grid Voltage Motor Voltage Direct Drive Frequency Motor Power Factor
1 MVA 13.8 kV, 60 Hz 4160 V 300 Hz 0.9
System Specifications and Assumptions
Typical Si Based Low-speed MV Drive Configuration
• Based on survey and analysis, the most popular Si MV drive solution is 3-level NPC inverter with multi-pulse front end diode rectifier
• Regeneration not required
5
ETDP
SiC MV Direct Drive System
SiC Based MV Direct Drive Configuration
• The transformer and front-end rectifier are replaced by a SiC based, solid-state transformer (SST) type front-end rectifier
• The inverter is replaced with the simple two-level VSI
• With the high speed motor, the gearbox can be eliminated
• No regeneration
6
ETDP
Comparison Group Selection
Group Topology Switching Device Junction temp.
Rated frequency
Switching frequency
1 3L-NPC 6.5 kV/ 250 A Si IGBT 125 oC 60 Hz 1 kHz
2A 2L-VSI 15 kV/ 10A SiC MOSFETs (Cree) * 30 in parallel
125 oC 300 Hz 10 kHz
2B 2L-VSI 15 kV/ 10A SiC MOSFETs (Cree) * 30 in parallel
200 oC 300 Hz 10 kHz
Inverter
Group Configuration 1 60 Hz transformer + multi-pulse diode rectifier 2 Solid-state-transformer (SST) type (AC/DC + high frequency DC/DC)
Transformer and Front-end Rectifier
Motor and Gearbox (compressor also included as in the commercial products) Group Configuration
1 Low speed motor + gear box 2 High speed motor
7
ETDP
Outline
• Objective
• Technical Approach
• Comparison Transformer and front end rectifier Inverter Motor, gearbox, and compressor system
• Summary
• Research Needs Discussion
8
ETDP
Front-End Comparison: Efficiency
Group Topology Efficiency 1 60 Hz Transformer + 18-pulse diode rectifier 98% 2 SST type (GE SSPS Phase II) 98%
Front-end Efficiency Comparison
• Efficiency of the GE Phase II SSPS is expected to be 98%
• Efficiency of the conventional transformer plus the multi-pulse rectifier is also assumed to be 98%. This assumption is based on the information from the HPE project for a conventional transformer. The diode-rectifier is highly efficient. The multi-pulse rectifier will require phase-shifted multi-winding transformers, which may yield a penalty in efficiency and size
Note GE SSPS II with switching frequency of 40 kHz. • The comparison between SSPS I with switching
frequency of 20 kHz shows similar efficiency and power density
• Unidirectional power
9
ETDP
Front-End Comparison: Size & Weight Dimension and Size Comparison (note: height scaled to 72”)
Group Power Topology Dimension & size Dimension & size (Scaled for 1 MW)
Power Density
1 A 3 MW Transformer + Rectifier
168”W x 60”Dx81”H (13.38 m3)
102”W x 37”D x 72”H (4.47 m3)
0.22 kW/dm3 (ratio 1.0)
1 B 2.2 MW
18-pulse diode rectifier
63”W x 39”D x 87”H (3.56 m3)
46”W x 29”D x 72”H (1.59 m3)
0.63 kW/dm3
2 3 MW SST type (GE HPE phase II)
60”W x 50”D x 72”H (3.54 m3)
35”W x 29”D x 72”H (1.2 m3)
0.83 kW/dm3 (ratio 3.78)
Group Power Topology Weight Weight (Scaled for 1 MW)
Note the linear scaling of transformer with power is an approximation 10
ETDP
Outline
• Objective
• Technical Approach
• Comparison Transformer and front end rectifier Inverter Motor, gearbox, and compressor system
• Summary
• Research Needs Discussion
11
ETDP
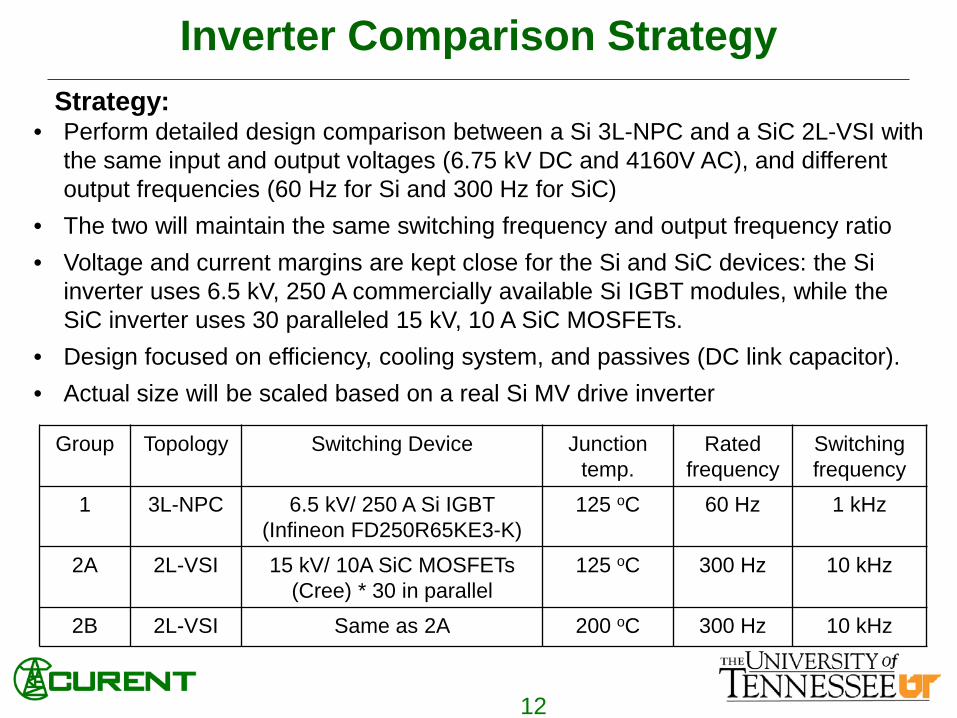
Inverter Comparison Strategy Strategy:
• Perform detailed design comparison between a Si 3L-NPC and a SiC 2L-VSI with the same input and output voltages (6.75 kV DC and 4160V AC), and different output frequencies (60 Hz for Si and 300 Hz for SiC)
• The two will maintain the same switching frequency and output frequency ratio • Voltage and current margins are kept close for the Si and SiC devices: the Si
inverter uses 6.5 kV, 250 A commercially available Si IGBT modules, while the SiC inverter uses 30 paralleled 15 kV, 10 A SiC MOSFETs.
• Design focused on efficiency, cooling system, and passives (DC link capacitor). • Actual size will be scaled based on a real Si MV drive inverter
Group Topology Switching Device Junction temp.
Rated frequency
Switching frequency
1 3L-NPC 6.5 kV/ 250 A Si IGBT (Infineon FD250R65KE3-K)
125 oC 60 Hz 1 kHz
2A 2L-VSI 15 kV/ 10A SiC MOSFETs (Cree) * 30 in parallel
125 oC 300 Hz 10 kHz
2B 2L-VSI Same as 2A 200 oC 300 Hz 10 kHz
12
ETDP
13
Groups for Efficiency Comparison
1st group MV Si based three-level neutral point clamped inverter 2nd group MV SiC based three-level neutral point clamped inverter 3rd group Low voltage Si based cascaded H-bridge 4th group Low voltage SiC based cascaded H-bridge 5th group MV SiC based two-level voltage source inverter
ETDP
14
Power Loss Comparison
ETDP
Loss & Efficiency Comparison
Group Operating Temperature Efficiency Si based 3L-NPC 125 oC 99.27 % SiC based 2L-VSI 125 oC 99.62% SiC based 2L-VSI 200 oC 99.53%
Loss Comparison
Efficiency Comparison
15
ETDP
Cooling System Comparison
Group Ambient Temperature
Junction Temperature
Required Rcase-ambient
Heatsink Size Ratio
Si 3L-NPC 50 oC 125 oC 0.0068 1.00
SiC 2L-VSI 50 oC 125 oC 0.0184 0.37
SiC 2L-VSI 50 oC 200 oC 0.0306 0.22
• Thermal impedance data for 6.5 kV, 250 A Si IGBTs are available, but not for 15 kV, 300 A SiC MOSFETs.
• Low voltage (1.2 kV) SiC MOSFET data has been scaled based on the relationship between HV and LV Si IGBT to infer the HV SiC MOSFET data.
• The case-to-ambient thermal resistance ratio is then obtained, as listed in the table below, and was used to calculate the cooling system size and power density.
16
ETDP
DC Bus Capacitor Comparison A number of factors affect the DC link capacitance selection. The extreme case would be that in one switching cycle, the rectifier input power drops to zero while the inverter keeps the maximum output power.
𝐶 =𝑃𝑚𝑚𝑚
(𝑉𝑑𝑑∆𝑉 ± 12∆𝑉
2)𝑓𝑠
where 𝑃𝑚𝑚𝑚 = 1 𝑀𝑀,𝑉𝑑𝑑 6.75 𝑘𝑉.Δ𝑉 for the commecial drive is ~5%, C can then be obtained
Group Switching frequency fs
Required capacitance (Δ𝑉 = 337 𝑉)
Ratio Note
Si 3L-NPC 1.0 kHz 439 µF 1.00 For SiC case, the front-end also has capacitors, which can further reduce the capacitance need
SiC 2L-VSI 10.0 kHz 43.9 µF 0.1
SiC 2L-VSI 10.0 kHz 43.9 µF 0.1
17
ETDP
Size and Footprint Comparison • For the inverter, the size and footprint are primarily determined by the DC bus
capacitor, cooling system, and power modules.
Groups Cooling system (50%)
DC capacitor (20%)
Power module (30%)
Footprint comparison
Power density comparison
Si 3L-NPC 1.00 1.00 1.00 1.00 1.00
SiC 2L-VSI 0.37 0.10 1.00 0.51 1.98
SiC 2L-VSI 0.22 0.10 1.00 0.43 2.33
Type 3L-NPC
Power rating 2.2 MW
Inverter Dimension and Volume
63’’ W x 39’’ D x 87’’ H (3.56 m3)
Scaled for 1 MW system 46”W x 29”D x 72”H (1.59 m3)
Inverter Size and Power Density Comparison (Ratio)
Size breakdown assumption
18
ETDP
Outline
• Objective
• Technical Approach
• Comparison Transformer and front end rectifier Inverter Motor, gearbox, and compressor system
• Summary
• Research Needs Discussion
19
ETDP
Motor and Gearbox Comparison Strategy
Motor and Gearbox Comparison Groups
Group Configuration 1 Low speed motor + gear box driven compressor 2 High speed motor direct-coupled compressor
Three High Speed Compressor System Examples
Company Model GE ICL
MAN Hofim Siemens STC-ECO
Strategy: • Si based high speed compressor direct drives are commercially available. The
comparison presented is between the high speed motor based compressor system and the low speed motor plus gearbox based compressor system.
Only the first two systems were analyzed due to data availability
20
ETDP
GE ICL Footprint Comparison A rough calculation shows that the footprint of the high-speed direct-coupled system is only 41% of the traditional low-speed system with gearbox.
Low-speed compressor with gearbox
High-speed direct-coupled compressor
21
ETDP HOFIM Footprint & Weight Comparison
Footprint: The HOFIM compressor system occupies only 42% of the conventional low-speed system. Weight: HOFIM is approximately 2/3 the total weight of a conventional compressor system.
SiC 2L-VSI (Tj = 125 oC) 3.84 kW 99.62% 23”W x 29”D x 72”H
(0.80 m3) 1.25 kW/dm3
SiC 2L-VSI (Tj = 200 oC) 4.73 kW 99.53% 20”W x 29”D x 72”H
(0.68 m3) 1.47 kW/dm3
Load
Low speed motor +
gearbox + compressor
- - 156”W x 45”D x 168”H (19.33 m3)
0.05 kW/dm3 0.13 MW/ton
High speed motor +
compressor - - 66”W x 45”D x 108”H
(5.25 m3) 0.19 kW/dm3
0.2 MW/ton
24
ETDP
Summary: Combined Comparison (1)
Group Configuration Loss Efficiency Size & Power Density
Footprint & Density
1 Si low speed MV
drive with transformer
27 kW 97.3 % 6.06 m3 0.17 kW/dm3
3.3 m2 303 kW/m2
2A SiC high speed MV
direct drive with SST (Tj = 125 oC)
24 kW 97.6% 2.0 m3
0.5 kW/dm3 1.09 m2
917 kW/m2
2B SiC high speed MV
direct drive with SST (Tj = 200 oC)
25 kW 97.4% 1.88 m3
0.53 kW/dm3 1.03 m2
971 kW/m2
Front-end Rectifier and Inverter
25
ETDP
Summary: Combined Comparison (2)
Group Configuration Size & Power Density
Footprint & Density
1 Si low speed MV drive with transformer,
low speed motor + gearbox + compressor
25.39 m3 39.4 W/dm3
7.83 m2 128 kW/m2
2A SiC high speed MV direct drive with
SST, high speed motor + compressor (Tj = 125 oC)
7.25 m3
137.9 W/dm3 3.0 m2
333 kW/m2
2B SiC high speed MV direct drive with
SST, high speed motor + compressor (Tj = 200 oC)
7.13 m3
140.2 W/dm3 2.94 m2
340 kW/m2
MV Drive and Motor/Compressor System
26
ETDP
Summary • A design comparison has been carried out for a 1 MW compressor system
contrasting: 1. A Si based MV drive with a line-frequency transformer, low speed (60
Hz) motor and gearbox 2. A SiC based MV direct drive with solid-state-transformer and high
speed (300 Hz) motor • SiC MV drive has slightly better efficiency (~97.5%), much higher power
density (500 W/l vs. 150 W/l), and a much smaller footprint (1.0 m2 vs. 3.3 m2).
• Considering the motor and compressor, the impact of a SiC direct drive on power density can maintain a similar ratio (140 W/l vs. 40 W/l). The footprint ratio is also similar (3.0 m2 vs. 7.8 m2)
• The key performance metrics for SiC MV drives: 97.5% efficiency, 500 W/l power density, and 1.0 m2/MW footprint
• The key design parameters for SiC MV drives can include: output frequency > 300 Hz, input and output current harmonics < 5% for typical grid and motor load conditions, SST switching frequency > 20 kHz, SiC device rating > 10 kV (?).
27
ETDP
Outline
• Objective
• Technical Approach
• Comparison Transformer and front end rectifier Inverter Motor, gearbox, and compressor system
• Summary
• Research Needs
28
ETDP
Potential Research Needs • High voltage SiC devices and modules – required and/or desired
device characteristics and performance; low parasitics for high switching transients.
• Drive architecture and converter circuit topologies – to take full advantage of high voltage SiC device properties; simple, compact, low loss, and reliable.
• Converter packaging and layout – to meet the voltage blocking requirements while keeping the parasitics low
• Passive components and filters – Select and design magnetics, capacitors and filters to match the need of SiC devices; additional filter needs to deal with high dv/dt, di/dt, and common mode noises.
• Gate drives – fast transients and high voltages will pose new challenges regarding cross-talk, interference, and isolated power supplies. Different short-circuit characteristics of SiC in comparison with Si may require new protection schemes.
29
ETDP
Potential Research Needs • Thermal management – SiC has higher temperature capability
than Si. Higher temperature operation combined with higher current densities and increased integration may require innovative cooling technologies.
• Reliability – need to assess the system level impact of SiC.
• Design methodology – New types of drives, combined with the fast switching of SiC, may require more integrated design approaches.
• Motors: High voltage SiC based medium voltage drives can operate at higher frequencies and fast dv/dt. Certain types of motors may be better suited for these drives than others. Motor insulation shat voltages, and bearings may be issues.
• To accommodate retrofit applications, need to make the drives motor friendly.
30
ETDP
Acknowledgements
31
Advice and help from Laura Marlino of ORNL, Bill Giewont of Vacon, Jeffrey Casady of Cree, Ravi Raju Rajib Datta of GE, Ranbir Singh of GeneSiC, Paul Huang of Hi-bar Blowers, Terry Ericsen of Erricsen Innovations, and Xinlin Du CURENT faculty, students, and other contributors include: Daniel Costinett, Fei Yang, Zheyu Zhang, Xiaonan Lu, Haifeng Lu Materials from many commercial websites, presentations, and publications are referenced This work made use of shared facilities supported by the ERC Program of the National Science Foundation and DOE under NSF Award Number EEC-1041877 and the CURENT Industry Partnership Program