Page 1
I
MICROWAVE ASSISTED EXTRACTION OPTIMISATION OF INDUSTRIALLY
APPLICABLE LIPIDS FROM GRAIN AMARANTH
Siddhartha P Joshi Department of Bioresource Engineering
McGill University, Montréal
Québec, Canada
August, 2013
A thesis submitted to Faculty of Graduate and Postdoctoral Studies, McGill University in partial
fulfillment of the requirements of the degree of Master of Science
© Siddhartha P Joshi 2013
Page 2
II
DEDICATION
This thesis is dedicated to my beloved grandparents, Dr. Sita Ram Joshi & Mrs.
Madhuri Joshi; my lovely parents, Mr. Pradeep Kumar Joshi & Mrs. Sangeeta
Joshi; my dear sibling, Miss. Saumya P Joshi and to all my friends who endured
me with great fortitude
Page 3
III
MICROWAVE ASSISTED EXTRACTION OPTIMISATION OF INDUSTRIALLY
APPLICABLE LIPIDS FROM GRAIN AMARANTH
SIDDHARTHA P JOSHI MASTER OF SCIENCE BIORESOURCE ENGINEERING
ABSTRACT
Recently, the scientific community has recognized the potential application of lipophilic
compounds of grain amaranth as an active ingredient in nutraceutical supplements and
cosmeceutical formulations specifically squalene, sterols, tocols and polyphenols. This research
study has actualised the optimisation of a novel methodology for eluting bioactive lipophilic
compounds from grain amaranth by employing microwave assisted extraction (MAE). The study
developed an approach to exploit the lipids of this unconventional pseudo-cereal for industrial
applications.
Experimentation of this study was carried out in three phases. In the first phase, pre-
optimisation studies were conducted to identify the optimum parameters such as sample particle
size, extraction solvent and microwave input power, which determined the experimental domain
required to optimise the extraction of oil and its constituents, squalene & stigmasterol. For this
purpose a full factorial screening design was operationalized. The second phase accomplished
the optimisation process of extracting amaranth grain oil and its constituents, squalene &
stigmasterol, by augmenting two consecutive central composite designs, considering factors
which weren’t included in the factorial design such as sample to solvent ratio, solvent to solvent
ratio and extraction time, keeping the constant optimum values for the identified factors. The
third phase compared the outcomes of optimised MAE process with optimised Soxhlet extraction
quantitatively (oil yield %) and qualitatively (squalene, stigmasterol, polyphenols, α – tocopherol
and DPPH free radical-scavenging activity). The optimised MAE method achieved the highest
extraction yield of 9.1% amaranth grain oil containing 59.53, 3.17, 1.052 and 0.72 mg/g of
squalene, stigmasterol, α - tocopherol and total polyphenol respectively with DPPH free radical
scavenging activity of 86.24%, whereas, the optimised Soxhlet extraction achieved its highest
extraction yield of 8.8% amaranth oil containing 58.78, 3.06, 0.983 and 0.407 mg/g of squalene
Page 4
IV
stigmasterol, α – tocopherol and total polyphenol, respectively with a DPPH free radical
scavenging activity of 70.11%. This attests MAE as a more industrially viable methodology for
extracting lipids from amaranth grain over standard Soxhlet extraction methodology not just
limited to higher oil yield with reduced extraction time and solvent consumption but also for
preserving the best quality of its high value industrially applicable thermostable compounds,
squalene & stigmasterol as well as the thermolabile compounds α–tocopherol and total
polyphenol, maintaining higher antioxidant scavenging activity.
Page 5
V
RÉSUMÉ
Les composés lipidiques issus de l’amarante sont maintenant reconnus posséder une
bioactivité d’intérêt nutraceutique et cosméceutique, particulièrement pour la squalène, les
stérols, tocols et polyphénols. Cette étude a visé l’optimisation de l’extraction microonde des
composés bioactifs lipophiles de la graine d’amarante. Cette étude a voulu développer une
raison industrielle aux composés lipidiques d’une pseudo-céréale non-conventionnelle.
Les expériences de cette étude ont été menées en trois phases. La première étape s’est
concentrée sur l’identification des paramètres importants tels la granulométrie, le type de solvant
d’extraction, et la puissance microonde, jouant sur l’extraction de l’huile et de ses constituants, la
squalène et le stigmastérol. Pour cette étude, un plan expérimental factoriel complet a été utilisé.
Pour la seconde étape, l’optimisation de l’extraction a été visée en augmentant le plan
expérimental en prenant en considération le ratio échantillon et solvant, le ratio solvant et
solvant, et le temps d’extraction, tout en maintenant optimisé les paramètres étudiés à la première
étape. La troisième étape a comparé les résultats des conditions optimales d’extraction
microonde aux résultats des conditions optimales d’extraction Soxhlet, quantitatif (% rendement
en huile) et qualitatifs (composition en squalène, stigmastérol, polyphénols, α-tocophérol et
DPPH (capacité phagocyte des radicaux libres). L’extraction optimale microonde de la graine
d’amarante a extrait 9.1% d’huile contenant 59.53, 3.17, 1.052 et 0.72 mg/g de squalène,
stigmastérol, α-tocophérol et polyphénols totaux avec une capacité phagocyte des radicaux libres
de 86.24%. L’extraction optimale Soxhlet a extrait quant à elle, 8.8% d’huile contenant 58.78,
3.06, 0.983 et 0.407 mg/g de squalène, stigmastérol, α-tocophérol et polyphénols totaux avec une
capacité phagocyte des radicaux libres 70.11%. Ceci confirme la meilleure performance de
l’extraction micro-onde pour l’extraction des lipides de la graine d’amarante sur l’extraction
conventionnelle Soxhlet, autant pour le rendement que pour la conservation de la qualité de
l’huile, et ses composés thermostable (tels la squalène) et thermolabiles (tels l’α-tocophérol),
maintenant une meilleure capacité phagocyte des radicaux libres.
Page 6
VI
ACKNOWLEDGEMENT
The voyage through the seas of my master’s research study has come to an end. There were
several unforgettable moments of agony, ecstasy, anguish and elation which molded into a sense
of success and accomplishment for me. It is a pleasant aspect that I have now the opportunity to
express my gratitude for all who made this journey smooth and enjoyable.
First and foremost, I would like to humbly surrender before almighty, the eternal guru, for the
grace and wisdom that has been bestowed upon me to furnish patience, perseverance, diligence,
prudence, intellectual curiosity, analytical thinking and scholarly approach within myself as well
as for supplying me with incredibly wonderful advisor and a community of abetting friends
during this research project, and indeed for my whole life.
I submit wholehearted gratitude to my advisor, Dr. Valérie Orsat, Associate Professor and
Chair, Department of Bioresource Engineering, McGill University. I have been extremely
fortunate to have Dr. Orsat as my advisor, as she gave me a great privilege to explore on my own
and think independently; nonetheless she always backed my ideas positively and encouraged me
to proceed ahead and at the same time, she assisted me to recover when my steps faltered. I
greatly appreciate her pain-staking efforts in proof reading the drafts and for her insightful
comments and constructive criticisms which helped me to improve the quality of this thesis. Her
enthusiasm coupled with patience helped me to overcome many crisis situations and finish this
dissertation. I am highly indebted to her for providing me with financial support.
I express my ineffable and respectful gratitude to Dr. G.S. Vijaya Raghavan, James McGill
Professor and Graduate Program Director, Department of Bioresource Engineering, McGill
University. His motivational, energetic and kind words always rendered me with great zeal and
audacity. I am highly grateful to him for sharing his technical expertise and permitting me to
work in his postharvest technology laboratory.
It is my profound privilege to express my sincere thanks to Yvan Gariépy, Research Engineer,
Department of Bioresource Engineering, McGill University for his eminent guidance in an
Page 7
VII
erudite manner and ever willing help which is responsible for the accomplishment of this work. I
am indebted to him for managing our lab very efficiently, without his kind support it would have
been impossible to work and share resources within the lab.
I wholeheartedly thank Ms. Susan Gregus, Graduate Program Administrator, Office of
Graduate and Postdoctoral Studies, Macdonald Campus, McGill University for her kind support
and direction for my master’s application to Department of Bioresource Engineering, McGill
University; Ms. Abida Subhan, Ms. Patricia Singleton and Ms. Leslie Ann La Duke for their
kindness and secretarial help.
Members of my lab specifically Priyanka, Yanti, Kiruba and Winny deserve my sincerest
thanks, for being a source of laughter, joy, and support in the lab. It was a pleasure to work in the
lab when all were around.
Words seems to be at dearth to express my deepest gratitude to my friends Sunitha, Winny,
Anantdeep, Priyanka, Divya, Saranya, Kiruba, Mugundhine, Navpreet, Jiawen, Farhana, Julian,
Mfon, Jacob and Amy. Each member has a special significance in my life and all of them
together make up a wonderful family for me in Laird Hall (McGill University residence),
without them it would have been difficult to survive. I owe them my heartfelt appreciation.
Thank you so much for your friendship.
I would like to extend my sincere appreciation and gratitude towards the Government of
Canada for its financial support by an aid of a research grant from the International Development
Research Centre (IDRC), Ottawa, Canada provided through the Canadian International
Development Agency (CIDA).
Heart filled with everlasting love, I dedicate everything that I have accomplished including
this thesis to my beloved grandparents, parents and my sister for their mellifluous love, support
and affection showered upon me that fosters my educational ambitions.
Page 8
VIII
TABLE OF CONTENTS
Dedication.............................................................................................................................. II
Abstract................................................................................................................................. III
Résumé................................................................................................................................... V
Acknowledgement............................................................................................................... VI
Table of contents................................................................................................................... VIII
List of figures........................................................................................................................ XII
List of tables.......................................................................................................................... XIII
Nomenclature........................................................................................................................ XIV
Chapter 1 General Introduction....................................................................................... 1
1.1 Hypothesis.......................................................................................................... 2
1.2 Objective............................................................................................................ 3
Preface to Chapter 2............................................................................................................. 4
Chapter 2 Review of Literature........................................................................................ 5
2.1 Characteristics of amaranth.............................................................................. 5
2.1.1 Taxonomy........................................................................................................... 5
2.1.1.1 Grain amaranth................................................................................................. 5
2.1.1.2 Vegetable amaranth........................................................................................... 6
2.1.2 Physiology.......................................................................................................... 6
2.1.3 Morphology........................................................................................................ 7
2.2 Composition and nutritional properties of grain amaranth.............................. 9
2.2.1 Carbohydrate..................................................................................................... 9
2.2.1.1 Starch................................................................................................................. 9
2.2.1.2 Resistant starch.................................................................................................. 10
2.2.1.3 Fiber................................................................................................................... 11
2.2.2 Proteins.............................................................................................................. 11
2.2.2.1 Amino acids........................................................................................................ 12
2.2.2.2 Storage proteins................................................................................................. 13
2.2.3 Lipids.................................................................................................................. 14
2.2.3.1 Fatty acid pattern............................................................................................... 15
2.2.3.2 Phospholipids..................................................................................................... 16
2.2.3.3 Tocols................................................................................................................. 17
2.2.3.4 Squalene............................................................................................................. 18
2.2.4 Vitamins.............................................................................................................. 19
2.2.5 Minerals.............................................................................................................. 20
2.2.6 Phytochemicals................................................................................................... 21
2.2.6.1 Total phenolic compounds.................................................................................. 21
2.2.6.2 Saponins.............................................................................................................. 22
Page 9
IX
2.2.6.3 Phytic acid.......................................................................................................... 23
2.2.6.4 Enzyme inhibitors............................................................................................... 23
2.2.6.5 Pigments............................................................................................................. 24
2.3 Industrial Applications of amaranth grain oil.................................................... 24
2.3.1 Amaranth grain oil: for nutraceutical industries............................................... 24
2.3.1.1 Antididiabetic effects.......................................................................................... 24
2.3.1.2 Cholesterol lowering and antilipemic effects..................................................... 24
2.3.1.3 Antihypertensive effects...................................................................................... 26
2.3.1.4 Immunomodulatory effects................................................................................. 26
2.3.1.5 Hepatic health improving effects........................................................................ 26
2.3.1.6 Anticarcinogenic effects..................................................................................... 27
2.3.1.7 Antioxidant effects.............................................................................................. 27
2.3.2 Amaranth grain oil: potential cosmeceutical ingredient.................................... 28
2.4 Amaranth grain oil extraction............................................................................ 28
2.4.1 Conventional extraction..................................................................................... 28
2.4.2 Microwave assisted extraction (MAE)............................................................... 30
2.4.2.1 Principle of microwave heating......................................................................... 30
2.4.2.2 Mechanism of MAE............................................................................................ 32
2.4.2.3 MAE mechanism in relation to biological systems............................................. 33
2.4.2.4 MAE instrumentation.......................................................................................... 34
2.4.2.4.1 Principle elements of MAE device...................................................................... 34
2.4.2.4.2 Closed MAE system............................................................................................ 35
2.4.2.4.3 Open MAE system............................................................................................... 36
Preface to Chapter 3.............................................................................................................. 37
Chapter 3 Pre-optimisation Studies of Microwave Assisted Extraction of Lipids
from Grain Amaranth (Plainsman)................................................................
39
3.1 Abstract............................................................................................................... 39
3.2 Introduction........................................................................................................ 39
3.3 Materials and methods....................................................................................... 43
3.3.1 Grain amaranth.................................................................................................. 43
3.3.2 Standards and solvents....................................................................................... 44
3.3.3 Sample preparation............................................................................................ 44
3.3.4 Heating pattern studies and microwave output power calibration of MAE
system for different solvent combinations..........................................................
44
3.3.5 MAE of lipids from AGF..................................................................................... 45
3.3.6 Soxhlet extraction of lipids from AGF................................................................ 46
3.3.7 Calculation of oil yield (%)................................................................................ 47
3.3.8 Parameter screening study................................................................................. 47
3.3.9 Experimental design........................................................................................... 47
3.3.10 Sample preparation for GC-MS analysis........................................................... 48
3.3.11 GC-MS analysis for squalene and stigmasterol quantification.......................... 48
3.3.12 Effect of high temperature (100°C) on squalene and stigmasterol contents of
amaranth grain oil..............................................................................................
49
Page 10
X
3.3.13 Effect on microwave absorbing capacity of methonol – hexane mixture by
varying the concentration of methanol in hexane..............................................
49
3.4 Results and Discussion....................................................................................... 49
3.4.1 Heating pattern of solvents A, B and C under microwave and actual
microwave power calibration.............................................................................
49
3.4.2 Outcomes of parameter screening study............................................................ 51
3.4.3 Interpretation of MAE FFSD.............................................................................. 52
3.4.3.1 MAE FFSD oil yield (%).................................................................................... 53
3.4.3.2 MAE FFSD squalene and stigmasterol yield (mg/g of oil)................................ 55
3.4.4 Effect of high temperature (100°C) on squalene and stigmasterol contents of
amaranth oil.......................................................................................................
58
3.4.5 Identification of experimental domain............................................................... 59
3.4.6 Microwave output power calibration for different concentrations of methanol
in hexane.............................................................................................................
60
3.5 Conclusion.......................................................................................................... 63
3.6 Acknowledgement............................................................................................... 63
Preface to Chapter 4.............................................................................................................. 64
Chapter 4 Microwave Assisted Extraction of Lipids from Grain Amaranth
(Plainsman) - Method Development...............................................................
66
4.1 Abstract.............................................................................................................. 66
4.2 Introduction........................................................................................................ 66
4.3 Materials and methods....................................................................................... 68
4.3.1 Standards, solvents and reagents....................................................................... 68
4.3.2 Outcomes of pre-optimisation studies................................................................ 68
4.3.3 Experimental design........................................................................................... 69
4.3.4 Spectrophotometric determination of total phenolic compounds using Folin
& Ciocalteau’s reagents.....................................................................................
71
4.3.5 Spectrophotometric determination of α – tocopherol using Emmerie – Engel
reaction...............................................................................................................
72
4.3.6 DPPH free radical – scavenging activity........................................................... 73
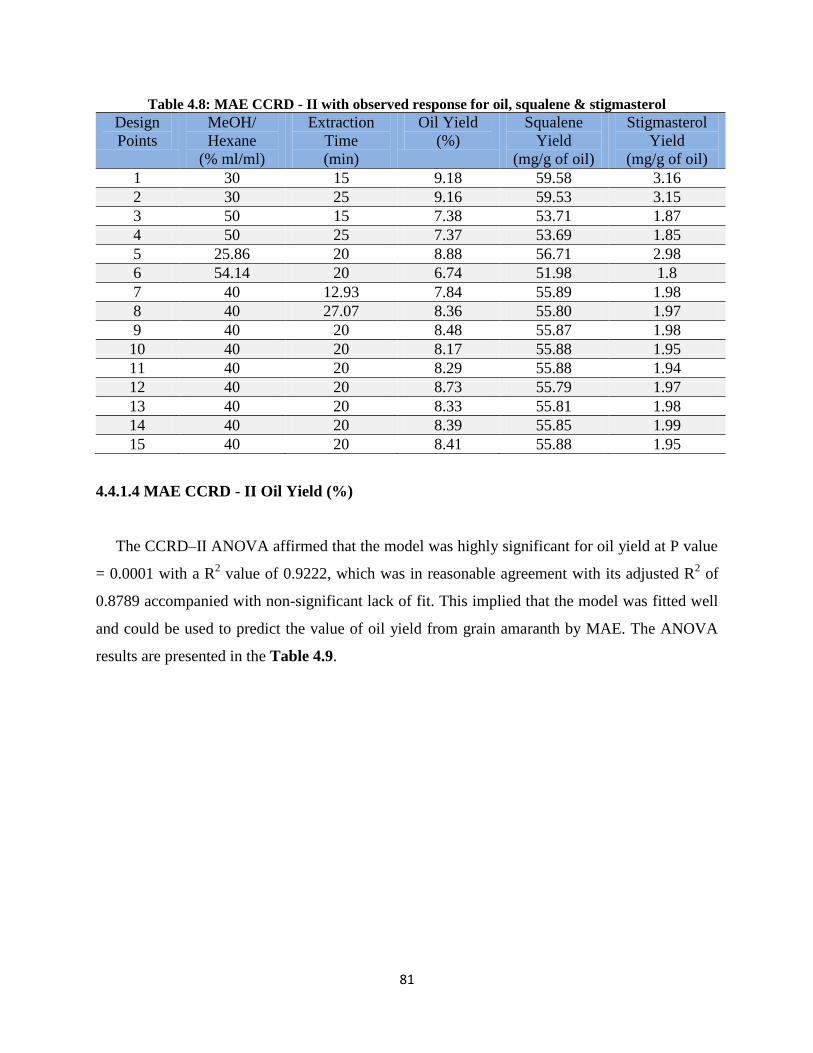
4.4 Results and discussions...................................................................................... 74
4.4.1 MAE optimisation designs.................................................................................. 74
4.4.1.1 MAE CCRD - I oil yield (%)............................................................................... 74
4.4.1.2 MAE CCRD - I squalene and stigmasterol yield (mg/g of oil)........................... 76
4.4.1.3 Outcomes of CCRD – I....................................................................................... 79
4.4.1.4 MAE CCRD - II oil yield (%)............................................................................. 81
4.4.1.5 MAE CCRD - II squalene and stigmasterol yield (mg/g of oil).......................... 83
4.4.1.6 Interpretation of CCRD - I and CCRD – II........................................................ 85
4.4.2 Soxhlet extraction optimisation design............................................................... 88
4.4.2.1 Soxhlet CCRD oil yield (%)................................................................................ 89
4.2.2.2 Soxhlet CCRD squalene and stigmasterol yield (mg/g of oil)............................ 91
4.4.3 Interpretation of Soxhlet extraction and its comparison with MAE................... 94
4.4.4 Total Polyphenol and α - tocopherol estimation................................................ 96
Page 11
XI
4.4.5 Antioxidant scavenging activity.......................................................................... 97
4.5 Conclusion.......................................................................................................... 98
4.6 Acknowledgement............................................................................................... 98
Preface to Chapter 5.............................................................................................................. 99
Chapter 5 General Summary and Conclusion................................................................. 100
References............................................................................................................................... 104
Page 12
XII
LIST OF FIGURES
Figure 2.1 (a) Illustration of Amaranthus cruentus seed in cross and longitudinal
sections
(b) Scanning electron micrograph of a seed of Amaranthus cruentus..............
8
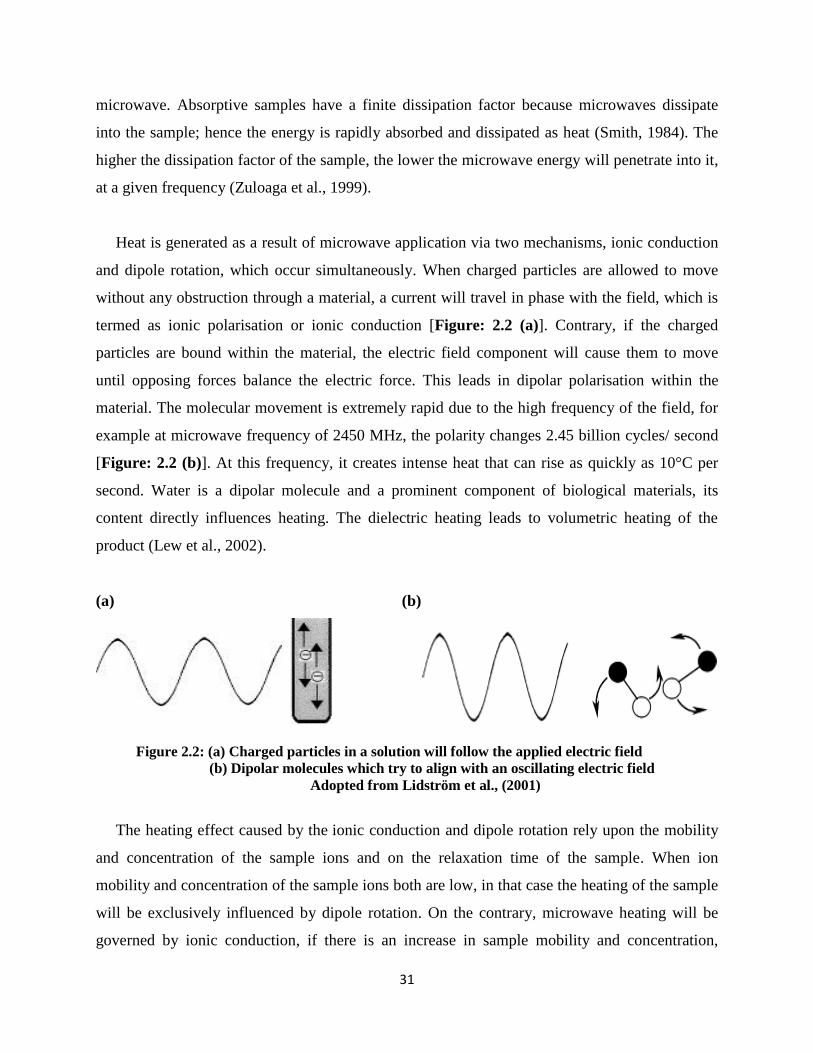
Figure 2.2 (a) Charged particles in a solution will follow the applied electric field
(b) Dipolar molecules which try to align with an oscillating electric
field....................................................................................................................
31
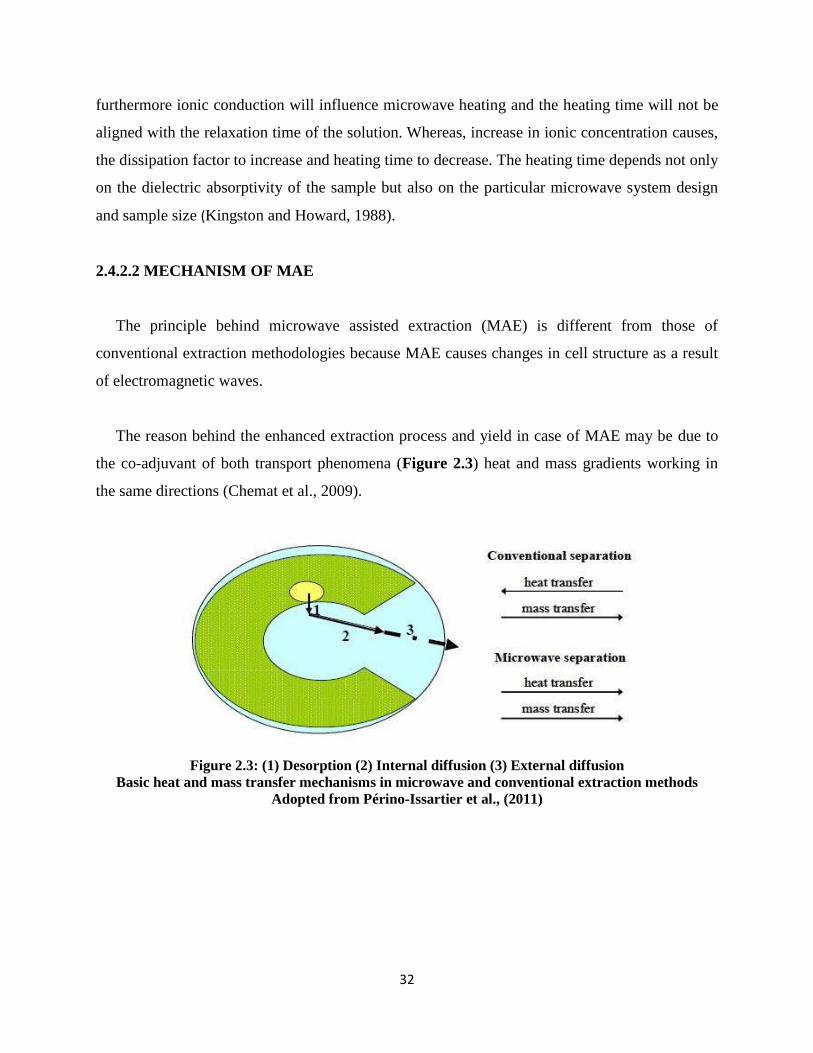
Figure 2.3 (1) Desorption (2) Internal diffusion (3) External diffusion
Basic heat and mass transfer mechanisms in microwave and conventional
extraction methods.............................................................................................
32
Figure 2.4 The extraction process takes place in three different steps............................... 33
Figure 2.5 (a) Closed type microwave system and (b) open type microwave system.......... 35
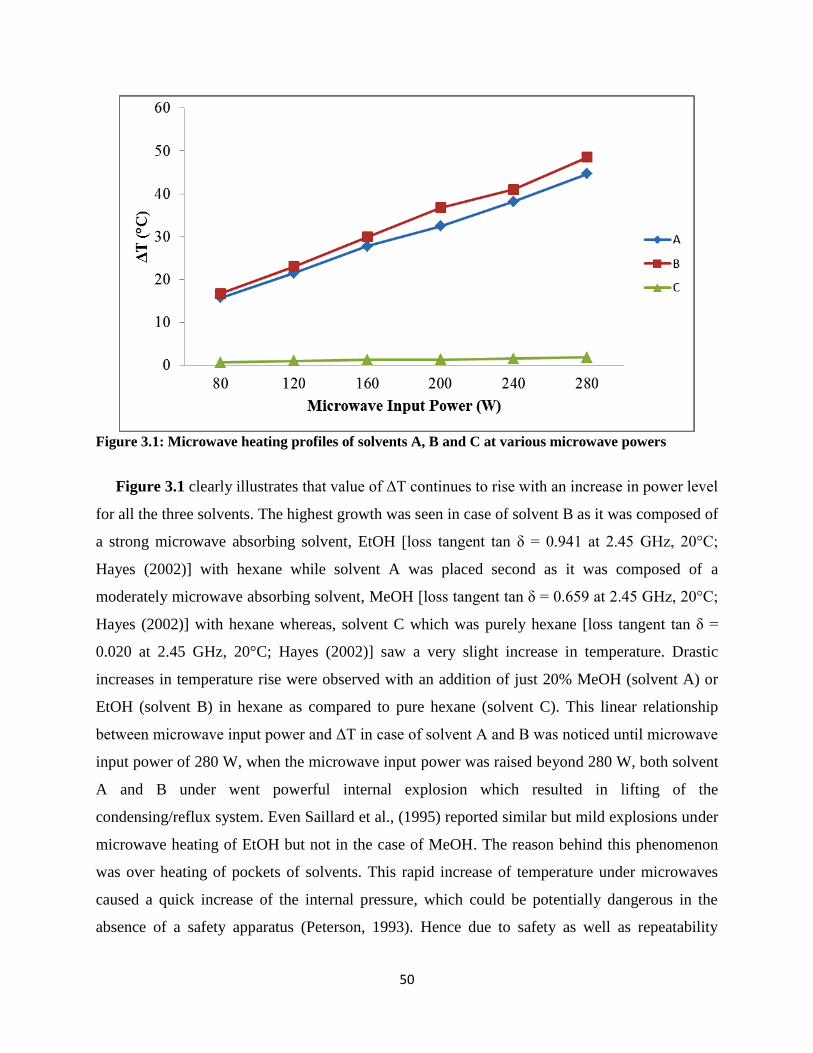
Figure 3.1 Microwave heating profiles of solvents A, B and C at various microwave
Powers...............................................................................................................
50
Figure 3.2 MAE FFSD process factors effects on oil yield................................................. 54
Figure 3.3 MAE FFSD Regression plot (left); Predicted vs actual plot (right) for oil
yield (%).............................................................................................................
55
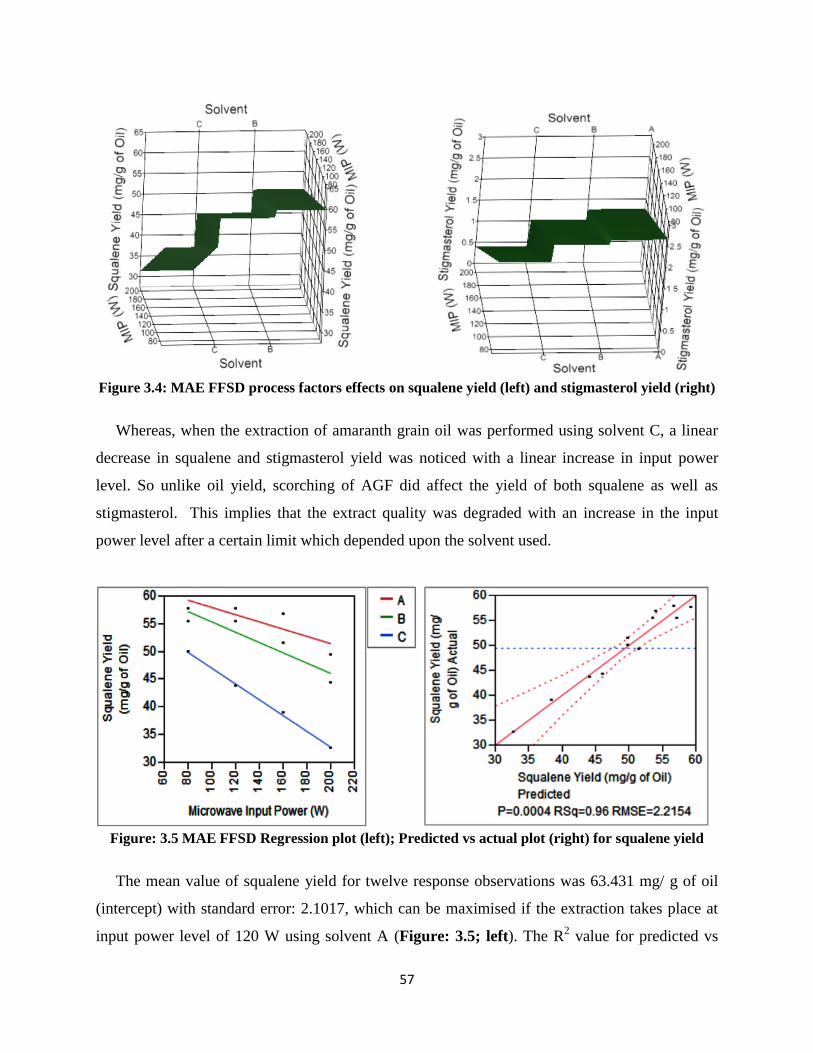
Figure 3.4 MAE FFSD process factors effects on squalene yield (left) and stigmasterol
yield (right)........................................................................................................
57
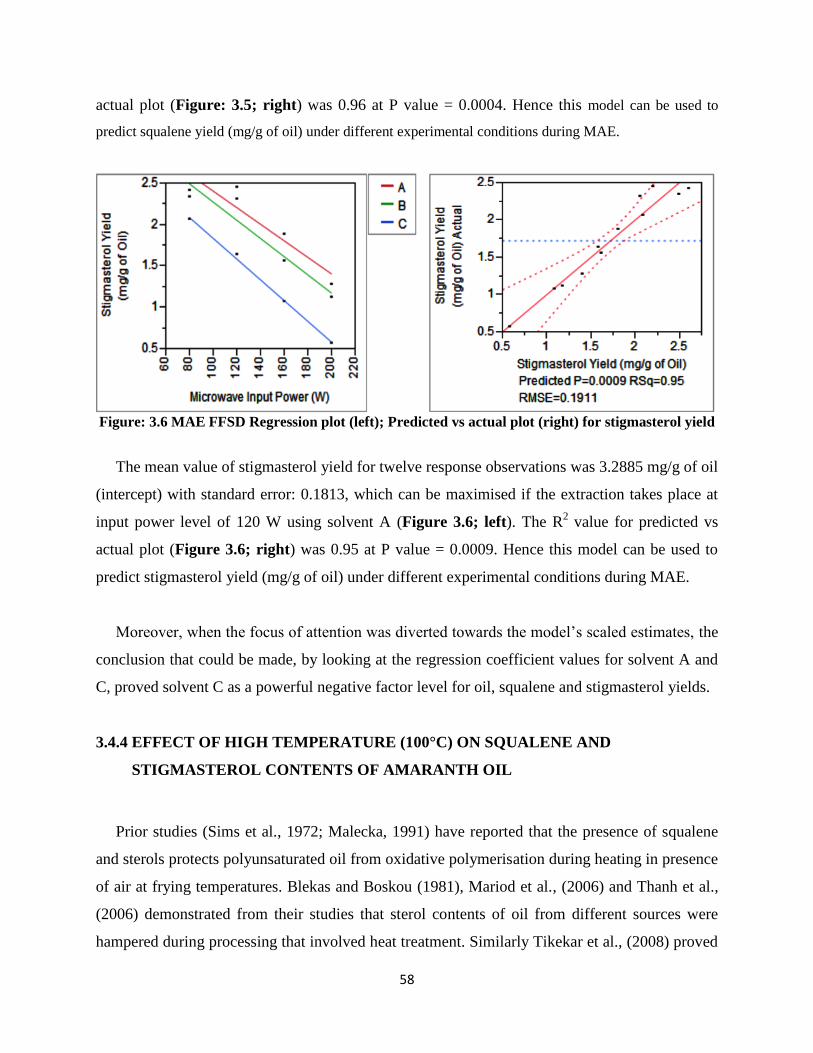
Figure 3.5 MAE FFSD Regression plot (left); Predicted vs actual plot (right) for
squalene yield....................................................................................................
57
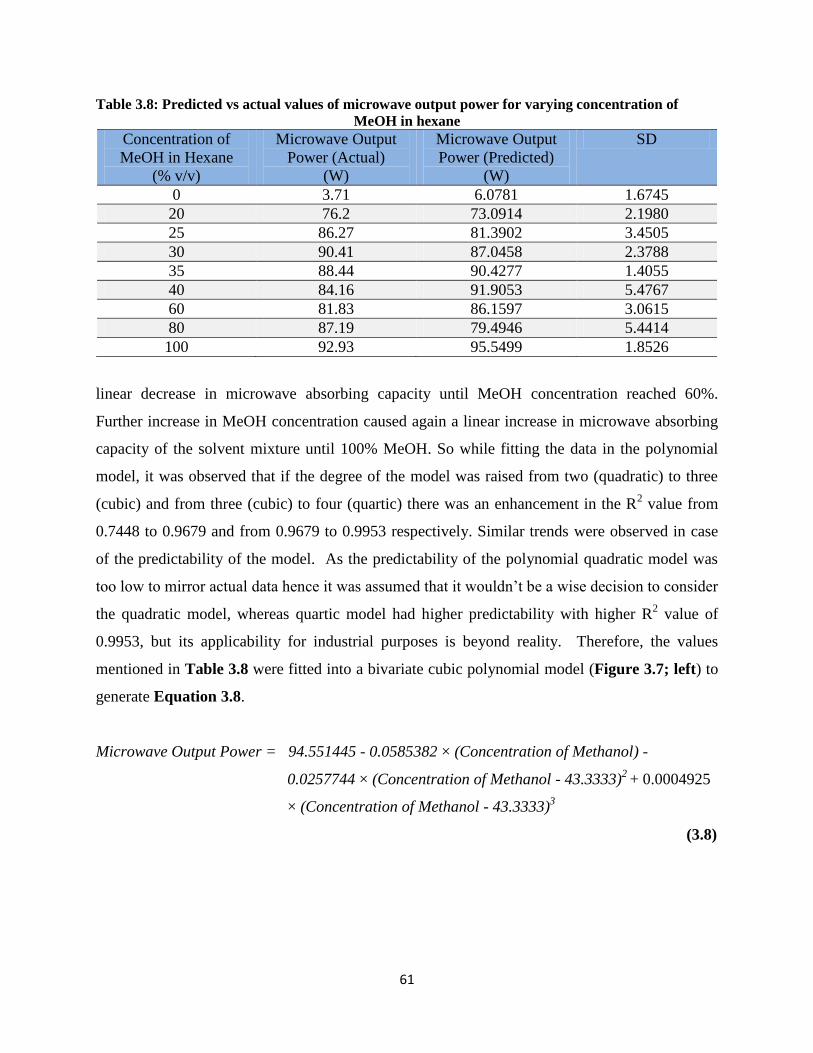
Figure 3.6 MAE FFSD Regression plot (left); Predicted vs actual plot (right) for
stigmasterol yield...............................................................................................
58
Figure 3.7 Regression plot (left); Predicted vs actual plot (right) microwave output
power for varying concentrations of methanol in hexane.................................
62
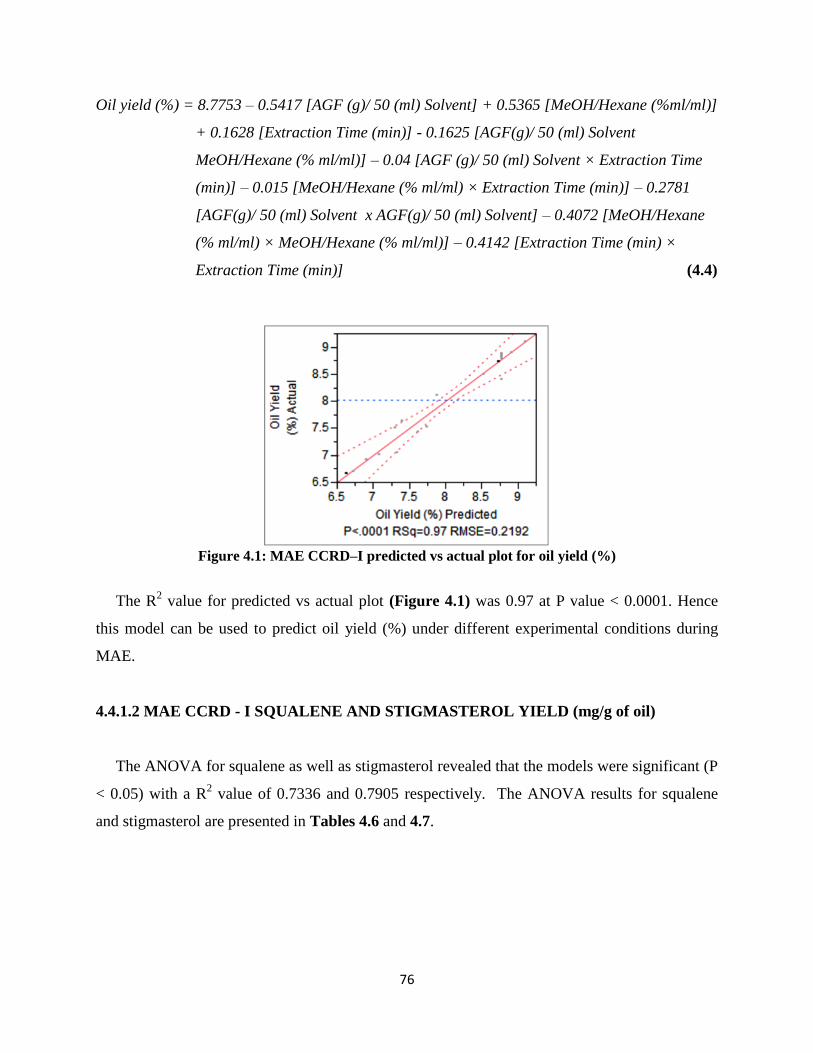
Figure 4.1 MAE CCRD - I predicted vs actual plot for oil yield (%).................................. 76
Figure 4.2 MAE CCRD - II predicted vs actual plot for oil yield (%)................................ 82
Figure 4.3 MAE process factors effects on oil yield: CCRD – I (left) and CCRD – II
(right).................................................................................................................
85
Figure 4.4 MAE process factors effects on squalene yield: CCRD – I (left) and CCRD –
II (right).............................................................................................................
86
Figure 4.5 MAE process factors effects on stigmasterol yield: CCRD – I (left) and
CCRD – II (right)...............................................................................................
87
Figure 4.6 Soxhlet Predicted vs actual plot for oil yield (%).............................................. 91
Figure 4.7 Soxhlet extraction process factors effects on oil (a), squalene (b) and
stigmasterol (c) yields........................................................................................
94 -
95
Figure 4.8 Comparison between MAE & Soxhlet in terms of α – tocopherol and total
polyphenol content.............................................................................................
97
Figure 4.9 Comparison between MAE & Soxhlet in terms of their oil’s antioxidant
scavenging activities..........................................................................................
97
Page 13
XIII
LIST OF TABLES
Table 2.1 Protein distribution in physical fractions of grain amaranth and some
cereal grain (%)..............................................................................................
11
Table 2.2 Essential amino acid contents of major grain species of amaranth (g/100 g
protein)............................................................................................................
13
Table 2.3 Crude fat content of major grain species of amaranth (%)............................. 14
Table 2.4 Lipid profile of amaranth grain oil and amaranth grain (g/100 g)................ 15
Table 2.5 Average fatty acid profiles of amaranth grain species, compared with
means of seven other grains............................................................................
16
Table 2.6 Tocopherol profiles of amaranth grain species and other grains (mg/100 g
seed, wb)..........................................................................................................
18
Table 2.7 Oil and squalene in oil percentage of some amaranth species and other
seeds................................................................................................................
19
Table 2.8 Vitamin composition of grain amaranth.......................................................... 20
Table 2.9 Mineral composition of some grain amaranths compared with other food
grain (mg/100 g)..............................................................................................
21
Table 3.1 Independent variables in MAE FFSD............................................................. 48
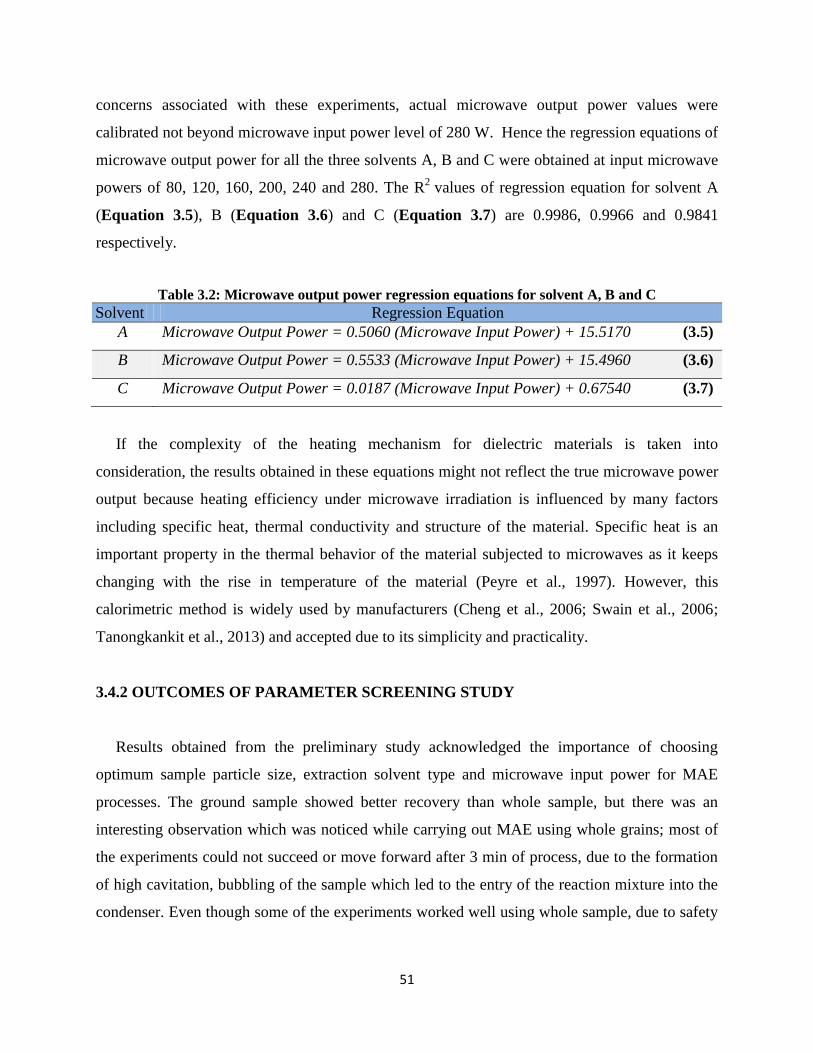
Table 3.2 Microwave output power regression equations for solvent A, B and C.......... 51
Table 3.3 MAE FFSD with observed response for oil, squalene & stigmasterol............ 53
Table 3.4 MAE FFSD ANOVA for oil yield (%).............................................................. 53
Table 3.5 MAE FFSD ANOVA for squalene yield (mg/g of oil)...................................... 56
Table 3.6 MAE FFSD ANOVA for stigmasterol yield (mg/g of oil)................................ 56
Table 3.7 Responses of exposing amaranth oil to hot air oven (100 °C) over time........ 59
Table 3.8 Predicted vs actual values of microwave output power for varying
concentration of methanol in hexane..............................................................
61
Table 3.9 ANOVA for microwave output power for varying concentrations of
methanol in hexane..........................................................................................
62
Table 4.1 Independent variables in MAE CCRD - I........................................................ 69
Table 4.2 Independent variables in MAE CCRD - II...................................................... 70
Table 4.3 Independent variables in Soxhlet CCRD......................................................... 71
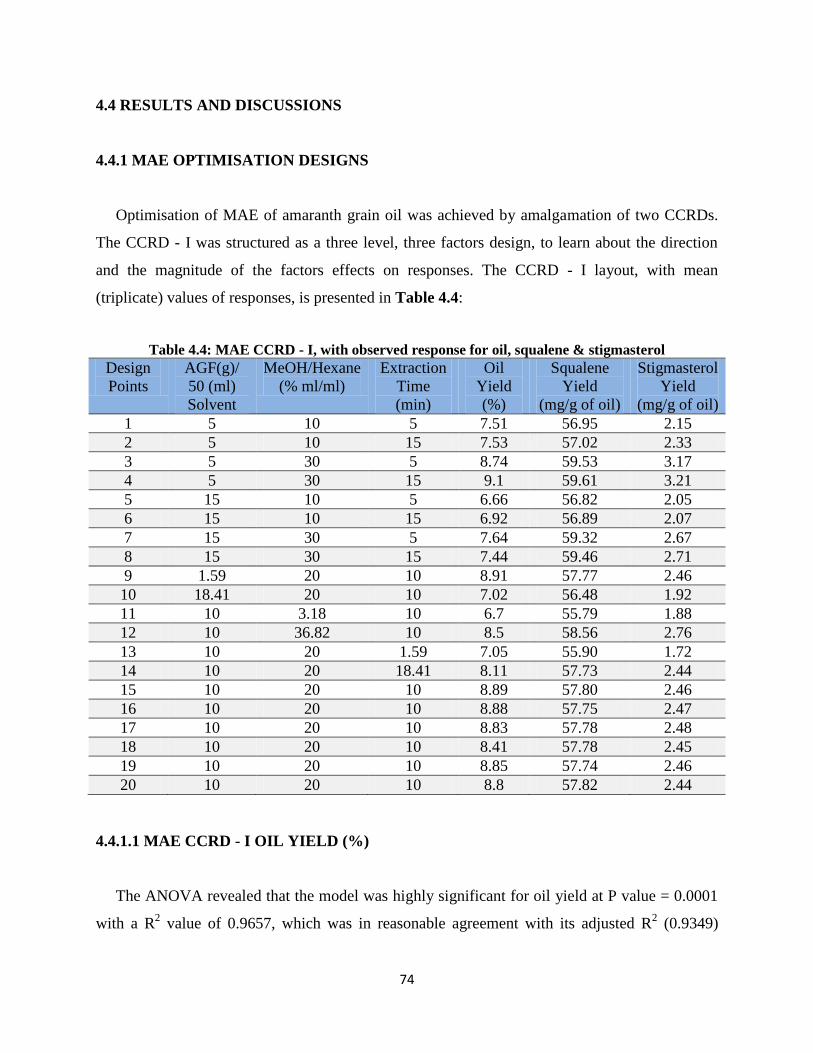
Table 4.4 MAE CCRD - I, with observed response for oil, squalene & stigmasterol..... 74
Table 4.5 MAE CCRD - I ANOVA for oil yield (%)........................................................ 75
Table 4.6 MAE CCRD - I ANOVA for squalene yield (mg/g of oil)................................ 77
Table 4.7 MAE CCRD - I ANOVA for stigmasterol yield (mg/g of oil).......................... 78
Table 4.8 MAE CCRD - II with observed response for oil, squalene & stigmasterol..... 81
Table 4.9 MAE CCRD - II ANOVA for oil yield (%)....................................................... 82
Table 4.10 MAE CCRD - II ANOVA for squalene yield (mg/g of oil)............................... 83
Table 4.11 MAE CCRD - II ANOVA for stigmasterol yield (mg/g of oil)......................... 84
Table 4.12 Soxhlet CCRD with observed response for oil, squalene & stigmasterol....... 89
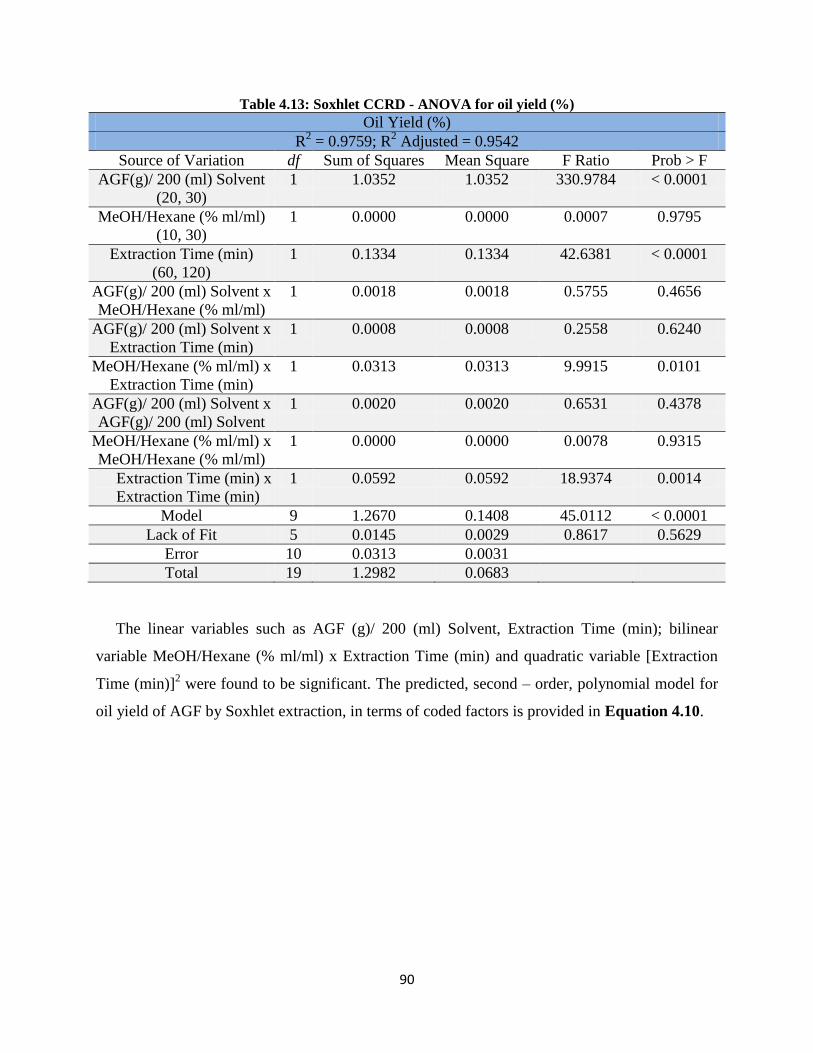
Table 4.13 Soxhlet CCRD - ANOVA for oil yield (%)....................................................... 90
Table 4.14 Soxhlet CCRD - ANOVA for squalene yield (mg/g of oil)............................... 92
Table 4.15 Soxhlet CCRD - ANOVA for stigmasterol yield (mg/g of oil)......................... 93
Page 14
XIV
NOMENCLATURE
AACC American Association of Cereal Chemists
ACS American Chemical Society
AGF Amaranth grain flour
AIU Amylase inhibitory activity
ALT Alanine aminotransaminase
ANOVA Analysis of variance
AOCS American Oil Chemists’ Society
AST Aspartate aminotransaminase
ASTM American Society for Testing and Materials
°C Degree centigrade
Ca Calcium
CCRD Central composite rotatable design
CIDA Canadian International Development Agency
CIU Chymotrypsin inhibitor activity
cm Centimeter
Cps The specific heat of solvent
Cpv the specific heat of borosilicate glass
Cu Copper
cv. Cultivar
DMAE Dynamic microwave-assisted extraction
DPPH 2,2-diphenyl-1-picrylhydrazyl
ε’ dielectric constant
ε” dielectric loss
EtOH Ethanol
FAO Food and Agriculture Organisation
Fe Iron
FFSD Full factorial screening design
g Gram
GC-MS Gas chromatography – mass spectroscopy
GHz Gigahertz
HDL High density lipoprotein
HMG – CoA 3-hydroxy-3-methylglutaryl-coenzyme A
HPMAE High pressure microwave-assisted extraction
HPLC High-performance liquid chromatography
IDRC International Development Research Center
IR Infrared
IU International units
K Potassium
Kg Kilogram
LDL Low density lipoprotein
MAE Microwave assisted extraction
Mg Magnesium
mg Milligram
Page 15
XV
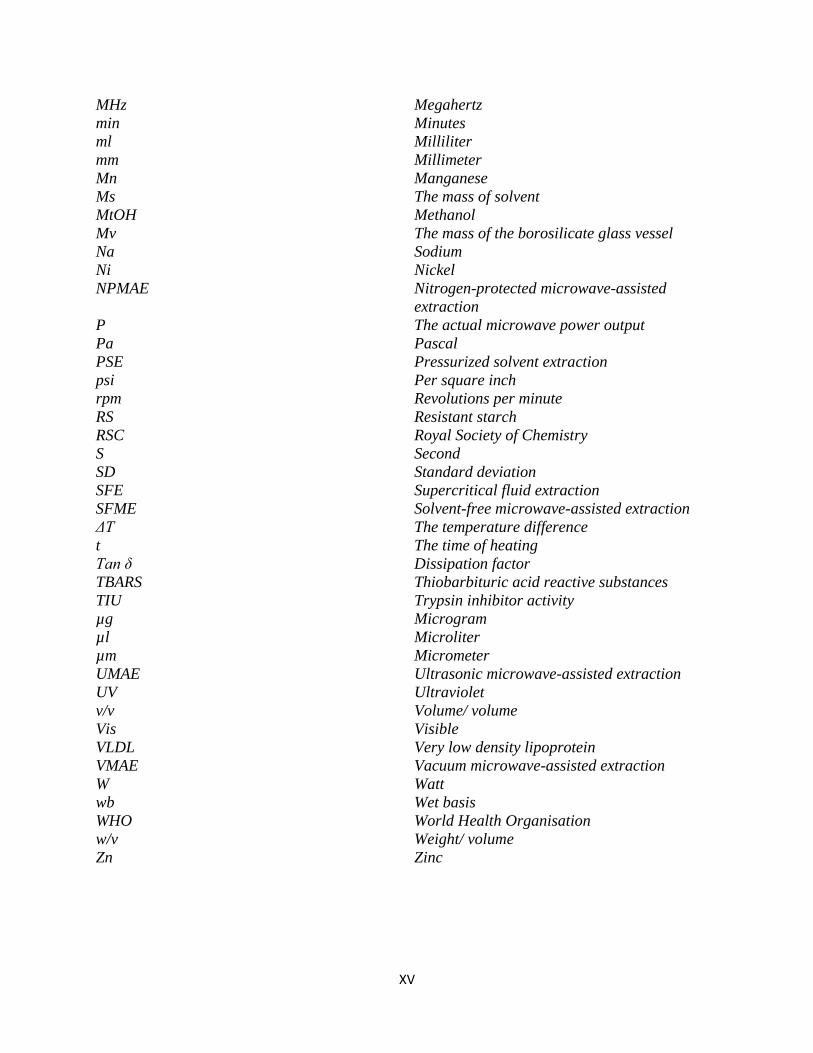
MHz Megahertz
min Minutes
ml Milliliter
mm Millimeter
Mn Manganese
Ms The mass of solvent
MtOH Methanol
Mv The mass of the borosilicate glass vessel
Na Sodium
Ni Nickel
NPMAE Nitrogen-protected microwave-assisted
extraction
P The actual microwave power output
Pa Pascal
PSE Pressurized solvent extraction
psi Per square inch
rpm Revolutions per minute
RS Resistant starch
RSC Royal Society of Chemistry
S Second
SD Standard deviation
SFE Supercritical fluid extraction
SFME Solvent-free microwave-assisted extraction
ΔT The temperature difference
t The time of heating
Tan δ Dissipation factor
TBARS Thiobarbituric acid reactive substances
TIU Trypsin inhibitor activity
µg Microgram
µl Microliter
µm Micrometer
UMAE Ultrasonic microwave-assisted extraction
UV Ultraviolet
v/v Volume/ volume
Vis Visible
VLDL Very low density lipoprotein
VMAE Vacuum microwave-assisted extraction
W Watt
wb Wet basis
WHO World Health Organisation
w/v Weight/ volume
Zn Zinc
Page 16
1
CHAPTER 1: GENERAL INTRODUCTION
Amaranth (Amaranthus spp.), has been consumed throughout history by Inca, Maya and
Aztec civilisations of America. It is a rediscovered crop, which observed an increase in interest
since the 1980s, when research by the United States National Academy of Sciences
acknowledged the high nutritional value and agronomic potential of this pseudo-cereal
(Monteros et al., 1998; Ulbricht et al., 2009). Currently, it is cultivated in central and south
America as well as in some parts of Asia and Africa. This increase in its acceptance in countries
where its consumption has not been traditional can be attributed to its quick growth rate,
commendable tolerance to growth stresses like drought, salinity, alkalinity acidity or poor soils,
and noteworthy nutritional content. From a botanical or nutritional viewpoint, amaranth shares
the facets of both cereal and leguminous seed, due to its protein composition and amino acid
profile which are placed almost between a cereal and a bean. Its protein content and quality is
labelled as nutritionally favourable due to elevated levels of lysine as compared to other grains
whereas, due to the waxy nature of its starch, it has potential to be used as a stabiliser or
thickener and emulsifier in food products (Singhal, and Kulkarni, 1988; Caselato-Sousa and
Amaya-Farfán, 2012).
The lipophilic content of grain amaranth is greater (6 - 9%) in comparison to other cereal
grains. Recently it has been a major cause of interest by the scientific community due to its
chemopreventive properties pertaining to its antidiabetic, cholesterol-lowering & antilipemic,
antihypertensive, immunomodulatory, hepatic health improving, anticarcinogenic effects and
antioxidant characteristics. These effects can be accredited to its high nutraceutical and
cosmeceutical value ingredients including squalene, sterols, α-tocopherol and polyphenols
(Czaplicki et al., 2011). The squalene content of amaranth grain oil is exceptionally high
(Escudero et al., 2006), just next to shark liver oil, which makes it a potential candidate for
cosmetic formulations as squalene possesses emollient properties which assists in rejuvenating
the suppleness and flexibility of the skin and also guards the human skin surfaces from lipid
peroxidation caused by UV light exposure and other oxidative damage sources (Kohno et al.,
1995).
Page 17
2
The extraction technique used for eluting out these important bioactive ingredients from
plants plays a key role that determines the best quality of the extract obtained at lowest cost so
that it can be adopted for industrial purposes.
Until present, Soxhlet has been the most prominently adopted conventional extraction
technique used for leaching out the lipophilic constituents from amaranth grain (Lyon and
Becker, 1987; Singhal and Kulkarni, 1988; Jahaniaval et al., 2000; León-Camacho et al., 2001;
He et al., 2003; Gamel et al., 2007). However, it is a very time and solvent consuming technique
which leads to an incomplete extraction from the sample matrix (Luque de Castro and Garcia-
Ayuso, 1998). Therefore, there has been an increase in the exploration of novel extraction
technologies for this purpose. Microwave assisted extraction (MAE) is a potential alternative to
conventional extraction technologies as it takes shorter time, consumes less solvent, coupled with
higher extraction rates with better product quality (Delazar et al., 2012).
1.1 HYPOTHESIS
There are diverse research studies that have compared MAE with conventional extraction
methodologies and attested MAE as a more commercially feasible extraction technique (Hao et
al., 2002; Lucchesi et al., 2004; Talebi et al., 2004; Barbero et al., 2006; Wang et al., 2006;
Hemwimon et al., 2007). It is consequently hypothesised that MAE would be better or a
comparably viable process for extracting lipids from grain amaranth than standard conventional
extraction, not just limited to higher oil yield with reduced extraction time and solvent
consumption but also preserving the best quality of the high value constituents including
squalene, stigmasterol, α – tocopherol and total tolyphenol with greater free radical-scavenging
activity.
1.2 OBJECTIVES
The principal objective of this research was to study and design an optimised method for
eluting lipophilic components of grain amaranth. The following specific objectives involved:
Page 18
3
To conduct pre-optimisation studies for the selection of operating parameters, namely
sample particle size [whole amaranth grain and amaranth grain flour (AGF)], extraction
solvent and microwave input power. A full factorial design was employed for screening
to identify the key parameters which can determine the experimental domain required to
optimise the extraction of oil and its constituents, squalene & stigmasterol by central
composite rotatable design (CCRD). The microwave absorbing capabilities for solvents
were examined by calculating the microwave output power, for a better understanding of
the effects of solvents on the overall efficiency of MAE.
To augment two consecutive CCRDs for optimising the extraction yield of oil and it’s
constituent’s squalene and stigmasterol from AGF. The scope of the study was to
optimise the combination of factors which results in maximising responses.
To compare the outcomes of optimised MAE process with optimised Soxhlet extraction
quantitatively (oil yield %) and qualitatively (squalene, stigmasterol, polyphenols, α –
tocopherol and DPPH free radical-scavenging activity).
Page 19
4
PREFACE TO CHAPTER 2
In Chapter 1, scientific illustrations were made that led to the study presented in this thesis.
In Chapter 2, a review of literature is presented that brings attention to the amaranth’s general
characteristics, its composition and nutritional properties; health benefits and industrial
applicability of amaranth grain oil; pioneering conventional techniques for extracting lipids from
grain amaranth; and an overview of microwave heating, the mechanisms of microwave assisted
extraction and its instrumentation.
Page 20
5
CHAPTER 2: REVIEW OF LITERATURE
2.1 CHARACTERISTICS OF AMARANTH
2.1.1 TAXONOMY
Amaranth belongs to the class Dicotyledoneae, subclass Caryophyllidae, order
Caryophyllales, amaranth family Amaranthaceae, sub family Amaranthoideae, genus
Amaranthus. There are more than 60 species within the genus Amaranthus, most of which are
cosmopolitan weeds and cultivated amaranth species which can be used as food grain, leafy
vegetables, forage and ornamentals (Sauer, 1967). The cultivated amaranth species which can be
utilized for human consumption are divided into grain and vegetable amaranths. Even though it
produces cereal-like and starch-rich seeds, it is not considered as a part of the cereal family
(Saunders and Becker, 1984).
2.1.1.1 GRAIN AMARANTH
The four principal Amaranthus species which are considered as a group of grain or pseudo-
cereal, include:
Amaranthus caudatus L. (subsp. caudatus; subsp. mantegazzianus (Passer) Hanelt, syn.
Amaranthus edulis Spegazzini, named love liebleeding and Inca wheat, respectively.
Amaranthus cruentus L. (syn. A. paniculatus L.) – bush greens, red amaranth.
Amaranthus hypochondriacus L. (syn. Amaranthus leucocarpus, Amaranthus
frumentaceous) – prince’s feather.
Amaranthus hypochondriacus L. x Amaranthus hybridus L. (Plainsman)
Within these species many more varieties and subspecies exist (Bale and Kaufmann, 1992;
Williams and Brenner, 1995; Grobelnik Mlakar et al., 2010).
Page 21
6
2.1.1.2 VEGETABLE AMARANTH
Most of the Amaranthus species have edible leaves which have a mild spinach-like flavour.
These are normally used as potherbs and principally consumed as boiled greens. In some parts of
humid tropics of Asia and Africa, Amaranthus greens are a widely eaten vegetable because of
their high yields, ability to grow in hot weather and their high nutritive value. Commonly found
species are Amaranthus tricolor L. (Chinese salad); Amaranthus blitum L.; Amaranthus creuntu
L.; Amaranthus dubius L.; Amaranthus lividus L. [subsp. Amaranthus ascendens (kitchen
amaranth); subsp. Amaranthus oleraceus (vegetable amaranth, Chinese spinach; subsp.
Amaranthus lividus)]; Amaranthus palmeri; Amaranthus hybridus; Amaranthus viridis L.;
Amaranth gracilis Desf.; Amaranthus gangeticus L.; (Franke, 1989; Grobelnik Mlakar et al.,
2010; Mburu et al, 2011).
2.1.2 PHYSIOLOGY
Grain amaranth is an annual herbaceous plant, which uses the C4 photosynthesis pathway by
using carbon dioxide very efficiently under a wide range of temperature (from 25 to 40°C),
higher light intensity and moisture stress environmental conditions, by fixing carbon dioxide in
the chloroplasts of specialised cells surrounding the leaf’s vascular bundles. This characteristic is
responsible for lower water losses by transpiration through the stomata. Amaranth being a C4
plant also has the capacity to photosynthesise at high rates and at high temperatures, through
osmotic adjustments, which helps it in tolerating lack of water to some extent without wilting
(Bressani, 1993; Kigel, 1994). These characteristics make amaranth a crop of choice to adapt to
climate change and ensure food security.
2.1.3 MORPHOLOGY
The stature of the amaranth plant varies notably depending upon species and environment.
For example, individual cultivars can vary in height from 91 to 274 cm and have stem diameters
from 2.54 to 15 cm, depending upon plant stand density and available soil moisture.
Additionally, seed heads have varied from 30 to 112 cm in diameter at the base and varied in
Page 22
7
height from 13 to 61 cm (Irving et al., 1981). Grain type species of amaranth plants possess a
main stem axis that terminates in a large apical branched inflorescence. The flowers of amaranth
are unisexual, developed on branched flower clusters (glomerules) and found in varied colours
such as purple, orange, red or gold. A glomerule is described as a dichasial cyme that forms large
flowering panicles. Vegetable species of amaranth usually have a smooth leaf, with an uncertain
growth habit which produces new luscious axillary growth. The leaves are usually elliptical, with
an acute tip and a cuneate base, whereas the size of the leaf varies considerably between and
within species. The flowers are indefinite inflorescences. The buds of flower emanate directly in
the leaf axils (Brenner and Hauptli, 1990). The seeds are very small (0.9 to 1.7 mm diameter),
with 0.5 - 1.2 g per 1000 seeds or 1,000 to 3,000 seeds/g, approximately 30 - 70 times smaller
than a typical wheat grain. Seed coat colour varies from black, brown, yellow, and white. As
depicted in Figure 2.1, the seed embryo is campylotropous, circular, with the ends nearly
touching and enclosing the perisperm (Irving et al., 1981; Becker 1994).
Page 23
8
Cross-section Longitudinal section
(b)
Figure 2.1: (a) Illustration of Amaranthus cruentus seed in cross and longitudinal sections
(b) Scanning electron micrograph of a seed of Amaranthus cruentus
Adapted from Irving et al., (1981) and Becker (1994).
Page 24
9
2.2 COMPOSITION AND NUTRITIONAL PROPERTIES OF GRAIN AMARANTH
2.2.1 CARBOHYDRATE
2.2.1.1 STARCH
Starch is the main carbohydrate component of grain amaranth which is located in the cells of
the perisperm (Wu and Corke, 1999). Starch is the main component of grain amaranth seeds
accounting between 48 and 69 % (Qian and Kuhn, 1999) in the form of starch granules, therefore
it is the starch which dominates the characteristics of amaranth products. The size of starch
granules are small varying between 0.5 - 3.0 µm in diameter and are spherical, angular or
polygonal in shape usually of uniform size (Lopez et al., 1994; Uriyapongson and Rayas-Duarte,
1994; Radosavljevic, 1998). The starch granules located in the cells of the cotyledon region form
greater agglomerates with a size of about 80 µm, consisting of several single granules (Zhao and
Whistler, 1994; Walkowski et al, 1997).
The two types of starch are amylose and amylopectin. Amylose is a linear biopolymer of α-d-
(1,4)-glucosyl units with few branches connected by α-d-(1,6)-glucosyl linkage, while
amylopectin has much higher density of branching attached by α-d-(1,6)-glucosyl linkage in the
main α-d-(1,4)-glucosyl chains (Tang et al., 2006). Amaranth starch contains higher amylopectin
92 - 95% (Choi et al., 2004) and lower amylose at 1 - 8% contents (Capriles et al., 2008; Kong et
al., 2009) depending on different genotypes (Hoover et al., 1998). Due to its high amylopectin
content, amaranth starch is classified as a “waxy starch” (Lopez et al., 1994). The waxy starch
possesses a high water binding capacity, high swelling power, easy gelatinisation, high enzyme
susceptibility, good freeze–thaw and retrogradation stability (Baker and Rayas-Duarte, 1998A).
These properties support the use of amaranth starch as a stabiliser and thickener in food products
and as an emulsifier for salad dressings (Jobling, 2004).
There are many publications (Paredes – Lopez et al., 1994; Lopez et al., 1994; Uriyapongson
& Rayas-Duarte, 1994; Wu et al., 1995; Baker and Rayas-Duarte, 1998B; Hoover et al., 1998;
Radosavljevic et al., 1998; Choi et al., 2004; Marcone, 2001; Kong et al., 2008; Kong et al.,
Page 25
10
2009) that discuss the viscosity properties of amaranth starch with varying results difficult to
compare. Nonetheless, a common characteristic indicates that the viscosity and gelatinisation
behavior of amaranth starch differs from most of the cereal starches and is comparable with
waxy maize starch (Paredes – Lopez et al., 1994; Lopez et al., 1994 and 1998B).
Digestion of amaranth starch shows efficient absorption in the human intestinal tissues, which
is beneficial for formula-fed infants and seniors having reduced digestive capacity (Dreher et al.,
1984). According to Yanez et al., (1986) the digestibility of gelatinised amaranth starch (63.5%)
is much higher than that of maize starch (35%). Capriles et al., (2008) found that the digestible
starch, hydrolysis index, and predicted glycemic index are significantly increased by popping,
roasting, and flaking processes, suggesting that processed amaranth, would have fast and
complete starch digestion. Capriles et al., (2008) also reported that the cooked, popped, and
extruded amaranth seeds had starch digestibility similar to that of white bread, while flaked and
roasted seeds had a slightly greater capacity to increase glycemic response.
2.2.1.2 RESISTANT STARCH
Resistant starch (RS) is a non-naturally occurring starch product that is produced due to starch
degradation as a result of processing and that escapes digestion in the small intestine of healthy
individuals as it is not susceptible to human digestive enzymes and thus reaches the colon, where
it is fermented by the bacterial biota along with dietary fiber (Champ et al., 2003). Like other
dietary fiber, it has been found to have similar health benefits, such as lowering blood lipids or
lowering the risk of colon cancer. The RS content depends on the starch attributes present in
food, type of granule, amylose/amylopectin ratio and crystallinity of starch, and the analytical
method used.
Pederson et al., (1987) recorded a slight increase in the dietary fiber and a decrease in the
starch content following the heat treatment (toasting, popping) of amaranth, however they
couldn’t explain the reason behind this rise in dietary fibre, but later studies attributed it to the
formation of resistance starch by these treatments. The study by Gonzalez et al., (2007), revealed
an increase in RS content of amaranth from 0.65% (untreated) to 5.95% (at a treatment
Page 26
11
temperature of 150°C with 120 g/kg wb moisture content) by fluidised bed heat treatment. On
the other hand, Gamel et al., (2005) observed a low RS content as a result of cooking and
popping of amaranth as compared to untreated samples of amaranth. Mikulikova and Kraic
(2006) estimated the RS content in amaranth using an enzymatic method (AACC Method 32 -
40) studying 18 genotypes and determined a wide variation in the resistant starch content of the
seeds. Linsberger-Martin et al., (2012) also found an increase in resistant starch content of
amaranth under the effect of high hydrostatic pressure as compared to untreated ones.
2.2.1.3 FIBER
Fiber is responsible for health benefits irrespective of its type including dietary fiber, soluble
and insoluble. Information from the literature reports great variations in fibre content in different
species of amaranth which are comparable with other cereals. The amaranth bran fraction
dominates over the perisperm in terms of dietary fibre content (Betschart et al., 1981). The
dietary fibre content of amaranth is between 9 to 16%. The fraction of soluble dietary fiber varies
between 20 and 28% in Amaranthus cruentus and 33 and 49% in Amaranthus hypochondriacus
(Bressani et al., 1990).
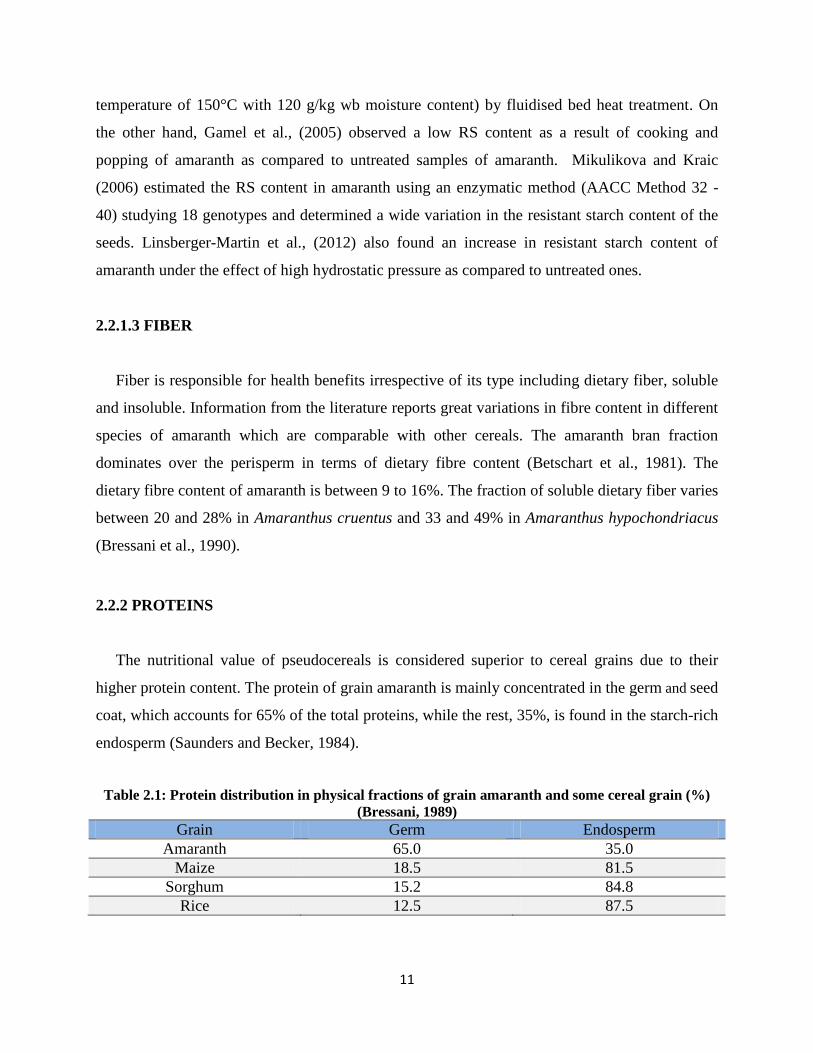
2.2.2 PROTEINS
The nutritional value of pseudocereals is considered superior to cereal grains due to their
higher protein content. The protein of grain amaranth is mainly concentrated in the germ and seed
coat, which accounts for 65% of the total proteins, while the rest, 35%, is found in the starch-rich
endosperm (Saunders and Becker, 1984).
Table 2.1: Protein distribution in physical fractions of grain amaranth and some cereal grain (%)
(Bressani, 1989)
Grain Germ Endosperm
Amaranth 65.0 35.0
Maize 18.5 81.5
Sorghum 15.2 84.8
Rice 12.5 87.5
Page 27
12
As shown in Table 2.1, the germ fraction of the seed has a higher protein concentration than
in the endosperm. Since the germ proteins are the significant sources of essential amino acids, as
compared to the storage proteins of the endosperm, this yields a higher concentration of lysine in
amaranth grain compared to cereal grains in general (Bressani, 1989).
The protein content of grain amaranth varies between 11 to 18% dry matter, which is more
than most of the common grains except soybean and it is well comparable with protein and
energy requirements as stated in the report of a Joint FAO/WHO (1973) Ad Hoc Expert
Committee (Bressani et al., 1987A; Bressani et al., 1987B; Imeri et al., 1987).
The digestibility of raw amaranth protein ranges between 74 - 80%. However, protein
efficiency ratio and digestibility can be considerably enhanced if the grain is heat processed
(Garcia et al., 1987). Heat processing also results in the denaturation of trypsin inhibitors and
other anti- nutritional substances (Imeri et al., 1987).
2.2.2.1 AMINO ACIDS
The amino acid profile of amaranth includes 5% lysine, and 4% sulphur amino acids, which
are the limiting amino acids in other grains. The significant presence of lysine is the main factor
which determines the high quality of amaranth protein. The sulphur amino acid content of
amaranth is significantly higher than that of soybean (Saunders and Becker, 1984; Teutonico and
Knorr, 1985). The essential amino acid composition of three major Amaranthus species is
presented in Table 2.2.
Page 28
13
Table 2.2: Essential amino acid contents of major grain species of amaranth (g/100 g protein)
(Saunders and Becker, 1984; Segura-Nieto, 1994; Senft, 1979)
Amino Acid Amaranthus
caudatus
Amaranthus
cruentus
Amaranthus
hypochondriacus
Amaranth
(Mean)
FAO/WHO (1973)
(Requirements)
Isoleucine 3.6 - 4.1 3.4 - 3.7 2.8 - 3.8 3.0 4.0
Leucine 5.9 - 6.3 4.8 - 5.9 5.0 - 5.8 4.7 7.0
Lysine 5.7 - 6.4 4.8 - 5.8 3.2 - 6.0 5.0 5.5
Methionine 2.4 - 3.3 1.8 - 2.6 0.6 - 1.6
Phenylalanine 3.4 - 4.0 3.2 - 4.5 3.8 - 4.5
Threonine 3.8 3.2 - 4.2 2.6 - 4.3 2.9 4.0
Tryptophan 1.1 1.1 - 4.0 1.3 1.0
Tyrosine 2.8 2.4 - 4.0 3.1 - 4.0
Valine 4.1 - 4.7 3.9 - 4.3 3.2 - 4.2 3.6 5.0
Methionine
+
Cysteine
4.7 3.8 - 5.4 2.6 - 5.5 4.4 3.5
Phenylalanine
+
Tyrosine
6.2
5.6 - 8.5 6.9 - 8.5 6.4 6.0
2.2.2.2 STORAGE PROTEINS
Proteins within seeds are mainly categorised into four types based on their solubility:
albumin, globulin, prolamin, and glutelin. Amaranth protein accounts for albumin as a major
fraction (48.9 - 65%), followed by glutelins (22.4 - 42.3%), globulins (13.7 - 18.1%), and a
minor amount of prolamins (1.0 - 3.2%). Albumins and globulins account for about 60% of the
total nitrogen. The major amaranth protein is probably globulin – P (Konishi et al., 1985). As per
the Nutritionist’s Protein Value Chart proposed by FAO/WHO: a score of 100 is ideal, among
which amaranth protein scored highest (score = 75) as compared to cow’s milk (score = 72)
followed by soybean (score = 68), wheat (score = 60), peanuts (score = 52) and corn (score = 44)
(FAO/WHO, 1973).
The study by Gorinstein et al., (2004) reported a close association between protein fractions
of amaranth and soybeans. The prolamin content demonstrates dissimilarities with cereals,
whereas the glutelin fraction showed some similarities to maize (Gorinstein et al., 2001; 2004).
The globulins can be differentiated into two categories: 7S and 11S globulins based on their
sedimentation coefficient. Amaranth grains do have similar 7S (conamaranthin) and l1S
Page 29
14
(amaranthin) storage globulins (Marcone et al., 1994; Martinez et al., 1997; Marcone, 1999).
Thermal treatments cause a reduction in the water-soluble protein fraction (albumins and
globulins) and alcohol-soluble fraction (prolamins) (Gamel et al., 2005). It can be concluded that
the amaranth proteins are similar to the seed proteins in other dicotyledonous crops such as
legumes, and have no relationship to the major prolamins of cereals.
2.2.3 LIPIDS
Another component of much interest in grain amaranth is its lipid content, which is present in
higher quantity (5 - 8%) than in cereal grains; moreover it is the richest source of squalene
among plant sources (Singhal and Kulkarni, 1988). The lipid content of amaranth is
characterised by a high content of unsaturated fatty acids, with a very high content of linoleic
acid. The lipid content is higher in the germ and seed coat than in the perisperm (Betschart et al.,
1981; Becker, 1994). Tables 2.3 and 2.4 present the crude fat percentage of major grain species
of amaranth and the lipid profile of amaranth oil and grain respectively.
Table 2.3: Crude fat percentage of major grain species of amaranth
(Budin et al., 1996)
Amaranth Specie Crude Fat Percentagea
Amaranthus caudatus 6.6 – 6.8
Amaranthus cruentus 6.3 – 7.8
Amaranthus hypochondriacus 4.7 – 7.0
Amaranthus hypochondriacus x
Amaranthus hybridus
(Plainsman)
7.2
aStandard deviation is considered while calculating the crude fat percentage
Page 30
15
Table 2.4: Lipid profile of amaranth grain oil and amaranth grain (g/100 g)
(Amaranth Institute, 2001a; USDA, 2012
b)
Lipid Amaranth Grain Oila Amaranth Grain
b
Fatty acids, saturated 23.2 1.459
14:0 0.2
16:0 20.2
18:0 3.0
Fatty acids, monosaturated 22.5 1.685
16:1
18:1 25.5
20:1
Fatty acids, polysaturated 49.8 2.778
18:2 49.5
18:3 0.2
Cholesterol 0.0 0.0
Squalene 6.5
Vitamin E 11.0
2.2.3.1 FATTY ACID PATTERN
Amaranth grain has high levels of unsaturated lipids, which account for 76% of the total fatty
acids present, with the saturated/unsaturated fatty acid ratios ranging from 0.12 to 0.50. Studies
have revealed that due to the high unsaturated fatty acid composition of amaranth grain oil it is
capable of controlling hyperlipidemia, hypertension, obesity, and glucose intolerance
(Martirosyan et al., 2007).
The major fatty acids in amaranth oil are linoleic, oleic and palmitic acids. The ranges in fatty
acid profiles of amaranth oil for different species are as follows: linoleic (25 - 62%), oleic (19 -
35%), palmitic (12 - 25%), stearic (2 - 8.6%), and linolenic (0.3 - 2.2%) acid (Cai et al., 2004;
Grobelnik Mlakar et al., 2009). Table 2.5 presents the fatty acids profiles of major amaranth
species.
Page 31
16
Table 2.5: Average fatty acid profiles of amaranth grain species, compared with means of seven other grains
(Budin et al., 1996)
Amaranth
Species & Other
Grains
Fatty Acid (%)
S/U Ratioa Palmitic
16:0
Stearic
18:0
Oleic
18:1
Linoleic
18:2
Linolenic
18:3
All
Others
Amaranthus
caudatus
18.3 3.1 28.0 35.6 0.3 14.7 0.34
Amaranthus
cruentus
15.8 - 20.1 3.2 - 3.8 20.9 - 28.3 37.0 - 43.0 0.0 - 0.7 6.1 - 20.7 0.32 - 0.34
Amaranthus
hypochondriacus
17.9 - 21.8 2.8 - 3.5 16.3 - 29.8 41.1 - 52.5 0.0 - 0.3 5.1 - 16.8 0.34 - 0.36
Amaranthus
hypochondriacus x
Amaranthus
hybridus
(Plainsman)
19.1 3.2 24.7 43.0 0.5 9.5 0.33
Amaranth (mean) 18.5 3.2 22.0 44.8 0.2 11.3 0.33
Barley HW 21.0 0.0 15.6 52.4 5.6 5.4 0.29
Barley Robust 18.5 0.0 15.2 54.0 5.5 6.8 0.25
Buckwheat 18.2 0.0 36.4 34.8 0.0 10.6 0.26
Corn 10.3 0.6 21.4 62.9 0.5 4.3 0.13
Lupin 9.0 0.0 57.5 16.7 10.9 5.9 0.11
Oats 17.3 0.0 39.8 38.5 0.0 4.4 0.22
Wheat 15.4 0.0 22.3 54.2 3.5 4.6 0.19 aS/U ratio = saturated/unsaturated ratio = (16:0 + 18:0)/ (18:1 + 18:2 + 18:3)
2.2.3.2 PHOSPHOLIPIDS
Phospholipids component of amaranth grain oil accounts for around 5% (Becker, 1994). In a
study conducted by Opute (1979), the phospholipids were evaluated at 4% in amaranth oil, in
which the fractions of cephalin, lecithin and phosphoinositol were found to be 13%, 16% and 8%
respectively. However, lecithin is a mixture of many phopholipids that acts as an emulsifier,
enabling oils to form a colloid with water and emulsions made from lecithin are primarily used
as stabilisers for drug delivery and intravenous nutrition in pharmaceutical industries. Currently
lecithin from egg-yolk and soybeans are used as a food additive in many products and can be
purchased as a dietary supplement (Dickinson et al., 1993).
Page 32
17
2.2.3.3 TOCOLS
The tocols have been admitted to have antioxidant (protects against various pollutants,
peroxides, and free radicals), anti-inflammatory (aids in treatment of asthma and arthritis),
antithrombolytic (dissolves blood clots), anticancerous (retards growth and/or proliferation of
some types of cancer cells) properties and prevents from cardiovascular diseases (checks
cholesterol biosynthesis) (Constantinides et al., 2006). The tocol (tocopherols and tocotrienols)
content of amaranth varies from one variety to another. It has been reported that the tocol content
of amaranth is approximately equal to that present in olive oil (191 mg/kg oil) (Becker, 1994),
while others have evaluated the tocol content at about 1465.15 mg/kg (Qureshi et al., 1996).
Budin et al. (1996) found an even higher content of about 2000 mg/kg tocols in amaranth oil. As
presented in Table 2.6, it is evident that the vitamin E content of amaranth is not unique in
relation with other grains; however, the total tocol content of amaranth is only lower than that of
lupin and wheat (Budin et al., 1996).
Page 33
18
Table 2.6: Tocopherol profiles of amaranth grain species and other grains (mg/100 g seed, wb)
(Budin et al., 1996)
Amaranth
Species &
Other Grains
α
Tocopherol
α
Tocotrienols
β
Tocopherol
β
Tocotrienols/
γ
Tocopherol
γ
Tocotrienols
δ
Tocopherol
δ
Tocotrienols
Total
Amaranthus
caudatus
1.47 0.09 1.65 0.16 0.00 0.37 0.00 3.74
Amaranthus
cruentus
1.81 - 2.95 0.00 - 0.05 1.01 - 2.14 0.14 - 0.40 0.00 0.11 - 0.77 0.00 – 0.03 3.15
-
5.75
Amaranthus
hypochondriacus
0.78 - 2.11 0.00 - 0.11 1.50 - 2.68 0.17 - 0.68 0.00 - 0.06 0.25 - 2.05 0.00 - 0.03 2.81
-
6.91
Amaranthus
hypochondriacus
x Amaranthus
hybridus
(Plainsman)
2.02 0.00 1.31 0.39 0.00 0.99 0.00 4.71
Amaranth (mean) 1.66 0.04 2.17 0.29 0.00 0.78 0.00 4.94
Barley HW 0.89 0.85 0.18 0.35 0.46 0.07 0.00 2.80
Barley robust 0.93 0.67 0.14 0.36 0.35 0.03 0.00 2.48
Buckwheat 0.46 0.04 0.00 2.89 0.00 0.15 0.00 3.54
Corn 0.89 0.24 0.18 2.85 0.47 0.10 0.00 4.73
Lupin 0.62 0.05 0.25 6.12 0.17 0.18 0.00 7.39
Oats 1.00 0.54 0.15 0.42 0.00 0.03 0.00 2.14
Wheat 1.13 0.12 0.43 6.20 0.00 0.00 0.00 7.88
2.2.3.4 SQUALENE
Squalene is a highly unsaturated all-trans linear terpenoid hydrocarbon with shark, whale,
deep-sea dogfish liver oil as its traditional sources (Trautwein et al., 1997; Cai et al., 2004;
Naziri et al., 2011). In addition to its presence in fish liver oil, it is a constituent part of human
skin surface lipids, particularly sebum (~500 µg/g dry weight), as well as abundant in adipose
tissue (~300 µg/g dry weight), levels being dependent on age. While the richest plant source of
squalene is amaranth seed oil, which contains approximately 3 to 7% of squalene, a considerably
higher amount than usually found in oils from other cereal grains. Squalene has an application in
pharmaceutical and cosmetics industries as well as uses as an oxidation-resistant industrial
lubricant (Becker et al., 1981; Lyon and Becker, 1987; Becker, 1994; Qureshi et al., 1996; Bruni
Page 34
19
et al., 2001; Escudero et al., 2004; Escudero et al., 2006). Table 2.7 presents the oil content as
well as squalene in oil content of different species of amaranth.
Table 2.7: Oil and squalene in oil percentage of some amaranth species and other seeds
(Lyon and Becker, 1987; Becker, 1994; He et al., 2002; He and Corke, 2003; Gamel et al., 2006)
Amaranth Species and Others Oil (%) Squalene in Oil (%)
Amaranthus caudatus 7.1 4.8
Amaranthus
cruentus
1.9 – 8.5 3.32 – 4.93
Amaranthus
Hypochondriacus
3.03 – 5.97 4.74 – 6.98
Amaranthus
tricolor
5.08 6.14
Corn 4.0 0.03
Cottonseed 7.0 0.01
Rice 1.0 - 3.0 0.3
Olive 36.0 0.4
Peanut 47.0 0.03
2.2.4 VITAMINS
Usually, amaranth is not considered as a significant source of vitamins (Table 2.8). It was
stated by Souci et al., (1994), that amaranth has higher thiamine content than wheat, whereas
Bressani, (1994) reported a lower content of thiamine in amaranth than in most common cereals.
However, undoubtedly amaranth is a good source of riboflavin (vitamin B2), ascorbic acid
(vitamin C), folic acid and tocopherol (vitamin E) (Dodok et al., 1994; Gamel et al., 2006).
Higher vitamin E content leads to enhanced anti-oxidative effects, which in turn increases the
stability of the oil.
Page 35
20
Table 2.8: Vitamin composition of grain amaranth
USDA, (2012)
Vitamins Value/100 g
Vitamin A
(International units)
2.0 IU
Vitamin B1 0.116 mg
Vitamin B2 0.200 mg
Vitamin B3 0.923 mg
Vitamin B6 0.591 mg
Vitamin B12 0.0 µg
Folic acid
(Dietary folate equivalent)
82 µg
Vitamin C
(Total ascorbic acid)
4.2 mg
Vitamin D
(D2 + D3)
(International units)
0.0 µg
0.0 IU
Vitamin E
(α-tocopherol)
1.19 mg
Vitamin K
(Phylloquinone)
0.0 µg
2.2.5 MINERALS
Studies show that amaranth is a good source of minerals compared with other grains and
cereals. Saunders and Becker, (1984) proposed that the bran and germ have higher ash contents
than the perisperm, which accounts for 66% of the total minerals present in grain amaranth. The
mineral content of amaranth is dominated by calcium, magnesium, iron, potassium, and zinc
(Saunders and Becker, 1984; Pederson et al., 1987; Bressani, 1994; Yanez et al., 1994; Gamel et
al., 2006). Nutritionists recommend a calcium/phosphorus ratio (Ca:P) of 1:1.5, while Bressani,
(1994) showed a good value of 1:(1.9 - 2.7) in amaranth. Pederson et al., (1987) witnessed a lot
of variation in the mineral content of different varieties of amaranth which were popped, flaked
and toasted. The pattern of responses for each variety was different under same type of
processing. Table 2.9 presents a comparison of the mineral composition of some grain
amaranths with other food grains.
Page 36
21
Table 2.9: Mineral composition of some grain amaranths compared with other food grain (mg/100 g)
(Singhal and Kulkarni, 1988; USDA, 2012)
Source Ca P Fe Mg Zn Cu Mn Ni Na K
Amaranthus
Caudatus
36 - 170 3.1-8.42 289 4.0 0.8 2.22 0.24 37.0 580
Amaranthus
Cruentus
24.8-389 525-602 3.8-17.4 244-332 3.7-3.96 0.79-1.2 1.92-2.60 1.4-2.4 22-45 290-460
Amaranthus
hypochondriacus
137-249 341-647 7.5-21.7 292-363 3.6-3.9 0.6-0.8 1.9-2.9 6.7-100
Amaranth
(uncooked)
159 557 7.61 248 2.87 4 508
Wheat flour 48 355 11.5 128 2.0 0.5 3.0 370
Oat 50 380 3.8 352
Rice 10 160 3.1 48 0.72 8.0 70
Maize 10 348 2.0 144 0.19 15.9 286
Sorghum 25 222 5.8 140 1.78 7.3 131
Soybean 240 690 11.5 167.7
Bengal lentil 56 331 9.1 138 0.98 73.2
2.2.6 SECONDARY METABOLITES
Unlike primary metabolites such as starch, fat, or proteins, which are mainly involved in the
energy metabolism and synthetic pathways, secondary metabolites are found in minute quantity
and are produced for specific functions by plants. Certain secondary metabolites have been found
to have either positive or negative impact on human health through their pharmacological effects.
2.2.6.1 TOTAL PHENOLIC COMPOUNDS
Many researchers have determined the polyphenolic compounds in terms of tannic acid or
tannins. Tannins are the polyphenolic secondary metabolites of higher plants and are either
galloyl esters and their derivatives, or oligomeric and polymeric proanthocyanidins. The tannins
are mostly concentrated in the hulls of cereals and legumes. Tannins negatively affect the
digestion as well as absorption processes by forming complexes with various nutrients or
digestive enzymes and thus are often referred to as anti-nutritional compounds. Dark amaranth
grains are found to contain more tannins than light ones (104 - 116 mg/100 g vs. 80 - 120 mg/
100 g) (Bressani, 1994). In a study by Becker et al., (1981), ten different samples were tested and
tannins were found ranging from 80 - 420 mg/ 100 g, whereas Breene (1991) established an
Page 37
22
average value of 40 - 120 mg/100 g. However, higher values (410 - 520 mg/100 g) were
recorded when acidified methanol was used as the extraction medium instead of aqueous
methanol in various amaranth species (Bejosano and Corke, 1998).
Klimczak et al., (2002) evaluated the total phenolics in grain amaranth, in terms of ferulic
acid (an alkali-extractable phenolic compound), between 39.17 to 56.22 mg/100 g. Amaranthus
caudatus seeds were reported to have 27% free phenolic acids. The major compounds were
caffeic acid (55.79 μg/g seeds), p-hydroxybenzoic acid (20.89 μg/g), and ferulic acid (18.41
μg/g). Low amounts of protocatechuic acid and salicylic acid were detected as well. However,
thermal treatment or germination has been shown to decrease the content of phenolic compounds
(Klimczak, 2002). Bunzel et al., (2005) examined the amounts of ferulic acid in amaranth’s
insoluble fiber and non-starch polysaccharides. Alkaline hydrolysis liberated 62 mg/100 g trans-
ferulic acid and a high content (20.3 mg/ 100g) of cis-ferulic acid. Three compounds of
feruloylated oligosaccharides were recognized, which implied that ferulic acid is essentially
bound to pectic arabinans and galactans in the amaranth insoluble fiber.
Czerwinski et al., (2004) reported the total phenolics in terms of gallic acid equivalent (Folin-
Ciocalteu reagent), anthocyanins, and flavonoids (spectrophotometrically) in two amaranth
samples. The amounts of polyphenols in the amaranth samples were found to be between 14.72
to 14.91 mg/100 g seeds, that of anthocyanins from 59.6 to 62.5 mg/100 g seeds, and that of
flavonoids from 13.4 to 14.3 mg/100 g seeds.
2.2.6.2 SAPONINS
Saponins are strongly bitter tasting, surface active agents (surfactants), which can cause
intensive foaming activity in aqueous solutions. Saponins have an ability to form complexes with
proteins, lipids (e.g. cholesterol), mineral like zinc & iron and possess a hemolytic effect. Very
little amount of saponins are absorbed in the human body due to their ability to form complexes.
Therefore, saponins are considered as antinutrients as they reduce the bioavailability of proteins
and some minerals which are beneficial for the human body (Chauhan et al., 1992).
Page 38
23
As far as health benefiting effects are concerned, saponins are anticarcinogenic, anti-microbial,
cholesterol decreasing, immune modulating and anti-inflammatory. However, prolonged
ingestion of some saponins can cause intestinal corrosion, which further enhances the absorption
of subsequent doses of saponin, which may cause severe health problems, potentially fatal, due
to systematic toxicity (Price, et al., 1987). The amounts of saponins in grain amaranth are
relatively low. Several amaranth species detected an average of 0.09% (aescin equivalents)
(Dobos, 1992) and these results have been supported by studies conducted by Oleszek et al.,
(1999) and Caudrado et al., (1992). These studies proved the low concentration of saponins in
amaranth seeds, thus ensuring the low toxicity of amaranth-derived products.
2.2.6.3 PHYTIC ACID
Phytic acids are considered as antinutritional compounds because, they are responsible for
forming complexes with basic protein residues, causing inhibition of enzymatic digestive
reactions and interference with the adsorption of minerals, in particular with zinc. Phytates are
present in grain amaranth in the range of 0.2 - 0.6% (Breene, 1991; Bressani, 1994; Escudero et
al., 2004; Gamel et al., 2006). As far as health benefits are concerned, phytic acid has been
shown to help in reducing blood cholesterol (Thompson, 1993). The study by Bressani, (1994)
showed that phytic acid in seeds is uniformly distributed and thus makes its removal from the
seeds difficult. However, recent studies have demonstrated that phytate content is reduced by
cooking (approximately 20%), popping (15%) and germination for 48 hour (22%), which
signifies that these approaches can be applied to reduce the phytate content of amaranth (Gamel
et al., 2006).
2.2.6.4 ENZYME INHIBITORS
The protease inhibitors, e.g. chymotrypsin or trypsin, are considered anti-nutritive as they are
responsible for restricting the activity of proteolytic enzymes by competitive inhibition within the
gastrointestinal tract of animals, thereby diminishing the digestibility of proteins (Liener, 1980).
The content of protease inhibitors in amaranth is very low compared with other cereals. Gamel et
al., (2006) detected trypsin inhibitor activity (TIU) ranging from 3.05 to 4.34 TIU/mg,
Page 39
24
chymotrypsin inhibitor activity (CIU) ranging from 0.21 to 0.26 CIU/mg, and amylase inhibitor
activity (AIU) ranging from 0.23 to 0.27 AIU/mg.
2.2.6.5 PIGMENTS
The red-violet pigment hues present in the leaves, stalk/stems, flower as well as grains of
various amaranth species is a result of betacyanins, which belongs to betalain pigment group. In
amaranth, the betacyanin compounds are recognised as amaranthin and iso-amaranthin (Dixit et
al., 1991; Stintzing et al., 2004; Repo-Carrasco-Valencia et al., 2010). The amaranthin is an
intermediate compound involved in the conversion of nitrogen compounds in the cell (Gins et al.,
2002). Amaranthine has the same basic structure, betanidin (aglucone), as the betacyanines from
red beet. The stability of betanin is higher than amaranthine which can be important if such
pigments are isolated and used as colouring agents in food (Cai et al., 1998). The literatures until
now presents it as a potential colouring agent only.
2.3 INDUSTRIAL APPLICATIONS OF AMARANTH GRAIN OIL
2.3.1 AMARANTH GRAIN OIL: FOR NUTRACEUTICAL INDUSTRIES
2.3.1.1 ANTIDIABETIC EFFECTS
Amaranth oil has been reported to reduce blood sugar levels in animals. The studies by Kim
et al., (2006a; 2006b) have revealed that supplementing diet with amaranth oil may reduce serum
glucose levels and enhance serum insulin levels in streptozotocin-induced diabetic rats and that
these effects may be due to the normalization of liver function enzymes.
2.3.1.2 CHOLESTEROL LOWERING AND ANTI LIPEMIC EFFECTS
Several studies (Berger et al., 2003; Shin et al., 2004; Gonor et al., 2006b; Kulakova et al.,
2006; Martirosyan et al., 2007) have reported that amaranth oil may have beneficial effects in
reducing blood cholesterol. Amaranth is a rich source of tocotrienols (form of vitamin E),
Page 40
25
squalene, and plant stanols, which has been accepted to have cholesterol-lowering effects in
mammals. Shin et al., (2004) and Kulakova et al., (2006) studied the effect of consuming
amaranth oil by rats which exhibited a decrease in total blood cholesterol, triacylglycerol and
liver cholesterol concentration. Experiments on hamster by Berger et al., (2003) showed a
decrease in non-HDL cholesterol (high density lipoprotein; HDL, often called good cholesterol
prevents the occurrence of cardiovascular diseases).
Gonor et al., (2006b) studied the influence of a diet containing amaranth oil on the lipid
profiles and the erythrocyte fatty acid profiles of cardiac ischemia patients. The diets supplied
squalene amounts of 100, 200, 400, and 600 mg/d, and the diet containing 600 mg showed
significant positive changes in the cholesterol and triacylglycerol levels as well as in the
composition of fatty acids of erythrocyte membranes. In addition to that, Martirosyan et al.,
(2007) concluded from their study that human diet containing 18 ml of amaranth oil per day
contributes to an increase in the concentration of polyunsaturated fatty acids, particularly, long-
chain acid of omega 3 families and decrease in total cholesterol, triglycerides, LDL (low density
lipoprotein; LDL, called bad cholesterol, supports the occurrence of cardiovascular diseases) and
VLDL (Very-low-density lipoprotein) in patients suffering from hypertension and coronary heart
disease. Like Gonor et al., (2006b), Martirosyan et al., (2007) also proved the concentration
dependent cholesterol lowering effect of amaranth oil. The interesting feature of the study by
Shin et al., (2004) revealed the fact that amaranth’s squalene results in hypolipidemic effect in
the blood and liver, an increase in fecal and bile acid cholesterol excretion and inhibition of the
HMG-CoA reductase activity, these effects were not observed with shark squalene. Therefore
there has been emerging concern over the unknown role of squalene from amaranth or another
associated substance present in the amaranth oil. The enzyme squalene monooxygenase has
been identified to act as a regulatory site for cholesterol synthesis, and whose inhibition
ultimately results in a decrease of the synthesis of cholesterol (Belter et al., 2011). If diminishing
the activity of squalene monooxynase can help regulate the synthesis of cholesterol, then it is
possible that an inhibitor, or inhibitors (whether direct or indirect), are being co-extracted with
several of the amaranth seed fractions, including squalene itself. Should this new view be proven
correct, it would also explain the intriguing observation made by Shin et al., (2004) that the
squalene from amaranth is not equivalent to shark squalene.
Page 41
26
2.3.1.3 ANTIHYPERTENSIVE EFFECTS
Studies have revealed that amaranth can assist in reducing blood pressure in patients with
coronary heart disease (Gonor et al., 2006b; Martirosyan et al., 2007). This may occur because
amaranth oil is said to influence the fluidity of cell membranes, thereby increasing the movement
of sodium and potassium ions across the cell membrane, which leads to a decrease in blood
pressure (Martirosyan et al., 2007).
2.3.1.4 IMMUNOMODULATORY EFFECTS
Amaranth oil was demonstrated to induce immunomodulatory effects in patients with
ischemic heart disease and hyperlipoproteinemia (Gonor et al., 2006a). Recent studies have
indicated that squalene, a major constituent of amaranth grain oil acts as an immunoadjuvant
(Carlson et al., 2000), suggesting that amaranth may have some intrinsic immunostimulatory
properties.
2.3.1.5 HEPATIC HEALTH IMPROVING EFFECTS
Apart from the anti-diabetic effects of amaranth oil cited by Kim et al., (2006a; 2006b), their
research also reported that feeding rats with amaranth oil resulted in a decrease (normalisation of
liver function enzymes) in AST (aspartate aminotransferase) and ALT (alanine aminotransferase)
enzymes. In addition to that, it improved (reduction) the TBARS (thiobarbituric acid reactive
substances, lipid peroxidation and oxidative stress indexes) levels in the liver cytosol.
Furthermore, diabetic animals, fed amaranth oil, also witnessed a substantial increase in fecal
excretion of cholesterol, triacylglycerols, and bile acids signifying the extensive role of amaranth
oil in improving hepatic health. However, human trials are required to understand its implication
on human liver function.
Page 42
27
2.3.1.6 ANTICARCINOGENIC EFFECTS
During the past few years, some studies have looked at the anticarcinogenic activities of
squalene, a major component of amaranth oil (Senthilkumar et al., 2006). The chemoprotective
effects of squalene in humans have not been studied; however animal models have been reported
to show inhibitory effects of squalene on carcinogenesis (Yamaguchi et al., 1985; Murakoshi et
al., 1992; Desai et al., 1996; Rao et al., 1998; Smith et al., 1998). The study by Rao et al., (1998)
highlighted squalene as an effective inhibitor against colon cancer, whereas, Smith (2000)
showed a reduction in tumour multiplicity in a lung tumourigenesis induced mice. Similarly,
Desai et al., (1996) reported significant reduction in the incidence of skin tumour in skin-tumor
induced mice by treatment with squalene doses.
This chemoprotective effect is attributed to squalene, α – tocopherol and phenolic compounds
(Escrich et al., 2011; Lou-Bonafonte et al., 2012), as these bioactives are available in amaranth
oil and olive oil (Czaplicki et al., 2011). It is evident from many studies (Reddy, 1992; Gerber,
1994; Martin-Moreno et al., 1994; La Vecchia et al., 1995; Trichopoulou et al., 1995; La
Vecchia and Negri, 1997; Newmark, 1997 and Bartsch et al., 1999) that olive oil has a
chemoprotective effect against breast, colon and pancreatic cancers.
2.3.1.7 ANTIOXIDANT EFFECTS
Research studies have revealed the presence of antioxidants like phenolics (Czaplicki et al.,
2011); tocopherols (Berger et al, 2003; Czaplicki et al., 2011) and squalene (Lyon and Becker,
1987; Becker, 1994; He et al., 2002; He and Corke, 2003; Gamel et al., 2006) in amaranth oil.
The polyphenol and tocopherols are well established antioxidants whereas squalene’s antioxidant
properties have only been identified in the last two decades (Saint-Leger et al., 1986; Aioi et al.,
1995; Kohno et al., 1995). Due to the presence of these bioactive compounds in amaranth oil, it
is hypothesised to have antioxidant properties.
Page 43
28
2.3.2 AMARANTH GRAIN OIL: POTENTIAL COSMECEUTICAL INGREDIENT
Amaranth oil has a great potential to be used in cosmetic formulation due to its high
concentration of the bioactive ingredient squalene. Squalene appears not to be very susceptible
to peroxidation as it engulfs singlet oxygen in skin and thereby protects human skin surfaces
from lipid peroxidation caused by UV light exposure and other oxidative damage (Kohno et al.,
1995).
Squalene is identified as a naturally occurring emollient, which can be absorbed deep into the
skin effectively to rejuvenate the suppleness and flexibility of the skin and not leaving an oily
residue (Kohno et al., 1995). Blasco et al., (2006) learned about the optimal composition of
squalene in an oil-in-water emulsion mixture to determine the possibility of finding new
cosmetic emulsion whereas, Rissmann et al., (2008) researched on developing a skin hydrator
similar to vernix caseosa [waxy or cheese-like white substance found coating the skin of
newborn human babies as it facilitates passage through birth canal, moisturises infant’s skin, is
antibacterial in nature, conserves heat and protects the delicate newborn skin from environmental
stresses (Marchini et al., 2002)], for which different lipid fractions were isolated from lanolin
and consequently mixed with squalene, triglycerides, cholesterol, ceramides, and fatty acids to
generate semi-synthetic lipid mixtures that mimic the lipid composition of vernix caseosa. The
results showed that the rate of barrier recovery increased and was comparable to a vernix caseosa
lipid treatment.
2.4 AMARANTH GRAIN OIL EXTRACTION
2.4.1 CONVENTIONAL EXTRACTION
“Solid–liquid extraction or leaching is a separation process affected by a fluid involving the
transfer of solutes from a solid matrix to a solvent. From an engineering viewpoint, solid-liquid
extraction of foods is a multicomponent, multiphase, un-steady state mass transfer operation”
(Aguilera, 2003). This operation may be associated with the transfer of more than one chemical
species – the solute like sucrose, lipids, proteins, phytochemicals and functional hydrocolloids
Page 44
29
from a solid like cane or beets, oilseeds, oilseed meals, plants and algae respectively to a solvent
(Aguilera, 2003).
Soxhlet extraction was developed in 1879 (RSC, 2007) and is still a very well-known, trusted
solid-liquid conventional extraction method and remains the main reference for evaluating the
performance of other solid-liquid extraction methods (Luque de Castro and Garcia-Ayuso,
1998). Later Folch et al., (1957) & Bligh and Dyer, (1959) proposed another solid-liquid
extraction technique for lipids using chloroform/methanol (2:1 v/v) and water phase system.
Opute, (1979) used extraction method by Folch et al., (1957) for studying the fatty acid profile of
various species of amaranth [Amaranthus hybridus, Amaranthus spinosus, Amaranthus tricolor,
Amaranthus arthropurpureus], whereas, Dhellot et al., (2006) compared Soxhlet with the
methods by Folch et al, (1957) & Bligh and Dyer, (1959) to study the chemical composition and
nutritional characterisation of two varieties of Amaranthus hybridus and found variable results.
But in general Soxhlet extraction was largely used to study the lipid profiles of different
amaranth species like Amaranthus caudatus (Gamel et al., 2007), Amaranthus cruentus (Lyon
and Becker, 1987; Singhal and Kulkarni, 1988; Jahaniaval et al., 2000; León-Camacho et al.,
2001; Gamel et al., 2007) and Amaranthus hypochondriacus (Jahaniaval et al., 2000). He et al.,
(2003) determined the oil and squalene contents of 20 different species of Amaranthus including
Amaranthus cruentus and Amaranthus hypochondriacus using the Soxhlet technique.
Traditional extraction methods are very time and solvent consuming coupled with incomplete
extraction from the sample matrix (Luque de Castro & Garcia-Ayuso, 1998). Therefore, in the
past two decades, several novel extraction techniques have been developed and investigated,
most of which were claimed to be better in terms of efficiency, extraction time and solvent
consumption (Ondruschka and Asghari, 2006; Wang and Weller, 2006; Herrero, 2010).
Microwave assisted extractions (MAE), supercritical fluid extraction (SFE), and pressurized
solvent extraction (PSE) are some of the novel techniques which are available.
Page 45
30
2.4.2 MICROWAVE ASSISTED EXTRACTION (MAE)
Over the years, microwave-assisted extraction has drawn significant attention among the
research community in various fields, specifically plant extracts with nutraceutical significance,
due to its special heating mechanism, moderate capital cost and its good performance under
atmospheric conditions (Sparr Eskilsson and Björklund, 2000). Microwaves are non-ionising
electromagnetic radiations with a frequency band between 300 MHz to 300 GHz, causing
molecular motion through migration of ions and rotation of dipoles without altering molecular
structure. Microwaves are stationed between the x-rays and infrared rays in the electromagnetic
spectrum (Letellier and Budzinski, 1999) and propagate with a time interval between peaks
during oscillations, ranging from 3 x 10⁻⁸
to 3 x 10-11
seconds (Venkatesh and Raghavan, 2004).
The heating effect of microwaves depends on their frequency and on the applied power.
2.4.2.1 PRINCIPLE OF MICROWAVE HEATING
The dielectric properties of materials have a major role in the heating effect of microwaves,
which are characterised by two parameters, namely the dielectric constant, ε’ and the dielectric
loss, ε”. The dielectric constant, ε’, is defined as the ability of a molecule to be polarised by the
electric field which at low frequencies, boost up at the amplified amount of energy that can be
stored by the material. The dielectric loss, ε”, describes the degree of efficiency with which the
energy of the electromagnetic radiation can be converted into heat. The dielectric loss is
inversely proportional to the dielectric constant (Kingston and Haswell, 1997). The dissipation
factor, tan δ, is defined as the ratio of the dielectric loss of a material, also known as the “loss
factor,” to its dielectric constant, and measures the ability of the sample to absorb microwave
energy and dissipate it as heat (Zuloaga et al., 1999).
tan δ = ε′/ε (2.1)
When a sample is exposed to a microwave, its energy penetrates the sample and is absorbed at
a rate dependent on its dissipation factor. Materials that are transparent to microwave energy are
considered to have infinite penetration, while zero for materials such as metals which reflect
Page 46
31
microwave. Absorptive samples have a finite dissipation factor because microwaves dissipate
into the sample; hence the energy is rapidly absorbed and dissipated as heat (Smith, 1984). The
higher the dissipation factor of the sample, the lower the microwave energy will penetrate into it,
at a given frequency (Zuloaga et al., 1999).
Heat is generated as a result of microwave application via two mechanisms, ionic conduction
and dipole rotation, which occur simultaneously. When charged particles are allowed to move
without any obstruction through a material, a current will travel in phase with the field, which is
termed as ionic polarisation or ionic conduction [Figure: 2.2 (a)]. Contrary, if the charged
particles are bound within the material, the electric field component will cause them to move
until opposing forces balance the electric force. This leads in dipolar polarisation within the
material. The molecular movement is extremely rapid due to the high frequency of the field, for
example at microwave frequency of 2450 MHz, the polarity changes 2.45 billion cycles/ second
[Figure: 2.2 (b)]. At this frequency, it creates intense heat that can rise as quickly as 10°C per
second. Water is a dipolar molecule and a prominent component of biological materials, its
content directly influences heating. The dielectric heating leads to volumetric heating of the
product (Lew et al., 2002).
(a) (b)
Figure 2.2: (a) Charged particles in a solution will follow the applied electric field
(b) Dipolar molecules which try to align with an oscillating electric field
Adopted from Lidström et al., (2001)
The heating effect caused by the ionic conduction and dipole rotation rely upon the mobility
and concentration of the sample ions and on the relaxation time of the sample. When ion
mobility and concentration of the sample ions both are low, in that case the heating of the sample
will be exclusively influenced by dipole rotation. On the contrary, microwave heating will be
governed by ionic conduction, if there is an increase in sample mobility and concentration,
Page 47
32
furthermore ionic conduction will influence microwave heating and the heating time will not be
aligned with the relaxation time of the solution. Whereas, increase in ionic concentration causes,
the dissipation factor to increase and heating time to decrease. The heating time depends not only
on the dielectric absorptivity of the sample but also on the particular microwave system design
and sample size (Kingston and Howard, 1988).
2.4.2.2 MECHANISM OF MAE
The principle behind microwave assisted extraction (MAE) is different from those of
conventional extraction methodologies because MAE causes changes in cell structure as a result
of electromagnetic waves.
The reason behind the enhanced extraction process and yield in case of MAE may be due to
the co-adjuvant of both transport phenomena (Figure 2.3) heat and mass gradients working in
the same directions (Chemat et al., 2009).
Figure 2.3: (1) Desorption (2) Internal diffusion (3) External diffusion
Basic heat and mass transfer mechanisms in microwave and conventional extraction methods
Adopted from Périno-Issartier et al., (2011)
Page 48
33
Figure 2.4: The extraction process takes place in three different steps
Adopted from Raynie, (2000)
The extraction process takes place in three different steps (Figure 2.4). The extraction process
starts with the equilibrium phase, where the phenomena of solubilisation and partition mediate,
in which the substrate is removed from the outer surface of the particle at an approximately
constant velocity (Raynie, 2000). The equilibrium phase is followed by an intermediary stage
called the transition phase. At the solid–liquid interface, resistance to mass transfer starts to arise;
mass transfer by convection and diffusion exists (Raynie, 2000). Being the last stage of the
extraction process, in the diffusion stage the solute has to break the interactions that bind it to the
matrix and diffuse into the extracting solvent. The rate of extraction in this period is low,
characterised by the removal of the extract through the diffusion mechanism. This point is an
irreversible step of the extraction process; it is often regarded as the limiting step of the process
(Raynie, 2000).
2.4.2.3 MAE MECHANISM IN RELATION TO BIOLOGICAL SYSTEMS
Usually, biological materials are dried prior to extraction, however, even following drying,
the plant cells still contain minute microscopic traces of moisture that serve as the target for
microwave heating. When a plant cell is microwave treated, the moisture inside the cell heats up,
Page 49
34
evaporates and generates tremendous pressure on the cell wall, with swelling of the cell. The
resulting pressure pushes the cell wall from inside which causes stretching and ultimately
rupturing which facilitates leaching of the active constituents from the ruptured cells to the
surrounding solvent thus improving the yield of extraction (Zhou and Liu, 2006). This effect can
even be accentuated, if the plant matrix is permeated with solvents with higher heating efficiency
under microwave. Higher temperature accomplished by microwave radiation can hydrolyse ether
linkages of cellulose, which is the main constituent of plant cell wall, and can convert into
soluble fractions within 1 to 2 min. During MAE, cell wall achieves higher temperature,
intensifies the dehydration of cellulose and reduces its mechanical strength and this in turn helps
solvent to reach compounds inside the cell (Latha, 2006). Furthermore, studies on extraction of
essential oils from plant materials (Luque de Castro et al., 1999), demonstrated that MAE causes
desorption of compounds of interest out of the plant matrix, this happens due to the targeted
heating of the free water molecules present in the gland and vascular systems; results in drastic
expansion due to localised heating followed by rupture of their walls, admitting the flow of
essential oil towards the organic solvent (Garcia-Ayusa et al., 2000).
2.4.2.4 MAE INSTRUMENTATION
2.4.2.4.1 PRINCIPAL ELEMENTS OF MAE DEVICE
The microwave devices consist of four major components; the microwave generator: In
general terms, it’s referred as the “magnetron”; this component produces the electromagnetic
wave at microwave frequencies. The electromagnetic wave is transported by the Waveguide;
this component is responsible for the propagation of microwaves from the magnetron to the
microwave cavity/applicator. The applicator is a site where the sample is placed for the
microwave treatment. The circulator permits the microwaves to pass only in the forward
direction (reducing damage to the microwave generator) (Mandal et al., 2007).
A fan shaped blade is used to achieve uniform randomisation of microwave radiation by
reflecting and mixing the energy entering the microwave cavity from the waveguide.
Page 50
35
This distribution of incoming energy helps the sample to be free from position restriction for
heating (Luque-García and Luque de Castro, 2003).
In general, MAE systems are classified into multi-mode system and focused-mode system
(mono-mode). Multi-mode systems facilitate random dispersal of microwave radiation in a
cavity by a mode stirrer whereas focused systems (mono-mode) concentrate the microwave
radiation on a confined section of the cavity. Generally, multi-mode systems are operated at high
pressure whereas mono-mode systems operate principally under atmospheric pressure. MAE
systems can operate as ‘closed systems’ and ‘open systems’ to refer to the systems that operate
above atmospheric pressure and at atmospheric pressure, respectively (Dean and Xiong, 2000).
Schematic diagrams of both the closed and open systems are depicted in Figure 2.5.
Figure 2.5: (a) Closed type microwave system and (b) open type microwave system
Adapted from Mandal et al., (2007)
2.4.2.4.2 CLOSED MAE SYSTEM
The systems in which the process of extraction is carried out in a sealed-vessel, under uniform
microwave heating, with different modes of microwave radiations are defined as closed MAE
system. The extraction process in this system is carried out under high working pressure and
temperature which results in fast and efficient extraction due to the ability of the extraction
solvent to absorb microwave energy. However, the pressure inside the extraction vessel is
regulated in such a way that it would not exceed the working pressure, whereas temperature is
Page 51
36
controlled above the normal boiling point of the extraction solvent. Although, a closed system
facilitates fast and efficient extraction with less solvent consumption, the thermo labile
compounds with limited sample throughput are more susceptible to degradation with this system.
Recent advancements in the closed system have led to the development of high pressure
microwave-assisted extraction (HPMAE) (Chan et al., 2011).
2.4.2.4.3 OPEN MAE SYSTEM
In open MAE systems, the process of extraction is carried out under atmospheric pressure and
only a part of the vessel is directly exposed to the propagation of microwave radiation (mono
mode). Unlike closed MAE system, it operates under milder conditions and hence, less safety
issues and more appropriate for extracting thermo labile compounds. The upper part of the
system vessel can be linked to a reflux unit to condense any vaporised solvent. It has higher
sample throughput and more solvent can be added to the system at any time during the process. It
is widely accepted for its application in the extraction of bioactive compounds and in analytical
chemistry. Furthermore, recent development has led to the discovery of more efficient MAE
systems like Nitrogen-protected microwave-assisted extraction (NPMAE), Vacuum microwave-
assisted extraction (VMAE), Ultrasonic microwave-assisted extraction (UMAE), Dynamic
microwave-assisted extraction (DMAE), Solvent-free microwave-assisted extraction (SFME),
which can enhance the extraction yield by reducing thermal degradation and oxidation of some
active compounds (Chan et al., 2011).
Page 52
37
PREFACE TO CHAPTER 3
A comprehensive review of literature, presented in Chapter 2, conferred the present state of
knowledge about general characteristics of Amaranthus including their composition and
nutritional properties; nutraceutical and cosmeceutical attributes of amaranth grain oil and its
industrial potential; conventional techniques adopted for extracting lipids from grain amaranth
and an overview of microwave heating, mechanism of microwave assisted extraction and its
instrumentation.
Chapter 3, exhibits the pre-optimisation studies for the selection of operating parameters,
namely sample particle size, extraction solvent and microwave input power. The key parameters
which can determine the experimental domain required further optimising for the extraction of
oil and its constituents, squalene & stigmasterol by central composite rotatable design (CCRD) in
the later study (Chapter 4) which components were identified by a full factorial screening
design. The microwave absorbing capabilities for different solvents combinations are also
examined by calculating the microwave output power.
Part of the research study presented in Chapter 3, has been used to prepare a conference
presentation, as follows.
Joshi, S.P., Orsat, V. (2012). Extraction from Grain Amaranth. Northeast Agricultural and
Biological Engineering Conference (NABEC), Orillia, Ontario, Canada, July 15 – 18.
Chapter 3 is formulated in manuscript style and is soon to be submitted for publication as
follows.
Joshi, S.P., Orsat, V., Gariépy, Y., Raghavan, G.S.V. Pre-Optimisation Studies of
Microwave Assisted Extraction of Lipids from Grain Amaranth.
Page 53
38
The first author of the manuscript and the conference presentation, Mr. Siddhartha P Joshi,
Master’s candidate, Department of Bioresource Engineering, McGill University, conducted the
reviews of literatures, the design of experiment, the practical experimental work in the
laboratory, the statistical analysis and interpretation of results, the writing and the preparation of
this manuscript for publication.
The second author, Dr. Valérie Orsat, Associate Professor and Chair, Department of
Bioresource Engineering, McGill University is the thesis advisor, provided her technical
expertise, and guided the first author of this manuscript throughout all the stages of planning and
executing the experimental work, analysing and interpreting the results, correcting and preparing
the manuscripts for publication.
The third author, Mr. Yvan Gariépy, Research Engineer, Department of Bioresource
Engineering, McGill University, shared his technical expertise in relation to GC-MS.
The fourth author, Dr. G.S. Vijaya Raghavan, James McGill Professor and Graduate Program
Director, Department of Bioresource Engineering, McGill University, shared his technical
expertise at various levels of this study.
Page 54
39
CHAPTER 3: PRE-OPTIMISATION STUDIES OF MICROWAVE ASSISTED
EXTRACTION OF LIPIDS FROM GRAIN AMARANTH
3.1 ABSTRACT
The research presents the studies conducted prior to process optimisation of microwave
assisted extraction (MAE) of lipids from grain amaranth. It identifies the experimental domain
required for resourceful optimisation. Parameter screening studies proved the significance of
wisely choosing sample particle size, extraction solvent and microwave input power. Based on
the outcomes of the parameter screening studies, the experimental domains of interest for a full
factorial design were identified. A 4x3 full factorial design was employed for screening the
following factors: microwave input power with four levels - 80, 120, 160 and 200 W; and the
extraction solvent with three categories – A (MeOH:Hexane = 20:80% v/v), B (EtOH:Hexane =
20:80% v/v) and C (100% Hexane). The microwave absorbing capabilities for solvents were
examined by calculating the microwave output power, for a better understanding of the effects of
solvents on the overall efficiency of MAE.
Key words: Experimental domain, screening studies, microwave input power, extraction
solvents, microwave output power.
3.2 INTRODUCTION
Plant cell material comprises a wide spread of bioactive compounds such as lipids,
phytochemicals, flavors, fragrances and pigments, that find numerous applications in food,
pharmaceutical and cosmetics industries. Extraction methodologies used for eluting out these
valuable bioactive ingredients from plants, play an important role in the determination of the best
quality of the extract obtained at the lowest cost possible to ensure its commercial potential.
The genus Amaranthus is an ancient crop which is still cultivated as a minor crop in Central
and South America and some areas of Asia and Africa. There is a renewed interest in grain
amaranth as it produces grains that contain greater levels of high nutritional quality protein,
Page 55
40
unusual quality of starch, and high-value oil. The oil content of amaranth is high (6-9%) as
compared with cereal grains and is a major source of interest due to its commercially exploitable
constituents specifically squalene (Singhal, and Kulkarni, 1988; Caselato-Sousa and Amaya-
Farfán, 2012). The richest source of squalene is shark liver oil, while amaranth oil, just next to
shark liver oil is the richest plant source of squalene. Interest in more sustainable sources of
squalene has increased recently due to the ban on shark hunting (Fox, 2009). Squalene is a
hydrocarbon and triterpene. It acts as an intermediate in cholesterol, steroid hormones & Vitamin
D biosynthesis in the human body. It is found in humans under the skin and inside the adipose
tissue (Amarowicz, 2009). Squalene has been found to act as an anticancer agent and it has
hypo-cholesterolemic effects. It has a significant commercial use in cosmetics as a moisturising
agent and as a nutraceutical ingredient (Amarowicz, 2009). Another constituent which is of
major importance is stigmasterol, which may significantly reduce the risk of coronary heart
diseases by lowering plasma cholesterol levels without causing noticeable side effects.
Stigmasterol is also reported to have anti-cancer properties and can play an important role in
helping the absorption of fat soluble vitamins & antioxidants (Moreau et al., 2002).
The most accepted and trusted conventional method of lipid extraction is Soxhlet extraction,
which has been used for a long time as the main reference for evaluating the performance of
other solid–liquid extraction methods. It is a very time and solvent consuming process with
incomplete extraction from the sample matrix (Luque de Castro & Garcia-Ayuso, 1998). To
improve efficiency and reduce the environmental footprint of solvent use, there has been an
increase in demand for new extraction technologies. For that purpose, microwave assisted
extraction (MAE) has been considered as a potential alternative to conventional extraction
technologies for its shorter extraction time, consuming less solvent coupled with higher
extraction rates with better product quality (Delazar et al., 2012). For efficient MAE, the
operating factors of the extraction process must be first optimised. The experimental factors
which determine the performance of MAE processes using a mono-mode open microwave
system include the sample matrix characteristics & size, solvent nature & volume, extraction
time, microwave power and temperature (Tatke and Jaiswal, 2011). The sample matrix
characteristics, including the sample particle size and the condition of the sample as it is prepared
Page 56
41
for MAE, play an extensive role in the effective recovery of desired compounds (Wang and
Weller, 2006).
For this purpose, parameter screening experiments were carried out to investigate the effect of
particle size on MAE process using hexane as a solvent with a microwave input power of 80 W;
for which whole and ground samples were considered. The particle size that obtained higher oil
yield was chosen for further studies.
Correct solvent choice is a fundamental requirement for the optimisation of MAE as the
solvent type will affect the solubility of the target compounds, interaction between solvent &
sample and microwave absorbing properties of the solvent (Letellier et al., 1991). Hexane is the
primary used solvent in the industry for extracting oil from oil seeds and has one of the best
solubility for non-polar compounds like oil (Kim and Yoon, 1990; Köseolğua and Engelgau,
1990; Bhagya and Srinivas, 1992; Srinivas et al., 1992; Wanasundara and Shahidi, 1994;
Dominquez et al., 1995; Lawson, 1995; Proctor and Bowen, 1996), however, it is transparent to
microwave energy hence does not heat-up sufficiently for an effective mass transfer during MAE
process, whereas polar solvents like methanol & ethanol have higher microwave absorbing
capacity as compared to hexane and heat up much better (Kiss, 2000). Previous MAE studies
(Zhou and Liu, 2006) have demonstrated that mixing polar solvents with hexane enhances the
microwave extraction process.
The preliminary trials of this study have confirmed that hexane is an inefficient MAE solvent
for releasing oil from amaranth grain matrix in terms of its yield as compared to conventional
Soxhlet extraction.
Similarly the intensity of the microwave input power also acts as a deciding factor for an
effective MAE process. The microwave input power and the temperature developed during MAE
processes are closely related to each other. To some extent, the rise in microwave input power is
directly proportional to the rise in temperature of the extraction mixture of solvent and sample,
per unit time. This rise in temperature promotes better leaching efficiency of target compounds
from the active sites of the sample matrix, since higher temperatures result in a decrease of
Page 57
42
surface tension & solvent viscosity as well as cause an enhancement of the solubility of the
extract in the solvent (Tatke and Jaiswal, 2011). However, high temperatures may cause
detrimental effects, such as deterioration of thermo-labile compounds present in the extract and
safety concerns associated with the high pressure development inside the microwave reactor
which can lead to bursting of the microwave reactor and/or its content; therefore greater care
should be taken to carefully select the microwave input power to control the rise in temperature
and avoid detrimental excess temperatures (Sihvonen et al., 1999).
Moreover, in the last decade there have been various studies on MAE (Chemat et al., 2005;
Hu et al., 2008; Xiao et al., 2008; Nemes and Orsat, 2011; Routray and Orsat, 2011, Singh et al.,
2011; Krishnaswamy et al., 2012), that established the significance of regulating the microwave
power level during the development and the optimisation of MAE processes for the extraction of
natural compounds. The successful control of microwave power during MAE processes depends
on using proper calibration and in understanding how the instrumentation can control the
incident power level. The actual power absorbed by the system as it relates to the output power
can be calibrated by knowing the value of the function ΔT (temperature difference developed in
the system due to microwave heating). It enables the calculation of the microwave absorbed
power using a calorimetric equation P = (MCpΔT)/t [where P is the absorbed microwave power
by the system (W); M is the weight of the system (g); Cp is the heat capacity (J g-1
°C-1
); T is the
temperature rise (°C); t is the heating time (s)].
For most of the focussed mono-mode microwave systems, the reaction temperature is
generally measured by a calibrated external infrared (IR) sensor, unified into the cavity that
identifies the surface temperature of the reaction vessel from a predefined distance. It is assumed
that the measured temperature on the outside of the reaction vessel will be more or less in
agreement with the temperature of the reaction mixture contained inside but this cannot be
applied in every case. Contrary, due to heat reflux system, the reactor walls are typically the
coldest spot of the reaction system as compared to conventional heating as the energy conversion
using microwave energy takes place directly within the reaction mixture (Leadbeater et al., 2005;
Nüchter et al., 2005; Kremsner and Kappe, 2006; Hosseini et al., 2007; Herrero et al., 2008).
Page 58
43
In addition, an external IR sensor cannot record actual rise in temperature of the reaction
mixture unless, the mixture has been sufficiently agitated. Inefficient agitation can lead to
temperature gradients within the reaction mixture due to field non-homogeneities in the high
density mono-mode microwave cavities (Herrero et al., 2008). Moreover, these discrepancies
will be further aggravated in recording real temperature of reaction mixture by external IR sensor
if the composition of reaction medium includes a mixture of material and/or solvents, where one
of it is strongly microwave absorbing while the other weakly absorbing or transparent (Kremsner
and Kappe, 2006). Similar situation existed in this study where hexane (microwave
transparent/weakly absorbing) was mixed with methanol or ethanol (strongly microwave
absorbing) to be used as the extraction solvent and experiments were carried out in a focussed
mono-mode microwave unit which lacked a stirring system.
Hence the above mentioned factors were considered in the determination of the value of the
ΔT function, by measuring the temperature of the solvent mixture before and after the
microwave treatment with the help of a type K thermocouple following brief and vigorous
stirring, to calibrate the amount of power absorbed.
This paper presents the pre-optimisation study which was conducted using a full factorial
design with preliminary experiments to identify the experimental domain of interest, such as
optimum solvent composition as well as microwave input power required for future resourceful
optimisation using response surface experimentation.
3.3 MATERIALS AND METHODS
3.3.1 GRAIN AMARANTH
Amaranthus (cv. Plainsman) was obtained from the Emile A. Lods Agronomy Research
Centre, McGill University, Ste-Anne-de-Bellevue, QC, Canada. It was manually cleaned by
winnowing method to remove dust particles and fine straws. The cleaned grain amaranth was
coarsely ground in a coffee grinder (Bodum, Model: 10903) for 1.5 minutes to achieve fine
quality powder, the process was stopped at 15 seconds interval for 1 minute to avoid over
Page 59
44
heating of the sample. To ensure uniform particle size of the amaranth grain flour (AGF), it was
passed through an ASTM E-11 (No: 35; Tyler equivalent: 32 mesh) standard test sieve (W.S.
Tyler, St. Catharines, ON, Canada) and confirmed 500 µm particle size. The AGF was then
stored in an air tight glass bottle (wrapped with aluminium foil) at -4°C until further analysis.
The moisture content (12.39% wet basis, SD = 0.23) was determined in triplicate by drying 10 g
of AGF at 105°C for 24 hours.
3.3.2 STANDARDS AND SOLVENTS
Squalene (neat) and stigmasterol (95% pure) standards were purchased from Sigma Aldrich
(St. Louis, MO, USA). Hexane & methanol of ACS HPLC grade were procured from Fisher
Scientific (Fair Lawn, NJ, USA) and anhydrous ethanol was obtained from Commercial
Alcohols (Brampton, ON, Canada)
3.3.3 SAMPLE PREPARATION
Prior to each extraction, AGF (moisture content 12.39% wb, SD = 0.23) was freeze dried for
24 hours to maintain constant moisture content of the sample throughout the extraction
experiment. The freeze dried AGF (moisture content 5.1% wb, SD = 0.06) was sealed
immediately with Para film (Bemis Flexible Packaging, Neenah, WI, USA), after taking it out of
the freeze dryer to avoid alteration in moisture content and was incubated to reach room
temperature before the extraction process.
3.3.4 HEATING PATTERN STUDIES AND MICROWAVE OUTPUT POWER
CALIBRATION OF MAE SYSTEM FOR DIFFERENT SOLVENT
COMBINATIONS
The output power in the mono-mode (focused) cavity of MAE system (Star System 2, CEM,
Matthews, USA; operating at 800 W maximum power and 2,450 MHz frequency) was calculated
in triplicate for different solvents (A – MeOH:Hexane = 20:80 %v/v; B – EtOH:Hexane = 20:80
%v/v; C – 100% Hexane) irradiated for 30 s at microwave input power of 80, 120, 160, 200, 240
Page 60
45
and 280 W. A modified version of the calorimetric method developed by Nemes, (2012) was
adopted, for which fresh loads of 50 ml of solvent (weight: A = 164.27 g; B = 164.19 g; C =
162.86 g) in 250 ml volume borosilicate glass vessel (Montreal Glass Blowing Inc, Notre-Dame-
De-L'Ile-Perrot, QC, Canada) with the initial temperature of 21 ± 3°C was used. The solvent
temperature was recorded before and after irradiating the solvent with a type K thermocouple
after briefly and vigorously stirring the solvent with a glass rod. To minimise the errors due to
heat loss to the surroundings, the mass of the container that was in contact with the solvent was
taken into consideration [as opposed to not accounting for the mass of the container (Cheng et
al., 2006; Costa et al., 2001; Kingston and Jassie, 1986)], and by decreasing the heating time [30
s in this experiment as opposed to 1 min used by Costa et al. (2001) and 2 min used by Kingston
and Jassie (1986)]. The absorbed power was calculated using the following Equation 3.1:
(3.1)
Where, P = the actual microwave power output [W]
Ms = the mass of solvent [g]
Mv = the mass of the borosilicate glass vessel [g]
Cps = the specific heat of solvent [J/(g °C)]
Cpv = the specific heat of borosilicate glass [0.75 J/(g °C)]
ΔT = the temperature difference [°C]
t = the time of heating [s]
3.3.5 MAE OF LIPIDS FROM AGF
All MAE experiments were carried out in triplicate in the batch mode with a mono-mode
(focused) open – vessel microwave system (Star System 2, CEM, Matthews, USA) operating at
800 W maximum power and 2,450 MHz frequency. The freeze dried AGF (10 g) along with 50
ml solvent were placed inside 250 ml volume borosilicate glass vessel (Montreal Glass Blowing
Inc, Notre-Dame-De-L'Ile-Perrot, QC, Canada). The reaction mixture was vigorously stirred for
3 minutes to evenly distribute the solvent through the AGF matrix. The vessel was introduced
Page 61
46
into the microwave cavity equipped with a reflux system. All the microwave extractions were
performed under a set input microwave power (80, 120, 160 and 200 W) for a known period of
time (10 min) in 50 ml of solvent (A – MeOH:Hexane = 20:80 %v/v, B – EtOH:Hexane = 20:80
%v/v, C – 100% Hexane). The power levels used for the experiments were expressed as a
percentage of the power supplied within the microwave cavity as per the cavity’s calibration.
Immediately after taking out the borosilicate glass vessel from the microwave cavity, the reaction
mixture was once again vigorously stirred for 3 minutes to aid proper heat distribution as well as
mass transfer between the AGF and the solvent. The extract thus obtained was separated from
the AGF using vacuum filtration with 70 mm (diameter) circular filter paper (Whatman,
Buckinghamshire, UK). To ensure complete separation of the extract from the AGF, the AGF
was further rinsed with solvent of HPLC grade. Finally, the oil was separated from the solvent
using a Rotavap (Buchi R-205) operating at 100 rpm, coupled with a heating water bath (Buchi
B- 490) set at 80°C.
3.3.6 SOXHLET EXTRACTION OF LIPIDS FROM AGF
All Soxhlet extraction experiments were carried out in triplicate in the batch mode using an
extraction unit composed of Supelco Soxhlet apparatus united with a condenser at its top and a
250 ml distillation flask with magnetic stirrer at its bottom placed on heating plate. The cellulose
extraction thimble (Whatman International Ltd, Maidstone, England) filled with known quantity
of freeze dried AGF (36 g), was placed inside the thimble - holding the cavity of the Soxhlet
apparatus. During the operation, fresh solvent condensate from the distillation flask falls over
AGF placed inside the thimble, which gradually assists in desorption of the lipids from AGF into
the solvent condensate pool surrounding it within the thimble-holding cavity of the Soxhlet
apparatus. When the liquid reached the overflow level, a siphon aspirated the solution (AGF
lipids – solvent mixture) of the thimble holding cavity and unloaded it back into the distillation
flask carrying the extracted analytes into the bulk liquid. This operation was repeated for the
known time and the oil was separated from the solvent using a Rotavap (Buchi R-205) operating
at 100 rpm, coupled with a heating water bath (Buchi B- 490) set at 80°C.
Page 62
47
3.3.7 CALCULATION OF OIL YIELD (%)
The yield percentage of oil was determined gravimetrically by the following expression
(Equation 3.2); where MAGF is the mass of AGF (g) and MO the mass of extracted oil (g) for
both MAE and Soxhlet.
Oil Yield % = (MO/ MAGF)100 (3.2)
3.3.8 PARAMETER SCREENING STUDY
The parameter screening study was carried out in triplicate to investigate the effect of particle
size on oil yield only, through MAE using Soxhlet as control technique, for which whole and
ground (500 µm particle size) samples were considered. For better comparability both MAE and
Soxhlet extraction were conducted with same sample to solvent ratio (MAE: 10 g AGF/50 ml
solvent; Soxhlet: 36 g AGF/180 ml solvent) using solvent C (hexane). Time of extraction for
MAE was 10 min whereas for Soxhlet it was 90 min [time for Soxhlet extraction was selected
based on Lopez-Avila et al., (1994); Pan et al., (2002)].
3.3.9 EXPERIMENTAL DESIGN
A 4x3 full factorial screening design (FFSD) as presented in Table 3.1, was formulated to
identify the key parameters which can determine the experimental domain required to optimise
the oil extraction from AGF by central composite rotatable design (CCRD) in the later study
(Chapter 4) using JMP10 software by SAS (SAS Institute Inc., Cary, NC, USA). For this
purpose, a design was developed with 12 combinations consisting of one continuous factor:
microwave input power with four levels - 80, 120, 160 and 200 W; another categorical factor:
extraction solvent with three categories – A, B and C.
Page 63
48
Table 3.1: Independent variables in MAE FFSD
Independent Variables Variable Types Values
Microwave Input Power (W) Continuous 80 120 160 200
Solvent Categorical A B C
Solvent (A–MeOH:Hexane = 20:80% v/v; B–EtOH:Hexane = 20:80% v/v; C–100% Hexane)
3.3.10 SAMPLE PREPARATION FOR GC-MS ANALYSIS
All the samples for GC-MS analysis were prepared as follows: 50 ml of HPLC grade Hexane
solvent was added to 500 mg of amaranth grain oil under magnetic stirring for 10 min and was
then kept for 4 hours without stirring or moving at room temperature to allow all the solid phase
to settle down. The liquid phase was then filtered using syringe filters into capped vials and was
analysed by GC-MS.
3.3.11 GC-MS ANALYSIS FOR SQUALENE AND STIGMASTEROL
QUANTIFICATION
The quantification was carried out in six replicates per sample by employing an Agilent
Technologies 6890 network GC system coupled with Agilent Technologies 5973 network mass
selective detector and Agilent Technologies 7683 auto-injector in split mode. A vial of each
sample was injected into the gas chromatograph at a split ratio of 50:1. Separation of samples
was achieved on a HP-5 MS capillary column that was 30 m in length, 0.25 mm in internal
diameter, and had a 250 μm coating thickness. Helium was used as a carrier gas at a flow rate of
1.0 ml/min and pressure 72394.98 Pa (10.5 psi). The injector and transfer line temperatures were
both set at 300°C. The oven temperature program was as follows: initial temperature 100°C held
for 3 min and was increased to 250°C at 10°C/min. From 250°C it was further increased to
300°C at 5°C/min where it was held for 15 min. The concentrations of squalene and stigmasterol
were calculated in all samples by means of their peak areas. The calibration curve for squalene
standard was obtained by using concentrations of 0.25, 0.50, 0.75 and 1.0 mg/ml whereas the
calibration curve for stigmasterol standard was obtained by using concentrations of 0.01, 0.02,
0.03 and 0.04 mg/ml. The regression equation obtained from the calibration curves were utilised
to quantify the amount of squalene (Equation 3.3; R2 = 0.9947) and stigmasterol (Equation 3.4;
R2 = 0.9924) in the amaranth grain crude oil in mg/g of oil.
Page 64
49
Squalene (mg/g of oil) = (4 x Peak Area x 10-6
) + 0.0323 (3.3)
Stigmasterol (mg/g of oil) = (4 x Peak Area x 10-6
) + 0.0007 (3.4)
3.3.12 EFFECT OF HIGH TEMPERATURE (100°C) ON SQUALENE AND
STIGMASTEROL CONTENTS OF AMARANTH GRAIN OIL
In this study, stability of squalene and stigmasterol present in the amaranth grain oil was
determined in triplicate by exposing 500 mg of oil to a constant high temperature of 100°C in
presence of oxygen in a hot air oven. The period of exposure was varied at 10, 20, 30, 40, 50, 60
min.
3.3.13 EFFECT ON MICROWAVE ABSORBING CAPACITY OF METHANOL –
HEXANE MIXTURE BY VARYING THE CONCENTRATION OF METHANOL
IN HEXANE
Methodology which was discussed in the section 3.3.4 was adopted to study the microwave
power absorption for different concentrations of MeOH in hexane at a fixed microwave input
power of 120 W.
3.4 RESULTS AND DISCUSSION
3.4.1 HEATING PATTERN OF SOLVENTS A, B AND C UNDER MICROWAVE
WITH ACTUAL MICROWAVE POWER OUTPUT CALIBRATION
A couple of reported studies (Baghurst and Mingos, 1992; Chen and Spiro, 1994) have been
conducted in the past to examine the heating pattern of various solvents under microwave
heating.
Page 65
50
Figure 3.1: Microwave heating profiles of solvents A, B and C at various microwave powers
Figure 3.1 clearly illustrates that value of ΔT continues to rise with an increase in power level
for all the three solvents. The highest growth was seen in case of solvent B as it was composed of
a strong microwave absorbing solvent, EtOH [loss tangent tan δ = 0.941 at 2.45 GHz, 20°C;
Hayes (2002)] with hexane while solvent A was placed second as it was composed of a
moderately microwave absorbing solvent, MeOH [loss tangent tan δ = 0.659 at 2.45 GHz, 20°C;
Hayes (2002)] with hexane whereas, solvent C which was purely hexane [loss tangent tan δ =
0.020 at 2.45 GHz, 20°C; Hayes (2002)] saw a very slight increase in temperature. Drastic
increases in temperature rise were observed with an addition of just 20% MeOH (solvent A) or
EtOH (solvent B) in hexane as compared to pure hexane (solvent C). This linear relationship
between microwave input power and ΔT in case of solvent A and B was noticed until microwave
input power of 280 W, when the microwave input power was raised beyond 280 W, both solvent
A and B under went powerful internal explosion which resulted in lifting of the
condensing/reflux system. Even Saillard et al., (1995) reported similar but mild explosions under
microwave heating of EtOH but not in the case of MeOH. The reason behind this phenomenon
was over heating of pockets of solvents. This rapid increase of temperature under microwaves
caused a quick increase of the internal pressure, which could be potentially dangerous in the
absence of a safety apparatus (Peterson, 1993). Hence due to safety as well as repeatability
Page 66
51
concerns associated with these experiments, actual microwave output power values were
calibrated not beyond microwave input power level of 280 W. Hence the regression equations of
microwave output power for all the three solvents A, B and C were obtained at input microwave
powers of 80, 120, 160, 200, 240 and 280. The R2
values of regression equation for solvent A
(Equation 3.5), B (Equation 3.6) and C (Equation 3.7) are 0.9986, 0.9966 and 0.9841
respectively.
Table 3.2: Microwave output power regression equations for solvent A, B and C
Solvent Regression Equation
A Microwave Output Power = 0.5060 (Microwave Input Power) + 15.5170 (3.5)
B Microwave Output Power = 0.5533 (Microwave Input Power) + 15.4960 (3.6)
C Microwave Output Power = 0.0187 (Microwave Input Power) + 0.67540 (3.7)
If the complexity of the heating mechanism for dielectric materials is taken into
consideration, the results obtained in these equations might not reflect the true microwave power
output because heating efficiency under microwave irradiation is influenced by many factors
including specific heat, thermal conductivity and structure of the material. Specific heat is an
important property in the thermal behavior of the material subjected to microwaves as it keeps
changing with the rise in temperature of the material (Peyre et al., 1997). However, this
calorimetric method is widely used by manufacturers (Cheng et al., 2006; Swain et al., 2006;
Tanongkankit et al., 2013) and accepted due to its simplicity and practicality.
3.4.2 OUTCOMES OF PARAMETER SCREENING STUDY
Results obtained from the preliminary study acknowledged the importance of choosing
optimum sample particle size, extraction solvent type and microwave input power for MAE
processes. The ground sample showed better recovery than whole sample, but there was an
interesting observation which was noticed while carrying out MAE using whole grains; most of
the experiments could not succeed or move forward after 3 min of process, due to the formation
of high cavitation, bubbling of the sample which led to the entry of the reaction mixture into the
condenser. Even though some of the experiments worked well using whole sample, due to safety
Page 67
52
concerns, loss of repeatability and low oil yield compared to ground sample, further experiments
were carried out using only ground samples.
Even ground samples could not achieve convincing results with MAE operating at 80 W
microwave input power using hexane as the extraction solvent, when compared with
conventional Soxhlet extraction. The oil yield recovery from MAE was 5.9% whereas from
Soxhlet it was 7.2% which means that the efficiency of MAE was almost 18% lower than
Soxhlet.
Such observations from MAE forced the study to look for and identify the experimental
domain within which an optimum combination of factors would maximise the extraction yields
of oil. Alfaro et al. (2003) reported similar results while conducting MAE of ginger using
hexane, which gave a lower yield than Soxhlet, on the other hand the use of EtOH, as the
extraction solvent, gave significantly higher yield than for Soxhlet - EtOH extraction. This can
be explained in reference to the difference in dielectric properties of the solvents (refer to section
3.4.1). MeOH and EtOH are relatively good absorbers of microwave energy but they are not
good extraction solvents for oils while hexane is a good extraction solvent for oils but not a good
microwave absorber. Therefore it was decided that the best way to gain both efficacy and
selectivity for the MAE of oil, it is necessary to mix the solvents and hence three different
solvent combinations were considered - A (MeOH:Hexane = 20:80% v/v), B (EtOH:Hexane =
20:80% v/v) and C (100% Hexane). Moreover, it was determined that microwave input power of
80 W was not sufficient for resourceful extraction, hence four levels of microwave input power
were selected: 80 W, 120 W, 160 W and 200 W. A full factorial screening design (FFSD) was
operationalized to screen out the optimum solvent composition as well as the microwave input
power required to maximise the yield of oil, squalene and stigmasterol during MAE processes.
3.4.3 INTERPRETATION OF MAE FFSD
FFSD was employed as described in the experimental design section to scrutinise the best
process factors combinations required to maximise the yield of oil, squalene and stigmasterol.
The layout of the design, with mean (triplicate) values of responses, is presented Table 3.3. The
Page 68
53
analysis of variance (ANOVA), regression plot, factorial surface plot and actual by predicted
plot for each response are presented individually.
Table 3.3: MAE FFSD with observed response for oil, squalene & stigmasterol
Design
Points
Microwave Input Power
(W)
Solvent Oil Yield
(%)
Squalene Yield
(mg/g of oil)
Stigmasterol Yield
(mg/g of oil)
1 80 A 8.67 57.63 2.415
2 80 B 7.76 55.32 2.337
3 80 C 5.9 49.98 2.056
4 120 A 8.79 57.75 2.45
5 120 B 7.89 55.45 2.31
6 120 C 6.68 43.68 1.63
7 160 A 8.78 56.71 1.88
8 160 B 7.89 51.46 1.56
9 160 C 6.76 38.91 1.07
10 200 A 8.7 49.29 1.27
11 200 B 7.8 44.28 1.12
12 200 C 6.74 32.6 0.57
3.4.3.1 MAE FFSD OIL YIELD (%)
The ANOVA (Table 3.4) revealed that tested factors were significant for oil yield (%) at P
value < 0.0001 with a R2 value of 0.9809, which was in agreement with the adjusted R
2 of
0.9649. This implied that the model was fitted well and could be used to predict the oil yield
from grain amaranth by MAE.
Table 3.4: MAE FFSD ANOVA for oil yield (%)
Oil Yield (%)
R2
= 0.9809; R2 Ajusted = 0.9649
Source of Variation df Sum of
Squares
Mean
Square
F Ratio Prob >F
Microwave Input Power 1 0.1307 0.1307 3.9130 0.0953
Solvent 2 9.9273 4.9636 148.6414 <0.0001
Microwave Input Power x Solvent 2 0.2084 0.1042 3.1200 0.1178
Model 5 10.2663 2.0533 61.4872 <0.0001
Error 6 0.2004 0.0334
Total 11 10.4667 0.9515
Page 69
54
Figure 3.2: MAE FFSD process factors effects on oil yield
The model, factorial surface plot (Figure 3.2) and regression plot (Figure 3.3; left)
confirmed that the extraction solvent (P value <0.0001) had a major implication on oil yield,
specifically solvent A which showed significant positive impact, while on the other hand solvent
C showed a significant negative impact on yield whereas, solvent B could not contribute to an
extent to achieve the goal of maximising oil yield.
Solvent A resulted in almost 10 % more oil yield than solvent B for microwave input powers
of 120 W and 180 W. Although the microwave input power did not have a compelling effect on
yield, when the power was raised from 80 W to 120 W, there was a slight increase in yield; then
the oil yield remained almost constant at 160 W however, further increase in power from 160 W
to 200 W caused a little yield reduction in case of both solvent A and B, which indicates that
there is limit to positive impact of increasing input power on oil yield. In case of solvent C, a
linear increase in oil yield was noticed with an increase in power level until 120 W and then
started reducing with further increase in power level. Additionally, at input power of 160 W,
AGF was found to be scorched with the use of solvent C, while the extraction that took place at
200 W resulted in scorching of AGF for all the solvent categories i.e. A, B and C. The point to be
noted was that the scorching didn’t have massive detrimental effect on oil yield contrarily,
Page 70
55
solvent C gave a better yield at 160 W than 120 W and a very slight decrease at 200 W as
compared to 160 W. Based on visual observation, maximum scorching was discovered with the
extraction which took place at 200 W with solvent C, the reason being that the solvent C is
composed of only hexane which is microwave transparent so most of the microwave power was
absorbed by AGF, at high microwave power of 200 W.
Figure: 3.3 MAE FFSD Regression plot (left); Predicted vs actual plot (right) for oil yield (%)
The mean value of oil yield for twelve response observations was 7.37 % (intercept value)
with a standard error of 0.1733, which can be maximised if the extraction takes place at input
power level of 120 or 160 W using solvent A. The R2
value for predicted vs actual plot (Figure:
3.3; right) was 0.98 at P value < 0.0001. Hence this model can be used to predict oil yield (%)
under different experimental conditions during MAE.
3.4.3.2 MAE FFSD SQUALENE AND STIGMASTEROL YIELD (mg/g of Oil)
The ANOVA revealed that the model was significant for squalene (Table 3.5) as well as for
stigmasterol (Table 3.6) yields at P value = 0.0004 with a R2 value 0.96 and P value = 0.0009
with a R2 value = 0.95 respectively. Even the adjusted R
2 values for squalene (0.9248) and
stigmasterol (0.9048) yields were in reasonable agreement with their respective R2 values. This
implied that the model was well fitted and could be used to predict the yields of squalene as well
as stigmasterol from grain amaranth by MAE.
Page 71
56
Table 3.5: MAE FFSD ANOVA for squalene yield (mg/g of oil)
Squalene Yield (mg/g of oil)
R2 = 0.96; R
2 Adjusted = 0.9249
Source of Variation df Sum of Squares Mean Square F Ratio Prob > F
Microwave Input Power 1 240.3201 240.3201 48.9635 0.0004
Solvent 2 424.1397 212.0699 43.2078 0.0003
Microwave Input Power x
Solvent
2 24.4311 12.2156 2.4888 0.1633
Model 5 688.8909 137.778 28.0713 0.0004
Error 6 29.4489 4.908
Total 11 718.3398 65.3036
Table 3.6: MAE FFSD ANOVA for stigmasterol yield (mg/g of oil)
Stigmasterol Yield (mg/g of oil)
R2 = 0.95; R
2 Adjusted = 0.9049
Source of Variation df Sum of Squares Mean Square F Ratio Prob > F
Microwave Input Power 1 3.0034 3.0034 82.2041 0.0001
Solvent 2 0.9757 0.4878 13.3523 0.0062
Microwave Input Power x
Solvent
2 0.0261 0.0130 0.3567 0.7139
Model 5 4.0051 0.8010 21.9244 0.0009
Error 6 0.2192 0.0365
Total 11 4.2243 0.3840
The model indicated both independent factors, microwave input power and solvent type, were
significant as their P values were less than 0.05 and proved to have greater role on squalene as
well as stigmasterol yield than the dependent factors.
The effect of process factors on squalene and stigmasterol yield is well illustrated in the
following figure (Figure 3.4). The surface plot revealed that Solvent A, which is a statistically
significant factor level, positively influenced the most, the yield of both squalene and
stigmasterol whereas, solvent C caused a significant negative impact. Linear increase in squalene
and stigmasterol yield was observed in case of solvent A & B with an increase in input power
from 80 W to 120 W, in fact the highest yield was seen at 120 W and started diminishing with
further increase in power.
Page 72
57
Figure 3.4: MAE FFSD process factors effects on squalene yield (left) and stigmasterol yield (right)
Whereas, when the extraction of amaranth grain oil was performed using solvent C, a linear
decrease in squalene and stigmasterol yield was noticed with a linear increase in input power
level. So unlike oil yield, scorching of AGF did affect the yield of both squalene as well as
stigmasterol. This implies that the extract quality was degraded with an increase in the input
power level after a certain limit which depended upon the solvent used.
Figure: 3.5 MAE FFSD Regression plot (left); Predicted vs actual plot (right) for squalene yield
The mean value of squalene yield for twelve response observations was 63.431 mg/ g of oil
(intercept) with standard error: 2.1017, which can be maximised if the extraction takes place at
input power level of 120 W using solvent A (Figure: 3.5; left). The R2 value for predicted vs
Page 73
58
actual plot (Figure: 3.5; right) was 0.96 at P value = 0.0004. Hence this model can be used to
predict squalene yield (mg/g of oil) under different experimental conditions during MAE.
Figure: 3.6 MAE FFSD Regression plot (left); Predicted vs actual plot (right) for stigmasterol yield
The mean value of stigmasterol yield for twelve response observations was 3.2885 mg/g of oil
(intercept) with standard error: 0.1813, which can be maximised if the extraction takes place at
input power level of 120 W using solvent A (Figure 3.6; left). The R2 value for predicted vs
actual plot (Figure 3.6; right) was 0.95 at P value = 0.0009. Hence this model can be used to
predict stigmasterol yield (mg/g of oil) under different experimental conditions during MAE.
Moreover, when the focus of attention was diverted towards the model’s scaled estimates, the
conclusion that could be made, by looking at the regression coefficient values for solvent A and
C, proved solvent C as a powerful negative factor level for oil, squalene and stigmasterol yields.
3.4.4 EFFECT OF HIGH TEMPERATURE (100°C) ON SQUALENE AND
STIGMASTEROL CONTENTS OF AMARANTH OIL
Prior studies (Sims et al., 1972; Malecka, 1991) have reported that the presence of squalene
and sterols protects polyunsaturated oil from oxidative polymerisation during heating in presence
of air at frying temperatures. Blekas and Boskou (1981), Mariod et al., (2006) and Thanh et al.,
(2006) demonstrated from their studies that sterol contents of oil from different sources were
hampered during processing that involved heat treatment. Similarly Tikekar et al., (2008) proved
Page 74
59
that the squalene content of amaranth flour was affected negatively contrarily to Gamel et al.,
(2006) who demonstrated that squalene content of amaranth remained almost the same by
popping and drying processes. This has prompted us to further investigate the effects of high
temperature (100°C) on squalene and stigmasterol contents of amaranth oil. Table 3.7 illustrates
the concentration of squalene and stigmasterol after different times of exposure at 100°C:
Table 3.7: Responses of exposing amaranth oil to hot air oven (100°C) over time
Time
(Min)
Squalene
(mg/g of oil)
Stigmasterol
(mg/g of oil)
0 55.37 ± 2.38 2.36 ± 0.084
10 46.32 ± 2.43 1.96 ± 0.067
20 37.93 ± 1.65 1.28 ± 0.051
30 35.87 ± 1.47 1.25 ± 0.053
40 35.42 ± 1.32 1.24 ± 0.046
50 35.28 ± 1.48 1.23 ± 0.031
60 35.27 ± 1.54 1.23 ± 0.032
The data presented in the above table clearly indicates that both squalene and stigmasterol
contents of crude amaranth oil were negatively affected upon exposing the crude amaranth oil to
100°C in presence of air inside the hot air oven. Stigmasterol content was found to be little more
affected than squalene; as at the end of 60 min exposure stigmasterol content was reduced by
almost 48% whereas the overall decrease in squalene content was around 36% of their initial
concentrations. An important point to be noted is that there was not much reduction in content
after 20 min of exposure; this implied that both squalene and stigmasterol underwent a
significant reduction at the onset of the thermal treatment while both remained stable
comparatively during the following 40 min of thermal treatment.
3.4.5 IDENTIFICATION OF EXPERIMENTAL DOMAIN
Certainly the high temperature extraction process can hamper the quality of the extract as it
degrades its high value constituents, in addition to that, the main conclusions which can be
drawn from the above model predictions is, too low microwave power level will cause too little
energy to be dissipated as heat to promote mass transfer in the extraction process. It is important
to have enough microwave energy to dissipate as heat, as the effects of ionic conduction and
Page 75
60
dipolar polarisation increase with temperature. If the power is too high, energy is either wasted
or may lead to the degradation of the constituents of the extract. The model also acknowledged
the role of solvent A as a major factor level that played a significant role in maximising
responses. In addition to that, while conducting experiments it was discovered that AGF particles
swell in contact with solvent A only. Hence it was hypothesised that, the interaction between
AGF particles and solvent A was the major reason for enhanced recovery. However, more
studies are required to reach any firm conclusion.
The screening experimentations could have been stopped at this moment, as the study had
given convincing results to carry out extraction using solvent A at 120 W, but the question then
arose whether MAE of lipids from amaranth grain could be further enhanced. Since the FFSD
couldn’t predict how the responses will be affected outside the studied range of factors, a new
design was needed for investigating the different levels. The factorial design in this study has
used a fixed AGF to solvent ratio (w/v), concentration of MeOH in hexane (% v/v) and
extraction time (min). However, before carrying out a response surface optimisation study using
above mentioned factors, it was necessary to decide on the levels for these factors; hence the
tested levels of AGF to solvent ratio (10 g/50 ml of solvent) and extraction time (10 min) were
considered as central points for a proposed central composite rotatable (CCRD) design. This
will enable the study to determine best level for maximising responses as it broadens the scope of
the factor levels. Moreover, before selecting concentration ranges for MeOH in hexane that can
be varied for further optimisation process, it was necessary to study how different concentrations
of MeOH in hexane affect the microwave absorbing capacity of the whole solvent. Therefore the
following study was conducted.
3.4.6 MICROWAVE OUTPUT POWER CALIBRATION FOR DIFFERENT
CONCENTRATIONS OF METHANOL IN HEXANE
The actual output power pattern (Table 3.8) recorded from the study revealed that the
microwave absorbing capacity of the MeOH - Hexane mixture was increased linearly until
concentration of MeOH reached 30%, further increase in MeOH concentration caused a
Page 76
61
Table 3.8: Predicted vs actual values of microwave output power for varying concentration of
MeOH in hexane
Concentration of
MeOH in Hexane
(% v/v)
Microwave Output
Power (Actual)
(W)
Microwave Output
Power (Predicted)
(W)
SD
0 3.71 6.0781 1.6745
20 76.2 73.0914 2.1980
25 86.27 81.3902 3.4505
30 90.41 87.0458 2.3788
35 88.44 90.4277 1.4055
40 84.16 91.9053 5.4767
60 81.83 86.1597 3.0615
80 87.19 79.4946 5.4414
100 92.93 95.5499 1.8526
linear decrease in microwave absorbing capacity until MeOH concentration reached 60%.
Further increase in MeOH concentration caused again a linear increase in microwave absorbing
capacity of the solvent mixture until 100% MeOH. So while fitting the data in the polynomial
model, it was observed that if the degree of the model was raised from two (quadratic) to three
(cubic) and from three (cubic) to four (quartic) there was an enhancement in the R2 value from
0.7448 to 0.9679 and from 0.9679 to 0.9953 respectively. Similar trends were observed in case
of the predictability of the model. As the predictability of the polynomial quadratic model was
too low to mirror actual data hence it was assumed that it wouldn’t be a wise decision to consider
the quadratic model, whereas quartic model had higher predictability with higher R2 value of
0.9953, but its applicability for industrial purposes is beyond reality. Therefore, the values
mentioned in Table 3.8 were fitted into a bivariate cubic polynomial model (Figure 3.7; left) to
generate Equation 3.8.
Microwave Output Power = 94.551445 - 0.0585382 × (Concentration of Methanol) -
0.0257744 × (Concentration of Methanol - 43.3333)2
+ 0.0004925
× (Concentration of Methanol - 43.3333)3
(3.8)
Page 77
62
Figure 3.7: Regression plot (left); Predicted vs actual plot (right) microwave output power for varying
concentrations of methanol in hexane
The model was significant at P value = 0.0004 with R2 value of 0.9679 which was in agreement
with adjusted R2 of 0.9486. The ANOVA results for the model are represented in Table 3.9.
Table 3.9: ANOVA for microwave output power for varying concentrations of methanol in hexane
Microwave Output Power (W)
R2 = 0.9679; R
2 Adjusted = 0.9486
Source of Variation df Sum of Squares Mean Square F Ratio Prob > F
Model 3 6001.3375 2000.45 50.2190 0.0004
Error 5 199.1723 39.83
Total 8 6200.5098 775.0637
The R2 value for predicted vs actual plot (Figure 3.7; right) was 0.97 at P value < 0.0001.
Hence this model can be used to predict the microwave output power for different concentrations
of MeOH in hexane at a fixed microwave input power of 120 W under different experimental
conditions during MAE.
If the complexity of the heating mechanism for dielectric materials is taken into
consideration, the results obtained in these equations might not reflect the true microwave power
output because the heating efficiency under microwave is influenced by many factors including
specific heat, thermal conductivity and structure of the material. Specific heat is an important
property in the thermal behavior of the material subjected to microwaves as it keeps changing
with the rise in temperature of the material (Peyre et al., 1997). However, this calorimetric
Page 78
63
method is widely used by manufacturers (Cheng et al., 2006; Swain et al., 2006; Tanongkankit et
al., 2013) and accepted due to its simplicity and practicality.
This study proved that the microwave absorbing capacity of the MeOH - Hexane mixture was
increased linearly until concentration of MeOH reached 30% initially, hence this strongly
supports to choose to test 20% MeOH in hexane (% v/v) as the recommended central point for a
proposed central composite rotatable (CCRD) design experiment.
3.5 CONCLUSION
Microwave energy can accelerate the extraction of lipids from grain amaranth and enhance
the responses with minimum use of solvents. Observations made from full factorial screening
design along with microwave power absorbing calibration for different solvents has identified
the experimental domain as well as factors levels required for future optimisation of the MAE
process by response surface rotatable design.
3.6 ACHNOWLEDGEMENT
This work was carried out by the aid of a grant from the International Development Research
Centre (IDRC), Ottawa, Canada, with the financial support from the Government of Canada
provided through the Canadian International Development Agency (CIDA). The authors greatly
acknowledge these agencies for their financial support.
Page 79
64
PREFACE TO CHAPTER 4
The study conducted in Chapter 3, endorsed AGF over whole amaranth grain; MeOH -
Hexane mixture as an extraction solvent and microwave input power of 120 W for better
recovery of lipophilic compounds from amaranth grain using full factorial screening design as a
part of pre-optimisation studies. Chapter 4 discusses the optimisation process of extracting
amaranth grain oil and its constituents, squalene & stigmasterol, by augmenting two consecutive
central composite designs, considering factors which weren’t included in the factorial design
such as sample to solvent ratio, solvent to solvent ratio and extraction time keeping the constant
optimum values for the identified factors. The outcomes of optimised MAE process will be
compared with optimised Soxhlet extraction quantitatively (oil yield %) and qualitatively
(squalene, stigmasterol, polyphenols, α – tocopherol and DPPH free radical-scavenging activity).
Part of the research study presented in Chapter 4, has been used to prepare two conference
presentations, as follows.
Joshi, S.P., Orsat, V. (2013). Optimisation of Microwave Assisted Extraction of High Value
Lipids from Grain Amaranth. Promoting Small Millets for Improved Rural Economy and
Food Security. University of Agricultural Sciences, Dharwad, Karnataka, India, February
8 - 9.
Joshi, S.P., Orsat, V., Gariépy, Y., Raghavan, G.S.V. (2013). Optimisation of Microwave
Assisted Extraction of High Value Industrial Lipids from Grain Amaranth. 104th
American
Oil Chemists’ Society (AOCS) - Annual Meeting & Expo, Montréal, Québec, Canada, April
28 - May 1.
Chapter 4 is formulated in manuscript style and is soon to be submitted for publication as
follows.
Joshi, S.P., Orsat, V. Microwave Assisted Extraction of Lipids from Grain Amaranth -
Method Development.
Page 80
65
The first author of the manuscript and the conference presentation, Mr. Siddhartha P Joshi,
Master’s candidate, Department of Bioresource Engineering, McGill University, conducted the
reviews of literatures, the design of experiment, the practical experimental work in the
laboratory, the statistical analysis and interpretation of results, the writing and the preparation of
this manuscript for publication.
The second author, Dr. Valérie Orsat, Associate Professor and Chair, Department of
Bioresource Engineering, McGill University is the thesis advisor, provided her technical
expertise, and guided the first author of this manuscript throughout all the stages of planning and
executing the experimental work, analysing and interpreting the results, correcting and preparing
the manuscripts for publication.
Page 81
66
CHAPTER 4: MICROWAVE ASSISTED EXTRACTION OF LIPIDS FROM GRAIN
AMARANTH – METHOD DEVELOPMENT
4.1 ABSTRACT
An optimised microwave-assisted extraction (MAE) method was developed for extracting
lipids from grain amaranth. The research presents the optimisation of factors for maximising the
extraction yield of oil and its constituents, squalene and stigmasterol from grain amaranth. This
work was conducted using the experimental domain identified through a pre – optimisation study
by means of a full factorial screening design operating at microwave input power with four
levels - 80, 120, 160 and 200 W and extraction solvent with three categories – A, B and C (A–
MeOH/Hexane = 20/80% ml/ml; B–EtOH/Hexane = 20/80% ml/ml; C–100% Hexane) at a
constant amaranth grain flour (AGF) to solvent ratio and extraction time. The MAE responses
were found to be maximised operating at 120 W using solvent A. Hence, for this study MAE
process was optimised using a MeOH - Hexane mixture as the extraction solvent by
amalgamation of two central composite rotatable designs (CCRD) with the following factors,
that is, AGF/ solvent (5g - 15g/ 50 ml); MeOH/Hexane (10 - 50% ml/ml) and Extraction Time (5
- 25 min) operating at constant microwave input power of 120 W. Later, the outcomes of
optimised MAE process were compared with optimised Soxhlet extraction quantitatively (oil
yield %) and qualitatively (squalene, stigmasterol, polyphenols, α – tocopherol and DPPH free
radical-scavenging activity).
Key words: Full factorial screening design, central composite rotatable design, squalene,
stigmasterol, α – tocopherol, free radicle – scavenging activity
4.2 INTRODUCTION
The exploration of alternative crops which can be employed to increase the profitability of
farming systems is of global concern. The plants of interest represent a resource having a current
and a future potential application as a food additive, pharmaceutical, pigment, perfume and
cosmetic ingredient. Amaranthus species are among such unconventional plants which have a
Page 82
67
potential for gaining greater interest to both consumers and farmers, as a food and as an
industrial crop.
There are scientific research studies (Singhal and Kulkarni, 1988) that examined the
nutritional values of various species of pseudo cereal grain such as amaranth and their attributes
pertaining to positive effects on human health. Food products such as bread, cookies, biscuits,
candies, pancakes, noodles and soups made using edible amaranth grain varieties are already
commercialised but not enough emphasis has been given for the industrial applicability and
commercialisation of amaranth grain oil, even though bioactive ingredients such as squalene,
sterols, tocopherols and polyphenols are abundantly present in its oil which find their major
significance in nutraceutical and cosmetic industries (Caselato-Sousa and Amaya-Farfán, 2012;
Rastogi and Shukla, 2012).
Microwave-assisted extraction (MAE) has received enormous attention as a promising
alternative to conventional solid-liquid extraction methods, mainly due to its significantly lower
solvent consumption and reduced processing time. The enhanced extract recovery by microwave
has been characterised by its volumetric heating, which causes dipole rotation of the
solvent/solid matrix in the microwave field leading to a rapid rise in temperature of the solvent.
Specifically, microwave heating occurs when molecules of the polar solvent cannot align
themselves quickly enough to the high-frequency electric field (typically 2450 MHz) of
microwave, which in turn causes solvent molecules to dissipate the absorbed energy in the form
of heat (Meda et al., 2005; Orsat et al., 2005; Raghavan et al., 2005; Hemwimon et al., 2007).
For the past decade, there have been numerous published articles (Routray and Orsat, 2011,
Singh et al., 2011; Krishnaswamy et al., 2012; Kubra et al., 2013) on MAE used for polyphenolic
antioxidants, however not much interest has been shown to find its industrial applicability for
extracting oils from seeds.
The concept of experimental design and analysis of variance (ANOVA) was framed mainly in
association with agricultural field research. Over the course of time its application in industrial
and technological experimentation gathered interest and started growing. Indeed, most industrial
Page 83
68
research use factorial design at the onset of research to screen out the experimental parameters
required followed by an optimisation process using response surface methodology (Myers and
Montgomery, 2002 A & B). Hence a full factorial screening design was operationalized
(Chapter 3) and it identified the experimental domain required to optimise the extraction of
lipids from AGF by CCRD in this chapter.
4.3 MATERIALS AND METHODS
The sample & its preparation, the MAE system & experimentation methodology, Soxhlet
system & experimentation methodology, sample preparation & methodology adopted for
chromatographic technique used in this study were identical with those reported in section 3.3
presented in Chapter 3, where their detailed description can be found.
4.3.1 STANDARDS, SOLVENTS AND REAGENTS
Squalene, stigmasterol (95% pure) and α - tocopherol standards were purchased from Sigma
Aldrich (St. Louis, MO, USA). n-Hexane, methanol, xylenes and n-propanol of ACS HPLC
grade were procured from Fisher Scientific (Fair Lawn, NJ, USA) and anhydrous ethanol was
obtained from Commercial Alcohols (Brampton, ON, Canada). Folin & Ciocalteu’s phenol, 2,2-
diphenyl-1-picrylhydrazyl (DPPH), iron (III) chloride, 2, 2’- bipyridyl reagents were acquired
from Sigma Aldrich (St. Louis, MO, USA) and sodium carbonate anhydrous ACS HPLC grade
was received from Fisher Scientific (Fair Lawn, NJ, USA).
4.3.2 OUTCOMES OF PRE-OPTIMISATION STUDIES
The MAE optimisation presented in this paper is built upon the outcomes of the pre-
optimisation study (Chapter 3). Pre-optimisation consisted of a parameter screening study
followed by a full factorial screening design. The parameter screening study indicated the
significance of using AGF over whole amaranth grain and conducting MAE using solvent
mixtures composed of a strong and a weak microwave absorbing solvent operating above the
minimum microwave input power of 80 W.
Page 84
69
The design assisted in screening out the optimum combination of factors that maximised the
yield of oil and its constituents squalene and stigmasterols at a fixed AGF to solvent ratio (10
g/50 ml of solvent) and extraction time (10 min).
The responses were found to be maximised when extraction was carried out using solvent A
(MeOH:Hexane 20:80% v/v) at microwave input power of 120 W. However, this full factorial
design could not predict how the responses will be affected if values of AGF to solvent ratio
(g/ml), concentration of MeOH in hexane (% ml/ml) and extraction time (min) were varied,
hence it was necessary to determine whether responses could be further enhanced using these
factors to create a central composite rotatable design (CCRD) operating at a microwave input
power of 120 W.
4.3.3 EXPERIMENTAL DESIGN
The design was constituted of two stages of experimentation; first, the process optimisation of
MAE of lipids from grain amaranth was accomplished by amalgamation of two successive
central composite rotatable designs (CCRD); second, the performance of the optimised MAE
method was evaluated using optimised Soxhlet extraction as a reference technique. The
experiments were carried in triplicate for each design points for both MAE and Soxhlet
extraction.
The optimisation procedures for MAE started with a CCRD (CCRD - I), consisting of 20
design points including 6 central points as presented in Table 4.1:
Table 4.1: Independent variables in MAE CCRD - I
Independent Variables Variable Types Values
AGF (g)/ 50 (ml) Solvent Continuous 5 10 15
MeOH/ Hexane (% ml/ml) Continuous 10 20 30
Extraction Time (min) Continuous 5 10 15
The above mentioned design was followed by an another CCRD - II, consisting of 15 design
points including 7 central points which were operationalized at a fixed AGF to solvent ratio (5
g/50 ml of solvent) within the experimental domain as mentioned in Table 4.2:
Page 85
70
Table 4.2: MAE Independent variables in MAE CCRD - II
Independent Variables Variable Types Values
MeOH/ Hexane (% ml/ml) Continuous 30 40 50
Extraction Time (min) Continuous 15 20 25
During the parameter screening study (Chapter 3), Soxhlet was studied as a control
technique for which, level of AGF to solvent ratio (36 g/180 ml) was adopted to be same as
MAE (10 g/180 ml). Nonetheless, when the focus of attention was taken over to the results
reported (an increase in response with a decrease in sample to solvent ratio for Soxhlet) by
Jadhav et al., (2009), it was consequently hypothesised that 36 g/180 ml is a large AGF to
solvent ratio which needs to be decreased to enhance the responses, therefore to optimise the
Soxhlet extraction using CCRD, the above tested level of combination for AGF to solvent ratio
wasn’t included in the design, moreover the minimum level of AGF size was reduced from 36 g
to 20 g whereas, solvent volume was raised from 180 ml and was fixed at 200 ml. In this way we
were able to mimic same minimum level of AGF to solvent ratio for Soxhlet (20 g/200 ml) and
MAE (5 g/50 ml; CCRD - I) for better comparability. However, it was impossible to mimic all
the levels of AGF to solvent ratio due to technical limitations associated with the Soxhlet
apparatus [first, Soxhlet extraction cannot be performed efficiently if the quantity of solvent used
is below 180 ml; second, the thimble specification which fits the Soxhlet apparatus does not
allow a sample size above 36 g; therefore it was necessary to adjust both quantity of AGF (g) as
well as solvent (ml) to obtain optimum AGF to solvent ratio which can be compared
meaningfully with MAE].
The tested level of extraction time for Soxhlet extraction during parameter screen study
(Chapter 3) was 90 min, hence to broaden the scope of the level of extraction time; it was
adopted as a central point for Soxhlet CCRD, whereas for better comparability with MAE,
concentration levels of MeOH in hexane were adopted to be the same as MAE.
Considering above mentioned aspects, the following Soxhlet CCRD optimisation design was
formulated to be used as reference for estimating the efficiency of MAE, which consisted of 20
design points including 6 central points within experimental domain as mentioned in the Table
4.3:
Page 86
71
Table 4.3: Independent variables in Soxhlet CCRD
Independent Variables Variable Types Values
AGF (g)/200 (ml) Solvent Continuous 20 25 30
MeOH/ Hexane (% ml/ml) Continuous 10 20 30
Extraction Time (min) Continuous 60 90 120
All the design experimentation for MAE as well as Soxhlet were carried using freeze dried
AGF (moisture content 5.1% wet basis, SD = 0.06) to maintain constant moisture content. After
resolution of the best possible factor combinations for both MAE and Soxhlet, extractions were
carried out at the best factor combination using non freeze-dried AGF (moisture content 12.39%
wet basis, SD = 0.23), to know if there is any significant effect of moisture content on extraction
yield.
MAE and Soxhlet were further compared at their best factor combination levels in terms of
their polyphenolic and α-tocopherol content as well as their free radical-scavenging activity
4.3.4 SPECTROPHOTOMETRIC DETERMINATION OF TOTAL PHENOLIC
COMPOUNDS USING FOLIN & CIOCALTEAU’S REAGENTS
A spectrophotometric method based on Slinkard and Singleton, (1977) was developed to
quantify the total phenolic content of crude amaranth grain oil in terms of gallic acid equivalent
(GAE) using Folin & Ciocalteau’s reagent. The method developed by Slinkard and Singleton,
(1977) cannot be directly applied to estimate total polyphenolic content of oil, hence it was
modified. The determination of polyphenols was performed as follows: 100 mg of amaranth
grain oil was dissolved in 0.5 ml of n-hexane and polyphenols were extracted from oil-hexane
solution with 1 ml portion of MeOH/double distilled water (30/70% ml/ml). The mixture was
shaken for 5 min at 2800 rpm using miniRoto Vortexers (Fisher Scientific, Ottawa, ON,
Canada). The separation of oil and MeOH - water solution was achieved by centrifugation
(International Equipment Company, Needham Heights, MA, USA) for 10 min at 3300 rpm. One
milliliter of MeOH - water solution containing extract present at the bottom of the centrifuge
tube was pipetted out and transferred to another centrifuge tube. The methanolic extract was
further diluted with 5 ml double distilled water and followed by addition of 2 ml Folin &
Ciocalteau’s reagent. After 3 min, 6 ml of 7.5% Na2CO3 was added to it. The absorbance of the
Page 87
72
sample was measured after 30 min of incubation in the dark, at 765 nm against a blank sample
with UV/Vis spectrophotometer (Ultrospec 2100 pro, Biochrom Ltd., GE Healthcare,
Cambridge, England). A calibration curve of gallic acid in MeOH/double distilled H2O (30/70%
ml/ml) was constructed with a concentration range between 0.05 - 0.25 mg/ml. The regression
presented in Equation 4.1 (R2 = 0.9998) was thus obtained as follows:
Total Phenolic Concentration (mg/ml) = 0.116 (Absorbance)765 nm + 0.0313 (4.1)
4.3.5 SPECTROPHOTOMETRIC DETERMINATION OF α - TOCOPHEROL USING
EMMERIE -ENGEL REACTION
The colorimetric method used for determination of α – tocopherol in amaranth grain oil is
based upon Emmerie - Engel Reaction (1938) as reported by Rosenberg (1945) and later by
Baker and Frank (1968). The original method was developed to quantify α – tocopherol content
of serum/plasma/tissue; hence the method was modified so that it can be applied directly to
determine the concentration of α – tocopherol in amaranth grain oil.
The determination of α – tocopherol was performed as follows: 500 mg of amaranth grain oil
was dissolved in 5 ml of n-hexane/EtOH (20/80% ml/ml). One milliliter of this oil – solvent
mixture was added to 1 ml xylene. The mixture was shaken for 5 min at 2800 rpm using
miniRoto Vortexers (Fisher Scientific, Ottawa, ON, Canada) to extract the α – tocopherol and
carotenoids into the xylene. The extract (0.5 ml) was pipetted out into a cuvette; 0.5 ml of 2’2’
bipyridyl reagent (120 mg/100 ml n-propanol) was added to it and mixed well. The absorbance
was read in the dark at 460 nm to measure carotenoid as it interferes with α - tocopherol assay. In
the same cuvette, 0.1 ml Ferric chloride solution (120 mg/100 ml absolute EtOH) was added,
mixed well and was incubated for 15 min in the dark. The red colour developed due to the
reduction of ferric ions to ferrous ions, was read exactly after 15 minutes in the dark at 520 nm
(maximum absorbance range for α – tocopherol) using UV/Vis spectrophotometer (Ultrospec
2100 pro, Biochrom Ltd., GE Healthcare, Cambridge, England). The absorbance read at 460 nm
(maximum absorbance range for carotenoids) was subtracted from the α – tocopherol absorbance
at 520 nm by the mathematical expression [0.29 x (Sample Absorbance)460]; the carotenoid
Page 88
73
absorbance at 520 nm is 29% of that at 460 nm. A calibration curve of α – tocopherol standard in
n-hexane/EtOH (20/80% ml/ml) was constructed with a concentration range between 0.005 -
0.03 mg/ml. The regression (R2 = 0.995) is as presented in Equation 4.2:
α – Tocopherol Concentration (mg/ml) = 0.0913[(Sample Absorbance)520nm
- 0.29(Sample Absorbance)460nm] – 0.0051 (4.2)
4.3.6 DPPH FREE RADICAL - SCAVENGING ACTIVITY
The antioxidant capacity of the amaranth grain oil was studied through the evaluation of the
free radical-scavenging effect on the DPPH radical. The method used by De Ancos et al., (2002)
was mostly modified so that it can be applied directly to determine the free radical scavenging
activity of amaranth grain oil. The determination was performed as follows: 1 g of amaranth
grain oil was dissolved in 10 ml of n-hexane/EtOH (20/80% ml/ml). An aliquot of 100 µl oil –
solvent mixture was added to 1.5 ml of DPPH [1 mg/100 ml n-hexane/EtOH (20/80% ml/ml)].
The mixture was shaken for 5 min at 2800 rpm using miniRoto Vortexers (Fisher Scientific,
Ottawa, ON, Canada) and incubated in the dark for 30 min. The absorbance was measured later,
at 515 nm, against a blank of n-hexane/EtOH (20/80% ml/ml) without DPPH. Results were
expressed as percentage of inhibition of the DPPH radical. Percentage of inhibition of the DPPH
radical was calculated according to Equation 4.3:
(4.3)
Where, Control Abs = Absorption of Blank Sample; Sample Abs = Absorption of amaranth
grain oil sample.
Page 89
74
4.4 RESULTS AND DISCUSSIONS
4.4.1 MAE OPTIMISATION DESIGNS
Optimisation of MAE of amaranth grain oil was achieved by amalgamation of two CCRDs.
The CCRD - I was structured as a three level, three factors design, to learn about the direction
and the magnitude of the factors effects on responses. The CCRD - I layout, with mean
(triplicate) values of responses, is presented in Table 4.4:
Table 4.4: MAE CCRD - I, with observed response for oil, squalene & stigmasterol
Design
Points
AGF(g)/
50 (ml)
Solvent
MeOH/Hexane
(% ml/ml)
Extraction
Time
(min)
Oil
Yield
(%)
Squalene
Yield
(mg/g of oil)
Stigmasterol
Yield
(mg/g of oil)
1 5 10 5 7.51 56.95 2.15
2 5 10 15 7.53 57.02 2.33
3 5 30 5 8.74 59.53 3.17
4 5 30 15 9.1 59.61 3.21
5 15 10 5 6.66 56.82 2.05
6 15 10 15 6.92 56.89 2.07
7 15 30 5 7.64 59.32 2.67
8 15 30 15 7.44 59.46 2.71
9 1.59 20 10 8.91 57.77 2.46
10 18.41 20 10 7.02 56.48 1.92
11 10 3.18 10 6.7 55.79 1.88
12 10 36.82 10 8.5 58.56 2.76
13 10 20 1.59 7.05 55.90 1.72
14 10 20 18.41 8.11 57.73 2.44
15 10 20 10 8.89 57.80 2.46
16 10 20 10 8.88 57.75 2.47
17 10 20 10 8.83 57.78 2.48
18 10 20 10 8.41 57.78 2.45
19 10 20 10 8.85 57.74 2.46
20 10 20 10 8.8 57.82 2.44
4.4.1.1 MAE CCRD - I OIL YIELD (%)
The ANOVA revealed that the model was highly significant for oil yield at P value = 0.0001
with a R2 value of 0.9657, which was in reasonable agreement with its adjusted R
2 (0.9349)
Page 90
75
accompanied with non-significant lack of fit. This implied that the model was fitted well and
could be used to predict the value of oil yield from grain amaranth by MAE. The ANOVA
results are presented in the Table 4.5:
Table 4.5: MAE CCRD - I ANOVA for oil yield (%)
Oil Yield (%)
R2 = 0.9657; R
2 Adjusted = 0.9349
Source of Variation df Sum of Squares Mean Square F Ratio Prob > F
AGF(g)/ 50 (ml) Solvent
(5, 15)
1 4.0081 4.0081 83.4119 < 0.0001
MeOH/Hexane (% ml/ml)
(10, 30)
1 3.9312 3.9312 81.8106 < 0.0001
Extraction Time (min)
(5, 15)
1 0.3617 0.3617 7.5282 0.0207
AGF(g)/ 50 (ml) Solvent x
MeOH/Hexane (% ml/ml)
1 0.2112 0.2112 4.3962 0.0624
AGF(g)/ 50 (ml) Solvent x
Extraction Time (min)
1 0.0128 0.0128 0.2664 0.6170
MeOH/Hexane (% ml/ml) x
Extraction Time (min)
1 0.0018 0.0018 0.0375 0.8504
AGF(g)/ 50 (ml) Solvent x
AGF(g)/ 50 (ml) Solvent
1 1.1147 1.1147 23.1988 0.0007
MeOH/Hexane (% ml/ml) x
MeOH/Hexane (% ml/ml)
1 2.3892 2.3892 49.7211 < 0.0001
Extraction Time (min) x
Extraction Time (min)
1 2.4729 2.4729 51.4630 < 0.0001
Model 9 13.5604 1.5067 31.3552 < 0.0001
Lack of Fit 5 0.3137 0.0627 1.8820 0.2522
Error 10 0.4805 0.0480
Total 19 14.0489 0.7389
The linear impact of independent variables AGF (g)/50 (ml) Solvent, MeOH/Hexane (% ml/
ml), Extraction Time (min) was significant; besides that quadratic terms [AGF (g)/50 (ml)
Solvent]2, [MeOH/Hexane (% ml/ml)]
2 and [Extraction Time (min)]
2 were also found to be
significant. The predicted, second - order, polynomial model for oil yield of AGF by MAE, in
terms of coded factors is provided in Equation 4.4
Page 91
76
Oil yield (%) = 8.7753 – 0.5417 [AGF (g)/ 50 (ml) Solvent] + 0.5365 [MeOH/Hexane (%ml/ml)]
+ 0.1628 [Extraction Time (min)] - 0.1625 [AGF(g)/ 50 (ml) Solvent
MeOH/Hexane (% ml/ml)] – 0.04 [AGF (g)/ 50 (ml) Solvent × Extraction Time
(min)] – 0.015 [MeOH/Hexane (% ml/ml) × Extraction Time (min)] – 0.2781
[AGF(g)/ 50 (ml) Solvent x AGF(g)/ 50 (ml) Solvent] – 0.4072 [MeOH/Hexane
(% ml/ml) × MeOH/Hexane (% ml/ml)] – 0.4142 [Extraction Time (min) ×
Extraction Time (min)] (4.4)
Figure 4.1: MAE CCRD–I predicted vs actual plot for oil yield (%)
The R2 value for predicted vs actual plot (Figure 4.1) was 0.97 at P value < 0.0001. Hence
this model can be used to predict oil yield (%) under different experimental conditions during
MAE.
4.4.1.2 MAE CCRD - I SQUALENE AND STIGMASTEROL YIELD (mg/g of oil)
The ANOVA for squalene as well as stigmasterol revealed that the models were significant (P
< 0.05) with a R2 value of 0.7336 and 0.7905 respectively. The ANOVA results for squalene
and stigmasterol are presented in Tables 4.6 and 4.7.
Page 92
77
Table 4.6: MAE CCRD - I ANOVA for squalene yield (mg/g of oil)
Squalene Yield (mg/g of oil)
R2 = 0.7336; R
2 Adjusted = 0.4938
Source of Variation df Sum of Squares Mean Square F Ratio Prob > F
AGF(g)/ 50 (ml) Solvent
(5, 15)
1 0.5698 0.5698 0.8792 0.3705
MeOH/Hexane (% ml/ml)
(10, 30)
1 16.2532 16.2532 25.0805 0.0005
Extraction Time (min)
(5, 15)
1 0.8653 0.8653 1.3353 0.2747
AGF(g)/ 50 (ml) Solvent x
MeOH/Hexane (% ml/ml)
1 0.0013 0.0013 0.0019 0.9658
AGF(g)/ 50 (ml) Solvent x
Extraction Time (min)
1 0.0005 0.0005 0.0007 0.9795
MeOH/Hexane (% ml/ml) x
Extraction Time (min)
1 0.0008
0.0008 0.0012 0.9727
AGF(g)/ 50 (ml) Solvent x
AGF(g)/ 50 (ml) Solvent
1 0.0080 0.0080 0.0124 0.9135
MeOH/Hexane (% ml/ml) x
MeOH/Hexane (% ml/ml)
1 0.0246 0.0246 0.0379 0.8495
Extraction Time (min) x
Extraction Time (min)
1 0.1065 0.1065 0.1644 0.6937
Model 9 17.8447 1.9827 3.0596 0.0481
Lack of Fit 5 6.4759 1.2952 1444.444 < 0.0001
Error 10 6.4804 0.6480
Total 19 24.3251 1.2803
The predicted, second – order, polynomial model for squalene from AGF by MAE, in terms
of coded factors is provided below as Equation 4.5
Squalene yield (%) = 57.7394 – 0.2043 [AGF (g)/ 50 (ml) Solvent] + 1.0909 [MeOH/Hexane
(%ml/ml)] + 0.2517 [Extraction Time (min)] - 0.0125 [AGF(g)/ 50 (ml)
Solvent × MeOH/Hexane (% ml/ml)] + 0.0075 [AGF (g)/ 50 (ml) Solvent
× Extraction Time (min)] + 0.01 [MeOH/Hexane (% ml/ml) × Extraction
Time (min)] + 0.0236 [AGF(g)/ 50 (ml) Solvent × AGF(g)/ 50 (ml)
Solvent] + 0.0413 [MeOH/Hexane (% ml/ml) × MeOH/Hexane (%ml/ml)]
– 0.0859 [Extraction Time (min) × Extraction Time (min)] (4.5)
Page 93
78
Table 4.7: MAE CCRD - I ANOVA for stigmasterol yield (mg/g of oil)
Stigmasterol Yield (mg/g of oil)
R2 = 0.7905; R
2 Adjusted = 0.6019
Source of Variation df Sum of Squares Mean Square F Ratio Prob > F
AGF(g)/ 50 (ml) Solvent
(5, 15)
1 0.3767 0.3767 6.3465 0.0304
MeOH/Hexane (% ml/ml)
(10, 30)
1 1.5765 1.5765 26.5594 0.0004
Extraction Time (min)
(5, 15)
1 0.1628 0.1628 2.7421 0.1287
AGF(g)/ 50 (ml) Solvent x
MeOH/Hexane (% ml/ml)
1 0.0512 0.0512 0.8626 0.3749
AGF(g)/ 50 (ml) Solvent x
Extraction Time (min)
1 0.0032 0.0032 0.0539 0.8211
MeOH/Hexane (% ml/ml) x
Extraction Time (min)
1 0.0018
0.0018 0.0303 0.8652
AGF(g)/ 50 (ml) Solvent x
AGF(g)/ 50 (ml) Solvent
1 0.0049 0.0049 0.0838 0.7781
MeOH/Hexane (% ml/ml) x
MeOH/Hexane (% ml/ml)
1 0.0108 0.0108 0.1820 0.6787
Extraction Time (min) x
Extraction Time (min)
1 0.0476 0.0476 0.8020 0.3915
Model 9 2.2393 0.2488 4.1919 0.0177
Lack of Fit 5 0.5926 0.1185 592.5568 < 0.0001
Error 10 0.5936 0.0594
Total 19 2.8329 0.1491
The predicted, second – order, polynomial model for stigmasterol yield of AGF by MAE, in
terms of coded factors is provided below as Equation 4.6
Stigmasterol yield (%) = 2.4482 – 0.1660 [AGF (g)/ 50 (ml) Solvent] + 0.3398 [MeOH/Hexane
(%ml/ml)] + 0.1092 [Extraction Time (min)] - 0.08 [AGF(g)/ 50 (ml)
Solvent × MeOH/Hexane (% ml/ml)] - 0.02 [AGF (g)/ 50 (ml) Solvent
× Extraction Time (min)] - 0.015 [MeOH/Hexane (% ml/ml) ×
Extraction Time (min)] - 0.0186 [AGF(g)/ 50 (ml) Solvent × AGF(g)/
50 (ml) Solvent] + 0.0274 [MeOH/Hexane (% ml/ml) × MeOH/Hexane
(%ml/ml)] – 0.0575 [Extraction Time (min) × Extraction Time (min)]
(4.6)
Page 94
79
The models for squalene and stigmasterol yields indicated, highly significant influence of
independent factors MeOH/Hexane (% ml/ml); in addition to that, the model also reported
statistically significant influence of the AGF(g)/ 50 (ml) to solvent factor on stigmasterol yield.
However, the lack of fit were highly significant for both squalene and stigmasterol yield models.
Hence, it might not be appropriate to use these models for prediction purposes.
4.4.1.3 OUTCOMES OF CCRD - I
The relationship between independent and dependent factors was well conveyed by CCRD -
I. The maximum oil yield observed was 9.1% at a factor combination obtained using AGF (g)/
50 (ml) solvent of 5 g/50 ml, MeOH/Hexane ratio of 30/70 (% ml/ml) and an extraction time of
15 minutes. Oil yield was found to be negatively affected at AGF (g)/50 (ml) solvent of 1.59
g/50 ml, even though there was an increase in oil yield with the decrease in the AGF (g)/50 (ml)
solvent. This implied that there is a limit to positive impact on oil yield even if there is a decrease
in AGF (g)/50 (ml) solvent. Although, in most analytical processes, low sample sizes are
considered for higher efficiency, but if sample sizes are smaller than a certain limit, a
considerable amount of microwave energy will be reflected rather than getting absorbed, which
in turn will reduce the extraction output (Lebovka et al., 2011).
The experimental data presented a linear increase in oil, squalene and stigmasterol yields with
an increase in MeOH/Hexane and extraction time at a fixed AGF (g)/50 (ml) solvent of 5 g/50
ml. The question arose whether MAE of amaranth grain oil and its constituents could be further
enhanced or until what limit this positive relation between the responses and variables is going to
last as yield cannot keep increasing after a certain limit, i.e. the linear increase should be
succeeded either by a decrease or constant values after achieving its maximum limit. Hence it
was hypothesised that models obtained using these experimental data may not be able to predict
the effects of these independent variable correctly if levels of MeOH/Hexane and extraction time
cross 30/70 (% ml/ml) and 15 min limits respectively.
Additional matter of concern was the significant lack of fit of squalene and stigmasterol
models, as it was assumed that if further experiments were carried out, we might come across the
Page 95
80
values of squalene and stigmasterol that will enable us to fit data in a model with non-significant
lack of fit so that we would have reliable predictability. However, to determine whether
significant lack of fit component can be eliminated from these models of squalene and
stigmasterol yields, different statistical transformation mechanisms were applied to their
responses; in addition to that almost all the non-significant factors were also neglected from the
models to study the changes occurring in the model. However, no distinctness could be observed
in the P value of lack of fit, except perhaps little changes noticed in the model’s R2 value.
Therefore, the model was presented in its original form. Even though, lack of fit was highly
significant, models were able to point out the direction of the factor’s effects.
The conclusions drawn from the outcomes of CCRD - I forced the authors to investigate
about the effects of factors - MeOH/Hexane and extraction time at their higher levels at a fixed
AGF (g)/50 (ml) solvent of 5 g/50 ml. The best level obtained from CCRD - I for MeOH/Hexane
and extraction time factors were also included in the new design to examine the change in pattern
with better comparability of responses.
The CCRD - II was structured as a three levels, two factors design, to learn about the
direction and the magnitude of the factors effects on responses. The CCRD – II layout with mean
(triplicate) values of responses is presented in Table 4.8
Page 96
81
Table 4.8: MAE CCRD - II with observed response for oil, squalene & stigmasterol
Design
Points
MeOH/
Hexane
(% ml/ml)
Extraction
Time
(min)
Oil Yield
(%)
Squalene
Yield
(mg/g of oil)
Stigmasterol
Yield
(mg/g of oil)
1 30 15 9.18 59.58 3.16
2 30 25 9.16 59.53 3.15
3 50 15 7.38 53.71 1.87
4 50 25 7.37 53.69 1.85
5 25.86 20 8.88 56.71 2.98
6 54.14 20 6.74 51.98 1.8
7 40 12.93 7.84 55.89 1.98
8 40 27.07 8.36 55.80 1.97
9 40 20 8.48 55.87 1.98
10 40 20 8.17 55.88 1.95
11 40 20 8.29 55.88 1.94
12 40 20 8.73 55.79 1.97
13 40 20 8.33 55.81 1.98
14 40 20 8.39 55.85 1.99
15 40 20 8.41 55.88 1.95
4.4.1.4 MAE CCRD - II Oil Yield (%)
The CCRD–II ANOVA affirmed that the model was highly significant for oil yield at P value
= 0.0001 with a R2 value of 0.9222, which was in reasonable agreement with its adjusted R
2 of
0.8789 accompanied with non-significant lack of fit. This implied that the model was fitted well
and could be used to predict the value of oil yield from grain amaranth by MAE. The ANOVA
results are presented in the Table 4.9.
Page 97
82
Table 4.9: MAE CCRD - II ANOVA for oil yield (%)
Oil Yield (%)
R2 = 0.9222; R
2 Adjusted = 0.8789
Source of Variation df Sum of Squares Mean Square F Ratio Prob > F
MeOH/Hexane (% ml/ml)
(30, 50)
1 5.4721 5.4721 98.5093 < 0.0001
Extraction Time (min)
(15, 25)
1 0.0622 0.0622 1.1197 0.3176
MeOH/Hexane (% ml/ml) x
Extraction Time (min)
1 0.0000 0.0000 0.0005 0.9835
MeOH/Hexane (% ml/ml) x
MeOH/Hexane (% ml/ml)
1 0.3591 0.3591 6.4650 0.0316
Extraction Time (min) x
Extraction Time (min)
1 0.0385 0.0385 0.6936 0.4265
Model 5 5.9243 1.1849 21.3301 < 0.0001
Lack of Fit 3 0.3145 0.1048 3.3931 0.0947
Error 9 0.4999 0.0555
Total 14 6.4243 0.4589
The linear impact of independent variable MeOH/Hexane (%ml/ml) and quadratic term
[MeOH/Hexane (%ml/ml)]2 were significant. The predicted, second – order, polynomial model
for oil yield of AGF by MAE, in terms of coded factors is provided below in Equation 4.7.
Oil yield (%) = 8.4 – 0.8271 [MeOH/Hexane (%ml/ml)] + 0.0882 [Extraction Time (min)]
+ 0.0025 [MeOH/Hexane (% ml/ml) × Extraction Time (min)]
– 0.2156 [MeOH/Hexane (% ml/ml) × MeOH/Hexane (% ml/ml)]
– 0.0706 [Extraction Time (min) × Extraction Time (min)] (4.7)
Figure 4.2: MAE CCRD – II predicted vs actual plot for oil yield (%)
Page 98
83
The R2 value for predicted vs actual plot (Figure 4.2) was 0.92 at P value < 0.0001. Hence this
model can be used to predict oil yield (%) under different experimental conditions during MAE.
4.4.1.5 MAE CCRD - II SQUALENE AND STIGMASTEROL YIELD (mg/g of oil)
The CCRD - II ANOVA for squalene as well as stigmasterol affirmed that the models were
significant (P < 0.05) with R2 values of 0.8501 and 0.9031 respectively. The ANOVA results for
squalene and stigmasterol are presented in Tables 4.10 and 4.11 respectively.
Table 4.10: MAE CCRD - II ANOVA for squalene yield (mg/g of oil)
Squalene Yield (mg/g of oil)
R2 = 0.8501; R
2 Adjusted = 0. 7669
Source of Variation df Sum of Squares Mean Square F Ratio Prob > F
MeOH/Hexane (% ml/ml)
(30, 50)
1 42.3165 42.3165 48.4735 < 0.0001
Extraction Time (min)
(15, 25)
1 0.0049 0.0049 0.0056 0.9421
MeOH/Hexane (% ml/ml) x
Extraction Time (min)
1 0.0002 0.0002 0.0003 0.9875
MeOH/Hexane (% ml/ml) x
MeOH/Hexane (% ml/ml)
1 1.0579 1.0579 1.2119 0.2995
Extraction Time (min) x
Extraction Time (min)
1 1.1148 1.1148 1.2771 0.2877
Model 5 44.5719 8.9149 10.2114 < 0.0017
Lack of Fit 3 7.8485 2.6162 1894.475 0.0001
Error 9 7.8568 0.8729
Total 14 52.4287 3.7449
The predicted, second – order, polynomial model for squalene of AGF by MAE, in terms of
coded factors is provided below in Equation 4.8.
Squalene yield (%) = 55.8514 – 2.2999 [MeOH/Hexane (%ml/ml)] – 0.0247 [Extraction Time
(min)] + 0.0075 [MeOH/Hexane (% ml/ml) × Extraction Time (min)]
– 0.3701 [MeOH/Hexane (% ml/ml) × MeOH/Hexane (% ml/ml)]
+ 0.3799 [Extraction Time (min) × Extraction Time (min)] (4.8)
Page 99
84
Table 4.11: MAE CCRD - II ANOVA for stigmasterol yield (mg/g of oil)
Stigmasterol Yield (mg/ g of oil)
R2 = 0.9031; R
2 Adjusted = 0. 8492
Source of Variation df Sum of Squares Mean Square F Ratio Prob > F
MeOH/Hexane (% ml/ml)
(30, 50)
1 2.2671 2.2671 63.8561 < 0.0001
Extraction Time (min)
(15, 25)
1 0.0002 0.0002 0.0069 0.9358
MeOH/Hexane (% ml/ml) x
Extraction Time (min)
1 0.0000 0.0000 0.0007 0.9794
MeOH/Hexane (% ml/ml) x
MeOH/Hexane (% ml/ml)
1 0.6649 0.6649 18.7272 0.0019
Extraction Time (min) x
Extraction Time (min)
1 0.0569 0.0569 1.6050 0.2370
Model 5 2.9767 0.5953 16.7683 < 0.0003
Lack of Fit 3 0.3174 0.1058 292.3090 0.0001
Error 9 0.3195 0.0355
Total 14 3.2962 0.2354
The predicted, second – order, polynomial model for stigmasterol yield of AGF by MAE, in
terms of coded factors is provided in Equation 4.9.
Stigmasterol yield (%) = 1.9657 – 0.5323 [MeOH/Hexane (%ml/ml)] – 0.0055 [Extraction Time
(min)] - 0.0025 [MeOH/Hexane (% ml/ml) × Extraction Time (min)]
+ 0.2934 [MeOH/Hexane (% ml/ml) × MeOH/Hexane (% ml/ml)]
+ 0.0859 [Extraction Time (min) × Extraction Time (min)] (4.9)
The models for squalene and stigmasterol yields indicated the highly significant influence of
the independent factor MeOH/Hexane (% ml/ ml); in addition to that, the model also reported the
statistically significant influence of the quadratic term [MeOH/Hexane (%ml/ml)]2
on
stigmasterol yield. However, the lack of fit was highly significant for both squalene and
stigmasterol yields so it might not be appropriate to use these models for prediction.
Same as with CCRD - I, to eliminate significant lack of fit component from the models of
squalene and stigmasterol yields, different statistical transformation mechanisms were applied to
their responses. In addition to that, almost all the non-significant factors were also neglected
from the models to study the changes occurring in the models, but no distinctness could be
Page 100
85
observed in the P values of lack of fit, with the exception of little changes noticed in the models’
R2 values. Therefore, the models were presented in their original form. Although the lack of fit
was highly significant, the models were able to point out the direction of the factor’s effects
4.4.1.6 INTERPRETATION OF CCRD - I and CCRD - II
The purpose of the amalgamation of CCRD - I and CCRD - II was actualised as it satisfied
the aspiration of optimising the MAE process. The amalgamation process witnessed a dramatic
pattern of responses under various levels of extraction factors. The three dimensional response
for oil yield is illustrated in Figure 4.3, presenting the interaction between MeOH/Hexane and
extraction time at a fixed AGF (g)/50 (ml) solvent of 5 g/50 ml.
Figure 4.3: MAE process factors effects on oil yield: CCRD - I (left) and CCRD - II (right)
The three dimensional response of CCRD - II shown in Figure 4.3, clearly points out to a
linearly reducing oil yield resulting from the increase in methanol concentration in hexane from
30% to 50%, whereas, the CCRD - I responses looked unclear about the yield behaviour in the
event that the MeOH in Hexane concentration was increased beyond 30%.
Page 101
86
The fact drawn from CCRD - II, is that oil yield remained constant when period of microwave
exposure was increased from 15 min to 25 min while CCRD - I showed a decrease in oil yield if
the extraction process was prolonged after 15 min.
The three dimensional response for squalene yield is illustrated in Figure 4.4, presenting the
interaction between MeOH/Hexane and extraction time at a fixed AGF (g)/50 (ml) solvent of 5
g/50 ml.
Figure 4.4: MAE process factors effects on squalene yield: CCRD - I (left) and CCRD - II (right)
CCRD - I predicted a linear increase in squalene yield with an increase in MeOH/Hexane and
extraction time beyond 30% and 15 min respectively, in contrary the CCRD - II proved a linear
decrease in squalene yield with an increase in MeOH/Hexane beyond 30% and a constant
squalene yield when microwave extraction time was increased from 15 min to 25 min.
The three dimensional response for stigmasterol yield is illustrated in Figure 4.5, presenting
the interaction between MeOH/Hexane and extraction time at a fixed AGF (g)/50 (ml) solvent of
5 g/50 ml.
Page 102
87
Figure 4.5: MAE process factors effects on stigmasterol yield: CCRD - I (left) and CCRD - II (right)
CCRD - I exhibited a linear positive impact of MeOH/Hexane and extraction time on
stigmasterol yield beyond 30% and 15 min respectively. Whereas, CCRD - II demonstrated a
linear negative impact of MeOH/Hexane on stigmasterol until it reached 40%, beyond that it
remained constant. Furthermore, CCRD - II showed a slight parabolic pattern of stigmasterol
yield caused by an increase in extraction time from 15 min to 25 min, this might be due to small
variations in the biological material which can be considered as outliers. But if the focus of
attention is drawn towards the stigmasterol yield obtained following 15 min and 25 min of
extraction, the yield remained almost the same. This proved that there is almost no benefit of
increased extraction time on stigmasterol yield beyond 15 min.
Significant lack of fit has been considered as a major aberration for predictability of any
model. In statistical analysis the validity of a model is measured based on the value of error of fit
(residual error) and pure error. If the model error (residual error) is in the range with pure error,
the lack of fit is non-significant, while if there is large difference between model error and pure
error, the lack of fit is significant. This indicates that the model error is significantly larger than
the pure error. There are many criterions that could lead to a lack of fit. Nevertheless, the reason
behind could be simply a very low value of pure error that tends to zero. Reproducibility can be
measured by comparing the variation of the response under the same conditions, with the total
Page 103
88
variation of the responses. The pure error is based on this variation of the responses under the
same conditions. If the value of pure error tends to zero, this implies that the reproducibility
factor is almost unity under the same conditions; which means the values of the response are
identical (Lamberta, 1990; Ermer and Miller, 2005). As an experimental point of view, if the
responses of the study are insensitive to small variations within the levels of experimental
factors, it could lead to low value of pure error and hence significant lack of fit.
This can be explained further with the results obtained in this study. During the course of the
optimisation process of MAE of lipids from grain amaranth, factors that greatly (negatively)
affected the yields of squalene and stigmasterol were eliminated during pre-optimisation studies
(Chapter 3). The optimisation process was operationalized using the remaining factors to which
squalene and stigmasterol were minimally sensitive. Hence the difference in their yields for each
combination was very little and over that even standard deviations for the replicates of each
combination were also very little. This caused the pure error to be almost equal to zero. Hence
the proposed models for squalene and stigmasterol yields obtained a significant lack of fit.
The main conclusion drawn from the above models predictions is that when the MAE of
lipids from grain amaranth is operationalized under these independent variables: AGF (g)/50
(ml) Solvent (5 - 15 g); MeOH/Hexane (10 - 30 % ml/ml), Extraction Time (5 - 15 min),
maximum amount of the squalene and stigmasterol can be extracted along with the oil. However,
best extraction yields of oil and its contituents squalene and stigmasterol by MAE can be
achieved with the conditions of operation at AGF (g)/50 (ml) Solvent = 5g/50 ml;
MeOH/Hexane = 30/70 % ml/ml, Extraction Time: 15 min.
4.4.2 SOXHLET EXTRACTION OPTIMISATION DESIGN
Conventional Soxhlet extraction of amaranth grain oil was studied by CCRD for determining
the best possible factor combination to have unbiased comparison with MAE. The Soxhlet
CCRD layout along with mean (triplicate) values of responses are presented in Table 4.12.
Page 104
89
Table 4.12: Soxhlet CCRD with observed response for oil, squalene & stigmasterol
Design
Points
AGF(g)/
200 (ml)
Solvent
MeOH/Hexane
(% ml/ml)
Extraction
Time
(min)
Oil Yield
(%)
Squalene
Yield
(mg/g of oil)
Stigmasterol
Yield
(mg/g of oil)
1 20 10 60 8.68 55.72 2.11
2 20 10 120 8.71 55.78 2.17
3 20 30 60 8.5 49.38 1.54
4 20 30 120 8.76 50.1 1.62
5 30 10 60 8.07 55.59 2.04
6 30 10 120 8.12 55.67 2.09
7 30 30 60 7.93 49.21 1.43
8 30 30 120 8.25 49.03 1.25
9 16.59 20 90 8.88 58.78 3.06
10 33.41 20 90 8 57.92 2.87
11 25 3.18 90 8.37 53.81 1.97
12 25 36.82 90 8.45 48.32 1.16
13 25 20 39.55 8.02 57.12 2.28
14 25 20 140.45 8.43 57.03 2.17
15 25 20 90 8.38 57.38 2.26
16 25 20 90 8.39 57.63 2.48
17 25 20 90 8.41 57.41 2.34
18 25 20 90 8.36 57.28 2.49
19 25 20 90 8.51 57.55 2.23
20 25 20 90 8.47 57.65 2.45
4.4.2.1 SOXHLET CCRD OIL YIELD (%)
The ANOVA revealed that the model was highly significant for oil yield at P value < 0.0001
with a R2 value of 0.9759, which was in reasonable agreement with its adjusted R
2 of 0.9542
accompanied with non-significant lack of fit. This implied that the model was fitted well and
could be used to predict the value of oil yield from grain amaranth by Soxhlet. The ANOVA
results are presented in Table 4.13.
Page 105
90
Table 4.13: Soxhlet CCRD - ANOVA for oil yield (%)
Oil Yield (%)
R2 = 0.9759; R
2 Adjusted = 0.9542
Source of Variation df Sum of Squares Mean Square F Ratio Prob > F
AGF(g)/ 200 (ml) Solvent
(20, 30)
1 1.0352 1.0352
330.9784 < 0.0001
MeOH/Hexane (% ml/ml)
(10, 30)
1 0.0000 0.0000 0.0007 0.9795
Extraction Time (min)
(60, 120)
1 0.1334 0.1334 42.6381 < 0.0001
AGF(g)/ 200 (ml) Solvent x
MeOH/Hexane (% ml/ml)
1 0.0018 0.0018 0.5755 0.4656
AGF(g)/ 200 (ml) Solvent x
Extraction Time (min)
1 0.0008 0.0008 0.2558 0.6240
MeOH/Hexane (% ml/ml) x
Extraction Time (min)
1 0.0313 0.0313 9.9915 0.0101
AGF(g)/ 200 (ml) Solvent x
AGF(g)/ 200 (ml) Solvent
1 0.0020 0.0020 0.6531 0.4378
MeOH/Hexane (% ml/ml) x
MeOH/Hexane (% ml/ml)
1 0.0000 0.0000 0.0078 0.9315
Extraction Time (min) x
Extraction Time (min)
1 0.0592 0.0592 18.9374 0.0014
Model 9 1.2670 0.1408 45.0112 < 0.0001
Lack of Fit 5 0.0145 0.0029 0.8617 0.5629
Error 10 0.0313 0.0031
Total 19 1.2982 0.0683
The linear variables such as AGF (g)/ 200 (ml) Solvent, Extraction Time (min); bilinear
variable MeOH/Hexane (% ml/ml) x Extraction Time (min) and quadratic variable [Extraction
Time (min)]2 were found to be significant. The predicted, second – order, polynomial model for
oil yield of AGF by Soxhlet extraction, in terms of coded factors is provided in Equation 4.10.
Page 106
91
Oil yield (%) = 8.4193 – 0.2753 [AGF (g)/ 200 (ml) Solvent] - 0.0004 [MeOH/Hexane
(%ml/ml)] + 0.0988 [Extraction Time (min)] + 0.015 [AGF (g)/ 200 (ml)
Solvent × MeOH/Hexane (% ml/ml)] + 0.01 [AGF (g)/ 200 (ml) Solvent
× Extraction Time (min)] + 0.0625 [MeOH/Hexane (% ml/ml) ×
Extraction Time (min)] + 0.0119 [AGF(g)/ 200 (ml) Solvent × AGF(g)/
200 (ml) Solvent] 0.0013 [MeOH/Hexane (% ml/ml) × MeOH/Hexane
(% ml/ml)] – 0.0641 [Extraction Time (min) × Extraction Time (min)]
(4.10)
Figure 4.6: Soxhlet Predicted vs actual plot for oil yield (%)
The R2 value for predicted vs actual plot (Figure 4.6) was 0.98 at P value < 0.0001. Hence
this model can be used to predict oil yield (%) under different experimental conditions during
Soxhlet extraction.
4.2.2.2 SOXHLET CCRD SQUALENE AND STIGMASTEROL YIELD (mg/g of oil)
The ANOVA for squalene as well as stigmasterol revealed that the models were significant (P
< 0.05) with R2 values of 0.8629 and 0.8329 respectively. The ANOVA results for squalene and
stigmasterol are presented in Tables 4.14 and 4.15 respectively.
Page 107
92
Table 4.14: Soxhlet CCRD - ANOVA for squalene yield (mg/g of oil)
Squalene Yield (mg/g of Oil )
R2 = 0.8629; R
2 Adjusted = 0.7397
Source of Variation df Sum of Squares Mean Square F Ratio Prob > F
AGF(g)/ 200 (ml) Solvent
(20, 30)
1 0.6271 0.6271 0.1898 < 0.6723
MeOH/Hexane (% ml/ml)
(10, 30)
1 86.0111 86.0111 26.0343 0.0005
Extraction Time (min)
(60, 120)
1 0.0205 0.0205 0.0062 0.9388
AGF(g)/ 200 (ml) Solvent x
MeOH/Hexane (% ml/ml)
1 0.1250 0.1250 0.0378 0.8497
AGF(g)/ 200 (ml) Solvent x
Extraction Time (min)
1 0.0968 0.0968 0.0293 0.8675
MeOH/Hexane (% ml/ml) x
Extraction Time (min)
1 0.0200 0.0200 0.0061 0.9395
AGF(g)/ 200 (ml) Solvent x
AGF(g)/ 200 (ml) Solvent
1 1.1942 1.1942 0.3615 0.5611
MeOH/Hexane (% ml/ml) x
MeOH/Hexane (% ml/ml)
1 118.1673 118.1673 35.7675 0.0001
Extraction Time (min) x
Extraction Time (min)
1 7.8627 7.8627 2.3799 0.1539
Model 9 208.0925 23.1214 6.9985 < 0.0027
Lack of Fit 5 32.9265 6.5853 296.2792 < 0.0001
Error 10 33.0376 3.3038
Total 19 241.1301 12.6911
The predicted, second – order, polynomial model for squalene yield of AGF by Soxhlet
extraction, in terms of coded factors is provided in Equation 4.11.
Squalene yield (mg/g of oil) = 57.5743 – 0.2143 [AGF (g)/ 200 (ml) Solvent] - 2.5096
[MeOH/Hexane (%ml/ml)] + 0.0387 [Extraction Time (min)] –
0.125 [AGF (g)/ 200 (ml) Solvent × MeOH/Hexane (% ml/ml)] -
0.11 [AGF (g)/ 200 (ml) Solvent × Extraction Time (min)] + 0.05
[MeOH/Hexane (% ml/ml) × Extraction Time (min)] - 0.2879
[AGF (g)/ 200 (ml) Solvent × AGF(g)/ 200 (ml) Solvent] -
2.8635 [MeOH/Hexane (% ml/ml) × MeOH/Hexane (% ml/ml)]
– 0.7386 [Extraction Time (min) × Extraction Time (min)]
(4.11)
Page 108
93
Table 4.15: Soxhlet CCRD - ANOVA for stigmasterol yield (mg/g of oil)
Stigmasterol Yield (mg/ g of Oil )
R2 = 0.8329; R
2 Adjusted = 0.6826
Source of Variation df Sum of Squares Mean Square F Ratio Prob > F
AGF(g)/ 200 (ml) Solvent
(20, 30)
1 0.0660 0.0660 0.8415 0.3805
MeOH/Hexane (% ml/ml)
(10, 30)
1 1.1322 1.1322 14.4322 0.0035
Extraction Time (min)
(60, 120)
1 0.0022 0.0022 0.0286 0.8691
AGF(g)/ 200 (ml) Solvent x
MeOH/Hexane (% ml/ml)
1 0.0136 0.0136 0.1735 0.6858
AGF(g)/ 200 (ml) Solvent x
Extraction Time (min)
1 0.0091 0.0091 0.1162 0.7403
MeOH/Hexane (% ml/ml) x
Extraction Time (min)
1 0.0055 0.0055 0.0703 0.7963
AGF(g)/ 200 (ml) Solvent x
AGF(g)/ 200 (ml) Solvent
1 0.1773 0.1773 2.2595 0.1637
MeOH/Hexane (% ml/ml) x
MeOH/Hexane (% ml/ml)
1 2.1258 2.1258 27.0971 0.0004
Extraction Time (min) x
Extraction Time (min)
1 0.3274 0.3274 4.1732 0.0683
Model 9 3.9109 0.4346 5.5392 < 0.0066
Lack of Fit 5 0.7192 0.1438 11.0047 < 0.0099
Error 10 0.7845 0.0785
Total 19 4.6955 0.2471
The predicted, second – order, polynomial model for stigmasterol yield of AGF by Soxhlet
extraction, in terms of coded factors is provided in Equation 4.12.
Stigmasterol yield (%) = 2.3899 – 0.0695 [AGF (g)/ 200 (ml) Solvent] - 0.2879 [MeOH/Hexane
(%ml/ml)] - 0.0128 [Extraction Time (min)] - 0.0413 [AGF(g)/ 200
(ml) Solvent × MeOH/Hexane (% ml/ml)] - 0.0338 [AGF (g)/ 200 (ml)
Solvent × Extraction Time (min)] - 0.0263 [MeOH/Hexane (% ml/ml)
× Extraction Time (min)] + 0.1109 [AGF(g)/ 200 (ml) Solvent ×
AGF(g)/ 200 (ml) Solvent] - 0.3840 [MeOH/Hexane (% ml/ml) ×
MeOH/Hexane (% ml/ml)] – 0.1507 [Extraction Time (min) ×
Extraction Time (min)] (4.12)
Page 109
94
The models of squalene and stigmasterol indicated significant influence of linear variable
MeOH/Hexane (% ml/ml) and quadratic variable [MeOH/Hexane (% ml/ml)]2. However, the
lack of fit was highly significant for both squalene and stigmasterol yields so it might not be
appropriate to use these models for prediction.
4.4.3 INTERPRETATION OF SOXHLET EXTRACTION AND ITS COMPARISON
WITH MAE
The response surface plots obtained (Figure 4.7) as a result of operationalizing CCRD for
Soxhlet extraction, well conveyed the relationship between independent and dependent process
variables and their impact on responses.
(a) (b)
Page 110
95
(c)
Figure 4.7: Soxhlet extraction process factors effects on oil (a), squalene (b) and stigmasterol (c) yields.
It is distinctly evident from the Soxhlet model predictions that yields of oil, squalene and
stigmasterol were improved by reducing the AGF to solvent ratio from 30 g/200 ml to 20 g/200
ml, moreover, responses were found to be maximised at a much lower sample to solvent ratio of
16 g/200 ml. This trend does not coincide with the trend showed by MAE, as MAE was showed
to have a limit to its positive impact, with a decrease in AGF to solvent ratio.
At a constant AGF to solvent ratio, Soxhlet showed a rise in the recovery of squalene and
stigmasterol with an increase in MeOH/Hexane from 10% to 20% and further increase in
methanol concentration caused negative impact on their respective yields. Additionally, Soxhlet
showed a negative pattern in oil yield with the rise in MeOH/Hexane. Furthermore, MAE
exhibited linear increase in all the responses until it reached 30% MeOH/Hexane.
After 90 min of Soxhlet extraction operating at a constant AGF to solvent ratio, the oil yield
appeared to have positive linear trend with extraction time until it reached its maximum limit,
similar growth orientation was adopted by squalene and stigmasterol, however oil and squalene
yield remained stable after reaching their respective maximum values whereas, stigmasterol
started showing diminishing effect in its yield when the Soxhlet extraction was extended beyond
90 min. In case of MAE, extraction time and responses continued their positive linear
Page 111
96
relationship until 15 min of process and then after reaching the maximum limit, null effect was
noticed on responses with further increase in extraction time.
Soxhlet’s predicted models for squalene and stigmasterol also reported significant lack of fit,
as reported by MAE.
The optimised MAE method achieved the highest extraction yield of 9.1% amaranth grain oil
containing 59.53 mg/g of squalene and 3.17 mg/g of stigmasterol, operating within the process
factors: AGF (g)/50 (ml) solvent = 5 g/50 ml; MeOH/ Hexane (% ml/ml) = 30/70 (% ml/ml);
Extraction Time = 15 min, whereas, optimised Soxhlet extraction achieved the highest extraction
yield of 8.8% amaranth oil containing 58.78 mg/g of squalene and 3.06 mg/g of stigmasterol
operating within the process factors: AGF (g)/200 (ml) solvent = 16.59 g/200 ml; MeOH/
Hexane (% ml/ml) = 30/70 (% ml/ml); Extraction Time = 90 min.
The experiments were carried out again using MAE and Soxhlet at their respective best factor
combinations to investigate the effect of AGF’s moisture content on the responses, using non
freeze dried AGF (moisture content: 12.39% wet basis, SD = 0.23; moisture content of freeze
dried AGF: 5.1% wet basis, SD = 0.06). The MAE study indicated a slight rise in oil yield from
9.1% to 9.38% and no significant changes in the yields of squalene and stigmasterol whereas;
Soxhlet extraction was not affected by moisture content.
4.4.4 TOTAL POLYPHENOL AND α- TOCOPHEROL ESTIMATION
Total polyphenol and α- Tocopherol content of amaranth grain oil was obtained from MAE
and Soxhlet extraction at their respective best factors combination (Figure 4.8).
Page 112
97
Figure 4.8: Comparison between MAE & Soxhlet in terms of α – tocopherol and total polyphenol content
MAE showed an increase in yield of thermo-liable constituents in oil like total polyphenols &
α – tocopherol by 43.90% & 6.51% respectively when compared to Soxhlet.
4.4.5 ANTIOXIDANT SCAVENGING ACTIVITY
The impact of MAE and Soxhlet on the oil’s antioxidant scavenging activities can be clearly
viewed in Figure 4.9
Figure 4.9: Comparison between MAE & Soxhlet in terms of their oil’s antioxidant scavenging activities.
Page 113
98
The antioxidant scavenging activity of the oil obtained from MAE was 16.13% greater than
oil extracted by Soxhlet, which can be attributed to its higher polyphenolic and α-tocopherol
content.
4.5 CONCLUSION
This study has established MAE as a more industrially viable methodology for extracting
amaranth grain oil than standard Soxhlet extraction methodology not just limited to higher oil
yield with reduced extraction time and solvent consumption but also in preserving the best
quality of its high value industrially applicable thermo stable (squalene & stigmasterol) as well
as the thermolabile (α – tocopherol and total tolyphenol) constituents of oil, maintaining higher
antioxidant scavenging activity.
4.6 ACKNOWLEDGEMENT
This work was carried out by the aid of a grant from the International Development Research
Centre (IDRC), Ottawa, Canada with the financial support from the Government of Canada
provided through the Canadian International Development Agency (CIDA). The authors greatly
acknowledge these agencies for their financial support.
Page 114
99
PREFACE TO CHAPTER 5
Chapter 3 and Chapter 4 of the thesis presented the detailed process of designing and
optimising the methodology for eluting lipophilic compounds from grain amaranth and
compared its efficiency with standard Soxhlet method in terms of oil yield and its quality.
Chapter 5, concludes this thesis by summarising the main results of the presented research,
highlights the intended and possible applications of the developed methodology and states the
ways that the generated results contribute to the scientific knowledge.
Page 115
100
CHAPTER 5: GENERAL SUMMARY AND CONCLUSION
Amaranth based lipophilic compounds find their application in nutraceutical as well as
cosmetic industries. Extraction is one of the key processing steps in recovering and purifying
lipophilic ingredients contained in plant-based materials. Classical extraction technologies are
very time and solvent consuming and also result in incomplete extraction from the sample
matrix. Therefore, there has been an increase in the exploration of novel extraction technologies.
Microwave assisted extraction (MAE) is a potential alternative to classical extraction
methodologies as it takes shorter extraction time, consumes less solvent, coupled with higher
extraction rates with better product quality. For efficient MAE, the operating factors of the
extraction process must be first optimized.
The experimental factors which determine the performance of MAE processes using a mono-
mode open microwave system include the sample matrix characteristics & size, solvent nature &
volume, extraction time, microwave power and temperature.
The MAE optimisation of lipophilic content of amaranth was built upon the outcomes of a
pre-optimisation study. Pre-optimisation consisted of a parameters screening study followed by a
full factorial screening design. The parameters screening study indicated the significance of
using amaranth grain flour (AGF) over whole amaranth grain and conducting MAE using solvent
mixtures composed of a strong and a weak microwave absorbing solvent operating above the
minimum microwave input power of 80 W. Based on the conclusions drawn from the parameters
screening study, a full factorial screening design was conceptualised using microwave input
power with four levels - 80, 120, 160 and 200 W and extraction solvent with three mixture
concentrations – A, B and C (A–Methanol/Hexane = 20/80% ml/ml; B–Ethanol/Hexane =
20/80% ml/ml; C–100% Hexane) at constant AGF to solvent ratio (10 g/50 ml) and extraction
time (10 min). The MAE responses were found to be maximized when operating at 120 W using
solvent A. However, this full factorial screening design could not predict how the responses
would be affected if values of AGF to solvent ratio (g/ml), concentrations of methanol in hexane
(% ml/ml) and extraction times (min) were varied, hence at that moment it was necessary to
determine whether responses could be further enhanced using these factors to create a central
Page 116
101
composite rotatable design (CCRD) operating at a microwave input power of 120 W. However,
before carrying out a response surface optimisation study, using above mentioned factors, it was
necessary to decide on the levels for these factors; hence the tested levels of AGF to solvent ratio
(10 g/50 ml of solvent) and extraction time (10 min) were considered as central points for a
proposed central composite rotatable (CCRD) design. This would enable the study to determine
best levels for maximising responses as it broadens the scope of the factor levels. Moreover,
before selecting the concentration ranges for methanol in hexane that could be varied for further
optimisation process, it was necessary to study how different concentrations of methanol in
hexane affect the microwave absorbing capacity of the whole solvent. Therefore, a bivariate
cubic polynomial mathematical model was proposed which predicted the microwave output
power for MAE by varying the concentration of methanol in hexane (% ml/ml) at a fixed
microwave input power of 120 W. This study proved that the microwave absorbing capacity of
the methanol-hexane mixture was increased linearly until concentration of methanol reached
30% initially, hence this strongly supported to test 20% methanol in hexane (% v/v) as the
recommended central point for a proposed central composite rotatable (CCRD) design
experiment.
The optimisation procedures for MAE started with a CCRD (CCRD - I) framed using the
following factors, that is, AGF/solvent (5g - 15g/50 ml); MeOH/ Hexane (10 - 30% ml/ml) and
Extraction Time (5 - 15 min) operating at constant microwave input power of 120 W. CCRD - I
observed a maximum oil yield of 9.1% at a factor combination obtained using AGF (g)/50 (ml)
solvent of 5 g/50 ml, MeOH/Hexane ratio of 30/70 (% ml/ml) and an extraction time of 15
minutes. Oil yield was found to be negatively affected at AGF (g)/50 (ml) solvent of 1.59 g/50
ml, even though there was an increase in oil yield with the decrease in the AGF (g)/50 (ml)
solvent. This implied that there is a limit to the positive impact on oil yield even if there is a
decrease in AGF (g)/50 (ml) solvent. However, the experimental data couldn’t present a limit to
the linear increase in oil, squalene and stigmasterol yields with an increase in MeOH/Hexane and
extraction time at a fixed AGF (g)/50 (ml) solvent of 5 g/50 ml i.e. the linear increase should be
followed either by a decrease or constant values after achieving its maximum limit. Hence it was
hypothesised that the models obtained using these experimental data may not be able to predict
the effects of these independent variables correctly if levels of MeOH/Hexane and extraction
Page 117
102
time cross 30/70 (% ml/ml) and 15 min limits respectively. Additional matter of concern was the
significant lack of fit of the squalene and stigmasterol models, it was assumed, if further
experiments were carried out, that we might come across the values of squalene and stigmasterol
that would enable us to fit data in a model with non-significant lack of fit so that we would have
reliable predictability.
As a result, CCRD - II was structured using a fixed AGF (g)/50 (ml) solvent of 5 g/50 ml by
varying following factors MeOH/Hexane (30 - 50% ml/ml) and Extraction Time (15 - 25 min)
operating at constant microwave input power of 120 W. When the outcomes of CCRD - I &
CCRD - II were amalgamated, it actualised the optimisation process. The dramatic pattern of
responses revealed determining effects in the yields of oil and its constituents’ squalene and
stigmasterol with an increase in MeOH/Hexane beyond 30%, on the other side, null effects were
noticed with an increase in extraction beyond 15 min. The main conclusion drawn from the
above models predictions is that when the MAE of lipids from grain amaranth is operationalized
under these independent variables: AGF (g)/50 (ml) Solvent (5 - 15 g); MeOH/Hexane (10 - 30
% ml/ml), Extraction Time (5 - 15 min), maximum amount of squalene and stigmasterol can be
extracted along with the oil. However, best extraction yields of oil, squalene and stigmasterol by
MAE can be achieved with the conditions of operation at AGF (g)/50 (ml) Solvent = 5g/50 ml;
MeOH/Hexane = 30/70 % ml/ml, Extraction Time: 15 min.
For the unbiased comparison, Soxhlet extraction was also optimised, within the factors as
follows: AGF (g)/200 (ml) Solvent (20 - 30 g); MeOH/Hexane (10 - 30 % ml/ml), Extraction
Time 60 - 120 min). The optimised Soxhlet extraction achieved the highest extraction yield of
8.8% amaranth oil containing 58.78 mg/g of squalene and 3.06 mg/g of stigmasterol operating
within the process factors: AGF(g)/200 (ml) solvent = 16.59 g/200 ml; MeOH/Hexane (%
ml/ml) = 30/70 (% ml/ml); Extraction Time = 90 min. This result proved MAE slightly better
than Soxhlet in their respective responses at a lower sample to solvent ratio and extraction time.
However, experiments were carried out again using MAE and Soxhlet at their respective best
factor combinations to investigate the effect of AGF’s moisture content on the responses, using
non freeze-dried AGF (moisture content: 12.39% wet basis, SD = 0.23; moisture content of
Page 118
103
freeze dried AGF: 5.1% wet basis, SD = 0.06). The MAE study indicated a rise in oil yield from
9.1% to 9.38% and there were no significant changes in the yields of squalene and stigmasterol
whereas, Soxhlet extraction was not affected by moisture content.
Furthermore, MAE also proved to be superior over Soxhlet in better preserving the thermo
labile constituents like polyphenols and α - tocopherol coupled with higher free radical-
scavenging activity when compared at their respective best factor combinations.
The present study confirms MAE as a more industrially viable methodology for extracting
lipids from amaranth grain over standard Soxhlet extraction methodology not just limited to
higher oil yield with reduced extraction time and solvent consumption but also for preserving the
best quality of its high value industrially applicable thermostable compounds, squalene &
stigmasterol as well as the thermolabile compounds α - tocopherol and total polyphenol,
maintaining higher antioxidant scavenging activity.
Page 119
104
REFERENCES
Aguilera, J.M. (2003). Solid liquid extraction. In Tazia, C., Liadakis, G. (Eds). Extraction
optimisation in Food Engineering. Marcel Dekker Inc., New York, p: 35.
Aioi, A., Shimizu, T., Kuriyama, K. (1995). Effect of squalene on superoxide anion generation
induced by a skin irritant, lauroylsarcosine. International Journal of Pharmaceutics, 113
(2), p: 159 - 164.
Alfaro, M.J., Bélanger, J.M.R., Padilla, F.C., Paré, J.R.R (2003). Influence of solvent, matrix
dielectric properties and applied power on the liquid-phase microwave assisted extraction
of ginger (Zingiber officinale). Food Research International, 36 (5), p: 499 - 504.
Amaranth Institute (2001). "Legacy" The Amaranth Institute newsletter, 14 (1).
http://amaranthinstitute.org/sites/default/files/docs/14_1.pdf
Amarowicz, R. (2009). Editorial, Squalene: A natural antioxidant? European Journal of Lipid
Science and Technology, 111, p: 411 - 412.
Anonymous (1998). Policy paper: Nutraceuticals / functional foods and health claims on foods.
Therapeutic Products Programme and the Food Directorate from the Health Protection
Branch, Health Canada, p: 3. http://www.hc-sc.gc.ca/fn-an/alt_formats/hpfb-
dgpsa/pdf/labeletiquet/nutra-funct_foods-nutra-fonct_aliment-eng.pdf
Baghurst, D.R., Mingos, D.M.P. (1992). Superheating Effects Associated with Microwave
Dielectric Heating. Journal of the Chemical Society, Chemical Communications, 9, p:
674 - 677.
Bale, J.R., Kaufmann, C.S. (1992). Special issue on grain amaranth. New potential for an old
crop. Food Reviews International, 8 (1), p: 5 - 49.
Baker, H., Frank, O. (1968). Clinical vitaminology methods and interpretation. Interscience
Publishers Inc., New York, NY, USA, p: 172 - 175.
Baker, L. A., Rayas-Duarte, P. (1998A). Freeze – thaw stability of amaranth starch and the
effects of salt and sugars. Cereal Chem, 75 (3), p: 301 - 307.
Baker, L. A., Rayas-Duarte, P. (1998B). Retrogradation of amaranth starch at different storage
temperatures and the effects of salt and sugars. Cereal Chemistry, 75 (3), p: 308 - 314.
Barbero, G.F., Palma, M., Barroso, C.G. (2006). Determination of capsacinoids in peppers by
microwave assisted extraction high performance liquid chromatography with
fluorescence detection. Analytica Chimica Acta. 578 (2), p: 227 - 233.
Page 120
105
Bartsch, H., Nair, J., Owen, R.W. (1999). Dietary polyunsaturated fatty acids and cancers of the
breast and colorectum: emerging evidence for their role as risk modifiers.
Carcinogenesis, 20 (12), p: 2209 - 2218.
Becker, R. (1994). Amaranth oil: composition, processing and nutritional qualities. In Paredes-
Lopez, O. (Eds). Amaranth – biology, chemistry and technology. CRC Press, London, p:
133 - 142.
Becker, R., Wheeler, E. L., Lorenz, K. (1981). A compositional study of amaranth grain. Journal
of Food Science, 46 (4), p: 1175 - 1180.
Bejosano, F.P., Corke, H. (1998). Effect of Amaranthus and buckwheat proteins on wheat dough
properties and noodle quality. Cereal Chem, 75 (2), p: 171 - 176.
Bello-Pérez, L. A., de Léon, Y.P., Agama-Acevedo, E., Paredes-López, O. (1998B). Isolation
and characterization of amaranth and banana starches. Starch/Stärke 50 (10), p: 409 -
413.
Belter, A., Skupinska, M., Giel-Pietranszuk, M., Grabarkiewicz, T., Rychlewski, L.,
Barciszewski, J. (2011). Squalene monooxygenase, a target for hypercholesterolemic
therapy. The Journal of Biological Chemistry, 392 (12), p: 1053 - 1075.
Bergera, A., Monnardb, I., Dionisib, F., Gumyc, D., Hayesd, K.C., Lambeletb, P. (2003).
Cholesterol-lowering properties of amaranth flakes, crude and refined oils in hamsters.
Food Chemistry, 81 (1), p: 119 - 124.
Betschart, A.A., Wood, I.D., Shepherd, A.D., Saunders, R.M. (1981). Amaranthus cruentus:
milling characteristics, distribution of nutrients within seed components and the effects of
temperature on nutritional quality. Journal of Food Science, 46 (4), p: 1181 - 1187.
Bhagya, S., Srinivas, H. (1992). Extraction of soybean (Glycine max.) with hexane-acetic acid:
Effect on oil quality. Food Chemistry, 44 (2), p: 123 - 125.
Blasco, L., Duracher, L., Forestier, J.P. (2006). Skin constituents as cosmetic ingredients: part I:
a study of bio-mimetic monoglycerides behavior at the squalene-water interface by the
"pendant drop" method in a static mode. Journal of Dispersion Science and Technology.
27 (6), p: 799 - 810.
Bligh, E.G., Dyer, W.J. (1959). A rapid method of total lipid extraction and purification. Canadian Journal of Biochemistry and Physiology, 37 (8), p: 911 - 917.
Breene, W.M. (1991). Food uses of grain amaranth. Cereal Foods World, 36 (5), p: 426 - 430.
Brenner, D. Hauptli, H. (1990). Seed shattering control with indehiscent utricles in grain
amaranth. Legacy 3:2-3. American Amaranth Institute, Bricelyn, MN.
Page 121
106
Bressani, R. (1993). Amaranth. In Macrae, R., Robinson, R.K., Sadler, M.J. (Eds).
Encyclopaedia of Food Science, Food Technology and Nutrition. Academic Press,
London, 1, p: 135 – 140.
Bressani, R. (1994). Composition and nutritional properties of amaranth. In Paredes-Lopez, O.
(Eds). Amaranth--Biology, Chemistry, and Technology. London, CRC Press, p: 185 -
206.
Bressani, R., Elías, L.G., González, J.M., Gómez – Brenes R., (1987A). The chemical
composition and protein quality of amaranth grain germ plasm in Guatemala. Archivos
Latinoamericanos de Nutrición, 37 (2), p: 364 - 377.
Bressani, R., Gonzalez, J.M., Zuniga, J., Breuner, M., Elias, L.G. (1987B). Yield, selected
chemical composition and nutritive value of 14 selections of amaranth grain representing
four species. Journal of the Science of Food and Agriculture, 38 (4), p: 347 - 356.
Bressani, R., Ligorria, L.E. (1994). Effect of lime cooking of grain amaranth on selected
chemical components and on its protein quality. Journal of Agricultural and Food
Chemistry, 42 (9), p: 1998 - 2001.
Bressani, R. (1989). The proteins of grain amaranth. Food Reviews International, 5(1), p: 13 -
38.
Bressani, R., Velásquez, L., Acevedo, E. (1990). Dietary fiber content in various grain amaranth
species and effect of processing. Amaranth Newsletter, 1, p: 5 - 8.
Bruni, R., Medici, A., Guerrini, A., Scalia, S., Poli, F., Muzzoli, M. (2001). Wild Amaranthus
caudatus seed oil, a nutraceutical resource from Ecuadorian flora. Journal of Agricultural
and Food Chemistry, 49 (11), p: 5455 - 5460.
Budin, J.T., Breene, W.M., Putnam, D.H. (1996). Some compositional properties of seeds and
oils of eight amaranthus species. Journal of the American Oil Chemists' Society, 73 (4),
p: 475 - 481.
Bunzel, M., Ralph, J., Steinhart, H. (2005). Association of non-starch polysaccharides and ferulic
acid in grain amaranth (Amaranthus caudatus L.) dietary fiber. Molecular Nutrition &
Food Research. 49 (6), p: 551 - 559.
Cai, Y.Z., Corke, H., Wu, H.X., (2004). Amaranth. Encyclopedia of Grain Science, p: 1 - 10.
Cai, Y.Z., Sun, M., Wu, H., Huang R., Corke, H. (1998). Characterisation and quantification of
betacyanin pigments from diverse amaranthus species. Journal of Agricultural and Food
Chemistry, 46 (6), p: 2063 - 2070.
Page 122
107
Capriles, V.D., Coelho, K.D., Guerra – Matias, A.C., Areas, J.A.G. (2008). Effects of processing
methods on amaranth starch digestibility and predicted glycemic index. Journal of Food
Science, 73 (7), H, p: 160 – 164.
Carlson, B.C., Jansson, A.M., Larsson, A., Bucht, A., Lorentzen, J.C., (2000). The endogenous
adjuvant squalene can induce a chronic T-cell-mediated arthritis in rats. The American
Journal of Physiology 156 (6), p: 2057 - 2065.
Caselato-Sousa, V.M., Amaya-Farfán, J. (2012). State of Knowledge on Amaranth Grain: A
Comprehensive Review, Journal of Food Science, 77(4), p: R93 - R104.
Chana, C.H., Yusoffa, R., Ngoha, G.C., Kung, F.W.L. (2011). Microwave-assisted extractions of
active ingredients from plants. Journal of Chromatography A, 1218 (37), p: 6213 - 6225.
Chauhan, G. S., Eskin, N. A. M., and Tkachuk, R. (1992). Nutritients and antinutrients in quinoa
seed. Cereal Chemistry, 69 (1), p: 85 - 88.
Chemat, F., Abert-Vian, M., Zill-e-Huma, Y-J. (2009). Microwave assisted separations: green
chemistry in action. In Pearlman J.T. (Eds). Green Chemistry Research Trends. Nova
Science Publishers, New York, p: 33 - 62.
Chemat, S., Ait-Amar, H., Lagha, A., Esveld, D.C. (2005). Microwave-assisted extraction
kinetics of terpenes from caraway seeds. Chemical Engineering and Processing, 44 (12),
p: 1320 - 1326.
Cheng, W.M., Raghavan, G.S.V., Ngadi, M., Wang, N. (2006). Microwave power control
strategies on the drying process I. Development and evaluation of new microwave drying
system. Journal of Food Engineering, 76 (2), p: 188 - 194.
Chen, S.S., Spiro, M. (1994). Study of microwave extraction of essential oil constituents from
plant materials. Journal of the Microwave Power and Electromagnetic Energy, 29 (4), p:
231 - 241.
Choi, H., Kim, W., Shin, M. (2004). Properties of Korean amaranth starch compared to waxy
millet and waxy sorghum starches. Starch/Stärke, 56 (10), p: 469 - 477.
Constantinides, P.P., Han, J., Davis, S.S. (2006). Advances in the use of tocols as drug delivery
vehicles. Pharmaceutical Research, 23 (2), p: 243 - 255.
Costa, L.M., Silva, F.V., Gouveia, S.T., Nogueira, A.R.A., Nóbrega, J.A. (2001). Focused
microwave-assisted acid digestion of oils: an evaluation of the residual carbon content.
Spectrochimica Acta Part B: Atomic Spectroscopy 56 (10), p: 1981 - 1985.
Cuadrado, C., Ayet, G., Burbano, C., Muzquiz, M., Camacho, L., Cavieres, E., Lovon, M.,
Osagie, A., Price, K.R. (1995). Occurrence of saponins and sapogenols in Andean crops.
Journal of the Science of Food and Agriculture, 67 (2), p: 169 - 172.
Page 123
108
Czaplicki, S., Ogrodowska, D., Derewiaka, D., Tańska, M., Zadernowski, R. (2011). European
Journal of Lipid Science and Technology, 113 (12), p: 1456 - 1464.
Czerwiński J, Bartnikowska E, Leontowicz H, Lange E, Leontowicz M, Katrich E, Trakhtenberg
S, Gorinstein S. (2004). Oat (Avena sativa L.) and amaranth (Amaranthus
hypochondriacus) meals positively affect plasma lipid profile in rats fed cholesterol-
containing diets. The Journal of Nutritional Biochemistry, 15 (10), p: 622 - 629.
De Ancos, B., Sgroppo, S., Plaza, L., Cano, M. P. (2002). Possible nutritional and health-related
value promotion in orange juice preserved by high-pressure treatment. Journal of the
Science of Food and Agriculture, 82 (8), p: 790 - 796.
Delazar, A., Nahar, L., Hamedeyazdan, S., Sarker, S.D. (2012). Microwave-assisted extraction
in natural products isolation. Methods in Molecular Biology, 864, p: 89 - 115.
Desai, K.N., Wei, H., Lamartiniere, C.A. (1996). The preventive and therapeutic potential of the
squalene-containing compound, Roidex, on tumor promotion and regression. Cancer
Letters, 101 (1), p: 93 - 96.
Dhellot, J.R., Matouba, E., Maloumbi, M.G., Nzikou, J.M., Safou Ngoma, D.G., Linder, M.,
Desobry, S., Parmentier, M. (2006). Extraction, chemical composition and nutrional
characterization of vegetable oils: Case of Amaranthus hybridus (var 1 and 2) of Congo
Brazzaville. African Journal of Biotechnology, 5 (11), p: 1095 - 1101.
Dickinson, E. (1993). Towards more natural emulsifiers. Trends in Food Science & Technology,
4 (10), p: 330 - 334.
Dixit, B. S., Srivasatava, S. N., Pal, M. (1991). Pigments of Amaranthus, Celosia, Beta vulgaris
and their utilization. Indian Journal of Natural Products, 7 (2), p: 12 - 14.
Dobos, G. (1992). Koerneramaranth als neue Kulturpflanze in Oesterreich. Introduktion und
zuechterische Aspekte. PhD thesis, University of Natural Resources and Applied Life
Sciences, Vienna, Austria.
Dodok, L., Modhir, A. A., Halasova, G., Polacek, I., Hozova, B. (1994). Importance and
utilisation of amaranth in food industry Part 1. Characteristic of grain and average
chemical constitution of whole amaranth flour. Food / Nahrung, 38 (4), p: 378 - 381.
Dominguez, H., Nunez, M.J., Lema, J.M. (1995). Enzyme-assisted hexane extraction of soya
bean oil. Food Chemistry 54 (2), p: 223 - 231.
Dreher, M.L., Dreher, C.J., Berry, J.W., Fleming, S.E. (1984). Starch digestibility of foods: a
nutritional perspective. C R C Critical Reviews in Food Science and Nutrition, 20 (1), p:
47 - 71.
Page 124
109
Emmerie, A., Engel, C. (1938). Colorimetric determination of α - tocopherol (Vitamin E).
Recueil des Travaux Chimiques des Pays-Bas, 57 (12), p: 1351 - 1355.
Escrich, E., Solanas, M., Moral, R., Escrich, R. (2011). Modulatory effects and molecular
mechanisms of olive oil and other dietary lipids in breast cancer. Current Pharmaceutical
Design, 17 (8), p: 817 - 830.
Escudero, N. L., de Arellano, M. L., Luco, J. M., Giménez, M. S., & Mucciarelli, S. I. (2004).
Comparison of the chemical composition and nutritional value of Amaranthus cruentus
flour and its protein concentrate. Plant Foods for Human Nutrition (Formerly Qualitas
Plantarum), 59 (1), p: 15 - 21.
Escudero, N. L., Zirulnik, F., Gomez, N. N., Mucciarelli, S. I., & Gimenez, M. S. (2006).
Influence of a protein concentrate from Amaranthus cruentus seeds on lipid metabolism.
Experimental Biology and Medicine, 231(1), p: 50 - 59.
FAO/WHO (1973). Energy and protein requirements: report of a joint FAO/WHO ad hoc expert
committee. FAO Nutrition Meetings Report Series, WHO Technical Report Series, Rome
and Geneva, 52 (522).
Folch, J., Lees, M., Sloane-Stanley, G.H. (1957). A Simple method for the isolation and
purification of total Lipides from animal tissues. The Journal of Biological Chemistry,
226 (1), p: 497 - 509.
Fox, C.B. (2009). Review: Squalene emulsions for parenteral vaccine and drug delivery.
Molecules, 14, p: 3286 - 3312.
Franke, W. (1989). Nutzpflanzenkunde: Nutzbare Gewächse der gemäßigten Breiten, Subtropen
und Tropen. Thieme – Verlag, Stuttgart and New York.
Gamel, T.H., Mesallam, A.S., Damir, A.A., Shekib, L.A., Linssen, J.P. (2007). Characterization
of amaranth seed oils. Journal of Food Lipids, 14 (3), p: 323 - 334.
Gamel, T. H., Linssen, J. P., Mesallem, A. S., Damir, A. A., and Shekib, L. A. (2005). Effect of
seed treatments on the chemical composition and properties of two amaranth species:
starch and protein. Journal of the Science of Food and Agriculture, 85 (2), p: 319 - 327.
Gamel, T. H., Linssen, J. P., Mesallem, A. S., Damir, A. A., and Shekib, L. A. (2006). Effect of
seed treatments on the chemical composition of two amaranth species: oil, sugars, fibres,
minerals and vitamins. Journal of the Science of Food and Agriculture, 86 (1), p: 82 - 89.
Garcia, L.A., Alfaro, M.A., Bressani, R. (1987). Disgestability and protein quality of raw and
heat processed defatted and non-defatted flours prepared with three amaranth species.
Journal of Agricultural and Food Chemistry, 35 (4), p: 604 – 607.
Page 125
110
Gerber, M. (1994). Olive oil and cancer. In Hill, M. J., Giacosa, A., Caygill, C. P. J.
Epidemiology of diet and cancer, p: 263 - 275.
Gins, M. S., Gins, V. K., Kononkov, P. F. (2002). Change in the biochemical composition of
Amaranth leaves during selection for increased amaranthine content. Applied
Biochemistry and Microbiology. 38, p: 474 - 479.
Gonor, K.V., Pogozheva, A.V., Derbeneva, S.A., Mal’tsev, G.I., Trushina, E.N., Mustafina, O.K.
(2006a). The influence of a diet with including amaranth oil on antioxidant and immune
status in patients with ischemic heart disease and hyperlipoproteidemia. Pherobase - Vopr
Pitan - The Pherobase, 75(6), p: 30 - 33.
Gonor, K.V., Pogozheva, A.V., Kulakova, S.N., Medvedev, F.A., Miroshnichenko, L.A.
(2006b). The influence of diet with including amaranth oil on lipid metabolism in patients
with ischemic heart disease and hyperlipoproteidemia. Pherobase - Vopr Pitan - The
Pherobase, 75(3), p: 17 - 21.
González, R., Carrara, C., Tosi, E., Anon, M. C., and Pilosof, A. (2007). Amaranth starch-rich
fraction properties modified by extrusion and fluidized bed heating. Journal of Food
Science and Technology, 40 (1), p: 136 - 143.
Gorinstein, S., Delgado-Licon, E., Pawelzik, E., Permady, H. H., Weisz, M., Trakhtenberg, S.
(2001). Characterisation of soluble amaranth and soybean proteins based on fluorescence,
hydrophobicity, electrophoresis, amino acid analysis, circular dichroism, and differential
scanning calorimetry measurements. Journal of Agricultural and Food Chemistry, 49
(11), p: 5595 - 5601.
Gorinstein, S., Pawelzik, E., Delgado Licon, E., Yamamoto, K., Kobayashi, S., Taniguchi, H.,
Haruenkit, R., Yong Seo, P. Soon Teck, J., Drzewiecki, J., Trakhtenberg, S. (2004). Use
of scanning electron microscopy to indicate the similarities and differences in
pseudocereal and cereal proteins. Journal of Food Science and Technology, 39 (2), p: 183
- 189.
Grobelnik Mlakar, S., Turinek, M., Jakop, M., Bavec, M., Bavec, F. (2009). Nutrition value and
use of grain amaranth: potential future application in bread making. Agricultura, 6 (2), p:
43 - 53.
Grobelnik Mlakar, S., Turinek, M., Jakop, M., Bavec, M., Bavec, F (2010). Grain amaranth as an
alternative and perspective crop in temperate climate. Journal for Geography, 5 - 1, p:
135 - 145.
Hao, J., Han, W., Huang, S., Xue, D., Deng, X. (2002). Microwave assisted extraction of
artemisin from Artemisia annua L. Separation and Purification Technology, 28 (3), p:
191 - 196.
Page 126
111
Hayes, B.L., (2002). Microwave synthesis: chemistry at the speed of light, CEM Publishing,
Matthews, NC.
He, H.P., Cai, Y.Z., Sun, M., Corke, H. (2002). Extraction and purification of squalene from
Amaranthus grain. Journal of Agricultural and Food Chemistry, 50 (2), p: 368 - 372.
He, H.P., Corke, H. (2003). Oil and Squalene in Amaranthus Grain and Leaf. Journal of
Agricultural and Food Chemistry, 51 (27), p: 7913 - 7920.
Hemwimon, S., Pavasant, P., Shotiprule, A. (2007). Microwave assisted extraction of
antioxidative anthraquinones from roots of Morinda citrifolia. Separation and
Purification Technology. 54 (1), p: 44 - 50.
Herrero, M.A., Kremsner, J.M., Kappe, C.O. (2008). Nonthermal microwave effects revisited:
on the importance of internal temperature monitoring and agitation in microwave
chemistry. The Journal of Organic Chemistry, 73 (1), p: 36 - 47.
Herrero, M., Mendiola, J.A., Cifuentes, A., Ibáñez, E. (2010). Supercritical fluid extraction:
recent advances and applications. Journal of Chromatography A, 1217 (16), p: 2495 -
2511.
Hoover, R., Sinnott, A. W., Perera, C. (1998). Physicochemical characterization of starches from
Amaranthus cruentus grains. Starch/Stärke, 50 (11- 12), p: 456 - 463.
Hosseini, M., Stiasni, N., Barbieri, V., Kappe, C.O. (2007). Microwave-assisted asymmetric
organocatalysis. A probe for nonthermal microwave effects and the concept of
simultaneous cooling. The Journal of Organic Chemistry, 72 (4), p: 1417 - 1424.
Hu, Z., Cai, M., Liang, H.H. (2008). Desirability function approach for the optimization of
microwave-assisted extraction of saikosaponins from Radix Bupleuri. Separation and
Purification Technology, 61(3), p: 266 - 275.
Imeri, A., Gonzalez, J.M., Flores, R., Elίas, L.G., Bressani, R., (1987). Genetic variability and
correlation of yield, grain size, chemical composition and protein quality of 25 varieties
of amaranth (Amaranthus caudatus). Instituto de Nutrición de Centro América y Panamá,
37 (1), p: 132 - 146.
Irving, D.W., Betschart, A.A., Saunders, R.M. (1981). Morphological studies on Amaranthus
cruentus. Journal of Food Science, 46 (4), p: 1170 - 1174.
Jadhav, D., Rekha B.N., Gogate, P.R., Rathod, V.K. (2009). Extraction of vanillin from vanilla
pods: a comparison study of conventional soxhlet and ultrasound assisted extraction.
Journal of Food Engineering, 93 (4), p: 421 - 426.
Page 127
112
Jahaniaval, F., Kakuda, Y., Marcone, M. F. (2000). Fatty acid and triacylglycerol compositions
of seed oils of five Amaranthus accessions and their comparison to other oils. Journal of
the American Oil Chemists' Society, 77 (8), p: 847 - 852.
Jobling, S. (2004). Improving starch for food and industrial applications. Current Opinion in
Plant Biology, 7 (2), p: 210 - 218.
Kigel, J. (1994). Development and ecophysiology of amaranths. In: Peredes-Lopez, O. (ed),
Amaranth biology, chemistry and technology. CRC Press, p: 39 - 73.
Kim, H.K., Kim, M.J., Cho, H.Y., Kim, E.K., Shin, D.H. (2006a). Antioxidative and anti-
diabetic effects of amaranth (Amaranthus esculantus) in streptozotocin-induced diabetic
rats. Cell Biochemistry and Function, 24(3), p:195 - 199.
Kim, H.K., Kim, M.J., Shin, D.H. (2006b). Improvement of lipid profile by amaranth
(Amaranthus esculantus) supplementation in streptozotocin-induced diabetic rats. Annals
of Nutrition and Metabolism, 50(3), p: 277 - 281.
Kim, I.H., Yoon, S.H. (1990). Effect of extraction solvents on oxidative stability of crude
soybean oil. Journal of the American Oil Chemists' Society, 67(3), p: 165 - 167.
Kingston, H.M., Haswell, S.J. (Eds) (1997). Microwave-Enhanced Chemistry. Fundamentals,
Sample Preparation and Applications. American Chemical Society, Washington, DC.
Kingston, H.M., Jassie, L.B. (1986). Microwave energy for acid decomposition at elevated
temperatures and pressures using biological and botanical samples. Analytical chemistry,
58 (12), p: 2534 - 2541.
Kingston, H.M., Jassie, L. B. (1988). Introduction to microwave sample preparation: theory and
practice. American Chemical Society, Washington, DC.
Kiss, G.A.C., Forgacs, E., Serati, T.C., Mota, T., Morais H., Ramos. A. (2000). Optimisation of
the microwave assisted extraction of pigments from paprika (Capsicum annum L.)
powders. Journal of Chromatography A, 889, p: 41 - 49.
Klimczak, I., Malecka, M., Pacholek, B. (2002). Antioxidant activity of ethanolic extracts of
amaranth seeds. Food/Nahrung, 46 (3), p: 184 - 186.
Kleinschmidt, G. (2005). Performance parameters, calculations and tests. In Ermer, J., Miller,
J.H.M. (Eds). Method validation in pharmaceutical analysis: a guide to best practice.
WILEY-VCH Verlag GmbH & Co. KGaA, Weinheim, p: 120 - 169.
Kohno, Y., Egawa, Y., Itoh, S., Nagaoka, S., Takahashi, M., Mukai, K. (1995). Kinetic study of
quenching reaction of singlet oxygen and scavenging reaction of free radical by squalene
in n-butanol. Biochimica et Biophysica Acta, 1256 (1), p: 52 - 56.
Page 128
113
Kong, X., Bao, J., Corke, H. (2009). Physical properties of Amaranthus starch. Food Chemistry,
113 (2), p: 371 - 376.
Kong, X., Bertoft, E., Bao, J., Corke, H. (2008). Molecular structure of amylopectin from
amaranth starch and its effect on physicochemical properties. International Journal of
Biological Macromolecules, 43 (4), p: 377 - 382.
Konishi, Y., Fumita, Y., Ikeda, K., Okuno, K., and Fuwa, H. (1985). Isolation and
characterization of globulin from seeds of Amaranthus hypochondriacus, L. Agricultural
and Biological Chemistry, 49 (5), p:1453 - 1459
Köseolğua, S.S., Engelgau, D.E. (1990). Membrane applications and research in the edible oil
industry: an assessment. Journal of the American Oil Chemists' Society, 67 (4), p: 239 -
249,
Kremsner, J.M., Kappe, C.O. (2006). Silicon carbide passive heating elements in microwave-
assisted organic synthesis. The Journal of Organic Chemistry, 71 (12), p: 4651 - 4658.
Krishnaswamy, K., Orsat, V., Gariépy, Y., Thangavel, K. (2012). Optimization of microwave-
assisted extraction of phenolic antioxidants from grape seeds (Vitis vinifera). Food and
Bioprocess Technology, 6 (2), p: 441 - 455.
Kubra, I.R., Kumar, D., Rao, L.J.M. (2013). Effect of microwave-assisted extraction on the
release of polyphenols from ginger (Zingiber officinale). International Journal of Food
Science and Technology, p: 1 - 6.
Kulakova, S.N., Pozdniakov, A.L., Korf II, Karagodina, Z.V., Medvedev, F.A., Viktorova, E.V.,
Gonor, K.V., Kamysheva, I.M., Gadzhieva, Z.M. (2006). Amaranths oil: peculiarities of
chemical composition and influence on lipid metabolism by rats. Vopr Pitan, 75 (3), p: 36
- 42.
Lambert, D. (1990). Statistical methods for quality improvement. Technometrics: Journal of the
American Society for Quality and the American Statistical Association, 32 (3), p: 339 -
340.
Latha, C. (2006). Microwave assisted extraction of embelin from Embelia ribes. Biotechnology
Letters, 29 (2), p: 319 - 322.
La Vecchia C., Negri, E. (1997). Fats in seasoning and the relationship to pancreatic cancer.
European Journal of Cancer Prevention, 6(4), p: 370 - 373.
La Vecchia, C., Negri, E., Franceschi, S., Decarli, A., Giacosa, A., Lipworth, L. (1995). Olive
oil, other dietary fats, and the risk of breast cancer (Italy). Cancer Causes & Control, 6
(6), p: 545 – 550.
Page 129
114
Lawson, H., (1995). Food oils and fats: technology, utilization, and nutrition., Chapman Jz Hall,
New York, NY.
Leadbeater, N.E., Pillsbury, S.J., Shanahan, E., Williams V.A. (2005). An assessment of the
technique of simultaneous cooling in conjunction with microwave heating for organic
synthesis. Tetrahedron, 61, p: 3565 - 3585.
Lebovka, F., Vorobiev, N., Chemat, E. (2011). Enhancing Extraction Processes in the Food
Industry. CRC Press, p: 89.
León-Camacho, M., García-González, D.L., Aparicio, R. (2001). A detailed and comprehensive
study of amaranth (Amaranthus cruentus L.) oil fatty profile. European Food Research
and Technology, 213 (4-5), p: 349 - 355.
Letellier, M., Budzinski, H., Charrier, L., Capes, S., Dorthe, A.M. (1999). Optimization by
factorial design of focused microwave assisted extraction of polycyclic aromatic
hydrocarbons from marine sediment. Fresenius' Journal of Analytical Chemistry, 364 (3),
p: 228 - 237.
Letellier, M., Budzinski. H. (1999). Microwave assisted extraction of organic compounds.
Analusis, 27 (3), p: 259 - 271.
Lew, A., Krutzik, P.O., Hart, M.E., Chamberlin, A.R., (2002). Increasing rate of reaction:
microwave assisted organic synthesis for combinatorial chemistry. Journal of
Combinatorial Chemistry, 4 (2), p: 95 - 105.
Lidström, L., Tierney, J., Wathey, B., Westman, J. (2001). Microwave assisted organic synthesis
- a review. Tetrahedron, 57 (45), p: 9225 - 9283
Liener, I.E. (1980). Heat labile antinutritional factors. In Summerfield, R.J., Bunting, A.H.
Advances in legume science. Kew Publishing, Royal Botanic Gardens, Kew, p: 157 -
170.
Linsberger-Martin, G., Lukasch, B., Berghofer, E. (2012). Effects of high hydrostatic pressure on
the RS content of amaranth, quinoa and wheat starch. Starch/Stärke, 64 (2), p: 157 - 165.
Lopez-Avila, V., Young, R., Beckert, W.F. (1994). Microwave assisted extraction of organic
compounds from standard reference soils and sediments. Analytical Chemistry, 66 (7), p :
1097 - 1106.
Lopez, M. G., Bello-Pérez, L. A., Paredes-Lopez, O. (1994). Amaranth carbohydrates. In:
Paredes-Lopez, O (ed), Amaranth: biology, chemistry and technology. CRC Press: Boca
Raton, FL, p: 107 - 131.
Page 130
115
Lou-Bonafonte, J.M., Arnal, C., Navarro, M.A., Osada, J. (2012). Efficacy of bioactive
compounds from extra virgin olive oil to modulate atherosclerosis development,
Molecular Nutrition & Food Research, 56 (7), p: 1043 - 1057.
Lucchesi, M.E., Chemat, F., Smalja, J. (2004). Solvent free microwave extraction of essential oil
from aromatic herbs: comparison with conventional hydrodistillation. Journal of
Chromatography A, 1043 (2), p: 323 - 327.
Luque de Castro, M. D., Garcia-Ayuso, L. E. (1998). Soxhlet extraction of solid materials: An
outdated technique with a promising innovative future. Analytica Chimica Acta, 369 (1 -
2), p: 1 - 10.
Luque de Castro, M.D., Jimenez-Carmona, M.M., Fernandez, V. (1999). Towards more rational
techniques for the isolation of valuable essential oils from plants. Trends in Analytical
Chemistry, 18 (11), p: 708 - 716.
Luque-García, J.L., Luque de Castro, M.D. (2003). Where is microwave-based analytical
equipment for solid sample pre-treatment going? Trends in Analytical Chemistry, 22 (2),
p: 90 – 98.
Lyon, C. K., Becker, R. (1987). Extraction and refining of oil from amaranth seed. Journal of the
American Oil Chemists' Society 64 (2), p: 233 - 236.
Malecka, M. (1991). The effect of squalene on the heat stability of rapeseed oil and model lipids.
Die Nahrung, 35 (5), p: 541 - 542
Mandal, V., Mohan, Y., Hemalatha, S. (2007). Microwave assisted extraction – An innovative
and promising extraction tool for medicinal plant research. Pharmacognosy Reviews,
1(1), 7 - 18.
Marchini, G., Lindow, S., Brismar, H., Ståbi, B., Berggren, V., Ulfgren, A.K., Lonne-Rahm, S.,
Agerberth, B., Gudmundsson, G.H. (2002). The newborn infant is protected by an innate
antimicrobial barrier: peptide antibiotics are present in the skin and vernix caseosa.
British Journal of Dermatology, 147 (6), p: 1127 - 1134
Marcone, M. F., Beniac, D. R., Harauz, G., Yada, R. Y. (1994). Quaternary structure and model
for the oligomeric seed globulin from Amaranthus hypochondriacus K343. Journal of
Agricultural and Food Chemistry. 42 (12), p: 2675 - 2678.
Marcone, M. F. (1999). Evidence confirming the existence of a 7S globulin-like storage protein
in A. hypochondriacus seed. Food Chemistry. 65 (4), p: 533 - 554.
Marcone, M.F. (2001). Starch properties of Amaranthus pumilus (seabeach amaranth): a
threatened plant species with potential benefits for the breeding/amelioration of present
Amaranthus cultivars. Food Chemistry, 73 (1), p: 61 - 66.
Page 131
116
Martine Champ, M., Langkilde, A.M., Brouns, F., Kettlitz, B., Le Bail-Collet, Y. (2003).
Advances in dietary fibre characterisation. 2. Consumption, chemistry, physiology and
measurement of resistant starch; implications for health and food labelling. Nutrition
Research Reviews, 16 (2), p: 143 - 161.
Martinez, E. N., Castellani, O. F., Anon, M. C. (1997). Common molecular features among
amaranth storage proteins. Journal of Agricultural and Food Chemistry. 45 (10), p: 3832 -
3839.
Martin-Moreno, J.M., Willett, W.C., Gorgojo, L., Banegas, J.R., Rodriguez-Artalejo, F.,
Fernandez-Rodriguez, J.C., Maisonneuve, P., Boyle, P. (1994). Dietary fat, olive oil
intake and breast cancer risk. International Journal of Cancer, 58(6), p: 774 - 780.
Martirosyan, D.M., Miroshnichenko, L.A., Kulakova, S.N., Pogojeva, A.V., Zoloedov, VI
(2007). Amaranth oil application for coronary heart disease and hypertension. Lipids in
Health and Disease, 6 (1), p: 1 - 12.
Meda, V., Orsat, V., Raghavan, G. S. V. (2005). Microwave heating and the dielectric properties
of foods. In Schubert, H., Regier, M. (Eds.), The microwave processing of foods.
Woodhead Publishing Ltd., Cambridge, p: 61 - 75.
Moreaua, R.A., Whitakerb, B.D., Hicks, K.B. (2002). Phytosterols, phytostanols, and their
conjugates in foods: structural diversity, quantitative analysis, and health-promoting uses.
Progress in Lipid Research, 41(6), p: 457 - 500
Mburu, M.W., Gikonyo, N.K., Kenji, G.M., Mwasaru, A.M. (2011). Properties of a
Complementary Food based on Amaranth Grain (Amaranthus cruentus) Grown in Kenya.
Journal of Agriculture and Food Technology, 1 (9), p: 153 - 178.
Mikulikova, D. and Kraic, J. (2006). Natural sources of health-promoting starch. Journal of Food
and Nutrition Research, 45 (2), p: 69 - 76.
Monteros, C.J., Nieto, C.C., Caicedo, C.V., Rivera, M.M., Vimos, C.N. (1998). Iniap alegria
primera variedade mejorada de amaranto para la sierra ecuatoriana. In Produccion y
procesamiento de quinua en Ecuador. Retrieved from: http://www.idrc.ca
Murakoshi, M., Nishino, H., Tokuda, H., Iwashima, A., Okuzumi, J., Kitano, H., Iwasaki, R.
(1992). Inhibition by squalene of the tumor-promoting activity of 12-O-
Tetradecanoylphorbol-13-acetate in mouse-skin carcinogenesis. International Journal of
Cancer, 52(6), p: 950 - 952.
Myers, R. H., Montgomery, D. C. (2002A). Two-level factorial designs. In Myers, R. H.,
Montgomery, D. C. (Eds.), Response surface methodology - process and product
optimization using designed experiments, New York: John Wiley & Sons, p: 85 - 154.
Page 132
117
Myers, R. H., Montgomery, D. C. (2002B). Two-level fractional factorial designs. In Myers, R.
H., Montgomery, D. C. (Eds.), Response surface methodology - process and product
optimization using designed experiments. New York: John Wiley & Sons, p: 155 - 196.
Naziri, E., Mantzouridou, F., Tsimidou, M.Z. (2011). Squalene resources and uses point to the
potential of biotechnology. Lipid Technology, 23 (12), p: 270 - 273.
Nemes, S.M., Orsat, V. (2010). Screening the experimental domain for the microwave-assisted
extraction of secoisolariciresinol diglucoside from flaxseed prior to optimization
procedures. Food and Bioprocess Technology, 3 (2), p: 300 - 307.
Nemes, S.M. (2012). Practical Methods for Lignans Quantification. PhD Thesis. Bioresource
Engineering Department, McGill University, Montreal, Canada
Newmark, H.L. (1997). Squalene, olive Oil, and cancer risk: a review and hypothesis. Cancer
Epidemiology, Blornarkers and Prevention, 6, p: 1101 - 1103.
Nuchter, M., Ondruschka, B., Weiß, D., Bonrath, W., Gum, A. (2005). Contribution to the
qualification of technical microwave systems and to the validation of microwave-assisted
reactions and processes. Chemical Engineering & Technology, 28 (8), p: 871 - 881.
Oleszek, W., Junkuszew, M., Stochmal, A. (1999). Determination and toxicity of saponins from
Amaranthus cruentus seeds. Journal of Agricultural and Food Chemistry, 47 (9), p: 3685
- 3687.
Ondruschka, B., Asghari, J. (2006). Microwave assisted extraction a state of the art overview of
varieties. Chimia, 60 (6), p: 321 - 325.
Opute, F.I. (1979). Seed lipids of the grain amaranths. The Journal of Experimental Botany, 30
(116), p: 601 - 606.
Orsat, V., Raghavan, G. S. V., Meda, V. (2005). Microwave heating and the dielectric properties
of foods. In Schubert, H., Regier, M. (Eds.), The microwave processing of foods.
Woodhead Publishing Ltd., Cambridge, p: 105 - 118.
Pan, X., Niu, G., Liu, H. (2002). Comparison of microwave-assisted extraction and conventional
extraction techniques for the extraction of tanshinones from Salvia miltiorrhiza bunge.
Biochemical Engineering Journal, 12 (1), p: 71 - 77.
Paredes – Lόpez, O., Bello – Pérez, L.A., Lόpez, M.G. (1994). Amylopectin: structural,
gelatinization and retrogradation studies. Food Chemistry, 50 (4), p: 411 - 417.
Pederson, B., Kalinowski, L.S., Eggum, B.O. (1987). The nutritive value of amaranth grain
(Amaranthus caudatus). Protein and minerals of raw and processed grain. Plant Foods
Human Nutrition, 36 (4), p: 309 - 324.
Page 133
118
Périno-Issartier, S., Zill-e-Huma, Y-J., Abert-Vian, M., Chemat, F. (2011). Solvent free
microwave-assisted extraction of antioxidants from sea buckthorn (Hippophae
rhamnoides ) food by-products. Food Bioprocess and Technology, 4 (6), p: 1020 - 1028.
Peterson, E.R. (1993). Quality enhancement using microwaves. In 28th Annual Symposium
Proceedings, Montreal, Canada, p: 89 - 101.
Peyre, F., Datta, A., Seyler, C., 1997. Influence of the dielectric property on microwave heating
patterns: application to food materials. The Journal of microwave power and
electromagnetic energy, 32 (1), p: 3 - 14
Pricea, K.R., Johnsonb, I. T., Fenwicka, G. R. Malinowcd, M. R. (1987). The chemistry and
biological significance of saponins in foods and feedingstuffs. C R C Critical Reviews in
Food Science and Nutrition, 26 (1), p: 27 - 135.
Proctor, A., Bowen, D.J. (1996). Ambient-temperature extraction of rice bran oil with hexane
and isopropanol. Journal of the American Oil Chemists’ Society, 73 (6), p: 811 - 813.
Qian, J.Y., Kuhn, M. (1999). Characterization of Amaranthus cruentus and chenopodium quinoa
starch. WILEY-VCH Verlag GmbH, D-69451 Weinheim, Starch/Stärke 51 (4), S, p: 116
- 120.
Qureshi, A.A., Lehmann, J.W., Peterson, D.M. (1996). Amaranth and its oil inhibit cholesterol
biosynthesis in 6 weeks – old female chickens. Journal of Nutrition, 126 (8), p: 1972 -
1978.
Radosavljevic, M., Jane, J., Johnson, L.A. (1998). Isolation of amaranth starch by diluted
alkaline-protease treatment. Cereal Chem, 75 (2), p: 212 - 216.
Raghavan, G. S. V., Orsat, V., Meda, V. (2005). Microwave processing of foods. Stewart
Postharvest Review, 1 (3), p: 1 - 8.
Rao, C.V., Newmark, H.L., Reddy, B.S. Chemopreventive effect of squalene on colon cancer.
Carcinogenesis, 19 (2), p: 287 - 290.
Rastogi, A., Shukla, S. (2012). Amaranth: A new millennium crop of nutraceutical values.
Critical Reviews in Food Science and Nutrition, 53 (2), p: 109 - 125.
Raynie, D.E. (2000). Extraction. In Wilson, I.D., Adlard, E.R., Cooke, M., Pooliem, C.F. (Eds).
Encyclopedia of separation science. Academic Press, San Diego
Rosenberg, H.R. (1945). Chemistry and physiology of vitamins. Interscience Publishers Inc.,
New York, NY, USA, p: 452 - 453.
Routray, W., Orsat, V. (2011). Microwave-Assisted Extraction of Flavonoids: A Review. Food
and Bioprocess Technology, 5, p: 409 - 424.
Page 134
119
Reddy, B.S. (1992). Dietary fat and colon cancer: animal model studies. Lipids, 27 (10), p: 807 -
813.
Repo-Carrasco-Valencia, R., Hellstrom, J. K., Pihlava, J. M., Mattila P.H. (2010). Flavonoids
and other phenolic compounds in Andean indigenous grains: Quinoa (Chenopodium
quinoa), kaniwa (Chenopodium pallidicaule) and kiwicha (Amaranthus caudatus). Food
Chemistry. 120 (1), p: 128 - 133.
Rissmann, R., Oudshoorn, M.H., Kocks, E., Hennink, W.E., Ponec, M., Bouwstra, J.A. (2008).
Lanolin derived lipid mixtures mimic closely the lipid composition and organization of
vernix caseosa lipids. Biochimica et Biophysica Acta, 1778 (10), p: 2350 - 2360.
RCS, (2007). Classic Kit: Soxhlet extractor. Chemistry World, Royal Society of Chemistry.
http://www.rsc.org/chemistryworld/Issues/2007/September/ClassicKitSoxhletExtractor.as
p
Saillard, R., Poux, M., Berlan, E.J. (1995). Microwave heating of organic solvents : thermal
effects and field modelling, Tetrahedron, 51(14), p: 4033 - 4042.
Saint-Leger, D., Bague, A., Cohen, E., Chivot, M. (1986). A possible role for squalene in the
pathogenesis of acne. I. In vitro study of squalene oxidation. British Journal of
Dermatology, 114 (5), p: 535 - 542.
Sauer, J.D. (1967). The grain amaranths and their relatives: a revised taxonomic and
geographical survey. Annals of Missouri Botanical Gardens, 54, p: 103 - 137.
Saunders, R.M., Becker, R. (1984). Amaranthus: a potential food and feed resource. In:
Pomeranz, Y. (Eds). Advances in cereal science and technology. American Association
of Cereal Chemists, 6, p: 357 - 396.
Segura-Nieto, M., Barba de la Rosa, A.P., Paredes-Lo´pez, O. (1994). Biochemistry of amaranth
proteins. In Paredes-Lo´pez O (Eds) Amaranth: Biology, Chemistry, and Technology,
Boca Raton, FL: CRC Press, p: 75 - 106.
Senft, J. P. (1979). Protein quality of amaranth grain. In: Proceeding of second amaranth
conference Rodale Press Inc., Emmaus, Pennsylvania, p: 43 - 47.
Senthilkumara, S., Devakia, T., Manoharb, B.M., Babua, M.S. (2006). Effect of squalene on
cyclophosphamide-induced toxicity. Clinica Chimica Acta, 364 (1–2), p: 335 - 342.
Shin, D.H., Heo, H.J., Lee, Y.J., Kim, H.K. (2004). Amaranth squalene reduces serum and liver
lipid levels in rats fed a cholesterol diet. British Journal of Biomedical Science, 61 (1), p:
11 - 14.
Page 135
120
Sihvonen, M., Jarvenpää, E., Hietaniemi, V., Huopalahti, R. (1999). Advances in supercritical
carbon dioxide technologies. Trends in Food Science and Technology, 10 (6-7), p: 217 -
222.
Sims, R.J., Fioriti, J.A., Kanuk, M.J. (1972). Sterols additives as polymerisation inhibitors for
frying oils. Journal of the American Oil Chemists' Society. 49 (5), p: 298 - 301.
Singhal, R.S, Kulkarni, P.R. (1988). Review: Amaranths - An underutilized resource.
International Journal of Food Science & Technology. 23 (2), p: 125 - 140.
Singhal, R.S., Kulkarni, P.R. (1990). Effect of puffing on oil characteristics of Amaranthus
(Rajgeera) seeds. Journal of the American Oil Chemists' Society, 67 (12), p: 952 - 954.
Singh, A., Sabally, K., Kubow, S., Donnelly, D.J., Gariepy, Y., Orsat, V., Raghavan, G.S.V.
(2011). Microwave-assisted extraction of phenolic antioxidants from potato peels.
Molecules, 16 (3), p: 2218 - 2232.
Slinkard, K., Singleton, V. L. (1977). Total phenol analysis: automation and comparison with
manual methods. American Journal of Enology and Viticulture, 28, 49 – 55.
Smith, R.D. (1984). Microwave power in industry. Final report. Electric Power Research
Institute, 3465, A - 8.
Smith, T.J. (2000). Squalene: potential chemopreventive agent. Expert Opinion on.
Investigational Drugs, 9 (8), p: 1841 - 1848.
Smith, T.J., Yang, G.Y., Seril, D.N., Liao, J., Kim, S. (1998). Inhibition of 4-
(methylnitrosamino)-1-(3-pyridyl)-1-butanoneinduced lung tumorigenesis by dietary
olive oil and squalene. Carcinogenesis, 19 (4), p: 703 - 706.
Souci, S.W., Fachmann W., Kraut, H. (1994). Food Composition and Nutrition Tables.
Wissenschaft Verlag, Stuttgart.
Sparr Eskilsson, C., Björklund, C. (2000). Review: analytical-scale microwave-assisted
extraction, Journal of Chromatography A, 902 (1), p: 227 - 250.
Stintzing, F. C., Kammerer, D., Schieber, A., Adama, H., Nacoulma, O. G., Carle, R. (2004).
Betacyanins and phenolic compounds from Amaranthus spinosus L. and Boerhavia
erecta L. Journal of Biosciences, 59 (1 – 2), p: 1 - 8.
Srinivas, H., Swamylingappa, B., Chand, N. (1992). Secondary extraction of soybeans using
hexane-acetic acid: effect on beany flavor removal and physiochemical properties.
Journal of Agricultural and Food Chemistry, 40 (2), p: 276 - 279.
Page 136
121
Swain, M.J., Ferron, S., Coelho, A.I.P., Swain, M.V.L. (2006). Effect of continuous
(intermittent) use on the power output of domestic microwave ovens. International
Journal of Food Science & Technology, 41 (6), p: 652 - 656.
Talebi, M., Ghassempour, A., Talebpour, Z., Rassouli, A., Dolatyari, L. (2004). Optimization of
the extraction of paclitaxel from Taxus baccata L. by the use of microwave energy.
Journal of Separation Science, 27 (13), p: 1130 - 1136.
Tanongkankit, Y., Sablani, S.S., Chiewchan, N., Devahastin, S. (2013). Journal of Food
Engineering, 117 (1), p: 151 - 157.
Tang, H.J., Mitsunaga, T.H., Kawamura, Y. (2006). Molecular arrangement in blocklets and
starch granule architecture. Carbohydrate Polymers. 63 (4), p: 555 - 560.
Tatke, P., Jaiswal, Y. (2011). An Overview of Microwave Assisted Extraction and its
Applications in Herbal Drug Research. Research Journal of Medicinal Plant, 5 (1), p: 21 -
31.
Teutonico, R.A., Knorr, D. (1985). Amaranth: composition, properties, applications of a
rediscovered food crop. Food Technology, 39 (4), p: 49 - 60.
Thompson, L.U. (1993). Potential health benefits and problems associated with antinutrients in
foods. Food Research International, 26 (2), p: 131 - 149.
Tikekar, R.V., Ludescher, R.D., Karwe, M.V. (2008). Processing stability of squalene in
amaranth and antioxidant potential of amaranth extract. Journal of Agricultural and Food
Chemistry. 56 (22), 10675 - 10678.
Trautwein, E.A., Van Leeuwen, A., Ebersdobler, H.F. (1997). Plant sterol profiles and squalene
concentrations in common unrefined and refined vegetable oils. Bioactive inositol
phosphates and phytosterols in foods. Proceedings of the 2nd workshop, COST 916,
Gothenberg, Sweden, p: 79 - 81.
Trichopoulou, A., Katsouyanni, K., Stuver, S., Tzala, L., Gnardellis, C., Rimm, E., Trichopoulos,
D. (1995). Consumption of olive oil and specific food groups in relation to breast cancer
risk in Greece. Journal of the National Cancer Institute, 87 (2), p: 110 - 116.
Ulbricht, C., Abrams, T., Conquer, J., Costa, D., Grims-Serrano, J.M., Taylor, S., Varguese, M.
(2009). An evidence-based systematic review of amaranth (Amaranthus spp.) by the
natural standard research collaboration. Journal of Dietary Supplements, 6 (4), p: 390 -
417.
Uriyapongson, J., Rayas-Duarte, P. (1994). Comparison of yield and properties of amaranth
starches using wet and dry-wet milling process. Cereal Chemistry, 71 (6), p: 571 - 577.
Page 137
122
U.S. Department of Agriculture, Agricultural Research Service. (2012). USDA National Nutrient
Database for Standard Reference, Release 25. Nutrient Data Laboratory.
http://www.ars.usda.gov/ba/bhnrc/ndl
Venkatesh, M.S., Raghavan, G.S.V. (2004). An overview of microwave processing and dielectric
properties of agri-food materials. Biosystem Engineering, 88(1), p: 1 - 18.
Wanasundara, J.P.D., Shahidi, F. (1994). Alkanol-ammonia-water/hexane extraction of flaxseed.
Food Chemistry, 49 (1), p: 39 - 44.
Wang, L, Weller, C.L. (2006). Recent advances in extraction of nutraceuticals from plants.
Trends in Food Science & Technology, 17(6), p: 300 - 312.
Wang, Z., Wang, L., Li, T., Zhon, X., Ding, L., Yu, Y., Yu, A., Zhang, H. (2006). Rapid analysis
of the essential oils from dried Illicium verum Hook. f. and Zingiber officinale Rosc. by
improved solvent-free microwave extraction with three types of microwave-absorption
medium. Analytical and Bioanalytical Chemistry, 386 (6), p: 1863 - 1868.
Wang, L. J., Weller, C. L. (2006). Recent advances in extraction of nutraceuticals from plants.
Trends in Food Science and Technology, 17 (6), p: 300 - 312.
Walkowski, A., Fornal, J., Lewandowicz G., Sadowska, J. (1997). Structure, physico – chemical
properties and potential uses of amaranth starch. Polish Journal of Food and Nutrition
Sciences, 6 (47), p: 11 - 22.
Williams, J.T., Brenner, D. (1995). Grain amaranth (Amaranthus species). In Williams, J.T. (Ed),
Cereals and Pseudocereals. Chapman and Hall, London.
Wu, H., Corke, H. (1999). Genetic diversity in physical properties of starch from a world
collection of amaranthus. Cereal Chemistry, 76 (6), p: 877 - 883.
Wu, H. X., Yue, S. X., Sun, H. L., Corke, H. (1995). Physical properties of starch from two
genotypes of Amaranthus cruentus of agricultural significance in China. Starch/ Stärke,
47 (8), p: 295 - 297.
Xiao, W., Han, L., Shi, B. (2008). Optimization of microwave-assisted extraction of flavonoid
from Radix Astragali using response surface methodology. Separation science and
Technology, 43, p: 671 - 681.
Yamaguchi, T., Nakagawa, M., Hidaka, K., Yoshida, T., Sasaki, T., Akiyama, S., Kuwano, M.
(1985). Potentiation by squalene of antitumor effect of 3-[(4-amino-2-methyl-5-
pyrimidinyl) methyl]-1-(2-chloroethyl)-nitrosourea in a murine tumor system. Japanese
Journal of Cancer Research, 76 (10), p: 1021 - 1026.
Page 138
123
Yanez, E., Zacarias, I., Granger, D., Vasquez, M., and Estevez, A. M. (1994). Chemical and
nutritional characterisation of amaranthus (Amaranthus cruentus). Archivos
Latinoamericanos de Nutrición, 44 (1), p: 57 - 62.
Yanez, G.A., Messinger, J.K., Walker, C.E. (1986). Amaranthus hypochondriacus: starch
isolation and partial characterization. Cereal Chemistry, 63 (3), p: 273 - 276.
Zhao, J., Whistler R.L. (1994). Isolation and characterization of starch from amaranth flour.
Cereal Chemistry, 71 (4), p: 392 - 393.
Zhou, H., Liu, C. (2006). Microwave assisted extraction of solanesol from tobacco leaves.
Journal of Chromatography A, 1129 (1), p: 135 - 139.
Zuloaga, O., Etxebarria, N., Fernandez, L.A., Madariaga, J.M. (1999). Optimization and
comparison of microwave assisted extraction and Soxhlet extraction for the determination
of polychlorinated biphenyls in soil samples using an experimental design approach.
Talanta, 50 (2), p: 345 - 357.