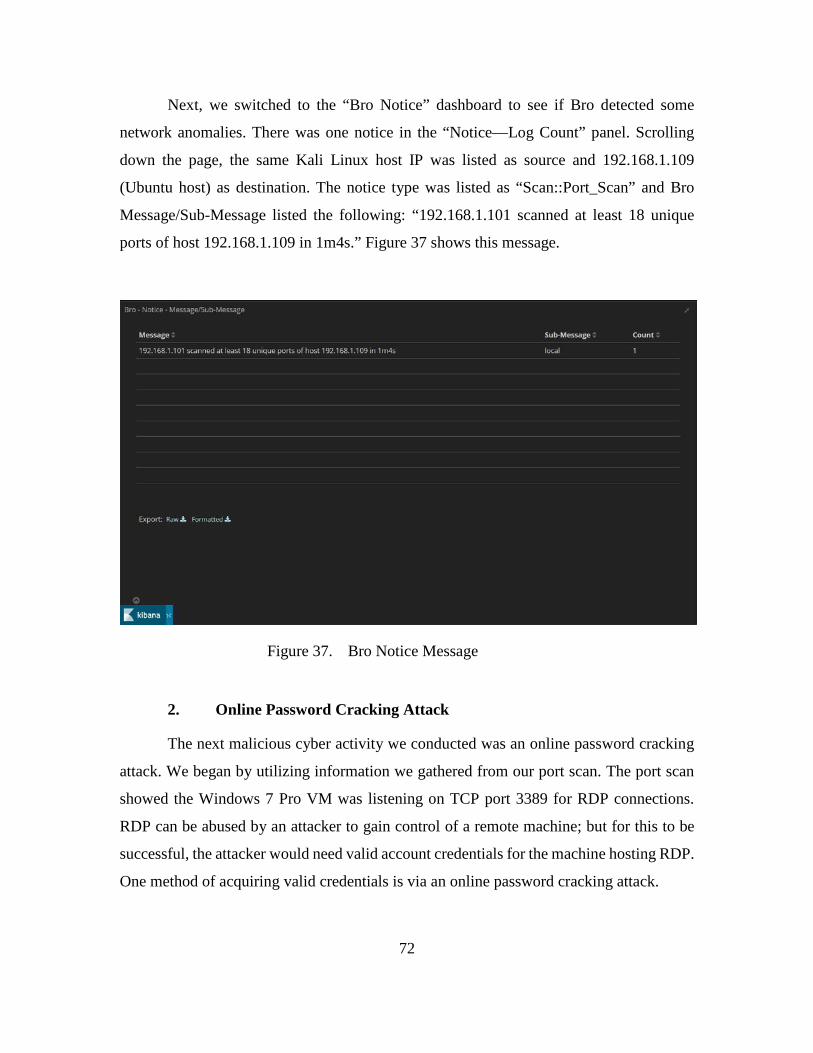
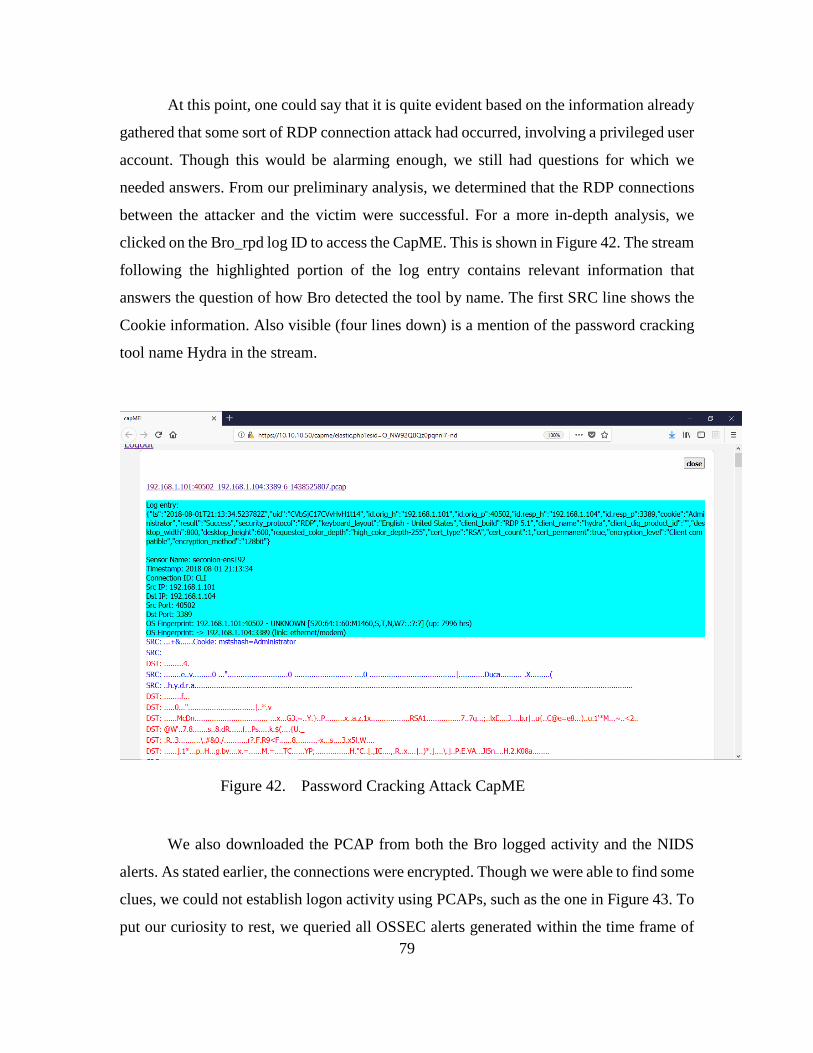
Calhoun: The NPS Institutional Archive DSpace Repository Theses and Dissertations 1. Thesis and Dissertation Collection, all items 2018-09 SIEM-ENABLED CYBER EVENT CORRELATION (WHAT AND HOW) Myers, Kurt J.; Christopher, Fidel E. Monterey, CA; Naval Postgraduate School http://hdl.handle.net/10945/60443 Downloaded from NPS Archive: Calhoun
Transcript
Calhoun: The NPS Institutional Archive
DSpace Repository
Theses and Dissertations 1. Thesis and Dissertation Collection, all items
2018-09
SIEM-ENABLED CYBER EVENT CORRELATION
(WHAT AND HOW)
Myers, Kurt J.; Christopher, Fidel E.
Monterey, CA; Naval Postgraduate School
http://hdl.handle.net/10945/60443
Downloaded from NPS Archive: Calhoun
NAVAL POSTGRADUATE
SCHOOL
MONTEREY, CALIFORNIA
APPLIED CYBER OPERATIONS CAPSTONE
REPORT
SIEM-ENABLED CYBER EVENT CORRELATION (WHAT AND HOW)
by
Fidel E. Christopher and Kurt J. Myers
September 2018
Project Advisors: John D. Fulp Gurminder Singh
Approved for public release. Distribution is unlimited.
THIS PAGE INTENTIONALLY LEFT BLANK
REPORT DOCUMENTATION PAGE Form Approved OMB No. 0704-0188
Public reporting burden for this collection of information is estimated to average 1 hour per response, including the time for reviewing instruction, searching existing data sources, gathering and maintaining the data needed, and completing and reviewing the collection of information. Send comments regarding this burden estimate or any other aspect of this collection of information, including suggestions for reducing this burden, to Washington headquarters Services, Directorate for Information Operations and Reports, 1215 Jefferson Davis Highway, Suite 1204, Arlington, VA 22202-4302, and to the Office of Management and Budget, Paperwork Reduction Project (0704-0188) Washington, DC 20503.
1. AGENCY USE ONLY(Leave blank)
2. REPORT DATESeptember 2018
3. REPORT TYPE AND DATES COVEREDApplied Cyber Operations Capstone Report
4. TITLE AND SUBTITLESIEM-ENABLED CYBER EVENT CORRELATION (WHAT AND HOW)
5. FUNDING NUMBERS
6. AUTHOR(S) Fidel E. Christopher and Kurt J. Myers
7. PERFORMING ORGANIZATION NAME(S) AND ADDRESS(ES)Naval Postgraduate School Monterey, CA 93943-5000
11. SUPPLEMENTARY NOTES The views expressed in this thesis are those of the author and do not reflect theofficial policy or position of the Department of Defense or the U.S. Government.
12a. DISTRIBUTION / AVAILABILITY STATEMENT Approved for public release. Distribution is unlimited.
12b. DISTRIBUTION CODE A
13. ABSTRACT (maximum 200 words) This capstone evaluates the capabilities and potential usefulness of a Security Information and Event Management (SIEM) system in the detection of malicious network activities. The emphasis of this project was to select and configure a Free and Open Source SIEM (FOSS) to perform automated detection and alerting of malicious network events, based upon predefined indicators of compromise. To test these functionalities, a virtual lab network consisting of a combination of Windows servers and Windows and Linux workstations was built to provide a proof of concept environment for testing the chosen FOSS SIEM. From within the lab network, a series of malicious cyber actions were executed to evaluate how well our configured FOSS solution detected and reported them. As SIEM solutions are increasingly deployed to help automate cyber defense, we hope this study motivates the adoption of FOSS solutions by organizations that may not be able to afford a commercial solution, or—perhaps—may simply prefer the advantages of free and open-source solutions.
14. SUBJECT TERMSSecurity Information and Event Management, incident detection, log analysis
15. NUMBER OFPAGES
13316. PRICE CODE
17. SECURITYCLASSIFICATION OF REPORT Unclassified
18. SECURITYCLASSIFICATION OF THIS PAGE Unclassified
19. SECURITYCLASSIFICATION OF ABSTRACT Unclassified
20. LIMITATION OFABSTRACT
UU
NSN 7540-01-280-5500 Standard Form 298 (Rev. 2-89) Prescribed by ANSI Std. 239-18
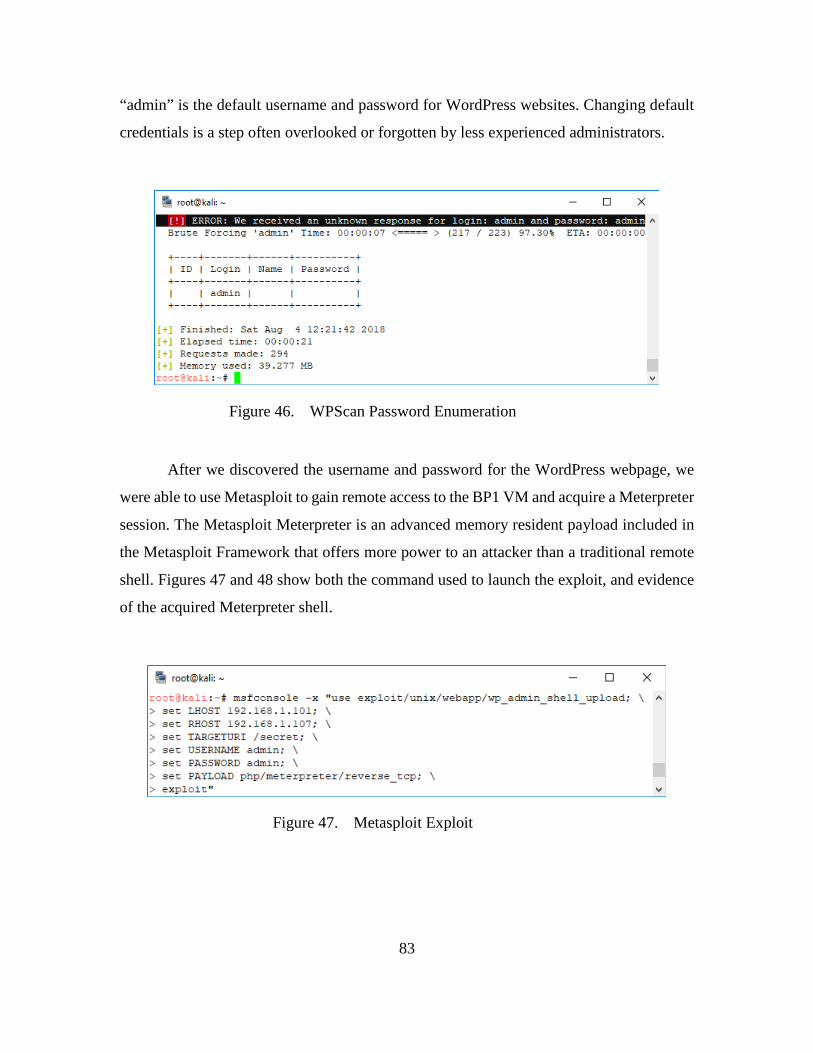
i
THIS PAGE INTENTIONALLY LEFT BLANK
ii
Approved for public release. Distribution is unlimited.
SIEM-ENABLED CYBER EVENT CORRELATION (WHAT AND HOW)
PO1 Fidel E. Christopher (USN) and CPO Kurt J. Myers (USN)
Submitted in partial fulfillment of the requirements for the degree of
MASTER OF SCIENCE IN APPLIED CYBER OPERATIONS
from the
NAVAL POSTGRADUATE SCHOOL September 2018
Reviewed by: John D. Fulp Gurminder Singh Project Advisor Project Advisor
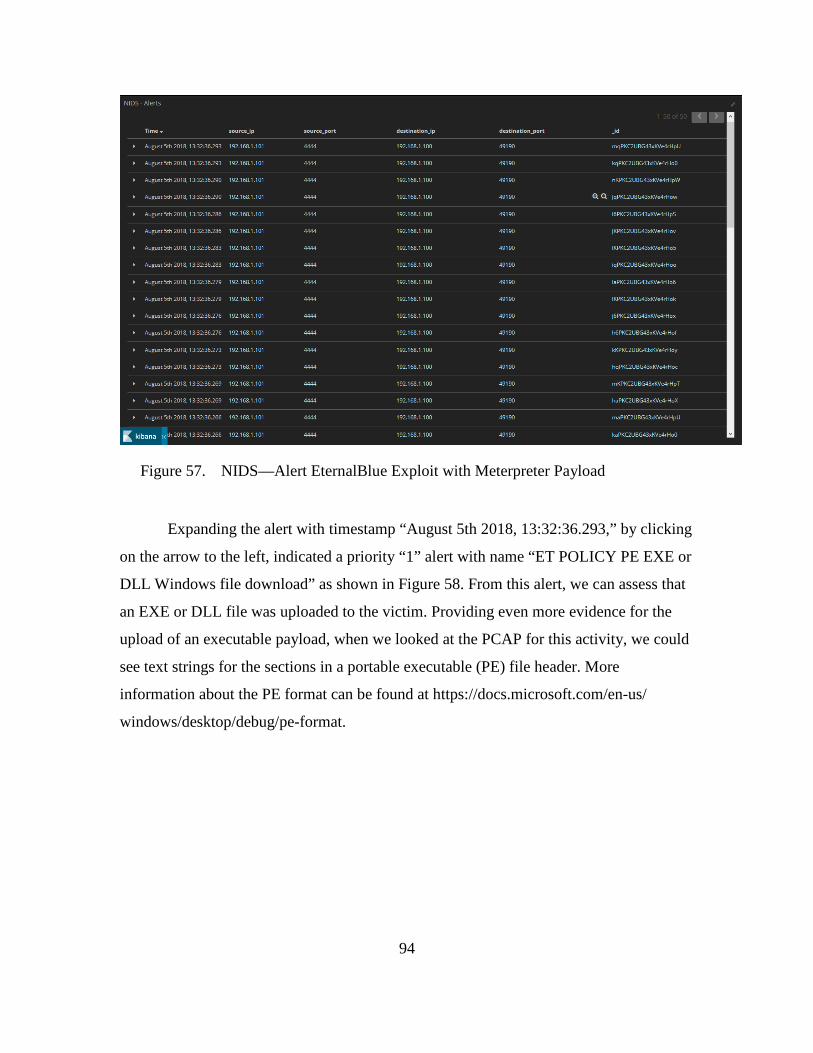
Accepted by: Dan C. Boger Chair, Department of Information Sciences Department
iii
THIS PAGE INTENTIONALLY LEFT BLANK
iv
ABSTRACT
This capstone evaluates the capabilities and potential usefulness of a Security
Information and Event Management (SIEM) system in the detection of malicious
network activities. The emphasis of this project was to select and configure a Free and
Open Source SIEM (FOSS) to perform automated detection and alerting of malicious
network events based upon predefined indicators of compromise. To test these
functionalities, a virtual lab network consisting of a combination of Windows servers and
Windows and Linux workstations was built to provide a proof-of-concept environment
for testing the chosen FOSS SIEM. From within the lab network, a series of malicious
cyber actions were executed to evaluate how well our configured FOSS solution detected
and reported them. As SIEM solutions are increasingly deployed to help automate cyber
defense, we hope this study motivates the adoption of FOSS solutions by
organizations that may not be able to afford a commercial solution, or—perhaps—
may simply prefer the advantages of free and open-source solutions.
v
THIS PAGE INTENTIONALLY LEFT BLANK
vi
vii
TABLE OF CONTENTS
I. INTRODUCTION..................................................................................................1 A. WHAT IS A SIEM? ...................................................................................2 B. EVENT LOGS ............................................................................................2 C. AGGREGATION .......................................................................................3 D. NORMALIZATION ..................................................................................4 E. CORRELATION .......................................................................................5
II. COMPARE AND CONTRAST OF OPEN-SOURCE SIEMS ..........................7 A. PRELUDE ...................................................................................................7
1. Components ....................................................................................7 2. Offered Features ............................................................................9 3. Ability to Integrate with Other Products .....................................9 4. Minimum System Requirements ..................................................9 5. Compatible Host OSes .................................................................10 6. Ability to Generate Reports ........................................................10 7. Documentation .............................................................................10
B. OSSIM .......................................................................................................10 1. Components ..................................................................................11 2. Offered Features ..........................................................................11 3. Ability to Integrate with Other Products and Systems ............12 4. Minimum System Requirements ................................................12 5. Compatible Host OS ....................................................................13 6. Ability to Generate Reports ........................................................13 7. Documentation .............................................................................13
C. ELK ...........................................................................................................13 1. Components ..................................................................................14 2. Offered Features ..........................................................................15 3. Ability to Integrate with Other Products and Systems ............16 4. Minimum System Requirements ................................................17 5. Compatible Host OS ....................................................................17 6. Ability to Generate Reports ........................................................17 7. Documentation .............................................................................18
III. CHOSEN SIEM ...................................................................................................19 A. PACKET CAPTURE ...............................................................................20 B. NIDS AND HIDS......................................................................................21 C. NETWORK ANALYSIS TOOLS ..........................................................21
viii
IV. VIRTUAL TESTBED NETWORK ...................................................................23 A. BUILDING A SIEM TESTBED NETWORK ......................................23
B. NETWORK TOPOLOGY ......................................................................25
V. ELK AND SECURITY ONION INSTALLATION AND CONFIGURATION .............................................................................................27 A. GATHERING RESOURCES .................................................................27
1. Building the Virtual Machine .....................................................27 2. Downloading Security Onion ......................................................27
B. SECURITY ONION INSTALLATION .................................................28 C. SECURITY ONION CONFIGURATION AND ELK
VI. OSSEC INSTALLATION AND CONFIGURATION .....................................55 A. AGENT MANAGEMENT ON SECURITY ONION ...........................55 B. AGENT INSTALLATION AND CONFIGURATION ON
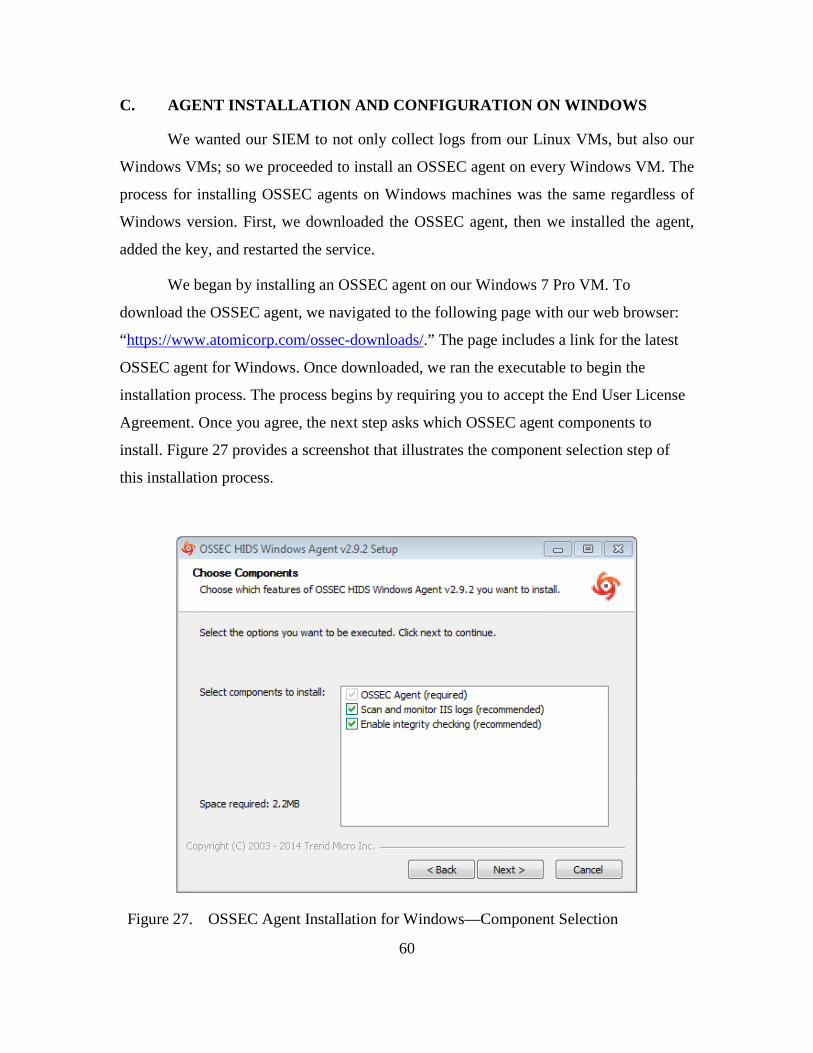
LINUX .......................................................................................................57 C. AGENT INSTALLATION AND CONFIGURATION ON
WINDOWS ...............................................................................................60 D. VERIFICATION OF OSSEC AGENT COMMUNICATION
FROM CLIENT TO SIEM .....................................................................62
VII. INCIDENT DETECTION AND CORRELATION WITH ELK ....................65 A. MALICIOUS ACTIVITY CORRELATION ........................................65
1. Port Scan .......................................................................................65 2. Online Password Cracking Attack .............................................72 3. Web Server Attack .......................................................................80 4. Windows Server Exploitation .....................................................88
ix
B. FALSE POSITIVES AND FALSE NEGATIVES ................................97
VIII. SUMMARY, CONCLUSION, AND FUTURE WORK ...................................99 A. SUMMARY ..............................................................................................99 B. CONCLUSION ......................................................................................100 C. FUTURE WORK ...................................................................................101
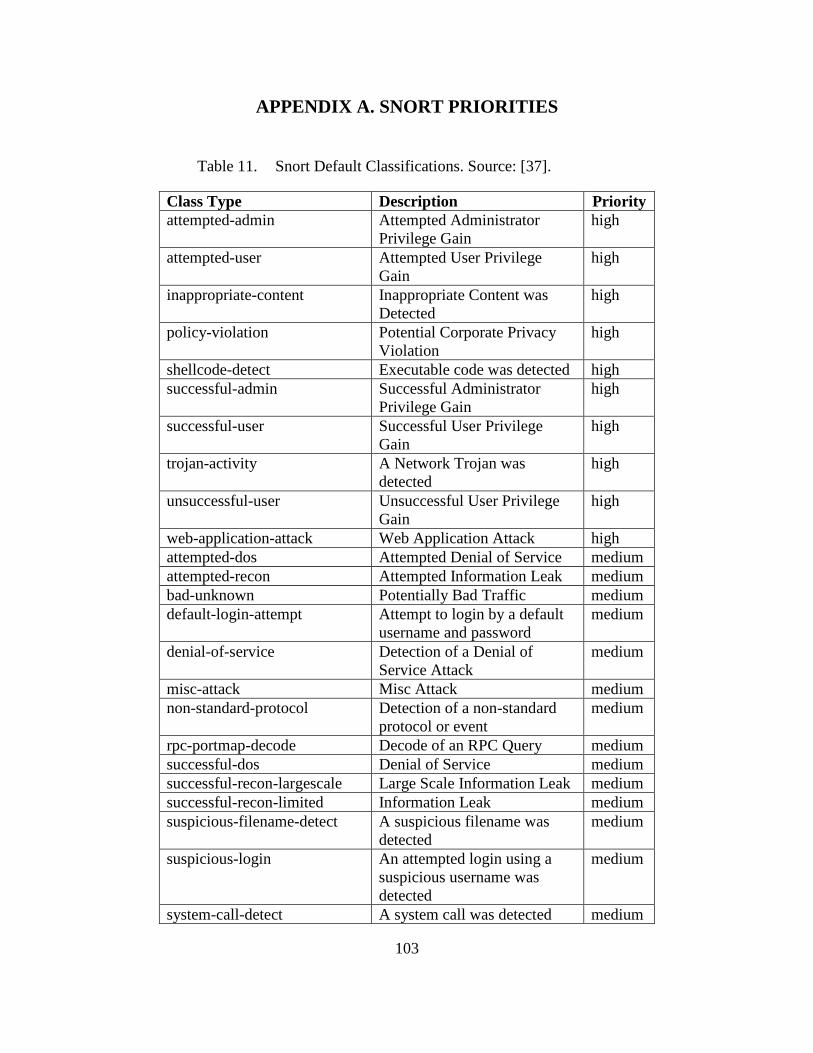
APPENDIX A. SNORT PRIORITIES .........................................................................103
APPENDIX B. OSSEC RULE CLASSIFICATION LEVELS ..................................105
LIST OF REFERENCES ..............................................................................................107
INITIAL DISTRIBUTION LIST .................................................................................111
We would like to extend our sincere appreciation to Professor J. D. Fulp for the
mentorship he provided us with during this capstone. Your unwavering guidance and
advice led us steadily to the finish line. We trust that by applying all you have taught us we
will be valuable assets to the U.S. Navy and our beloved country. Thank you!
xx
THIS PAGE INTENTIONALLY LEFT BLANK
1
I. INTRODUCTION
In the world of information technology and cryptology, those who have worked in
an Information Assurance (IA) or Defensive Cyberspace Operations (DCO) position can
attest to how strenuous and time consuming the process of identifying malicious cyber
activities can be. Alerts generated by Intrusion Detection Systems (IDS) and Intrusion
Prevention Systems (IPS) must be reviewed by a human to ensure their validity. This
review often necessitates having to analyze system and event logs from multiple devices/
sources to identify correlations helpful in corroborating the alerts. This task can be very
tedious depending on the size of the network, the number of security systems involved, the
layers of defense-in-depth, and the specificity of the alert information provided. An alert
generated by an IDS or IPS provides analysts with date/time and possibly the affected
network or subnet information. This can help focus on specific systems and a timespan of
logs to retrieve and review. Conversely, attempting to gather data on malicious activity
undetected by antivirus, IDS, or IPS with no date/time and source information can render
this task exponentially more difficult, as the absence of specific timeline information means
that more logs will likely need to be analyzed. To mitigate this difficulty, a Security
Information and Event Management (SIEM) solution ingests logs from various networks
systems, such as routers, IDS, IPS, servers, clients, antivirus systems, and host-based
security systems, thus easing the burden of having to navigate to numerous systems in
search of event(s) that may be malicious in nature. A number of SIEM solutions are
available, some proprietary and others open source. This capstone demonstrates how a free
and open-source software (FOSS) SIEM can benefit the Navy without added materiel costs.
It focuses on how a FOSS SIEM fed with appropriate system and application logs can be
leveraged to help automate the detection of malicious cyber activity. A comparison of
available FOSS SIEMs led to the selection of the Elastic Stack Log and Kibana (ELK) as
the SIEM of focus in this capstone.
2
A. WHAT IS A SIEM?
A SIEM (pronounced “sim”) is a software solution that provides security
information and event management of system and security data from hosts and network
devices. SIEMs are becoming increasingly popular in networks because of the growing
importance of the capabilities they provide. Modern networks generate a plethora of
information and logs that can potentially be valuable indicators of malicious cyber activity
of interest to system administrators and security analysts. The full value of this information,
however, can only be fully realized when it is readily available and properly presented to
the interested party. The objective of a SIEM solution is to corral the heterogeneous
information and event logs sourced from various devices within a network, and provide a
common interface for viewing and analyzing that data. While many SIEMs also incorporate
several additional features to provide unique capabilities that distinguish them from their
competitors, the principal value-added of any SIEM is derived from its incorporation of
several fundamental capabilities. These fundamental capabilities can generally be
classified as log aggregation, log normalization, log correlation, alerting, and all-around
log and alert management. Each of these capabilities will be elaborated upon in this report.
B. EVENT LOGS
Before discussing SIEM capabilities, one must first understand what event logs are.
Event logs are the primary “product” consumed by a SIEM; they are the raw data a SIEM
analyzes to glean meaningful correlations that—when significant—can yield usable
intelligence regarding cyber threats and vulnerabilities. Almost every device on a network
generates or can be configured to generate, some type of log. These logs come in a vast
variety of formats depending on the type of device they were created from and how the
manufacturer decided the logs should be formatted. Modern Microsoft Windows operating
systems, for example, use a proprietary log format called EVTX, which is an update to
Microsoft’s earlier EVT format. In [1], EVTX logs are stored in the extensible markup
language (XML) format, which provides filtering granularity within Windows’ native
Event Viewer, or when using a third-party application or SIEM.
3
One industry standard format for logs is “syslog,” or more specifically, the BSD
syslog as defined by RFC3154. Syslog-style logs are standard across many platforms,
including Cisco IOS devices, Palo-Alto Network’s PAN-OS, Linux, Unix, and a vast
number of software solutions, including the Snort intrusion detection/prevention system
and the PfSense firewall. The syslog standard is more than just a log format; it is also a
transmission protocol for the delivery of logs. Syslogs are text-based logs that can be saved
locally on the machine on which they are generated, but can also be transmitted (typically
over UDP port 514) to a centralized syslog collector.
Although vendors are free to use whichever logging format they choose,
Microsoft’s EVTX format and the industry standard syslog format are generally the most
common event log formats available. EVTX is not an industry standard log format; XML
is, and it allows some level of interoperability of EVTX logs with other systems. Syslog’s
ubiquity is in large part due to the fact syslog has become a widely used logging format on
which logging devices and log collection systems depend for interoperability. One might
consider syslog to be the least-common denominator of computer system log formats.
C. AGGREGATION
When using a SIEM, logs must be aggregated into one centralized location. This is
typically accomplished by configuring the devices, or in some cases the log collection
agents, to transport the logs to a central repository. The repository may store flat files or
some type of database. The Securosis blog states not only does the centralized log
repository allow for log consistency, it also allows for security and retention policies to be
managed more easily, as all of the logs reside in a centralized location [2]. The resource
requirements of the log repository depend upon the size of the network the SIEM is
monitoring. As the number of aggregated logs increases, the storage capacity and
computational demands on the log repository that warehouses these logs should also
increase. It is therefore important to be able to calculate the amount of log data that will be
generated. This can be accomplished using a historical baseline of events per second (EPS)
metric. This metric can also serve as a performance rating for a SIEM (e.g., “our SIEM can
process—with no bottlenecking—up to X EPS”), or as a licensing tool (e.g., “your SIEM
4
contract guarantees an EPS of no less than X”); so it is important to understand and take
into consideration when choosing a SIEM solution. EPS, unsurprisingly, equates to the
number of log events generated per second, but to use this equation to estimate the storage
capacity of the repository, the size (in bytes) of each event must also be considered.
Therefore, using the formula (Average EPS x Average Bytes Per Event / 1,000,000,000),
we can determine the size of logs generated, on average, per second in gigabytes.
Multiplying the result by 86,400 will give us the daily storage capacity in bytes needed for
storing the logs. Multiplying the daily storage requirement by the number of days desired
for retention will result in an estimate of the overall storage capacity requirements of an
organization’s log repository. It is also important to consider that certain events or incidents
may cause a spike in the EPS that could last from minutes to days. An increase in EPS
means an increase in required storage capacity, so it is best to ensure the storage repository
is large enough to handle such unforeseen spikes in log generation.
D. NORMALIZATION
After logs are aggregated, they must be normalized. While there are a handful of
standard log formats, most information networks comprise systems, software, and
applications from different manufacturers, and the logs that they generate are not all in the
same format. Using the example of the date and time an event occurs for which a log entry
is generated, a system may be configured to store logs with date in ddmmmyyyy format
(06May2018) and time in 12-hour format (2:26:42 P.M. PST) and jointly categorize them
as Date/Time. A second system may use the same format but separately categorize these
two fields as Date and Timestamp. A third system may generate date in mm/dd/yy format
(e.g., 05/06/18) and time in 12-hour format and jointly categorize them as Date/Time. A
fourth system may generate date in mm/dd/yyyy format (05/06/2018) and time in 24-hour
format (14:26:42 PST) and separately categorize them as Date and Timestamp. These are
just a few examples that illustrate how quickly the variety of log formats can become large.
If the organization operates in multiple geographic areas, things may become even more
complicated owing to differing time zones and variations regarding the implementation of
daylight saving adjustments. In France, for example, to represent 06 May 2018, the Day-
Month-Year format (06/05/2018 or 06/05/18) is used instead of Month-Day-Year (05/06/
5
2018 or 05/06/18), and the time-zone shift from GMT (Greenwich Mean Time) is plus two
hours, vice subtracting hours for time-zones in the Western Hemisphere countries. To
further complicate things, the date that France transitions to daylight saving time is two
weeks different from when most U.S. states transition. Log normalization is the process of
converting such heterogeneous log data fields into a particular (homogeneous) format that
the SIEM evaluation engine is designed to interpret. This process may be done via an agent
or be agentless. “Normalization-using agents” means that the normalization software
(agent) is installed either on a central log server or on every single security system that
generates logs. In an agentless normalization scheme, systems generating alerts send logs
within set time intervals to the SIEM to be locally normalized.
E. CORRELATION
Once logs are aggregated and normalized, they may be queried for more meaningful
inferences that pertain to identifying threats or vulnerabilities. The ability to identify
security-related events from a disparate number of systems in an autonomous network is
the primary benefit of deploying a SIEM solution. In defensive cyberspace operations,
when an incident occurs, security technicians must analyze logs from many levels, if not
every level, of the defense-in-depth architecture so as to build a logical timeline of activities
that might advance the who, what, when, where, why and how investigation of a cyber
incident. A SIEM has the ability to sift through normalized logs from disparate systems on
a network that were fed to its database and identify events that are mutually related. An
event correlation may be as simple as tracking an IP address: a host is discovered with
malware that beacons to an IP address associated with malicious activity; upon searching
that IP address in the SIEM, it is revealed that many other hosts on that network are also
infected with the same malware. The SIEM may correlate that same IP to other events
leading to the discovery of more compromised assets.
6
THIS PAGE INTENTIONALLY LEFT BLANK
7
II. COMPARE AND CONTRAST OF OPEN-SOURCE SIEMS
Following an online research on available FOSS SIEMs, we elected to review three
of the most popular and discussed SIEM solutions: Prelude’s Universal Open-Source SIEM
project, AlienVault’s Open Source Security Information and Event Management (OSSIM),
and Elasticsearch Logstash and Kibana (ELK) by Elastic
A. PRELUDE
Prelude is a distributed universal SIEM that sorts and reports security-related events
regardless of the system generating the events brand or license. Prelude Open Source SIEM
(OSS) is the open-source version of the Prelude SIEM and is designed for evaluation,
research and testing in small network infrastructures. Prelude OSS performance is lower
compared to its enterprise version.
1. Components
There are several components that make up both Prelude OSS and Prelude SIEM.
Table 1 lists these components and includes a description of each.
Table 1. Prelude Components. Adapted from [3].
Components Descriptions The Prelude Manager
A server that receives, manages, and saves alerts to a specified location (log file or database) and establishes priority of process according to criticality.
Libprelude A secure library that is an Application Programming Interface (API) for communication with Prelude subsystems. It also provides the necessary functionality for generating and emitting IDMEF alerts.
LibpreludeDB “An abstraction layer upon the type and format of the database used to store IDMEF alerts. [This] allows developers to use the IDMEF database efficiently without worrying about SQL.”
Prelude-LML A log analyzer that allows for the collection and analysis of information from all sorts of applications emitting logs or syslog messages.
Prelude-Correlator
A Python rules-based correlation engine able to connect and fetch alerts from a remote manager based on a provided ruleset.
Prewikka Prelude’s official Graphical User Interface (GUI). In addition to facilitating analysts’ work, the GUI provides access to external tools such as whois and traceroute.
8
The open-source version of Prelude is equipped with an abbreviated version of the
components that the commercial version comprises. Table 2 lists components of Prelude
OSS and SIEM.
Table 2. Prelude OSS vs. Prelude SIEM. Adapted from [4].
Performance Limited real-time processing capacity by a non-optimized database schema. Performance decreasing with the increase of archived alert volume.
Millions alert notifications are possible in a day. Search time up to 30 times faster than the Prelude OSS version.
9
2. Offered Features
In both versions of Prelude, security event logs are normalized to the Intrusion
Detection Message Exchange Format (IDMEF), a standard data format designed by the
IETF under RFC 4765. IDMEF was developed with the intent to enable interoperability
among commercial, open source, and research systems [5].
3. Ability to Integrate with Other Products
Prelude is agentless; however, the following third-party agents are available [6]:
• Auditd—the Linux Audit Deamon.
• ufwi-filterd—for user-based addition to Netfilter, the IP filtering layer from the Linux Kernel.
• LinuxPAM—“a system of libraries that handle authentication tasks” [6].
• Nepenthes—a versatile tool to collect malware.
• OSSEC—“an open-source host-based IDS that performs log analysis, integrity checking, Windows registry monitoring, rootkit detection, real-time alerting and active response” for all major operating systems [6].
• Samhain— “an open-source host-based intrusion detection system (HIDS) for POSIX (Unix, Linux, Cygwin/Windows). [It] provides file integrity checking, as well as rootkit detection, port monitoring, detection of rogue SUID executables, and hidden processes” [6].
• SanCP—a network security tool designed to collect statistical information regarding network traffic. It records traffics in PCAP format for the purpose of auditing, historical analysis, and network activity discovery.
Prelude OSS does not have explicitly stated system requirements. Considering that
Prelude OSS can be installed on many different Linux distributions, the system
10
requirements would need to at least meet those which are specified by the host operating
system. Although the system requirements for most Linux distributions are considerably
less than modern consumer-grade hardware, the system requirements for Prelude OSS for
use in a production environment would likely demand more modern and powerful
hardware.
5. Compatible Host OSes
Prelude is supported for the following Linux distribution [7]:
• Fedora/RedHat/CentOS(epel): Prelude OSS 4.1
• Debian/Ubuntu: Prelude OSS 4.1
• Gentoo: Prelude OSS 4.1
• Mageia: Prelude OSS 4.1
• Arch Linux: Prelude OSS 4.1
• OpenSuse: Prelude OSS 4.0 (Update to 4.1 in progress)
6. Ability to Generate Reports
With logs stored in a centralized database, Prelude provides an easy generation of
reports. It allows users to create and send reports in pdf format via email.
7. Documentation
Well-detailed documentation is available on the Prelude website
(https://www.prelude-siem.org/projects/prelude/wiki) with details on its components,
installation procedures, configuration, and optimization.
B. OSSIM
OSSIM is AlienVault’s open source version of AlienVault’s commercial SIEM:
Unified Security Management (USM). The features available in OSSIM are more limited
than what is included in USM. OSSIM is licensed under the GNU General Public License
and is distributed as an installable ISO image. OSSIM uses Debian Linux as its host
operating system and provides many of its features using preexisting standalone FOSS
11
components. The AlienVault tools that are part of OSSIM mostly provide log correlation
and plugin integration.
1. Components
OSSIM consists of several components. Table 3 lists these components and
includes a description of each.
Table 3. OSSIM Components .Adapted from [8].
Components Descriptions OpenVAS Open Vulnerability Assessment: Vulnerability Scanner. Suricata A FOSS IDS and IPS. tcptrack Network sniffer. Displays the status of TCP connections. Nagios Network Monitoring Software. Provides monitoring of network
services, system resources, and applications across all major operating systems
OSSEC An “open-source host-based IDS that performs log analysis, integrity checking, Windows registry monitoring, rootkit detection, real-time alerting and active response” for all major operating systems [6].
Munin Network resource monitoring that provides network trend analysis. NFSen/NFDump NetFlow Sensor / NetFlowDump: Provides network flow statistics. FProbe NetFlow Probe: Collects network traffic data and sends the collected
traffic as NetFlow flows to a collector. Excludes tools that are deprecated, phased out, or replaced.
2. Offered Features
OSSIM offers several capabilities but is still limited as compared to its commercial
counterpart USM. The following list includes the capabilities included in OSSIM [9].
• Asset Discovery and Inventory
• Vulnerability Assessment
• Intrusion Detection
• Behavioral Monitoring
• SIEM Event Correlation
• Community Support via Product Forums
12
• Powered via Open Threat Exchange
3. Ability to Integrate with Other Products and Systems
OSSIM can collect data from many sources. OSSIM provides agents that run on
Windows and Linux that can be used to send collected data to the SIEM. Other systems
that generate logs in various standard formats are also supported. According to FIWARE,
OSSIM supports the following log data types [10].
• Syslog (supported log format by most systems and network devices)
• SNMP (Simple Network Management Protocol)
• Osiris (Unix HIDS)
• Snare (Windows log agent)
The ability to ingest Syslog logs provides OSSIM with the widest support for other
systems and devices. AlienVault states that many devices, including the following, can be
integrated with OSSIM either via the syslog protocol or via plugins [11].
• Brocade routers and switches
• Cisco PIX and ASA firewalls
• Cisco Unified Communications Manager
• Check Point firewall
• Palo Alto PAN-OS
• Symantec Endpoint Management
• VMWare vCenter
4. Minimum System Requirements
The system requirements for OSSIM are largely dependent upon usage. On a large
network with many log sources, the hardware requirements required for installation may
be far less than what is required for operation. Table 4 represents the minimum
recommended system requirements for installation in a production environment, although
there are countless reports online of successful installations with far less system resources.
13
Table 4. OSSIM System Requirements. Adapted from [12], [13].
Bare Metal [12] Virtual Machine [13] CPU Intel Xeon E5620 8 cores RAM 16 GB (DDR3 1333 MHz) 16 GB Storage 1 TB (SAS 10000 RPM) 1 TB
5. Compatible Host OS
The only host OS supported by OSSIM is Debian Linux. OSSIM is provided as an
ISO image that installs Debian Linux along with OSSIM and all included software
packages. The latest version of OSSIM runs on Debian Linux version 8.
6. Ability to Generate Reports
OSSIM provides several report types downloadable as PDFs. Reports can also be
sent via email from within OSSIM. The default time period for reports is 30 days, but this
is customizable. According to [14], report types include Alarms (top threat information),
Business & Compliance ISO PCI (provides required information based on compliance
regulations), Geographic (based on configured geolocation of assets), SIEM events, and
Tickets (lists and describes tickets created from alarms).
7. Documentation
Documentation for OSSIM is considerably sparse as AlienVault maintains
documentation for its commercial SIEM only. USM includes many features not available in
OSSIM. Much of the information needed to deploy and operate OSSIM must be culled
together from the AlienVault forums and third-party guidance from various webpages. The
lack of a central repository of OSSIM documentation provides a major hurdle for a technician
deploying OSSIM, and is the source of many complaints within the AlienVault forums.
C. ELK
By itself, ELK is technically not a (full-service) SIEM, but merely a log aggregation
and management solution. However, when combined with OSSEC (the HIDS component
included in both Prelude and OSSIM), ELK functionality is enhanced to meet the
14
definitional requirements of a SIEM. Security Onion is a network security monitoring
solution distributed as an installable ISO image of Ubuntu Linux. When augmented with
ELK, OSSEC, and many other optional tools, Security Onion encompasses much more
security functionality than any SIEM alone typically provides. We will be considering
Security Onion as a platform for hosting our SIEM tools as it comes preloaded with tools
such as ELK and OSSEC. The scope of our consideration of Security Onion will be based
on its SIEM specific tools only.
1. Components
Table 5 lists components of Security Onion.
15
Table 5. Security Onion Components
Components Descriptions Elasticsearch A distributed, RESTful and analytical engine used as the heart of the
Elastic Stack to centrally store data and discover expected and unexpected information.
Logstash A “server-side data processing pipeline that ingests data from a multitude of sources simultaneously, transforms it, and sends it to your favorite ‘stash’” [16].
Kibana A visualization plugin for Elasticsearch that provides visual capabilities on top of contents indexed on the Elasticsearch cluster. It allows analysts to create bar, line, and scatter plots and/or pie charts.
OSSEC An “open-source host-based IDS that performs log analysis, integrity checking, Windows registry monitoring, rootkit detection, real-time alerting and active response” for all major operating systems [6].
Suricata A FOSS IDS and IPS. Bro A “powerful network analysis framework that is much different from the
typical IDS… Bro provides a comprehensive platform for more general network traffic analysis” [19].
Sguil “An intuitive GUI that provides access to real-time events, session data, and raw packet captures. [It] facilitates the practice of network security monitoring and event-driven analysis” [20].
Squert “A web application used to query and view event data stored in a Sguil database (typically IDS alert data). [It] is a visual tool that provides additional context to events through the use of metadata, time series representations and weighted and logically grouped result sets” [21].
Excludes tools that are not SIEM-related, deprecated, being phased out or replaced.
Adapted from [6], [15], [16], [17], [18], [19], [20], and [21].
2. Offered Features
The Logstash pipeline process comprises three processing stages: Inputs, Filters,
and Outputs. Inputs are composed of events generated by input sources. These events are
then filtered for usefulness and correlation. And, finally, the selected (passing the filters)
events are sent as outputs to a database store.
During Inputs, Logstash reads files from a file system and listens for syslog-
formatted logs which are parsed using the Berkeley Software Distribution (BSD) Syslog
protocol. According to [22], the BSD Syslog protocol is defined in RFC 3164 as a “protocol
16
that provides transport to allow a machine to send event notification messages across IP
networks to event message collectors—also known as syslog servers.”
Logstash can be conditionally configured for specific action on events during the
Filters stage. Unstructured log data can be parsed into queryable format, a process known
as grokking. Event fields may be mutated (renamed, replaced, or modified) or dropped
entirely if not desired or prone to cause issues in Elasticsearch. Users may also configure
the filters stage to clone (copy) events or add geo-location information in the form of IP
addresses, a concept known as geoip.
Last, the Output stage defines where event logs will be shipped. Logs may be sent
to Elasticsearch to allow for convenience in future queries or saved directly to disk as a
file. Alternatively, logs may be sent to a tool called graphite, which allows for metrics
building, or sent to statsd. According [23], statsd is a service that listens for statistics such
as timers and counters and allows the data to be plugged into various backend services.
3. Ability to Integrate with Other Products and Systems
ELK can be integrated with many products that allow for a wide range of
configuration management options and log input sources. According to Logz.io, ELK can
be easily installed inside a Docker container for portability and isolation. Also,
configuration management tools such as Ansible, Puppet, and Chef can be used to automate
ELK deployment [24]. Using input plugins, ELK can also receive many input sources that
provide ELK the ability to integrate with many other products. Table 6 lists some of the
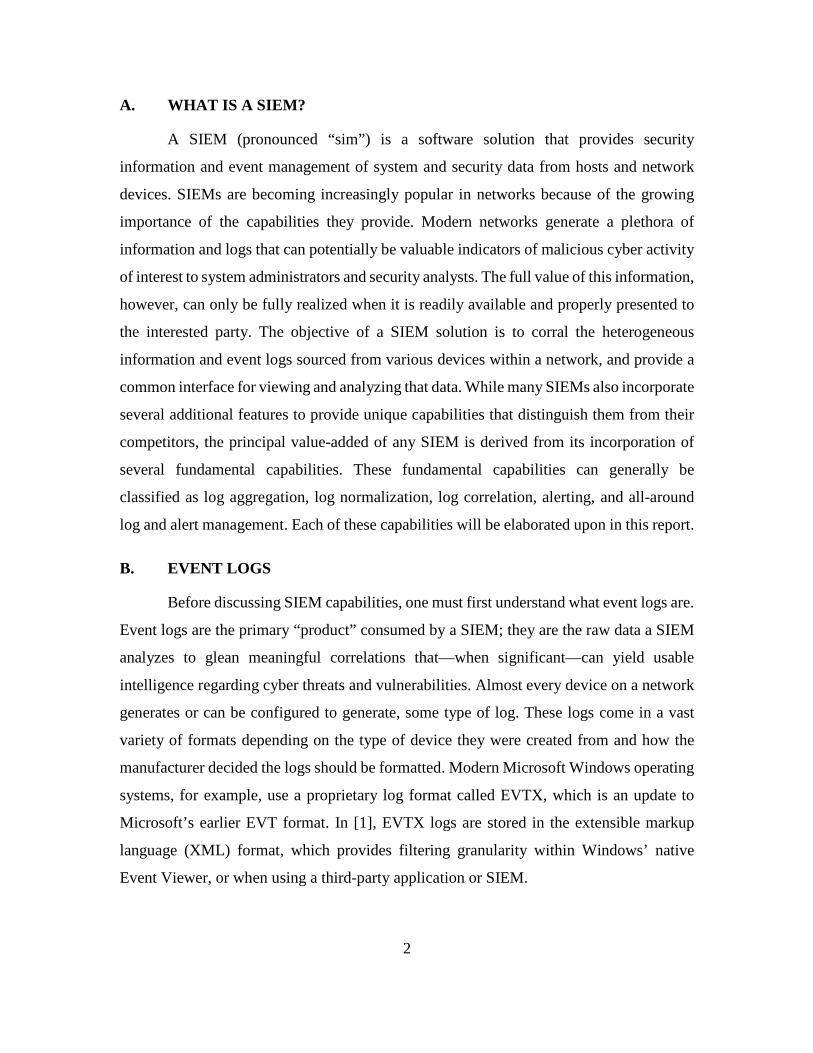
popular ELK input plugins and what input source they enable ELK to receive.
Table 6. ELK Input Sources. Adapted from [25].
Plugin Description azure_event_hubs Receives events from Azure Event Hubs. beats Receives events from the Elastic Beats framework. cloudwatch Pulls events from the Amazon Web Services CloudWatch
Application Programming Interface. elasticsearch Reads query results from an Elasticsearch cluster. exec Captures the output of a shell command as an event. file Streams events from files.
17
Plugin Description github Reads events from a GitHub webhook. http Receives events over HTTP or HTTPS. imap Reads mail from an Internet Message Access Protocol server. jdbc Creates events from Java Database Connectivity data. pipe Streams events from a long-running command pipe. rss Captures the output of command line tools as an event. s3 Streams events from files in an Amazon S3 bucket. snmptrap Creates events based on Simple Network Management
Protocol trap messages. syslog Reads syslog messages as events. unix Reads events over a UNIX socket.
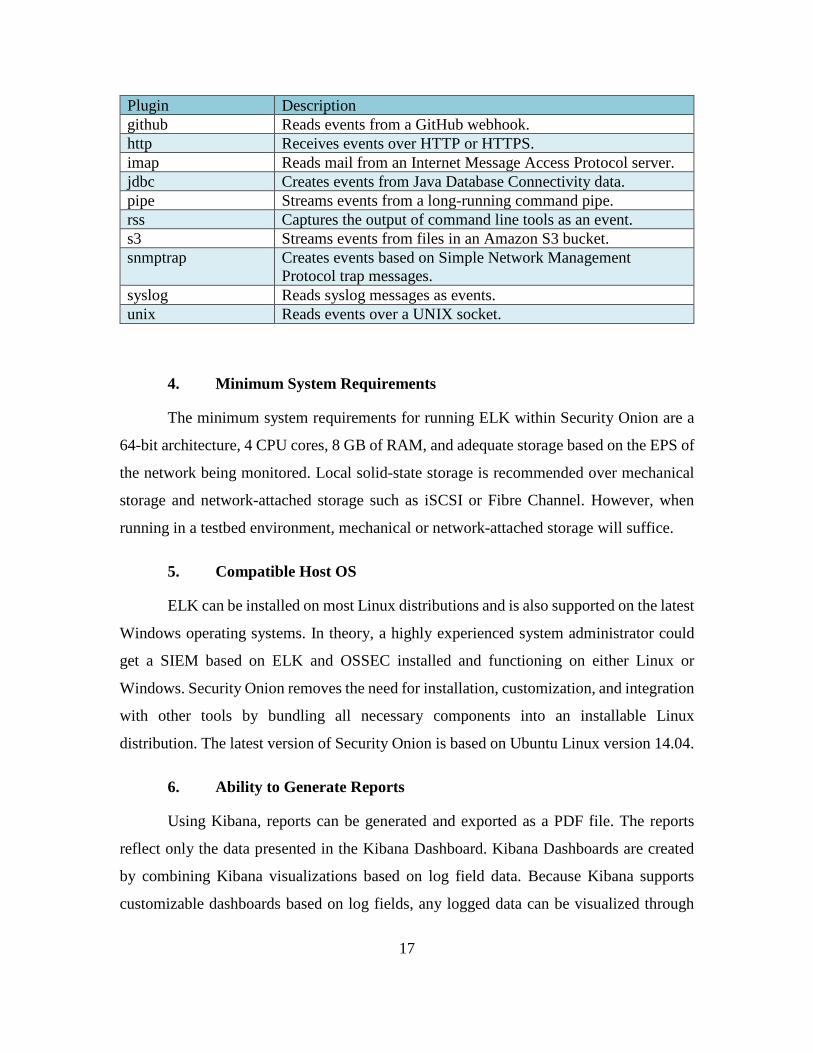
4. Minimum System Requirements
The minimum system requirements for running ELK within Security Onion are a
64-bit architecture, 4 CPU cores, 8 GB of RAM, and adequate storage based on the EPS of
the network being monitored. Local solid-state storage is recommended over mechanical
storage and network-attached storage such as iSCSI or Fibre Channel. However, when
running in a testbed environment, mechanical or network-attached storage will suffice.
5. Compatible Host OS
ELK can be installed on most Linux distributions and is also supported on the latest
Windows operating systems. In theory, a highly experienced system administrator could
get a SIEM based on ELK and OSSEC installed and functioning on either Linux or
Windows. Security Onion removes the need for installation, customization, and integration
with other tools by bundling all necessary components into an installable Linux
distribution. The latest version of Security Onion is based on Ubuntu Linux version 14.04.
6. Ability to Generate Reports
Using Kibana, reports can be generated and exported as a PDF file. The reports
reflect only the data presented in the Kibana Dashboard. Kibana Dashboards are created
by combining Kibana visualizations based on log field data. Because Kibana supports
customizable dashboards based on log fields, any logged data can be visualized through
18
Kibana. Although there may not be preconfigured reports, the customizability of Kibana
Dashboard provides endless possibilities in data reporting.
7. Documentation
Security Onion provides extensive documentation on the use of ELK, OSSEC, and
essentially all the tools included in Security Onion needed for a SIEM. Documentation on
ELK, OSSEC, and many other tools is also available from each tool’s respective
homepage. Security Onion’s popularity has resulted in a plethora of guidance throughout
the web and within several published books, such as Applied Network Security Monitoring:
Collection, Detection, and Analysis by Chris Sanders, and The Practice of Network
Security Monitoring: Understanding Incident Detection and Response by Richard Bejtlich.
19
III. CHOSEN SIEM
Upon evaluating each SIEM solution, we determined that as compared to Prelude
and OSSIM, ELK, along with the other SIEM tools included in Security Onion, are better
suited for the intent of our capstone. Although many of the features across the evaluated
SIEMs were comparable, the determination to use ELK was made based on two primary
factors: features and documentation.
We believe that with regard to features, ELK is the better choice as all features are
available without the need to purchase a license. We noticed that the FOSS versions of
Prelude and OSSIM were limited in their features. To use all features available in Prelude
and OSSIM, a licensed version must be purchased. Prelude OSS is a lower-performance
version of the licensed Prelude SIEM and is designed for testing in a small network
infrastructure. Though OSSIM is not described as a lower-performance version of USM (the
licensed and full version), it lacks the ability to perform log management and to integrate
with third-party ticketing applications such as JIRA. Unlike Prelude and OSSIM, ELK is a
FOSS solution for which the full version is available for download. In contrasting the feature
sets available in our chosen SIEMs, ELK with Security Onion provides many more features
and capabilities than the free versions of Prelude and OSSIM. Due to the consideration of
licensing and features, ELK stands out as the superior SIEM choice.
We believe the ubiquitous documentation on ELK and the tools included in Security
Onion make it a more easily adoptable SIEM. Availability of documentation was an
important factor in choosing a SIEM as we want to ensure the capability can be easily
adopted. We found the documentation of OSSIM to be severely lacking as compared to
Prelude and ELK. The Need to derive guidance and information on OSSIM from
AlienVault’s USM, third-party websites, and forums was challenging and presents a barrier
for easy adoption of OSSIM. For the reason of lack of quality documentation, we eliminated
OSSIM from further consideration. The documentation for Prelude and ELK was far more
extensive and well organized. Although both Prelude and ELK had quality documentation
specifically from their vendors, we found much more third-party documentation for ELK in
general and ELK’s use within Security Onion. There are countless third-party webpages,
20
whitepapers, and books discussing how to use ELK as a SIEM. Because of the extensive
documentation and the vast suite of tools, ELK with Security Onion provide an easily
adoptable and powerful SIEM solution.
Since we have elected to use ELK within the Security Onion Linux distribution,
leveraging various security tools it has to offer, it is essential that we talk about what Security
Onion provides. There are many SIEM solutions available for use in monitoring and
protecting networks; however, there is not a single best solution for all networks. Security
Onion provides a package of network monitoring tools that network administrators and
security experts can choose from and configure to meet their specific network security needs.
Tools that comprise Security Onion may be categorized into three core components:
packet capture, Network Intrusion Detection Systems (NIDS) and Host-based Intrusion
Detection Systems (HIDS), and network analysis tools.
A. PACKET CAPTURE
Full packet capture in Security Onion is accomplished using Netsniff-ng, a sniffing
toolkit that captures packets seen by Security Onion sensors on inbound and outbound
traffics. This open-source toolkit is able to perform online and offline analysis of captured
packets. Captured packets are saved to disk, and pcap format is supported for analysis via
Wireshark. Sniffing tools are often placed on mirroring switch ports capturing and storing
data that can be relevant during preliminary and in-depth analysis. The following utilities
make up the Netsniff-ng toolkit [26]:
• Netsniff-ng: “a fast zero-copy analyzer, pcap capturing and replaying tool” [26].
• Flowtop: a network filter connection tracking tool.
• Curvetu: a lightweight curve25519-based IP tunnel.
• ASTraceroute: a traceroute utility.
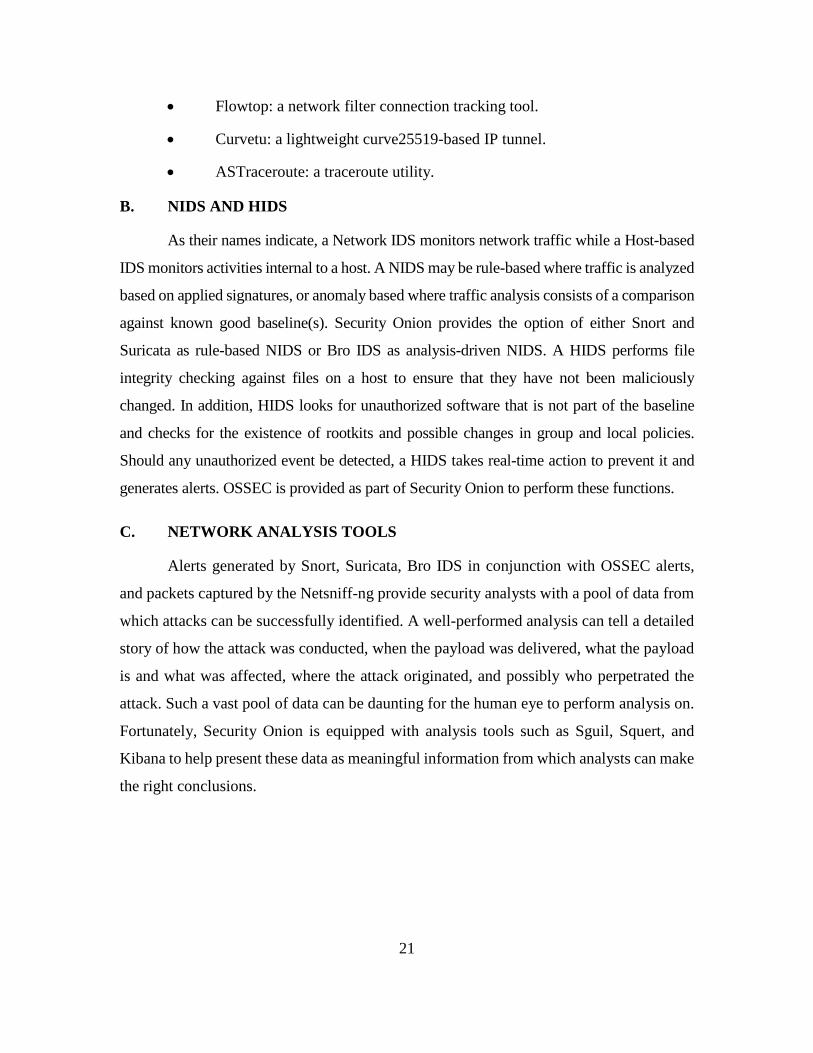
B. NIDS AND HIDS
As their names indicate, a Network IDS monitors network traffic while a Host-based
IDS monitors activities internal to a host. A NIDS may be rule-based where traffic is analyzed
based on applied signatures, or anomaly based where traffic analysis consists of a comparison
against known good baseline(s). Security Onion provides the option of either Snort and
Suricata as rule-based NIDS or Bro IDS as analysis-driven NIDS. A HIDS performs file
integrity checking against files on a host to ensure that they have not been maliciously
changed. In addition, HIDS looks for unauthorized software that is not part of the baseline
and checks for the existence of rootkits and possible changes in group and local policies.
Should any unauthorized event be detected, a HIDS takes real-time action to prevent it and
generates alerts. OSSEC is provided as part of Security Onion to perform these functions.
C. NETWORK ANALYSIS TOOLS
Alerts generated by Snort, Suricata, Bro IDS in conjunction with OSSEC alerts,
and packets captured by the Netsniff-ng provide security analysts with a pool of data from
which attacks can be successfully identified. A well-performed analysis can tell a detailed
story of how the attack was conducted, when the payload was delivered, what the payload
is and what was affected, where the attack originated, and possibly who perpetrated the
attack. Such a vast pool of data can be daunting for the human eye to perform analysis on.
Fortunately, Security Onion is equipped with analysis tools such as Sguil, Squert, and
Kibana to help present these data as meaningful information from which analysts can make
the right conclusions.
22
THIS PAGE INTENTIONALLY LEFT BLANK
23
IV. VIRTUAL TESTBED NETWORK
A. BUILDING A SIEM TESTBED NETWORK
To evaluate a SIEM, it is best to build a lab environment that can emulate a common
type of network the SIEM may be installed in. The goal of our lab environment was to use
both a virtualization hypervisor and a few additional physical machines to host several
systems for testing. We also wanted to use a firewall to isolate our lab environment from
the rest of the NPS network. To ensure our lab met the needs of our project, we focused on
three design characteristics—hardware, network backbone, and software. A thorough
evaluation of each of these characteristics enabled us to build a lab environment that
supported the demands of our project.
1. Hardware
The hardware we chose for our lab provided more power and resources than we
conceivably would need. Our entire lab was contained inside a Hewlett Packard Enterprise
C3000 BladeSystem chassis populated with four BL460C Gen 8 blade servers. Each blade
server was equipped with two Intel Xeon E5-2670 6-core CPUs, 64 gigabytes of RAM,
and various hard drive configurations ranging from dual 300 GB Serial Attached SCSI
(SAS) hard drives to dual 900 GB SAS hard drives. All hard drives were configured as
Redundant Array of Inexpensive Drives (RAID) level 1 to provide mirroring in case of a
failed drive. Each blade server was also equipped with six ethernet interfaces supporting
speeds up to 1 Gbps (gigabits per second) and one Intelligent Platform Management
Interface (IPMI) interface for Out-Of-Band (OOB) server management.
2. Network Backbone
For a network backbone, we utilized two Cisco Catalyst 3120X blade switches that
were connected to the C3000 blade chassis as Interconnect modules. The Cisco Catalyst
3120X blade switch is a layer 3 switch and thus performs (limited) routing functionality.
The two switches were connected via stacking cables in order to operate as one logical
switch. The switches were running Cisco IOS 12.2(58)SE1, which offered every feature
24
we determined we would likely have needed virtual local area networking (VLAN), port
mirroring, link aggregation, and secure shell (SSH). Each blade server had two ethernet
interfaces statically mapped directly to the switches. The blade chassis also was equipped
with two gigabit ethernet passthrough Interconnect modules which provided physical
ethernet interfaces that were statically mapped to the four remaining ethernet interfaces on
each blade server. The network backbone was divided into two separate VLANs—a
management VLAN and a lab VLAN. Connected to the management VLAN were all the
IPMI ports from the servers, the management interface for the C3000 blade chassis itself,
the switch, the firewall and the hypervisor. Connected to the lab VLAN were the firewall,
the hypervisor, and two blade servers for anything additional we chose not to virtualize.
3. Software
The software considerations consisted of choosing a firewall solution, a
virtualization hypervisor, and a few virtual machines running a variety of operating
systems. Rather than use an expensive firewall solution from Cisco or Palo Alto, we opted
for the free PfSense firewall. PfSense is a firewall based on FreeBSD that is distributed as
an installable ISO image. We installed PfSense onto one of the blade servers and utilized
three of the network interfaces. One network interface was configured as the wide area
network (WAN) interface and was connected directly to the NPS intranet. The only traffic
we permitted inbound on the WAN interface was established traffic and SSH for remote
management. The other two interfaces were connected directly to the switch—one assigned
to the management VLAN and the other assigned to the lab VLAN. To provide better
isolation of our lab network, we ensured that the management VLAN and the lab VLAN
could not route to each other and were also firewalled from each other. The PfSense
firewall was configured to provide DHCP services and DNS forwarding to the NPS Intranet
DNS servers for both the management VLAN and the lab VLAN.
We opted to leverage the VMWare ESXi hypervisor to allow virtualization of
Security Onion and additional network hosts. ESXi is a type 1 hypervisor, which means it
is installed onto the “bare metal” of a machine as opposed to a type 2 hypervisor that is
installed on top of a host operating system such as VMWare Workstation running on a
25
Windows OS. The main advantage in using a type 1 hypervisor such as ESXi is speed. A
type 1 hypervisor can run with almost no overhead as opposed to a type 2 hypervisor. ESXi
provided not only desirable scalability of our network, but also additional functionality,
such as saving the virtual machine’s state as a snapshot for later restoration. The snapshot
functionality affords the opportunity to quickly undo a change to a system by reverting to
a saved state. This is a convenient feature to have, especially for testing. Within the ESXi
server, we created virtual switches and port groups for both the lab and the management
VLAN. This enabled us to manage the ESXi server from the management VLAN and also
create virtual machines that were connected to one or both VLANs. We also created a
second port group on the lab virtual switch configured to promiscuous mode so that our
Security Onion virtual machine could monitor all traffic on the lab VLAN.
We created several virtual machines to encompass what operating systems may be
found on a modern network. We created a Windows Server 2012 R2 virtual machine and
promoted it to a domain controller for our “lab.net” domain. We also created a Windows 7
Pro virtual machine and joined it to the “lab.net” domain. Windows Update was disabled
on both Windows boxes. This was to ensure the Windows machines had a few
vulnerabilities in case we needed to throw exploits for malicious traffic generation. We
created Linux virtual machine running Ubuntu Linux 18.04 to act as a generic Linux box
on a network. We also created a virtual machine running Kali Linux 2018.2 to provide us
with an attack platform for simulating an attacker in the network. Finally, we created a
virtual machine designed to be vulnerable to several exploits. For this we utilized “Basic
Pentesting: 1” that we downloaded from vulnhub.org—a website dedicated to hosting
downloadable operating systems with built-in vulnerabilities.
B. NETWORK TOPOLOGY
The network diagram in Figure 1 details the architecture of our network and the IP
addressing scheme utilized.
26
Figure 1. Testbed Network Diagram
Table 7 lists the configuration of the network services in the lab VLAN.
Table 7. PfSense Services Provided
DHCP Server offering the IP addresses for the Management VLAN: 10.10.10.200-239 DHCP Server offering the IP addresses for the Lab VLAN: 192.168.1.101-139 DNS Forwarding for the Lab and Management VLANs Network Time Protocol (NTP)
27
V. ELK AND SECURITY ONION INSTALLATION AND CONFIGURATION
Once we built the testbed network, it was time to install and configure ELK via
Security Onion. There were several steps we needed to take to get ELK up and running.
First, we needed to ensure we had the necessary resources required for installation. Next,
we performed the installation, configured Security Onion and deployed ELK. Last, we
verified ELK was running correctly and familiarized ourselves with the configuration of
ELK.
A. GATHERING RESOURCES
Before we could begin installing ELK we needed to gather the resources we needed
to begin the process. We needed to create a virtual machine (VM) on our VMWare ESXi
equipped with the system resources required to execute ELK and the Security Onion
distribution. We also needed to ensure we had the installation media required to install
ELK.
1. Building the Virtual Machine
We initially built our VM based off the minimum system requirements stated for
Security Onion and used 1 CPU core, 8 GB of RAM, and 200 GB of hard disk space.
However, we found that to achieve long term stability and robust performance, we needed
to increase to 4 CPU cores and 16 GB of RAM. We attached three network interfaces to
the VM—One connected to our management VLAN, one connected to the lab VLAN tap
(for traffic monitoring), and one connected to the lab VLAN to receive logs from our
OSSEC agents. We also selected Ubuntu Linux 64-bit as the Guest OS version as that is
what Security Onion is based on.
2. Downloading Security Onion
Before we could begin our installation, we needed a copy of Security Onion. The
Security Onion distribution is provided as a downloadable International Standards
Organization (ISO) 9660 image. We downloaded the ISO image directly from the Security
28
Onion github.com page to our workstation. As a security precaution, we verified the
integrity of the ISO image using the Linux “gpg” command with the signatures and steps
provided on the Security Onion download page. After verifying the integrity of the ISO
image, we uploaded it to the ESXi datastore and assigned it to the DVD drive of the newly
created Security Onion VM.
B. SECURITY ONION INSTALLATION
Once we had a VM built and the Security Onion ISO downloaded and assigned to
the VM, we booted up the VM and began the installation process. After booting from the
ISO image, Security Onion ran as a live demo and did not write anything to disk. To begin
the installation, we ran the “Install Security Onion 16.04” script on the desktop. The install
process was standard to most Ubuntu Linux installations—choosing a language, enabling
auto-updating during installation, hard disk selection and partitioning, selecting a time
zone, and a keyboard layout. On the last screen of the installation process, we chose a
username, hostname, and password. We configured the username to be “sysop” (short for
system operator) and the hostname to be “seconion.” After several minutes, the installation
finished and a prompt to restart appeared. Upon restarting the VM, Security Onion booted
up and presented a prompt for login credentials. Because Security Onion was running in a
VM, we wanted to install the VMWare tools to enable optimizations such as automatic
screen resolution changes and copy and paste capabilities. To install the VMWare tools,
we logged in using the sysop credentials, opened a terminal and executed the following
commands in Table 8.
Table 8. VMWare Tools Installation
Command Description
sudo apt update Updated the Ubuntu software lists from the installed software repositories.
Sudo apt install open-vm-tools-desktop Installed the VMWare tools.
29
C. SECURITY ONION CONFIGURATION AND ELK INSTALLATION
To perform the Security Onion configuration, ELK installation and initial
configuration, there were several steps that needed to be taken. We first needed to update
the system, then we needed to execute the setup script on the Security Onion desktop twice.
The first execution assigned initial network configurations and initiated a reboot. The
second execution installed, and configured ELK and additional components included in
Security Onion. Then there were several commands that need to be executed to provide
additional configurations necessary to complete the setup.
1. Security Onion Update
Before we began any installation or configuration, we wanted to be sure our system
was up to date. This ensured that all proceeding installation and configuration scripts were
the latest. The first step in the update process is to execute the “soup” command from the
terminal. Soup is short for Security Onion update, and this command will automatically
initiate installation of all available updates for the Ubuntu operating system, the Security
Onion distribution, and the IDS rules. The script completed after approximately 10 minutes
There are several steps that need to be taken to configure Security Onion and install
and configure ELK. To begin, we logged into the Security Onion desktop and executed the
Elastic setup script on the desktop by double-clicking the icon titled “Setup.” Once
executed, the script announced that it “will configure the following services—click yes to
proceed:”
• Elasticsearch
• Logstash
• Kibana
• Squert
• Sguil
30
• Bro
• Snort/Suricata
• netsniff-ng
Before the previous services were installed, the script prompted for the initial
configuration of the management and monitoring interfaces. First, we selected which
interface was to be used for our management VLAN, and then assigned it a static IP address
of 10.10.10.50/24, a default gateway of 10.10.10.1, and a DNS server of 10.10.10.1.
Second, we selected which interface was to be used as our monitoring interface. This was
the interface associated with the VLAN tap that we added during the VM creation. After
selecting the management and monitoring interfaces, the script committed the changes and
prompted us to reboot.
3. Setup Script Round 2: ELK Installation and Configuration
After the reboot, we logged back in and executed the setup script a second time.
This time, the script recognized the completion of the initial network configuration and
allowed us to proceed to the next phase. Our next prompt allowed us to choose between
Evaluation Mode and Production Mode. Evaluation Mode automates many of the
installation options and is—as the script describes—”recommended for first-time users”
and “NOT intended for a production deployment.” We chose Production Mode so that we
could more explicitly control the installation process. Next, we were prompted to choose
between adding our Security Onion machine to a new or existing deployment. We were
not adding our Security Onion machine as a member of an existing deployment, so we
chose “New.” The next prompt in the script asks for the creation of a user account. This
user is used for logging into Kibana (and other monitoring tools), and so we created an
account named “siemop”—short for SIEM operator.
The next step in the script prompted for the selection of “Best Practices” or
“Custom” options for the remainder of the configuration process. We chose custom so that
we could see what options were being set, but ultimately decided that the defaults were
suitable choices for the configuration. Next in the script we were prompted for the
configuration of Sguil. Table 9 lists the default configuration options provided and chosen.
31
Table 9. Default Configuration Options
Description Default Option
Associated Configuration File
Days of alerts to keep in Sguil database 30 /etc/nsm/securityonion.conf
Days of data to repair in Sguil database (a daily scheduled job run to repair database inconsistencies)
7 /etc/nsm/securityonion.conf
Once the Sguil configuration options were specified, we were then prompted to
configure IDS options. First, we needed to choose which IDS rule-set to use. We chose the
only ruleset that did not require a paid subscription—”Emerging Threats Open.” Next,
when prompted to choose between Suricata and Snort, we chose to use Suricata. According
to [27], both are good IDSs but our personal preference is Suricata, as it offers
multithreading capabilities not available in Snort.
After selecting Suricata, we chose to “Enable network sensor services” which
includes Suricata for intrusion detection, Bro for protocol logging, and netsniff-ng for
packet capture. The next several steps in the script allowed for granular configuration of
each of the network sensor services. The network services configuration began by asking
to set the PF_RING min_sum_slots configuration setting. According to the Security Onion
discussion forum, this number is essentially the queue size for Bro to use during packet
capture [28]. The setup process analyzes the system and determines an appropriate number
[29]. We elected to use the recommended number of 4096 for our installation. Next, we
were prompted to confirm our previously selected monitoring interface, enable the IDS
engine, and then select which network ranges we wanted to monitor. Our intent was to
monitor our lab VLAN so we entered “192.168.1.0/24” as the range to be monitored. At
our next prompt, we confirmed enabling Bro, selected yes to enable file extraction (this
saves all files sniffed from the network to /nsm/bro/extracted), and finally chose to enable
full packet capture. The script then asked what maximum memory allocation to use for
saved packet capture (PCAP) files. Larger individual PCAP files take longer to process so
we opted for the default size of 150 MB. We proceeded with the setup by selecting the
default I/O method for netsniff-ng and the default size of 64 MB for the PCAP ring buffer.
32
The PCAP ring buffer is the amount of RAM allocated to the monitoring interface—too
little allocated RAM could result in dropped packets. Next, when prompted to choose the
percentage of disk usage to trigger purging of old logs, we chose the default of 90%.
The next prompt in the script asked whether we wanted to enable Salt for
management of our Security Onion deployment. Salt will automatically keep IDS rule-sets
updated, so naturally we opted to accept the default and enable Salt. Moving forward, we
were prompted to enable the Elastic Stack and thus ensure the core components of our
SIEM solution were running. The last stage of the setup script deals with storage
configuration. Next, we were asked whether we would be storing logs locally or using a
remote logging server. Although using a remote logging server might be a better choice for
deployment on a larger network, local storage was more suitable for our needs. When asked
for the amount of allocated space for disk storage, we accepted the default size of 94 GB.
Last, we were presented with a confirmation prompt stating that the following changes
were about to be performed.
• Set the OS time zone to UTC.
• Delete any existing NSM data/configuration.
• Create a Sguil server named seucrityonion.
• Create a user account named siemop.
• Monitor each of the following interfaces: ens 192
• Run a single IDS engine process per interface.
• Run a single Bro process per interface.
• Download Emerging Threats Open ruleset.
• Configure IDS HOME_NET as 192.168.1.0/24.
• Configure Elastic Stack.
Upon clicking “proceed,” the last steps of the installation began and after
approximately 10 minutes, the script reported it was finished. We were then provided a
series of informational dialog boxes reporting: successful completion of various
33
components, where various logs can be found, and the following commands in Table 10
for checking on the status of the Security Onion services.
Table 10. Security Onion Status Commands
Command Description
sudo sostat Detailed information about service status sudo sostat-quick Guided tour of sostat output sudo-sostat-redacted Redacted information to share with the mailing list in
case of questions
4. Additional Configurations
After both setup scripts were executed, we still needed to perform additional
configurations to add an interface for receiving HIDS logs, and to adjust the firewall rules
to allow all necessary inbound connections. Leading up to this point, we only had two
interfaces configured—a management interface with the IP address of 10.10.10.50 for
remote interaction, and a monitoring interface in promiscuous mode for network sniffing.
The interface for collecting OSSEC logs was connected to the lab VLAN but needed an IP
address assigned so that the OSSEC agents could be configured with a log shipment
destination. To configure the additional interface, we needed to edit the “/etc/network/
interfaces” configuration file to add a configuration entry for the log collection interface
and then reboot for the changes to take effect. Figure 2 illustrates the additional
configuration entries we appended to the file:
Figure 2. etc/network/interfaces configuration
34
After rebooting, we proceeded to adjust the firewall rules to allow various required
inbound connections. Security Onion offers a script named “so-allow” for updating the
firewall, but we found it lacks in granularity, so we used the “ufw” command for adjusting
the firewall rules. The “ufw” command—short for “uncomplicated firewall” enabled us to
more precisely and securely configure the firewall with only the following two commands
listed in Figure 3.
Figure 3. ufw firewall configuration
The first “ufw” command listed in Figure 3 allowed TCP ports 22 (SSH), 443
(HTTPS), and 7734 (Sguil) in on the management interface to the management IP address
10.10.10.50. The second command allowed UDP port 1514 (OSSEC agent) in on the lab
interface to the lab IP address. After the firewall was updated, we now had full access to
ELK from our management VLAN. Additionally, the necessary TCP port (1514) for
OSSEC agent log collection was open for later OSSEC and OSSEC Agent installation and
configuration.
D. ELK CONFIGURATION
Within Security Onion, ELK components come preconfigured to work in tandem.
This pre-configuration was perfect for a stand-alone network environment such as the one
used for the purpose of this capstone. This configuration may not work well for all network
architectures. In a heavily distributed network architecture; for example, there may be a
need to store indexes at multiple geographic areas. Knowing the location of ELK
configuration files within Security Onion, and understanding their purpose, is crucial when
35
it comes to customizing ELK’s components configurations to satisfy your specific network
needs.
1. Elasticsearch
To speed the process of searching for logs and finding attributes based on filters,
Elasticsearch creates and saves Lucene indexes of logs available in Logstash. Lucene, as
defined in [30] is a high performance and scalable search engine application programming
interface written in Java. Lucene was written by Doug Cutting and is owned by Apache
Software Foundation. Lucene query syntax uses indexes to search for text. The Security
Onion default configuration of ELK allocates one primary shard for each index, and zero
replica for all primary shards. In a distributed architecture, Elasticsearch indexes are
distributed across numerous nodes; each element of an index that resides on a node is called
as a shard. This is different from the default configuration of ELK, which according to
Elastic [31], allocates five primary shards to each index, and one replica for each primary
shard (a total of 10 shards per index), as to allow for redundancy. These replicas can be
stored on separate nodes on the network—a cloudlike approach to eliminate a single point
of failure. To check for existing shards, we typed the command “curl localhost: 9200/_cat/
shards | grep logstash | sort.”
The output from this command is shown in Figure 4. There is a daily shard for
logstash-bro, logstash-ids, and logstash-syslog. Given that the system was configured two
days beforehand, there were only two shards available per index.
36
Figure 4. List of Shards
Though we opted to the keep the shards configuration as is, the number of generated
shards and their replicas is modifiable by accessing the “template.json” configuration files
in the “/etc/logstash” directory. This is doable by navigating to the directory and opening
the “logstash-template.json” configuration files using vim editor or an editor of choice. A
search for the string “number_of_shards” and/or “number_of_replicas” would have led to
the line where the number of shards or replicas can be changed as necessary. A listing of
the “/etc/logstash” directory for all “template.json” files is in Figure 5.
Figure 5. List of template.json Files
37
In addition to the json configuration files, are three “yml” configuration files
located in the “/etc/elasticsearch” directory.
• The “elasticsearch.yml” configuration file allows for the setting of master node(s) on the network. In our case, the master node setting was left at its default value of “1” and the network host IP of “0.0.0.0” to reflect the localhost. Should more nodes be involved in receiving shard replicas, this is where it would be configured. Also, the location where Elasticsearch logs are to be sent and stored is configured here. Elasticsearch path is set by default to send and save its logs to “/var/log/elasticsearch.”
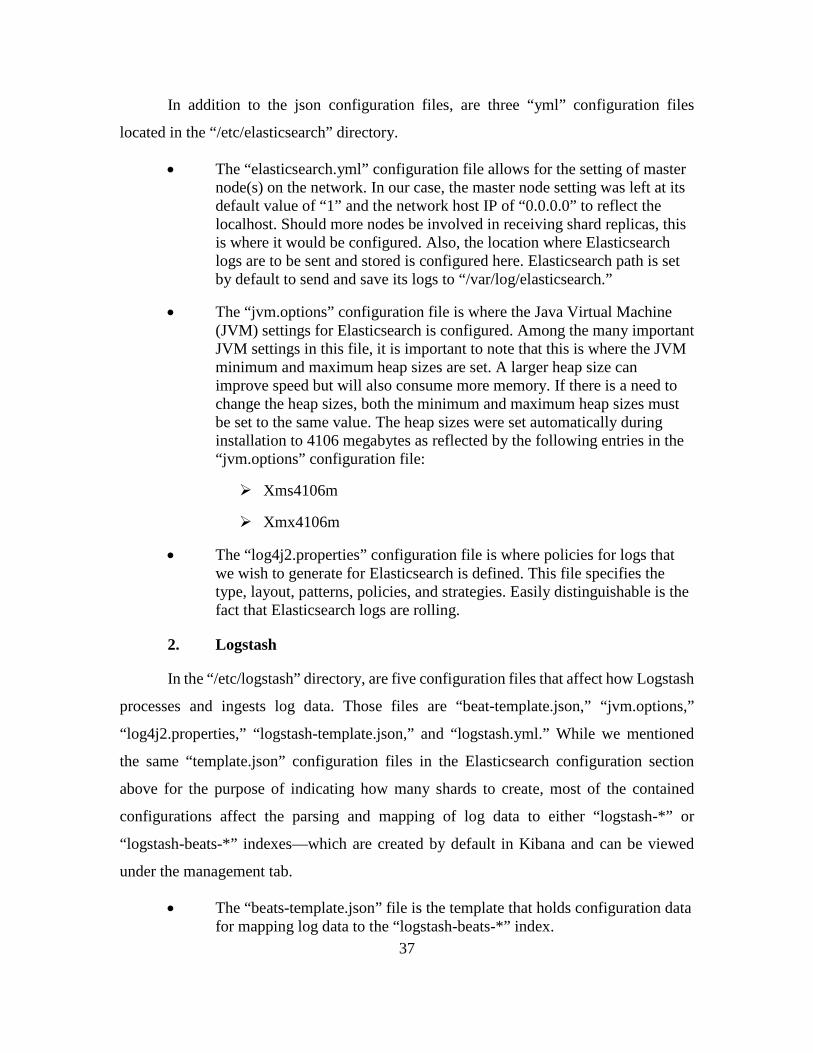
• The “jvm.options” configuration file is where the Java Virtual Machine (JVM) settings for Elasticsearch is configured. Among the many important JVM settings in this file, it is important to note that this is where the JVM minimum and maximum heap sizes are set. A larger heap size can improve speed but will also consume more memory. If there is a need to change the heap sizes, both the minimum and maximum heap sizes must be set to the same value. The heap sizes were set automatically during installation to 4106 megabytes as reflected by the following entries in the “jvm.options” configuration file:
Xms4106m
Xmx4106m
• The “log4j2.properties” configuration file is where policies for logs that we wish to generate for Elasticsearch is defined. This file specifies the type, layout, patterns, policies, and strategies. Easily distinguishable is the fact that Elasticsearch logs are rolling.
2. Logstash
In the “/etc/logstash” directory, are five configuration files that affect how Logstash
processes and ingests log data. Those files are “beat-template.json,” “jvm.options,”
“log4j2.properties,” “logstash-template.json,” and “logstash.yml.” While we mentioned
the same “template.json” configuration files in the Elasticsearch configuration section
above for the purpose of indicating how many shards to create, most of the contained
configurations affect the parsing and mapping of log data to either “logstash-*” or
“logstash-beats-*” indexes—which are created by default in Kibana and can be viewed
under the management tab.
• The “beats-template.json” file is the template that holds configuration data for mapping log data to the “logstash-beats-*” index.
38
• The “logstash-template.json” file is the template that holds configuration data for mapping log data to the “logstash-*” index.
• The “jvm.options” file holds configuration data for Logstash use of JVM to include heap space allocation. Similar to Elasticsearch, Logstash is allocated two Gigabytes of heap space.
• The “Logstash.yml” file holds Logstash configuration to identify the input node, data path, pipeline settings during the filter and output stages, module settings for plugins, cloud settings, queuing settings, dead-letter queue settings, metrics settings, debugging settings, and other settings.
• The “log4j2.properties” file contains configuration data for how, where, and when to store and delete Logstash logs. The current configuration is set to roll (delete) logs after seven days. This is indicated in the file with the following line:
For the purpose of quickly detecting cyber-attacks conducted against the network
environment that we created for the purpose of this study, we added a custom dashboard
to Kibana and configured it with some Lucene queries that are discussed in this section.
However, for the most part, Kibana came well configured with a long list of visualizations;
such as data tables, vertical and horizontal bar graphs, tag clouds, line plots, and pie charts
that reflect trends and metrics for logs, alerts, events, and detected incidents on the
monitored network. Before addressing visualizations within Kibana, it is important to note
where its configuration files are located: “/etc/kibana” and “/etc/nsm.”
• In “/etc/kibana,” the “kibana.yml” configuration file holds information that denote the kibana server name (“Kibana” in this case), the server host (“0” indicating the localhost), Elasticsearch’s Uniform Resource Locator (URL) (http://elasticsearch:9200), and where Kibana is to send and store generated logs. Kibana logs can be found in “/var/log/kibana/kibana.log.”
• In “/etc/nsm” is the “securityonion.conf” file with configuration data that indicate settings that were applied during the installation of Security Onion, ELK, and other included network monitoring tools. On line 81 of this file, the following Kibana options can be found and modified: Kibana_enabled (where the option to enable or disable Kibana is available), the kibana index name (a different index can be specified here if need be), the version number, the tap ID, and additional options which is left blank by default.
a. How to Access Kibana
Kibana is accessible via a web interface. Following ELK installation, the Kibana
launch icon was added to the list of applications and to the desktop. Double clicking on the
icon launches the web browser and links the Kibana logging page at “https://localhost/app/
kibana.” To access Kibana remotely, we simply replaced “localhost” with the Security
Onion host IP “https://10.10.10.50/app/kibana.” As stated in Section C.3 of this chapter,
we had to configure the “ufw” to allow remote access to hosts on the management VLAN.
Under Management, the current version of Kibana may be found. The version
installed for the purpose of this study is Kibana version 6.2.4. As depicted in Figure 18, the
submenus are Index Patterns, Saved Objects, and Advanced Settings.
• Index Patterns provides a graphical user interface that allows for the modification of existing indexes. To modify the configuration of an index, select the desired index to the left of the page and click on the edit button to modify its patterns. To created new indexes, click on “create index pattern.”
• Under Saved Objects, the user may import, export, or delete: dashboards, saved searches, and visualizations. When exporting, files are exported in JSON format.
• Advanced Settings provides an avenue for Advanced users to edit settings that can impact several objects within Kibana. A caution banner on this page states that “You can break stuff here.”
49
Figure 18. Management Page
The Squert plugin is a link to Squert—a web application used to query IDS alerts.
Squert is one of the many visualization tools included in Security Onion. More information
about Squert can be found on GitHub at https://github.com/Security-Onion-Solutions/
security-onion/wiki/Squert.
c. Alert Monitoring Using Kibana
ELK provides us with numerous logs that contain event data and alerts from various
systems within the network. Using Kibana, we could view logs and alert data, and network
trends and metrics. However, this information would be less useful to a network security
analyst if it was hard to sift through. The ability to promptly detect an intrusion was our
goal, and having the most pertinent information brought “forward” to the analyst is an
essential element of this goal. To have such a visualization available to us, we created a
custom dashboard to see NIDS (Suricata) and HIDS (OSSEC) alerts. To further configure
the custom dashboard, we added the following visualizations and saved searches:
• Visualizations: NIDS—Alerts Over Time, OSSEC Alerts—Log Count Over Time, and Navigation.
shellcode-detect Executable code was detected high successful-admin Successful Administrator
Privilege Gain high
successful-user Successful User Privilege Gain
high
trojan-activity A Network Trojan was detected
high
unsuccessful-user Unsuccessful User Privilege Gain
high
web-application-attack Web Application Attack high attempted-dos Attempted Denial of Service medium attempted-recon Attempted Information Leak medium bad-unknown Potentially Bad Traffic medium default-login-attempt Attempt to login by a default
username and password medium
denial-of-service Detection of a Denial of Service Attack
medium
misc-attack Misc Attack medium non-standard-protocol Detection of a non-standard
protocol or event medium
rpc-portmap-decode Decode of an RPC Query medium successful-dos Denial of Service medium successful-recon-largescale Large Scale Information Leak medium successful-recon-limited Information Leak medium suspicious-filename-detect A suspicious filename was
detected medium
suspicious-login An attempted login using a suspicious username was detected
medium
system-call-detect A system call was detected medium
104
Class Type Description Priority unusual-client-port-connection A client was using an unusual
port medium
web-application-activity Access to a potentially vulnerable web application
medium
icmp-event Generic ICMP event low misc-activity Misc activity low network-scan Detection of a Network Scan low not-suspicious Not Suspicious Traffic low protocol-command-decode Generic Protocol Command
Decode low
string-detect A suspicious string was detected
low
unknown Unknown Traffic low tcp-connection A TCP connection was
detected very low
105
APPENDIX B. OSSEC RULE CLASSIFICATION LEVELS
Obtained from [38].
Rules Classification
The rules are classified in multiple levels. From the lowest (00) to the maximum
level 16. Some levels are not used right now. Other levels can be added between
them or after them.
The rules will be read from the highest to the lowest level.
00—Ignored—No action taken. Used to avoid false positives. These rules are
scanned before all the others. They include events with no security relevance.
01—None -
02—System low priority notification—System notification or status messages.
They have no security relevance.
03—Successful/Authorized events—They include successful login attempts,
firewall allow events, etc.
04—System low priority error—Errors related to bad configurations or unused
devices/applications. They have no security relevance and are usually caused by
default installations or software testing.
05—User generated error—They include missed passwords, denied actions, etc.
By itself they have no security relevance.
06—Low relevance attack—They indicate a worm or a virus that have no effect
to the system (like code red for apache servers, etc.). They also include frequently
IDS events and frequently errors.
07—”Bad word” matching. They include words like “bad,” “error,” etc. These
events are most of the time unclassified and may have some security relevance.
08—First time seen—Include first time seen events. First time an IDS event is
fired or the first time a user logged in. If you just started using OSSEC HIDS these
messages will probably be frequently. After a while they should go away, it also
includes security relevant actions (like the starting of a sniffer or something like
that).
106
09—Error from invalid source—Include attempts to login as an unknown user or
from an invalid source. May have security relevance (especially if repeated). They
also include errors regarding the “admin” (root) account.
10—Multiple user generated errors—They include multiple bad passwords,
multiple failed logins, etc. They may indicate an attack or may just be that a user
just forgot his credentials.
11—Integrity checking warning—They include messages regarding the
modification of binaries or the presence of rootkits (by rootcheck). If you just
modified your system configuration you should be fine regarding the “syscheck”
messages. They may indicate a successful attack. Also included IDS events that
will be ignored (high number of repetitions).
12—High importance event—They include error or warning messages from the
system, kernel, etc. They may indicate an attack against a specific application.
13—Unusual error (high importance)—Most of the times it matches a common
attack pattern.
14—High importance security event. Most of the times done with correlation and
it indicates an attack.
15—Severe attack—No chances of false positives. Immediate attention is
necessary.
107
LIST OF REFERENCES
[1] B. Charter, “EVTX and Windows event logging,” SANS Institute, 2018. [Online]. Available: https://www.sans.org/reading-room/whitepapers/logging/evtx-windows-event-logging-32949
[2] A. Lane, “Understanding and selecting SIEM/LM: aggregation, normalization, and enrichment,” Securosis, May 27, 2010. [Online]. Available: https://securosis.com/blog/understanding-and-selecting-siem-lm-aggregation-normalization-and-enrichmen
[4] Prelude,“ Choose your version.” Accessed August 9, 2018. [Online]. Available: http://www.prelude-siem.com/en/products/choose-your-version
[5] H. Debar, D. Curry, B. Feinstein, “The intrusion detection message exchange format (IDMEF),” RFC4765, March 2007. [Online]. Available: https://www.ietf.org/rfc/rfc4765.txt
[6] Prelude, “3rd party agents installation.” Accessed August 9, 2018. [Online]. Available: https://www.prelude-siem.org/projects/prelude/wiki/InstallingAgentThirdparty
[7] Prelude, “Welcome to the Prelude universal open-source SIEM project.” Accessed August 9, 2018. [Online]. Available: https://www.prelude-siem.org/projects/prelude/wiki/WikiStart
[8] “OSSIM,” Wikipedia. Accessed August 9, 2018. [Online]. Available: https://en.wikipedia.org/wiki/OSSIM
[10] FIWARE, “Security-monitoring: service level SIEM open API specification.” Accessed August 9, 2018. [Online]. Available: http://forge.fiware.org/plugins/mediawiki/wiki/fiware/index.php/Security-Monitoring:_Service_Level_SIEM_Open_API_Specification
[11] AlienVault, “Configure log forwarding on commonly used data sources.” Accessed August 9, 2018. [Online]. Available: https://www.alienvault.com/documentation/usm-appliance/supported-plugins/supported-plugins.htm
108
[12] AlienVault, “Minimum hardware requirements for USM appliance virtual machines.” Accessed August 9, 2018. [Online]. Available: https://www.alienvault.com/documentation/usm-appliance/sys-reqs/hardware-spec.htm
[24] D. Berman, “The complete guide to the ELK Stack—2018,” Logz.io, June 26, 2018. [Online]. Available: https://logz.io/learn/complete-guide-elk-stack