Sieve: Scalable In-situ DRAM-based Accelerator Designs for Massively Parallel k-mer Matching Lingxi Wu University of Virginia [email protected]Rasool Sharifi University of Virginia [email protected]Marzieh Lenjani University of Virginia [email protected]Kevin Skadron University of Virginia [email protected]Ashish Venkat University of Virginia [email protected]Abstract—The rapid influx of biosequence data, coupled with the stagnation of the processing power of modern computing sys- tems, highlights the critical need for exploring high-performance accelerators that can meet the ever-increasing throughput de- mands of modern bioinformatics applications. This work argues that processing in memory (PIM) is an effective solution to enhance the performance of k-mer matching, a critical bottleneck stage in standard bioinformatics pipelines, that is characterized by random access patterns and low computational intensity. This work proposes three DRAM-based in-situ k-mer match- ing accelerator designs (one optimized for area, one optimized for throughput, and one that strikes a balance between hardware cost and performance), dubbed Sieve, that leverage a novel data mapping scheme to allow for simultaneous comparisons of millions of DNA base pairs, lightweight matching circuitry for fast pattern matching, and an early termination mechanism that prunes unnecessary DRAM row activation to reduce latency and save energy. Evaluation of Sieve using state-of-the-art workloads with real-world datasets shows that the most aggressive design provides an average of 326x/32x speedup and 74X/48x energy savings over multi-core-CPU/GPU baselines for k-mer matching. Index Terms—Processing-in-memory, Bioinformatics, Acceler- ator I. I NTRODUCTION The field of bioinformatics has enabled significant ad- vances in human health through its contributions to precision medicine, disease surveillance, population genetics, and many other critical applications. The centerpiece of a bioinformatics pipeline is genome sequence comparison and classification, which involves aligning query sequences against reference sequences, with the goal of identifying patterns of structural similarity and divergence. While traditional sequence align- ment algorithms employ computationally-intensive dynamic programming techniques, there has been a growing shift to a high-performance heuristic-based approach called k-mer matching, that breaks a given query sequence into a set of short subsequences of size k, which are then scanned against a reference database for hits, with the underlying assumption that biologically correlated sequences share many short lengths of exact matches. K-mer matching has been deployed in a wide array of bioinformatics tasks, including but not limited to, pop- ulation genetics [1], cancer diagnosis [2], metagenomics [3]– [8], bacterial typing [9], and protein classification [10]. K-mer matching may also show up in other application domains, but in this paper, we focus on bioinformatics. 0% 20% 40% 60% 80% 100% Kraken CLARK stringMLST Phymer LMAT BLASTN K-mer Matching Build Taxonomy Trees Build Classification Table Word Extending Hits Update Reads Filtering Classification Verification Other Fig. 1: Execution time breakdown of Kraken [3], CLARK [6], stringMLST [9], Phymer [1], LMAT [7], BLASTN [15] The acceleration of bulk k-mer matching is of paramount importance for two major reasons. First, k-mer matching sits on the critical path of many genome analysis pipelines. Figure 1 shows the execution breakdown of several important bioinformatics applications that target a variety of tasks rang- ing from metagenomics to population genetics, and clearly, k- mer matching dominates the execution time in all applications. Second, modern sequencing technologies have been shown to generate data at a rate surpassing Moore’s Law [11]. In fact, by 2025, the market share of metagenomics alone is expected to reach $1.4 billion, and the amount of data that needs to be an- alyzed by metagenomics pipelines is projected to surpass that of YouTube and Twitter [12]. To further exemplify the scale of data explosion and processing overhead, consider the case of precision medicine, where a patient’s sample can be sequenced in roughly 48 hours on the NovaSeq instrument, producing 10 TB of microbiome and DNA/RNA data [13]. To develop personalized treatment from these samples, raw sequences are passed through, often in parallel, various metagenomics stages with k-mer matching on the critical path (e.g., ∼68 days on Kraken [3]). These tasks play a critical role in combating pandemics and treating antibiotic-resistant infections, saving billions of dollars in health care costs [13], [14]. However, despite its significance, the acceleration of k-mer matching on modern high-end computing platforms remains a challenge, due to its inherently memory-bound nature, con- siderably limiting downstream genome analysis tasks from realizing their full potential. In particular, k-mer matching algorithms are typically characterized by random accesses across large memory regions, leading to poor cache behavior, even on high-end servers that feature large last-level caches. The cache-unfriendliness of k-mer matching will continue to get worse with the rapid growth in the size and complexity
Transcript
Sieve: Scalable In-situ DRAM-based AcceleratorDesigns for Massively Parallel k-mer Matching
Abstract—The rapid influx of biosequence data, coupled withthe stagnation of the processing power of modern computing sys-tems, highlights the critical need for exploring high-performanceaccelerators that can meet the ever-increasing throughput de-mands of modern bioinformatics applications. This work arguesthat processing in memory (PIM) is an effective solution toenhance the performance of k-mer matching, a critical bottleneckstage in standard bioinformatics pipelines, that is characterizedby random access patterns and low computational intensity.
This work proposes three DRAM-based in-situ k-mer match-ing accelerator designs (one optimized for area, one optimizedfor throughput, and one that strikes a balance between hardwarecost and performance), dubbed Sieve, that leverage a noveldata mapping scheme to allow for simultaneous comparisons ofmillions of DNA base pairs, lightweight matching circuitry forfast pattern matching, and an early termination mechanism thatprunes unnecessary DRAM row activation to reduce latency andsave energy. Evaluation of Sieve using state-of-the-art workloadswith real-world datasets shows that the most aggressive designprovides an average of 326x/32x speedup and 74X/48x energysavings over multi-core-CPU/GPU baselines for k-mer matching.
Index Terms—Processing-in-memory, Bioinformatics, Acceler-ator
I. INTRODUCTION
The field of bioinformatics has enabled significant ad-vances in human health through its contributions to precisionmedicine, disease surveillance, population genetics, and manyother critical applications. The centerpiece of a bioinformaticspipeline is genome sequence comparison and classification,which involves aligning query sequences against referencesequences, with the goal of identifying patterns of structuralsimilarity and divergence. While traditional sequence align-ment algorithms employ computationally-intensive dynamicprogramming techniques, there has been a growing shift toa high-performance heuristic-based approach called k-mermatching, that breaks a given query sequence into a set ofshort subsequences of size k, which are then scanned againsta reference database for hits, with the underlying assumptionthat biologically correlated sequences share many short lengthsof exact matches. K-mer matching has been deployed in a widearray of bioinformatics tasks, including but not limited to, pop-ulation genetics [1], cancer diagnosis [2], metagenomics [3]–[8], bacterial typing [9], and protein classification [10]. K-mermatching may also show up in other application domains, butin this paper, we focus on bioinformatics.
0% 20% 40% 60% 80% 100%
KrakenCLARK
stringMLSTPhymer
LMATBLASTN
K-mer Matching Build Taxonomy Trees Build Classification TableWord Extending Hits Update Reads FilteringClassification Verification Other
Fig. 1: Execution time breakdown of Kraken [3], CLARK[6], stringMLST [9], Phymer [1], LMAT [7], BLASTN [15]
The acceleration of bulk k-mer matching is of paramountimportance for two major reasons. First, k-mer matchingsits on the critical path of many genome analysis pipelines.Figure 1 shows the execution breakdown of several importantbioinformatics applications that target a variety of tasks rang-ing from metagenomics to population genetics, and clearly, k-mer matching dominates the execution time in all applications.Second, modern sequencing technologies have been shown togenerate data at a rate surpassing Moore’s Law [11]. In fact, by2025, the market share of metagenomics alone is expected toreach $1.4 billion, and the amount of data that needs to be an-alyzed by metagenomics pipelines is projected to surpass thatof YouTube and Twitter [12]. To further exemplify the scale ofdata explosion and processing overhead, consider the case ofprecision medicine, where a patient’s sample can be sequencedin roughly 48 hours on the NovaSeq instrument, producing10 TB of microbiome and DNA/RNA data [13]. To developpersonalized treatment from these samples, raw sequences arepassed through, often in parallel, various metagenomics stageswith k-mer matching on the critical path (e.g., ∼68 days onKraken [3]). These tasks play a critical role in combatingpandemics and treating antibiotic-resistant infections, savingbillions of dollars in health care costs [13], [14].
However, despite its significance, the acceleration of k-mermatching on modern high-end computing platforms remains achallenge, due to its inherently memory-bound nature, con-siderably limiting downstream genome analysis tasks fromrealizing their full potential. In particular, k-mer matchingalgorithms are typically characterized by random accessesacross large memory regions, leading to poor cache behavior,even on high-end servers that feature large last-level caches.The cache-unfriendliness of k-mer matching will continue toget worse with the rapid growth in the size and complexity
of genomic databases, making the task a major bottleneck inmodern bioinformatics pipelines. This is further exacerbatedby the fact that the computation per k-mer lookup is toosmall to mask the high data access latency, thereby renderingexisting compute-centric platforms such as multi-core CPUsand GPUs inadequate for large-scale genome analysis tasks.
Memory-centric solutions to accelerate bioinformatics ap-plications come in a variety of flavors, but recent proposalsdemonstrate that near-data [16]–[18] and in-memory process-ing systems [19]–[21] have promising potential to improve theefficiency of large-scale genome analysis tasks, owing to thefact that these applications are increasingly characterized bytheir high data movement (from memory to the processor) andlow computation (within the processor) costs [22].
This work explores the design space for high-performancek-mer matching accelerators that use logic in DRAM as thebasis for acceleration, including the most aggressive form ofprocessing-in-memory (PIM), in-situ computing, with the goalof parallel processing of sequence data within DRAM rowbuffers. To this end, we propose Sieve, a set of novel Scalablein-situ DRAM-based accelerator designs for massively parallelk-mer matching. Specifically, we offer three separate designs:Sieve Type-1, Type-2, and Type-3. Each architecture incre-mentally adds extra hardware complexity to unlock more per-formance benefits. Note that, although our approach involvesmodifying conventional DRAM organization, we do not pro-pose change conventional DRAM; our goal is to only leverageDRAM technology to build a new accelerator. Ultimately, thevalue of the accelerator will determine whether a new DRAM-based chip is worth the design and manufacturing effort.
The advantage of in-situ computing is that the bandwidthat the row buffer is six orders of magnitude larger than that atthe CPU, while the energy for data access is three orders ofmagnitude lower [23], [24]. However, in-situ computing alsointroduces several key challenges. First, in-situ accelerationnecessarily requires the tight integration of processing logicwith core DRAM components, which has been shown to resultin prohibitively high area overheads [19], [21]. In fact, evena highly area-efficient state-of-the-art in-situ accelerator isonly half as dense as regular DRAM [19]. However, bioin-formatics applications typically favor accelerators with largermemory capacity due to their ability to accommodate the ever-increasing DNA datasets that need to be analyzed within shorttime budgets. Second, existing in-situ approaches [19], [20]rely on multi-row activation and row-wise data mapping toperform bulk Boolean operations of data within row buffers,resulting in substantial loss of throughput and efficiency [21].Finally, to capitalize on the performance benefit of in-situ com-puting for k-mer matching, it is imperative that the acceleratoris provisioned with an efficient k-mer indexing scheme thatavoids query broadcasting, and a mechanism to quickly locateand transfer payloads (e.g., genome taxon records).
Key Contributions. The distinguishing feature of Sieve isthe placement of reference k-mers vertically along the bitlinesof DRAM chips and subsequently utilizing sequential single-row activation rather than the multi-row activation proposed in
prior works, to look up queries against thousands of referencek-mers simultaneously. The column-wise placement of k-mers further allows us to employ a novel Early TerminationMechanism (ETM) that interrupts further row activation uponthe successful detection of a k-mer mismatch, thereby con-siderably alleviating the latency and energy overheads due toserial row activation. To the best of our knowledge, this is thefirst work to introduce and showcase the effectiveness of sucha column-wise data mapping scheme for k-mer matching withearly termination, substantially advancing the state-of-the-artin terms of both throughput and efficiency.
By exploiting the fact that matching individual k-mers isrelatively less complex than most other conventional PIM taskssuch as graph processing, in this work, we design a specializedcircuit for k-mer matching, with the goal of minimizing theassociated hardware cost. We then meticulously explore thedesign space of in-situ PIM-based accelerators by placingsuch custom logic at different levels of the DRAM hierarchyfrom the chip I/O interface (Type-1) to the subarray level(Type-2/3), with a detailed analysis of the performance-area-complexity trade-offs, and a discussion of system integrationissues, deployment models, and thermal concerns. We com-pare each Sieve design with state-of-the-art k-mer-matchingimplementations on CPU, GPU, and FPGA, and performrigorous sensitivity analyses to demonstrate their effectiveness.We show that the processing power of Sieve scales linearlywith respect to its storage capacity, considerably enhancing theperformance of modern genome analysis pipelines. Our mostaggressive design provides an average speedup of 210X/35Xand an average energy savings of 35X/71X over conventionalmulti-core-CPU/GPU baselines
II. BACKGROUND
In this section, we introduce the k-mer matching procedureand explain why it is a bottleneck stage in conventionalarchitectures.
K-mer Matching in Bioinformatics. A DNA sequence isa series of nucleotide bases commonly denoted by four letters(bases): A, C, G, and T. K-mers are subsequences of size k.Metagenomic algorithms attempt to assign taxonomic labels togenetic fragments (sequences) with unknown origins. A “tax-onomic label” is an assignment of a sequence to a particularorganism or species. Traditionally, this is done by aligning anindividual query sequence against reference sequences, whichcan be prohibitively slow. Processing a metagenomics filecontaining 107 sequences using an alignment-based BLASTalgorithm takes weeks of CPU time [25], [26]. Experts predictthat genomics will soon become the most prominent dataproducer in the next decade [11], demanding more scalablesequence analysis infrastructure. More recently, alignment-freetools that rely on simple k-mer matching have emerged toaid large-scale genome analysis tasks, due to the fact thatproperly labeled k-mers are often sufficient to infer taxonomicand functional information of a sequence [3], [6], [7], [27].
Figure 2 illustrates the process of a typical k-mer-matching-based sequence classifier. In an offline stage, a reference k-
mer database is built, which maps unique k-mer patternsto their taxon labels. For example, if a 5-mer ”AACTG”can only be found in the E.coli bacteria sequence, an entrythat maps ”AACTG” to E.coli is stored. At run time, k-mer matching algorithms slide a window of size k across thequery sequence, and for each resulting k-mer, they attempt toretrieve the associated taxon label from the database. Functionquery kmer in line 6 is repeatedly called to search each k-mer in the database. If the query k-mer exists in the database(k-mer hit), its taxon label (payload) is retrieved, otherwisewe move on and compare the next k-mer in the query. Onceall k-mers in a query are processed, the taxon labels of thematched k-mers are used to make a final decision on theoriginating organism for the query sequence. A popular choiceis to keep a counter for each retrieved taxon label, and thetaxon label with the most hits is used to classify the querysequence. See Figure 3 for example. The reference k-mer setitself can be implemented in a number of ways. CLARK [6]and LMAT [7] leverage a hash table, with the k-mer patternas the key and the taxon label as the value. Kraken [3] usesa more sophisticated data structure that is a hybrid betweena hash table and a sorted list, in which k-mers that share thesame “signature” are put into the same hash bucket, which isthen looked up using binary search. The assumption here isthat two adjacent k-mers within a query sequence are likely toshare the same “signature”, since they overlap by (k-1) bases,and are thereby likely to get indexed into the same bucket. Intheory, this improves the cache locality over purely hash tableor sorted list approaches, since matching the first query k-meroften brings the bucket to the cache which will be used for thesubsequent query k-mers. As we note below, even with thisoptimization, cache performance remains poor.
Memory Is the Bottleneck for K-mer Matching. Real-world k-mer matching applications expose limited cache lo-cality. For sequence classifiers that store reference k-mers ina hash table, accessing a hash table generates a large numberof cache misses due to the linked list traversal or repeatedhashes (to resolve hash collision). While a hash table/sortedlist hybrid can provide better locality, since the k-mer bucketcan be fetched into the cache from the previous k-mer lookup,using Kraken and its supplied datasets, we discover thatonly 8% of consecutive k-mers index into the same bucket,resulting in new buckets fetched repeatedly from memory
Query Sequence
......
3Taxon iTaxon jTaxon kTaxon l......
2
1
Classify the query sequence
K-m
ers
K-mer DBAssign taxon ID to each k-mer by searching the DB
Count the number of hits for each k-mer
4
Taxon IDCounter 1 5 3 4
Taxon i Taxon j Taxon k Taxon l
Fig. 3: Illustration of CLARK [6], a state-of-the-art k-mermatching based metagenomics tool. A taxon label is aformal scientific name to identify bacterial, fungi, virus,and other species.
to serve requests. k-mer matching also benefits from finer-grained memory access—k-mer records are typically around12 bytes [3], while each memory access retrieves a cache lineof data, which usually serves only one request due to poorlocality, resulting in waste of bandwidth and energy. Finally,computational intensity of k-mer matching is too little to maskextended data access latency. Using CLARK (Figure 3) as anexample, we find that while retrieving k-mers from a databasetakes many cycles due to cache misses, updating counters formatched k-mers is trivially inexpensive, amplifying the effectsof the memory wall [22].
III. MOTIVATION AND KEY IDEAS
In this section, we address the main challenge of designingin-situ k-mer matching accelerators, namely integrating logicinto DRAM dies with low hardware overhead. We proposethree separate Sieve designs to combat this issue. We thenidentify the key limitations of prior in-situ work when adaptedfor k-mer matching and motivate our novel data layout andpattern matching mechanisms. Finally, we introduce an EarlyTermination Mechanism (ETM) to further optimize Sieve byexploiting characteristics of real-world sequence datasets.
DRAM Overhead Concerns. While in-situ acceleratorscan provide dramatic performance gains for memory-intensiveapplications, building them with reasonable area overhead isdifficult [19], [21]. The sense amplifiers in row buffers arelaid out in a pitch-matched manner, and the DRAM layout iscarefully optimized to provide high storage density, and fittingadditional logic into the row buffer in a minimally invasiveway is non-trivial. Moreover, since the number of metal layersof a DRAM process is substantially smaller than that of thelogic process, building complex logic with a DRAM processincurs significant interconnect overhead [19], [21].
We design a set of core k-mer matching operations for Sieveusing simple Boolean logic. Sieve has very little hardwareoverhead compared to other PIM architectures, because k-mer matching, which is mainly accomplished by exact patternmatching, can be supported by a minimal set of Boolean logic.
Trade-offs of Different Sieve Designs. To explore opti-mal Sieve designs, we compare the placement of custom k-mer matching logic at three different levels in the DRAMhierarchy: from the I/O interface of the DRAM chips (SieveType-1) to the local row buffer of each subarray (Sieve Type-
RResultFig. 4: K-mer matching in existing in-situ acceleratorsusing Triple-row Activation and horizontal data layout.
AATCT
AACAA
GCTCG
AATAA
TGTCG
AACCG
GAGCC
ACCCT
AGTCT
AACTC
CGATC
AATCC
AATGG
ATCAG
TATGG
CCATT
AATCG
ATGCG
TGGCG
TCATC
AQBase
Row Buffer:
Single-RowActivation
~ 50 ns
Fig. 5: K-mer matching in Sieve using Single-Row Activa-tion and vertical data layout.
3), and Type-2 as the middle ground where several subarraysshare one k-mer matching unit. Recall that a DRAM bank’stransistor layout is highly optimized for storage, and insertingextra logic, however minimal, requires significant redesigneffort. Type-1, illustrated in Figure 12, keeps the bank layoutintact, and thus is the least intrusive design. However, it suffersfrom the lowest parallelism and the highest latency, becausethe comparison is restricted to a column of bits rather thanthe entire row. Sieve Type-2 increases parallelism and energyefficiency over Type-1 by accessing a row of bits. Type-3leverages subarray-level parallelism (SALP) [28], providingthe highest performance potential, but it comes at the cost ofthe highest design complexity and hardware overhead.
Novel Data Layout and Pattern Matching Mechanism.We show that our column-wise k-mer data layout and row-wise matching mechanism, combined with early terminationoutperforms prior in-situ accelerators that rely on multi-rowactivation and conventional row-wise mapping. The majorityof the k-mer matching workload is exact pattern matching,which can be performed using bulk bitwise XNOR betweentwo operand DRAM rows. The prior arts such as Ambit andDRISA implement XNOR operation by first ANDing two rowsalong with a third control row (populated with 1s or 0s),and send the results to an additional logic. In the followinganalysis, we only consider the timing delay of the ANDoperation to give advantage to the previous in-situ PIM work.Ambit [20] is used as a baseline. Both Ambit and 1T1C-based DRISA [19] are inspired by the same work [29] forin-situ AND procedure. Thus, their performance for k-merpattern matching is similar. Ambit performs bulk bitwise ANDin reserved DRAM rows (see Figure 4). Assuming a DNAbase is encoded with two bits (by NCBI standard [30]), acommon k value of 31, and a typical DRAM row width of8192 bits, then each row fits 128 k-mer patterns if k-mersare stored in a row-wise manner. To search a query against agroup of references, Ambit first copies 128 reference patternsfrom the data region to RRef. It then makes 128 copies ofthe same query in RQuery. Since the target operation is AND,the control row (RCtrl) is populated with 0s (copied from a
preset row). Next, a triple-row activation is performed on RRef,RQuery, and RCtrl. Finally, the result bits are copied to anotherrow RResult. One row-wide AND takes 8 row activations and4 precharge commands from setting up to completion, whichis 8× tRAS+4× tRP =∼ 340ns for a typical DRAM chip.
In contrast to these approaches, ComputeDRAM [31] en-ables in-memory computation in commodity DRAMs, withoutthe need for integrating any additional circuitry. The key to thisapproach is the fact that issuing a constraint-violating sequenceof DRAM commands in rapid succession leaves multiple rowsopen simultaneously, allowing row-wide copy, logical AND,and logical OR operations to be performed via bit line chargesharing, essentially free of hardware cost.
While all of these approaches can be leveraged to performk-mer matching, our analysis suggests that significant gainsin performance and energy efficiency can be achieved by em-ploying the column-major approach we propose in this work,that not only eliminates the need for multi-row activation, butalso enables a synergistic early termination mechanism thatinhibits further row activations upon finding a match.
More specifically, Sieve does not compare a full-lengthquery k-mer against a set of full-length reference k-mers atonce. Instead, it compares a query with a more extensive set ofreferences in a shorter time window (1×tRAS+1×tRP =∼50ns), but progresses only one bit at a time (see Figure5). Reference bits in Sieve are laid out column-wise, alongbitlines. Thus, a single row activation transfers 8K bits intothe matchers embedded in row buffers for comparison. Eachmatcher has a one-bit latch to keep track of the matchingresult. The next row is activated, and a new batch of referencebits is compared, until ETM (introduced next) interrupts whenall latches return zero.
Processing only one bit at a time does not hurt Sieve’sperformance, because it leverages parallelism across the rows;i.e., it performs 8K comparisons at once. The vertical datalayout greatly expands the initial search space (128 referencek-mers to 8192 reference k-mers), and our early terminationmechanism (ETM) quickly eliminates most of the candidatesafter just a few row activations. Besides the latency reductionfor each row-wide pattern matching by adopting single-rowactivation (∼340 ns to ∼50 ns), Sieve also reduces activationenergy, since raising each additional wordline increases theactivation energy by 22% [20]. Thus, even if the same datamapping strategy is applied, the multi-row activation-basedapproach is still slower and less energy efficient than Sievesimply because of the internal data movement. Note that theinternal data movements associated with multi-row activationis unavoidable, because the operand rows have to be copiedto the designated area. Furthermore, arbitrarily activating threerows inside the DRAM requires a prohibitively large decoder(possibly over 200% area overhead [19]), and activating morethan one row could potentially destroy the original values.
The Motivation for Early Termination.Activating con-secutive rows in the same bank results in highly unfavorableDRAM access patterns that are characterized by long delays(due to more row cycles) and high energy costs (row opening
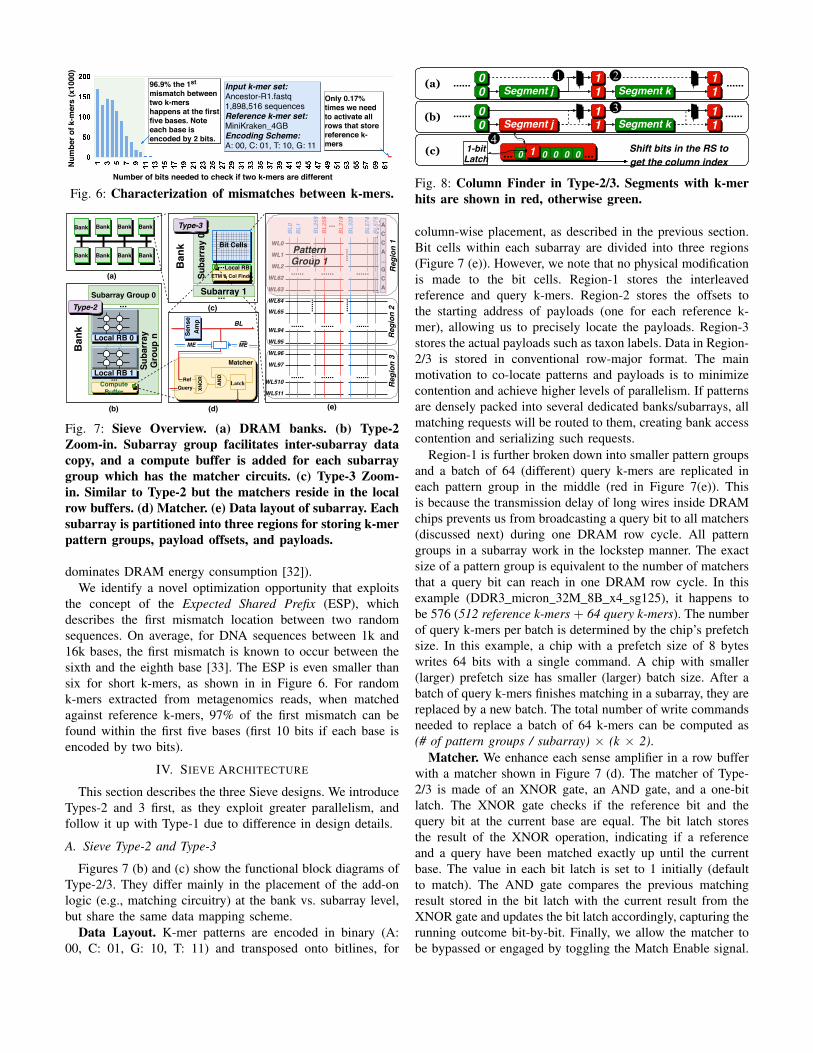
96.9% the 1stmismatch betweentwo k-mershappens at the firstfive bases. Noteeach base isencoded by 2 bits.
Only 0.17%times we needto activate allrows that storereference k-mers
Number of bits needed to check if two k-mers are different
Fig. 6: Characterization of mismatches between k-mers.Su
barr
ay 0
...Bit Cells
(d) (e)
ME
BL
Sense
Amp
Matcher
LatchAN
D
QueryRef
XNO
R
Type-3
Local RB...
ME
ETM & Col Findr
WL0
WL1
WL2
BL0
BL1 BL255
BL256
WL62
WL63
BL319
BL320
BL574
BL575
Reg
ion
1
...... ...... ......
......
......
Reg
ion
2R
egio
n 3
WL64
WL65
WL94
WL95
...... ...... ......
WL96
WL97
......
......
ACCA...GCA
WL510
WL511
...... ...... ......
...
PatternGroup 1
...
Local RB 0
Local RB 1ComputeBuffer
...
Suba
rray
Gro
up n
Subarray Group 0 Subarray 1...
Bank
Bank
Type-2
Bank Bank Bank Bank
Bank Bank Bank Bank
(a)
(b)
(c)
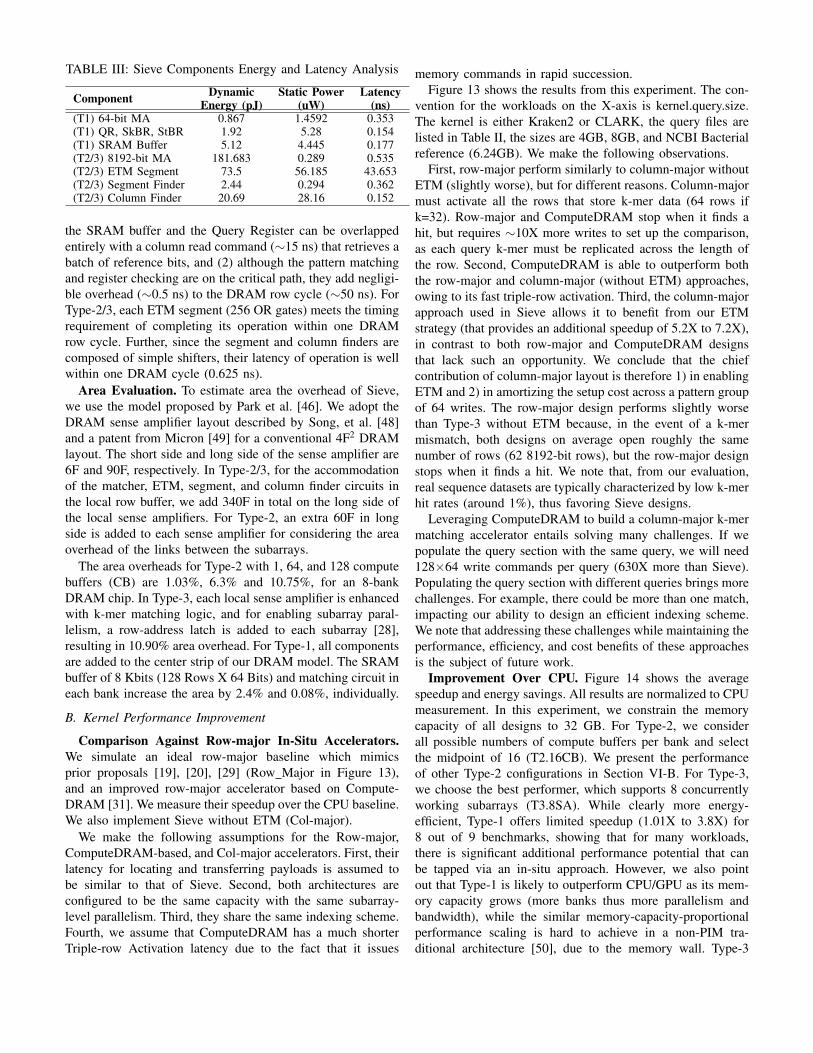
Fig. 7: Sieve Overview. (a) DRAM banks. (b) Type-2Zoom-in. Subarray group facilitates inter-subarray datacopy, and a compute buffer is added for each subarraygroup which has the matcher circuits. (c) Type-3 Zoom-in. Similar to Type-2 but the matchers reside in the localrow buffers. (d) Matcher. (e) Data layout of subarray. Eachsubarray is partitioned into three regions for storing k-merpattern groups, payload offsets, and payloads.
dominates DRAM energy consumption [32]).We identify a novel optimization opportunity that exploits
the concept of the Expected Shared Prefix (ESP), whichdescribes the first mismatch location between two randomsequences. On average, for DNA sequences between 1k and16k bases, the first mismatch is known to occur between thesixth and the eighth base [33]. The ESP is even smaller thansix for short k-mers, as shown in in Figure 6. For randomk-mers extracted from metagenomics reads, when matchedagainst reference k-mers, 97% of the first mismatch can befound within the first five bases (first 10 bits if each base isencoded by two bits).
IV. SIEVE ARCHITECTURE
This section describes the three Sieve designs. We introduceTypes-2 and 3 first, as they exploit greater parallelism, andfollow it up with Type-1 due to difference in design details.
A. Sieve Type-2 and Type-3
Figures 7 (b) and (c) show the functional block diagrams ofType-2/3. They differ mainly in the placement of the add-onlogic (e.g., matching circuitry) at the bank vs. subarray level,but share the same data mapping scheme.
Data Layout. K-mer patterns are encoded in binary (A:00, C: 01, G: 10, T: 11) and transposed onto bitlines, for
0 01 0 0... ... Shift bits in the RS toget the column index
4
Segment j 11
00
Segment k 11 ......1 2
1-bitLatch
(a)
0
Segment j 11
00
Segment k 11 ......3
......
(b) ......
(c)
Fig. 8: Column Finder in Type-2/3. Segments with k-merhits are shown in red, otherwise green.
column-wise placement, as described in the previous section.Bit cells within each subarray are divided into three regions(Figure 7 (e)). However, we note that no physical modificationis made to the bit cells. Region-1 stores the interleavedreference and query k-mers. Region-2 stores the offsets tothe starting address of payloads (one for each reference k-mer), allowing us to precisely locate the payloads. Region-3stores the actual payloads such as taxon labels. Data in Region-2/3 is stored in conventional row-major format. The mainmotivation to co-locate patterns and payloads is to minimizecontention and achieve higher levels of parallelism. If patternsare densely packed into several dedicated banks/subarrays, allmatching requests will be routed to them, creating bank accesscontention and serializing such requests.
Region-1 is further broken down into smaller pattern groupsand a batch of 64 (different) query k-mers are replicated ineach pattern group in the middle (red in Figure 7(e)). Thisis because the transmission delay of long wires inside DRAMchips prevents us from broadcasting a query bit to all matchers(discussed next) during one DRAM row cycle. All patterngroups in a subarray work in the lockstep manner. The exactsize of a pattern group is equivalent to the number of matchersthat a query bit can reach in one DRAM row cycle. In thisexample (DDR3 micron 32M 8B x4 sg125), it happens tobe 576 (512 reference k-mers + 64 query k-mers). The numberof query k-mers per batch is determined by the chip’s prefetchsize. In this example, a chip with a prefetch size of 8 byteswrites 64 bits with a single command. A chip with smaller(larger) prefetch size has smaller (larger) batch size. After abatch of query k-mers finishes matching in a subarray, they arereplaced by a new batch. The total number of write commandsneeded to replace a batch of 64 k-mers can be computed as(# of pattern groups / subarray) × (k × 2).
Matcher. We enhance each sense amplifier in a row bufferwith a matcher shown in Figure 7 (d). The matcher of Type-2/3 is made of an XNOR gate, an AND gate, and a one-bitlatch. The XNOR gate checks if the reference bit and thequery bit at the current base are equal. The bit latch storesthe result of the XNOR operation, indicating if a referenceand a query have been matched exactly up until the currentbase. The value in each bit latch is set to 1 initially (defaultto match). The AND gate compares the previous matchingresult stored in the bit latch with the current result from theXNOR gate and updates the bit latch accordingly, capturing therunning outcome bit-by-bit. Finally, we allow the matcher tobe bypassed or engaged by toggling the Match Enable signal.
Fig. 10: Type-3 Timing Analysis. WL, SA, and PREindicate latencies associated with raising the wordlines,enabling sense amplifiers and precharging the rows. (a)ETM and matchers operations overlap with row opening.(b) ETM is on the critical path only when there is a hit,as it needs extra cycles to identify the hit. Then the BSRsare shifted, followed by a copy into the RS. CF operatesin parallel with row opening and ETM for the next k-mer.
When a row is opened, both query and reference bits aresent to sense amplifiers. A subarray controller [19] (sCtrl)then selects which query to process among the 64 queriesin the subarray. Each pattern group has a 1-bit shared busconnecting all matchers. The selected query bit is distributedto all matchers in a pattern group through this shared bus.
Early Termination Module (ETM). The ETM interruptsfurther row activation by checking if the entire row of latchesis storing zeros. The k-mer matching process continues if atleast one latch stores 1. The natural way is to OR the wholerow of latches. However, the challenge of this approach is thateach OR gate adds to the latency, and during one DRAM rowcycle, only a small fraction of result latches can propagate theirresults through OR gates. We propose a solution that breaksthe row of latches into segments and propagates partial resultsin a pipelined fashion. (shown in Figure 9). One segmentregister (SR) is inserted for every 256 latches to implement thepipeline. During one DRAM row cycle, each segment takesthe value from the previous SR, ORs it with all its latches,and outputs the value to the next SR. Notice that in Figure 9,although at row cycle 3, all latches store zeros, the last SRstill holds 1. An extra cycle is needed to flush the result
Column Finder (CF). Unless interrupted by the ETM,the row activation continues until all bases of a query arechecked. If a query is previously matched to a reference, one
and only one latch in a row buffer stores one. The ColumnFinder identifies the column (bitline) that is connected to thatlatch. The column numbers are needed to retrieve offsets,and subsequently, payloads. Our solution is to shift a rowof latched bits until we find a one. The challenge of thisapproach is to design a shifter with reasonable hardware costand latency. In the worst case, where the matched column(reference k-mer) is located at the end of the row, the CFneeds to shift an entire row of latched bits. We propose apipelined, two-level shifter solution for CF. Figure 8 illustratesthis. The CF circuits are re-purposed mainly from those of theETM. For each ETM segment, a MUX 1 and a 1-bit BackupSegment Register (BSR) 2 are added (Figure 8 (a)). BSRs andSRs maintain the same values and are updated simultaneouslyduring the ETM operation. Zero in a BSR means that itsassociated segment does not contain a match, and one impliesit does. Further, we add another set of bit latches called theReserved Segment (RS) shown in Figure 8 (c), which includesthe same amount of 1-bit latches and OR gates as a segment.
For Column Finder, the BSRs are first shifted until we finda one, to narrow down the appropriate segment that contains amatch ( 3 in Figure 8 (b)). We then copy this segment over tothe Reserved Segment (RS) where the final round of shiftinghappens 4 . From this point on, all ETM segments are freed tosupport the pattern matching for the next k-mer, while the CFworks in the background to retrieve the column number (seeFigure 10 (b)). The shifting of bits in RS is overlapped withthe matching of the subsequent k-mer. We point out two detailshere. First, after the last row activation for a given query k-merfinishes, ETM takes up to 256 DRAM row cycles to flush thepipeline in the worst case, when the one is at the very end.During this time, no new row activation is issued, and the CFoperation is stalled until ETM completes. Second, note thateach k-mer hit takes up to 4800 DRAM cycles, while the CFoperation takes up to 1032 DRAM cycles in the worst-casescenario. Therefore, we observe no contention at the CF, evenwhen there are two consecutive hits in the same subarray.
Sieve Type-2. While Type-2 retains most of the high-leveldesign from Type-3 (ETM, data mapping, matching circuits,etc.), it differs in one key aspect – instead of integrating logicto all subarrays at the local row buffer level, logic is addedto a subarray group – a subset of adjacent subarrays within abank (e.g., 1/2, 1/4, 1/8 of subarrays) connected through highbandwidth links (isolation transistors). Each subarray group isequipped with a compute buffer, which retains much of thecapabilities (k-mer matching, ETM, and column finding) of alocal row buffer in Type-3 without its sense amplifiers. Unliketype-3, where k-mer matching is performed locally at eachindividual subarray, Type-2 processes k-mer matching insidethe compute buffer regardless of the target subarray query k-mers get dispatched to. This involves transferring a row of bitsacross subarrays to reach the compute buffer at the bottom ofthe subarray group. To enable fast row copy across subarrays,we leverage LISA [34], albeit adapted to the folded-bitlinearchitecture that Sieve is built upon. We validate the feasibilityof our design with a detailed circuit-level SPICE simulation.
Compute Buffer
Local RB 1
Local RB 0
Local RB 1
Local RB 0
Local RB 1
Local RB 0
Compute Buffer
Compute Buffer
Local RB 1
Local RB 0
Compute Buffer
(a) (b)
(c) (d)
tRAS 0 tSA1
tPRE0
ISO-0Disable
ISO-0Enable
t
tSA-0Enable
HopDelayCompute
Buffer
ISO-0
ISO-0
ISO-0
ISO-0
Fig. 11: Row-wide data copy across subarrays.
Figure 11 illustrates the process of transferring a row fromthe source subarray to its compute buffer – (a) the DRAM rowin the subarray 0 is activated and the data is latched onto itslocal sense amplifiers, (b) when the bitlines of subarray 0 arefully driven, the links between the subarray 0 and subarray1 are enabled. Due to charge sharing between the bitlines ofsubarrays 0 and 1, the local sense amplifiers in the subarray 1senses the voltage difference between the bitlines and amplifiesit further, as a result of which, (c) local sense amplifiers in bothsubarrays 0 and 1 start driving their bitlines to the same voltagelevels, and finally, (d) when both sets of bitlines in subarrays0 and 1 reach their fully driven states, the isolation transistorsbetween them are disconnected and the local sense amplifiersin the subarray 0 are precharged. The process is repeated untilthe data reaches the computed buffer. Note that – (1) onlytwo sets of local sense amplifiers are enabled at any time in abank, and (2) as validated in our Spice simulation, the latencyof activating the subsequent sense amplifiers (tSA in Figure11 is much smaller (∼ 8X) than activating the ones of thesource subarray (tRAS). The latency for one row to cross asubarray (except for the first one) is referred to as ”hop delay”which consists of enabling the isolation transistors (link) andthe activation of the sense amplifiers.
K-mer Matching Walkthrough. We use Type-3 as anexample to illustrate the k-mer matching process. Once a rowis selected for activation, both the query and the referencebits are sent to the local row buffer for comparison using themechanisms described above. The ETM checks all segmentsand propagates the values of Segment Registers (SRs) todetermine if a match is found.Once a match is found, thepayload associated with that k-mer pattern is retrieved asfollows. The CF first determines the segment number byshifting all BSRs. It then gets the column index by shifting all1-bit latches in that segment until the one is found. The columnnumber is calculated as segment number × (# of columns /segment) + column index and sent to subarray controller toindex into the payload address offsets.
B. Sieve Type-1
Sieve Type-1 is not a quintessential in-situ architecture,due to the lack of processing unit embedded in row buffers.However, Type-1 preserves the overall high-level ideas, suchas the data layout, ETM, and the matching unit. In addition,Type-1 is the least intrusive implementation of Sieve because
Batch 3 Result Bits
0000001101100...010
Batch 1 Result Bits
......
64 bits
128
entr
ies
Batch 2 Result Bits
...
64-bit Query Reg
Con
trol
Logi
c
W b
atch
resu
lt
0 0 0 ...128-bit skip bits reg
1 0
...
...
...
...
...
...
......
Row
Dec
oder
Batch 2
...
000...1
8192 bitsColumn Decoder
XNOR AND
R queryR ref Matcher
SRA
M B
uffe
r
[15:
0] ro
w_a
ddr
[6:0
] col_add
r
Matcher Array
7-bit start batch reg
1 2
2
2
3
3
R result
Fig. 12: Sieve Type-1. A query k-mer is sent to the QueryRegister, and a row activation is issued. 1. The controllerlogic uses the column address to select a batch and indexesinto the SRAM Buffer to get the batch result bits entry. 2:The query bit, the reference bits, and the result bits aresent to the Matcher Array. 3: Matchers write back to theresult bits entry stored in the SRAM Buffer.
it does not change the physical layout of DRAM banks. Thebank I/O width is 64 bits, and each row is 8192 bits. Thus,a row is divided into 128 batches. A batch is a set of bitsretrieved by a DRAM read burst of a read command. Batchsize varies depending on the column width, which can be 32,64, or 128 bits. Next, we introduce each component of Type-1.
SRAM Buffer (SB). SB stores the match result bits,organized in a 2D array. The number of entries is equal tothe number of batches, and the entry width is the batch size.Before matching, all batch result bits are preset to one, andare updated as the matching progresses, again capturing therunning match outcome. Figure 12 highlights the result ofbatch two, where zero indicates a mismatch.
Matcher Array (MA). MA consists of 64 matching units.It compares a query bit with the reference bit using an XNORgate, and updates (writes back) the result bit by ANDing thematch result bit stored in SB with the output from XNOR.
Skip Bits Register (SkBR). SkBR is used for ETM. Itcontains one bit for each batch indicating if we need to processthe current batch. All bits in SkBR are preset to one. Asthe matching progresses, more and more bits in SkBR is setto zero, meaning more and more batches will be skipped.Without SkBR, each row activation is followed by 128 batchcomparisons. Since most comparisons result in mismatches,SkBR leads to significant energy and latency reduction.
Start Batch Register (StBR). StBR reduces processingtime further. Due to the ETM, Type-1 checks the skip bitsto find proper batches to send to the MA. The search time isone DRAM cycle per skip bit. In the worst case where only thelast batch is valid, 127 DRAM cycles are wasted to check allthe previous skip bits. With the help of the StBR, whose valuepoints to the first batch that needs to be processed, Type-1 canquickly determine the first batch to open.
Column Finder and Payload Retrieval. The control logicfirst checks the skip bits to locate the batches that contain aone, given the one-to-one mapping between batches and skipbits. A small shifter is applied to get the index of the matchedcolumn in the batch. The column number is calculated as(batch index) * (batch size) + (column index), and is thenused by the control logic to get offsets and payload.
C. System Integration
We consider both Dual-Inline Memory Module (DIMM),and PCIe form factors for integrating Sieve into a host. WhilePCIe incurs extra communication overhead due to packetgeneration, DIMM suffers from limited power supply. Atypical DDR4 DIMM provides around 0.37 Watt/GB [35] ofpower delivery and 25 GB/s of bandwidth, which is sufficientfor Type-1. To satisfy the bandwidth and power requirement,Type-2 needs at least PCIe 3.0 with 8 lanes, and Type-3 needsat least PCIe 4.0 with 16 lanes.
We use a 32 GB Type-2 Sieve to illustrate how Sievecommunicates with the host using a PCIe interconnect. UnlikeType-1, which communicates with the host on individualk-mer requests, Type-2/3 uses a packet-based protocol thatdelivers hundreds of k-mer requests per PCIe packet. A PCIeType-2/3 accelerator maintains a (PCIe Input Queue) and a(PCIe Out Queue) for sending/receiving PCIe packets, and aresponse ready queue (RRQ) to hold serviced k-mer requests.The CPU scans the query sequences to generate k-mers, andfor each k-mer, it makes a 12-byte request that containsthe pattern, sequence ID, destination subarray ID, and otherheader information. Each PCIe packet contains 340 requests,assuming 4 KB PCIe packet payload size. Each Sieve bankbuffers 64 requests. To fully saturate the capacity of a 32 GBSieve, the depth of the PCIe queue is set to 24 (24 PCIepackets × 340 requests / packet ≈ 16 ranks × 8 banks / rank× 64 requests / bank). Sieve removes the PCIe packets fromPCIe Input Queue, unpacks them, and distributes requests tothe target banks. A finished request gets moved to the RRQ.Once the RRQ is full, a batch of PCIe packets is moved tothe PCIe Out Queue. Sieve sends an interrupt to the CPU ifthe packets are waiting in the PCIe Out Queue or if there areempty slots in the PCIe Input Queue.
The entire space of Sieve is memory-mapped to host asa noncacheable memory region, avoiding virtual memorytranslation and cache coherence management. Regardless ofconfiguration (DIMM or PCIe), a program interacts with theSieve device through the Sieve API, which supports callsto transpose a conventional database into the format neededfor column-wise access (this can be stored for later use andis thus a one-time cost); load a database into the Sievedevice; and make k-mer queries. The API implementationrequires a user-level library and an associated kernel moduleor driver to interface to the Sieve hardware. The exact API andimplementation are a subject to future work. K-mer databasesare relatively stable over time, so once a database is loadedinto the Sieve device, it can be used for long periods of time,until the user wishes to change a database. The same databases
are often standard within the genomics community, high reusecan be expected to amortize the cost of database loading.
D. K-mer to Subarray Mapping
Without an appropriate mapping scheme, each query needsto be broadcast across all regions of the accelerator. A naı̈vemapping scheme would involve looking up an index tablethat maps queries to banks (Type-1) or subarrays (Type-2/3).Such a scheme would quickly stop scaling, as the size ofsuch an index table increases exponentially with the lengthof a k-mer. We design an efficient and a scalable indexingscheme, wherein the size of the index table scales linearlywith the main memory capacity rather than the length of a k-mer. More specifically, the reference k-mers in each subarrayare sorted alphanumerically from left to right, and then eachentry in our index table maintains an 8-byte subarray ID alongwith the integer values of the first and the last k-mers at therespective subarray (identified by the index). Upon receivinga matching request, Sieve first converts the query k-mer to itsinteger representation, and consults the index table to select thebank/subarray that contains a match. While Type-2/3 exploitdifferent levels of parallelism, they share the same indexingscheme, i.e., if Type-2 only provides the bank address to ourindexing scheme, a query needs to be checked against everysubarray in that bank. The size of the index table stays wellunder 2 MB even for Type-2/3 with 500 GB of capacity, whichis reasonable for a dedicated bioinformatics workstation.
E. Sieve: Putting it all together
For Type-2/3, the host reads the input query sequences andextracts k-mer patterns. For each k-mer, the k-mer to subarrayindex table is consulted to locate the destination subarray, anda k-mer request is made, as described in Section IV-C. Anumber of k-mer requests that need to be sent to the samesubarray is grouped into one “batch”. The exact number of k-mer requests per batch is equal to the number of query k-mersin a pattern group (64 in our example). These query batchesare placed in a buffer, ready to be shipped to the PCIe devicebuffer by DMA. PCIe bundles several such batches into onePCIe packet (also described in Section IV-C) sent to the Sievedevice. Sieve dispatches each batch of query k-mers to thedestination subarray, and replaces an already processed queryk-mer batch with a new (to-be-processed) batch.
Individual k-mer requests in the same batch potentiallycomplete at different times as (1) they get issued out-of-order (as soon as their bank/subarray becomes available), and(2) each request may involve checking a different number ofrows. Thus, response packets may arrive out-of-order at thehost, where their sequence IDs and payloads are examined, aspart of a post-processing step. Upon completion of all k-merrequests for a given sequence, the accumulated payloads arefed into a classification step, as illustrated in Figure 2. Notethat there is no additional reordering step required at the hostend as the accumulated payloads are typically used to build ahistogram of taxons for a given DNA sequence.
TABLE I: Workstation Configuration
CPU Model Intel(R) Xeon(R) E5-2658 v4Core/ Thread/ Frequency 14/ 24/ 2.30 - 2.80 (GHz)L1 (KB)/L2 (KB)/L3 (MB) $ 32 / 256 / 35Main Memory DDR4-2400MHzMemory Organization 32GB / 2 Channels / 2 RanksGPU Model Pascal NVIDIA Titan X
Workloads. We use Kraken2 [36] and CLARK [6] for theCPU baseline, and cuCLARK [37] for the GPU baseline. Weuse MiniKraken 4GB (4GB), MiniKraken 8GB (8GB), NCBIBacteria (2785 genomes 6.24GB). The query sequences aresummarized in Table II, and K is set to 31.
Baseline Performance Modeling. We report our worksta-tion configurations in Table I. The GPU baseline is idealizedbecause (1) the energy and latency of data transfer from hostto GPU are not included, and (2) the on-board memory isassumed to always be large enough to avoid running eachquery multiple times. The baseline DRAM energy consump-tion is estimated by feeding memory traces associated withk-mer matching functions, obtained using Hopscotch [38], toDRAMSim2 configured to match our workstation. The CPUenergy is measured using the Intel PMC-power tool [39], thenscaled down by 30% to exclude the interference from othersystem components, and the GPU energy is measured usingNVIDIA Visual Profiler [40] as it is performed in [41] tocharacterise the multi-GPU inference server energy efficiencyand scaled down by 50% to exclude energy spent on coolingand other operations, consistent with the methodology fromDRISA [19].
Circuit-level SPICE Validation. Of all the Sieve com-ponents, only the Matchers are in direct contact with thesense amplifiers’ BLs. In the presence of the Matcher circuit,the load capacitance on the BL is increased. We use SPICEsimulations to confirm that Sieve works reliably. The senseamplifier and matcher circuits are implemented using 45nmPTM transistor models [42]. Because of the relatively smallinput capacitance of the matcher circuit (∼0.2 pf), in com-parison with the BL capacitance (∼22pf), the matcher has anegligible effect on the operation of the sense amplifiers.Wefind that, after the row activation and when the BL voltage isat a safe level to read, the result of the matcher is ready afterless than 1 ns. To validate correct operation of links in Type-2, we use our DRAM circuit model to simulate transfer ofdata between local row buffers of two adjacent subarrays. Inboth simulations, the initial charge of the cell is varied acrossdifferent values to consider the effect of DRAM cell chargevariations. Even in the worst case, the matcher and the link
between two subarrays cause no bit flips or distortions.Energy, Area, and Latency Modeling. We estimate the
power and latency overhead of each Sieve component usingFreePDK45 [43]. Further, we use OpenRAM [44] to modeland synthesize the SRAM buffer in Type-1. We use scalingfactors from Stillmaker, et al. [45] to scale down results to the22nm technology node, and use the planar DRAM area modelproposed by Park, et al. [46] to estimate area overhead.
Modeling Sieve. We assume a pipelined implementationof Sieve, where the host (CPU) performs pre-processing (k-mer generation, driver invocation, and PCIe transfer) and post-processing (accumulation of response payloads for genomesequence classification), while Sieve is responsible for k-mer matching. Our analysis confirms that the latency of thispipeline is limited by k-mer processing on Sieve. In particular,k-mer matching on Sieve is either comparable to (for Type-3)or slower than (for Types-1/2) both pre- and post-processingsteps on the CPU, so the CPU is always able to send enoughk-mer requests to Sieve to keep it fully utilized.
We model the pre- and post-processing steps using thebaseline CPU described in Table I. We treat the classificationstep as a separate pipeline by itself, as (1) the algorithmdiffers for each application, and (2) it is independent ofk-mer matching, which is the primary focus of this work.Thus, we forgo modeling the effort required for genomeclassification and other post k-mer processing. For modelingthe k-mer matching itself, we use a trace-driven, in-housesimulator with a custom DRAMSim2-based front-end. Thesimulator also models PCIe communication overhead, usingstandard PCIe parameters [47]. We use a Micron DDR4 chip(DDR4 4Gb 8B x16) as the building block for Sieve. DRAMparameters are extracted from the same datasheet and modifiedto account for the estimated latency and energy overhead ofmatchers, ETM, column finder, and segment finder.
VI. EXPERIMENTAL RESULTS
A. Energy, Latency, and Area Estimation
Energy Evaluation. Table III summarizes the dynamicenergy and static power of each Sieve component. Type-3incurs additional power consumption for each DRAM row ac-tivation. However, using formula 10a from Micron’s technicaldocumentation [35], we find that Sieve consumes only 6%more energy for each row activation than a regular DRAM,because the area and the load of the extra transistors weintroduce is so small compared to the sense amplifier and thebitline drivers. We further break down this energy overhead tounderstand the effect of the different Sieve components. Wefind that the Matcher Array (MA) and the ETM dominate theenergy consumption, capturing 78.9% and 15.8% of the 6%energy overhead incurred by Sieve, with the energy spent bythe Segment Finder and the Column Finder being negligible(less than 5%). Type-1 adds no overhead on top of the regularDRAM row activation, because no modification is made to therow buffer, and it is less energy-intensive than Type-2/3.
Latency Evaluation. Table III shows the latency of eachSieve component. For Type-1, we assume that (1) accessing
TABLE III: Sieve Components Energy and Latency Analysis
Component DynamicEnergy (pJ)
Static Power(uW)
Latency(ns)
(T1) 64-bit MA 0.867 1.4592 0.353(T1) QR, SkBR, StBR 1.92 5.28 0.154(T1) SRAM Buffer 5.12 4.445 0.177(T2/3) 8192-bit MA 181.683 0.289 0.535(T2/3) ETM Segment 73.5 56.185 43.653(T2/3) Segment Finder 2.44 0.294 0.362(T2/3) Column Finder 20.69 28.16 0.152
the SRAM buffer and the Query Register can be overlappedentirely with a column read command (∼15 ns) that retrieves abatch of reference bits, and (2) although the pattern matchingand register checking are on the critical path, they add negligi-ble overhead (∼0.5 ns) to the DRAM row cycle (∼50 ns). ForType-2/3, each ETM segment (256 OR gates) meets the timingrequirement of completing its operation within one DRAMrow cycle. Further, since the segment and column finders arecomposed of simple shifters, their latency of operation is wellwithin one DRAM cycle (0.625 ns).
Area Evaluation. To estimate area the overhead of Sieve,we use the model proposed by Park et al. [46]. We adopt theDRAM sense amplifier layout described by Song, et al. [48]and a patent from Micron [49] for a conventional 4F2 DRAMlayout. The short side and long side of the sense amplifier are6F and 90F, respectively. In Type-2/3, for the accommodationof the matcher, ETM, segment, and column finder circuits inthe local row buffer, we add 340F in total on the long side ofthe local sense amplifiers. For Type-2, an extra 60F in longside is added to each sense amplifier for considering the areaoverhead of the links between the subarrays.
The area overheads for Type-2 with 1, 64, and 128 computebuffers (CB) are 1.03%, 6.3% and 10.75%, for an 8-bankDRAM chip. In Type-3, each local sense amplifier is enhancedwith k-mer matching logic, and for enabling subarray paral-lelism, a row-address latch is added to each subarray [28],resulting in 10.90% area overhead. For Type-1, all componentsare added to the center strip of our DRAM model. The SRAMbuffer of 8 Kbits (128 Rows X 64 Bits) and matching circuit ineach bank increase the area by 2.4% and 0.08%, individually.
B. Kernel Performance Improvement
Comparison Against Row-major In-Situ Accelerators.We simulate an ideal row-major baseline which mimicsprior proposals [19], [20], [29] (Row Major in Figure 13),and an improved row-major accelerator based on Compute-DRAM [31]. We measure their speedup over the CPU baseline.We also implement Sieve without ETM (Col-major).
We make the following assumptions for the Row-major,ComputeDRAM-based, and Col-major accelerators. First, theirlatency for locating and transferring payloads is assumed tobe similar to that of Sieve. Second, both architectures areconfigured to be the same capacity with the same subarray-level parallelism. Third, they share the same indexing scheme.Fourth, we assume that ComputeDRAM has a much shorterTriple-row Activation latency due to the fact that it issues
memory commands in rapid succession.Figure 13 shows the results from this experiment. The con-
vention for the workloads on the X-axis is kernel.query.size.The kernel is either Kraken2 or CLARK, the query files arelisted in Table II, the sizes are 4GB, 8GB, and NCBI Bacterialreference (6.24GB). We make the following observations.
First, row-major perform similarly to column-major withoutETM (slightly worse), but for different reasons. Column-majormust activate all the rows that store k-mer data (64 rows ifk=32). Row-major and ComputeDRAM stop when it finds ahit, but requires ∼10X more writes to set up the comparison,as each query k-mer must be replicated across the length ofthe row. Second, ComputeDRAM is able to outperform boththe row-major and column-major (without ETM) approaches,owing to its fast triple-row activation. Third, the column-majorapproach used in Sieve allows it to benefit from our ETMstrategy (that provides an additional speedup of 5.2X to 7.2X),in contrast to both row-major and ComputeDRAM designsthat lack such an opportunity. We conclude that the chiefcontribution of column-major layout is therefore 1) in enablingETM and 2) in amortizing the setup cost across a pattern groupof 64 writes. The row-major design performs slightly worsethan Type-3 without ETM because, in the event of a k-mermismatch, both designs on average open roughly the samenumber of rows (62 8192-bit rows), but the row-major designstops when it finds a hit. We note that, from our evaluation,real sequence datasets are typically characterized by low k-merhit rates (around 1%), thus favoring Sieve designs.
Leveraging ComputeDRAM to build a column-major k-mermatching accelerator entails solving many challenges. If wepopulate the query section with the same query, we will need128×64 write commands per query (630X more than Sieve).Populating the query section with different queries brings morechallenges. For example, there could be more than one match,impacting our ability to design an efficient indexing scheme.We note that addressing these challenges while maintaining theperformance, efficiency, and cost benefits of these approachesis the subject of future work.
Improvement Over CPU. Figure 14 shows the averagespeedup and energy savings. All results are normalized to CPUmeasurement. In this experiment, we constrain the memorycapacity of all designs to 32 GB. For Type-2, we considerall possible numbers of compute buffers per bank and selectthe midpoint of 16 (T2.16CB). We present the performanceof other Type-2 configurations in Section VI-B. For Type-3,we choose the best performer, which supports 8 concurrentlyworking subarrays (T3.8SA). While clearly more energy-efficient, Type-1 offers limited speedup (1.01X to 3.8X) for8 out of 9 benchmarks, showing that for many workloads,there is significant additional performance potential that canbe tapped via an in-situ approach. However, we also pointout that Type-1 is likely to outperform CPU/GPU as its mem-ory capacity grows (more banks thus more parallelism andbandwidth), while the similar memory-capacity-proportionalperformance scaling is hard to achieve in a non-PIM tra-ditional architecture [50], due to the memory wall. Type-3
designs offer a speedup and an energy savings of as muchas 404.48X and 55.89X respectively, over the CPU baseline.Note that this is in comparison to a Type-2 design that offersa speedup of 55.49X and an energy reduction of 28.11X overthe CPU baseline, clearly showcasing the substantial benefitsthat can be realized by exploiting finer-grained parallelism atthe subarray-level. We also find that Sieve is sensitive to thecharacteristics of the application. For example, the C.MT.BGbenchmark performs worse than C.ST.BG benchmark as thenumber of k-mer matches for C.MT.BG is 3.28X higherthan C.ST.BG benchmark, resulting in more row activations,increasing the overall query turnaround time and energy.Furthermore, recall from Section IV that our early terminationmechanism interrupts row activations as soon as we detect amismatch, minimizing the overall turnaround time and energyconsumption for workloads with fewer k-mer matches.
Improvement Over GPU. Figure 15 shows the speedupand energy savings of various Sieve designs (32 GB) overthe GPU baselines. Type-1 is 3X to 5X slower than theGPU but more energy efficient, and Type-2 is only modestlyfaster (2.59x to 9.43x). However, as the memory capacityof Sieve and dataset size increase, Type-1/2 are likely tooutperform the GPU unless GPU memory capacity scalesas fast, because all reference datasets can fit onto Sieve,avoiding the repetitive data transfer from host memory to GPUboard. Type-3 dramatically outperforms the GPU, because itleverages subarray-level parallelism. Type-3 offers speedupsof 33.13X–55.0X and energy savings of 83.77X–141.15x.
Effect of Increased DRAM Bandwidth. Simply increasingbandwidth to DRAM in the CPU and GPU baselines isnot sufficient to address the performance bottleneck in k-mer matching, because we find that it is not bottleneckedby bandwidth. While it is memory-intensive (high percentageof loads in the ROB), memory bandwidth is underutilized
0
10
20
30
1SA 2SA 4SA 8SA 16SA 32SA 64SA 128SA
Cycl
es (m
illio
ns)
T3.4GB T3.8GB T3.16GB T3.32GB
Fig. 16: Average cycles spent to process CPU benchmarks.
because each MSHR is unable to serve multiple loads andthe available MSHRs are quickly depleted, stalling subsequentloads in the ROB and preventing the bandwidth from beingfully saturated. Even if we overprovision those Broadwellcores with enough MSHRs to sustain all outstanding memoryaccesses, and all loads are served concurrently with a memorylatency of 40 ns to reach the same level of throughput as Type-3, the workstation has to be equipped with over 215 cores, notonly resulting in a substantial increase in power consumption,but a considerable wastage in DRAM bandwidth as only asmall portion of the retrieved cache line is useful. cuCLARKis highly optimized, so we suspect that GPUs are constrainedby similar bottlenecks as CPUs, although we have not yetpinpointed the exact set of microarchitectural structures.
C. Sensitivity Analysis
Number of Subarrays per Bank. We analyze the impact ofsubarray-level parallelism on performance and energy by com-paring various Type-3 design configurations (see Figure 16) atdifferent memory capacities and number of subarrays per bank.The results are averaged across all benchmarks. Supporting allsubarrays performing k-mer matching simultaneously withoutincreasing the area overhead significantly is not yet feasible,due to power delivery constraints. However, for this experi-ment, we assume this is not an issue. In any case, althoughSieve’s k-mer matching throughput increases with more con-current subarrays, the speedup plateaus after 8 subarrays—probably because most bank-access conflicts can be resolvedby a small number of subarrays [28].
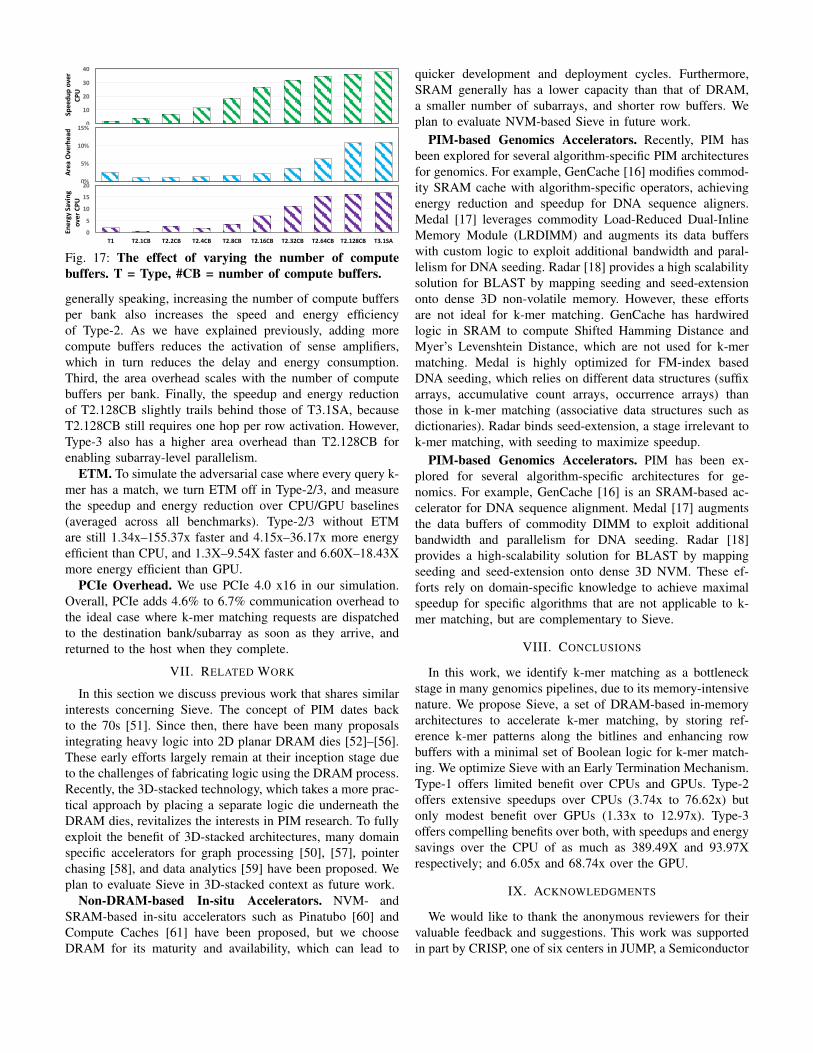
Number of Compute Buffers. We explore theperformance-area tradeoff of Type-2 designs, by varyingthe number of compute buffers (shown in Figure 17). Forreference, we include Type-1 (the left-most bar T1) and Type-3 (the right-most bar T3.1SA) designs without subarray-levelparallelism. The middle eight bars represent Type-2 with1-128 compute buffers per bank. We make the followingobservations. First, Type-2 with one compute buffer is fasterthan Type-1 (1.39X to 1.94X) but not by a large margin.For each row activation, in the worst case, Type-1 has toburst read 128 batches to the matchers, which is similarto T2.1CB where the opened row needs to ”hop” across128 subarrays to reach the compute buffer. Since the hopdelay (∼4ns) is faster than a burst latency (tCCD: 5∼7ns),and both design are equipped with some forms of ETM,T2.1CB is likely to spend less time on data movement thanType-1 in the average case. However, the chain activationof sense amplifiers in Type-2, which relays the row to thecompute buffer, consumes significant energy, making Type-2with sparse compute buffers less energy efficient. Second,
Fig. 17: The effect of varying the number of computebuffers. T = Type, #CB = number of compute buffers.
generally speaking, increasing the number of compute buffersper bank also increases the speed and energy efficiencyof Type-2. As we have explained previously, adding morecompute buffers reduces the activation of sense amplifiers,which in turn reduces the delay and energy consumption.Third, the area overhead scales with the number of computebuffers per bank. Finally, the speedup and energy reductionof T2.128CB slightly trails behind those of T3.1SA, becauseT2.128CB still requires one hop per row activation. However,Type-3 also has a higher area overhead than T2.128CB forenabling subarray-level parallelism.
ETM. To simulate the adversarial case where every query k-mer has a match, we turn ETM off in Type-2/3, and measurethe speedup and energy reduction over CPU/GPU baselines(averaged across all benchmarks). Type-2/3 without ETMare still 1.34x–155.37x faster and 4.15x–36.17x more energyefficient than CPU, and 1.3X–9.54X faster and 6.60X–18.43Xmore energy efficient than GPU.
PCIe Overhead. We use PCIe 4.0 x16 in our simulation.Overall, PCIe adds 4.6% to 6.7% communication overhead tothe ideal case where k-mer matching requests are dispatchedto the destination bank/subarray as soon as they arrive, andreturned to the host when they complete.
VII. RELATED WORK
In this section we discuss previous work that shares similarinterests concerning Sieve. The concept of PIM dates backto the 70s [51]. Since then, there have been many proposalsintegrating heavy logic into 2D planar DRAM dies [52]–[56].These early efforts largely remain at their inception stage dueto the challenges of fabricating logic using the DRAM process.Recently, the 3D-stacked technology, which takes a more prac-tical approach by placing a separate logic die underneath theDRAM dies, revitalizes the interests in PIM research. To fullyexploit the benefit of 3D-stacked architectures, many domainspecific accelerators for graph processing [50], [57], pointerchasing [58], and data analytics [59] have been proposed. Weplan to evaluate Sieve in 3D-stacked context as future work.
Non-DRAM-based In-situ Accelerators. NVM- andSRAM-based in-situ accelerators such as Pinatubo [60] andCompute Caches [61] have been proposed, but we chooseDRAM for its maturity and availability, which can lead to
quicker development and deployment cycles. Furthermore,SRAM generally has a lower capacity than that of DRAM,a smaller number of subarrays, and shorter row buffers. Weplan to evaluate NVM-based Sieve in future work.
PIM-based Genomics Accelerators. Recently, PIM hasbeen explored for several algorithm-specific PIM architecturesfor genomics. For example, GenCache [16] modifies commod-ity SRAM cache with algorithm-specific operators, achievingenergy reduction and speedup for DNA sequence aligners.Medal [17] leverages commodity Load-Reduced Dual-InlineMemory Module (LRDIMM) and augments its data bufferswith custom logic to exploit additional bandwidth and paral-lelism for DNA seeding. Radar [18] provides a high scalabilitysolution for BLAST by mapping seeding and seed-extensiononto dense 3D non-volatile memory. However, these effortsare not ideal for k-mer matching. GenCache has hardwiredlogic in SRAM to compute Shifted Hamming Distance andMyer’s Levenshtein Distance, which are not used for k-mermatching. Medal is highly optimized for FM-index basedDNA seeding, which relies on different data structures (suffixarrays, accumulative count arrays, occurrence arrays) thanthose in k-mer matching (associative data structures such asdictionaries). Radar binds seed-extension, a stage irrelevant tok-mer matching, with seeding to maximize speedup.
PIM-based Genomics Accelerators. PIM has been ex-plored for several algorithm-specific architectures for ge-nomics. For example, GenCache [16] is an SRAM-based ac-celerator for DNA sequence alignment. Medal [17] augmentsthe data buffers of commodity DIMM to exploit additionalbandwidth and parallelism for DNA seeding. Radar [18]provides a high-scalability solution for BLAST by mappingseeding and seed-extension onto dense 3D NVM. These ef-forts rely on domain-specific knowledge to achieve maximalspeedup for specific algorithms that are not applicable to k-mer matching, but are complementary to Sieve.
VIII. CONCLUSIONS
In this work, we identify k-mer matching as a bottleneckstage in many genomics pipelines, due to its memory-intensivenature. We propose Sieve, a set of DRAM-based in-memoryarchitectures to accelerate k-mer matching, by storing ref-erence k-mer patterns along the bitlines and enhancing rowbuffers with a minimal set of Boolean logic for k-mer match-ing. We optimize Sieve with an Early Termination Mechanism.Type-1 offers limited benefit over CPUs and GPUs. Type-2offers extensive speedups over CPUs (3.74x to 76.62x) butonly modest benefit over GPUs (1.33x to 12.97x). Type-3offers compelling benefits over both, with speedups and energysavings over the CPU of as much as 389.49X and 93.97Xrespectively; and 6.05x and 68.74x over the GPU.
IX. ACKNOWLEDGMENTS
We would like to thank the anonymous reviewers for theirvaluable feedback and suggestions. This work was supportedin part by CRISP, one of six centers in JUMP, a Semiconductor
Research Corporation (SRC) program, sponsored by MARCOand DARPA.
REFERENCES
[1] D. Navarro-Gomez, J. Leipzig, L. Shen, M. Lott, A. P. Stassen, D. C.Wallace, J. L. Wiggs, M. J. Falk, M. van Oven, and X. Gai, “Phy-Mer: a novel alignment-free and reference-independent mitochondrialhaplogroup classifier,” Bioinformatics, vol. 31, no. 8, 2015.
[2] Y. Li, T. B. Heavican, N. N. Vellichirammal, J. Iqbal, and C. Guda,“ChimeRScope: a novel alignment-free algorithm for fusion transcriptprediction using paired-end RNA-Seq data.,” Nucleic Acids Res., 2017.
[3] D. E. Wood and S. L. Salzberg, “Kraken: ultrafast metagenomic se-quence classification using exact alignments,” Genome Biology, vol. 15,2014.
[4] F. Breitwieser, D. Baker, and S. L. Salzberg, “KrakenUniq: confident andfast metagenomics classification using unique k-mer counts,” GenomeBiology, vol. 19, 2018.
[5] R. A. Edwards, R. Olson, T. Disz, G. D. Pusch, V. Vonstein, R. Stevens,and R. Overbeek, “Real time metagenomics: using k-mers to annotatemetagenomes.,” Bioinformatics, vol. 28, no. 24, 2012.
[6] T. J. C. Rachid Ounit, Steve Wanamaker and S. Lonardi, “Scal-able metagenomic taxonomy classification using a reference genomedatabase,” BMC Genomics, vol. 16, 2015.
[7] S. K. Ames, D. A. Hysom, S. N. Gardner, G. S. Lloyd, M. B. Gokhale,and J. E. Allen, “Scalable metagenomic taxonomy classification usinga reference genome database,” Bioinformatics, vol. 29, no. 18, 2013.
[8] S. S. Minot, N. Krumm, and N. B. Greenfield, “One Codex: A Sensitiveand Accurate Data Platform for Genomic Microbial Identification,”BioRxiv, 2015.
[9] I. K. J. Anuj Gupta and L. Rishishwar, “stringMLST: a fast k-mer basedtool for multilocus sequence typing,” Bioinformatics, 2017.
[10] R. A. Vialle, F. d. Oliveira Pedrosa, V. A. Weiss, D. Guizelini, J. H.Tibaes, J. N. Marchaukoski, E. M. de Souza, and R. T. Raittz, “RAFTS3:Rapid Alignment-Free Tool for Sequence Similarity Search,” bioRxiv,2016.
[11] “Dna sequencing costs: Data.”[12] G. V. RESEARCH, “Metagenomics market size, share & trends anal-
ysis report by product (sequencing & data analytics), by technology(sequencing, function), by application (environmental), and segmentforecasts, 2018 - 2025.” GRAND VIEW RESEARCH, 2017.
[13] T. S. Rosing, N. Moshiri, and R. Knight, “Acceleration of bioinformaticsworkloads,” DARPA ERI Summit, Jul 2020.
[14] C. L. Ventola, “The antibiotic resistance crisis: part 1: causes andthreats.,” P & T : a peer-reviewed journal for formulary management,vol. 40, no. 4, pp. 277–83, 2015.
[15] S. Altschul, W. Gish, W. Miller, E. Myers, and D. J. Lipman, “Basiclocal alignment search tool,” Journal of Molecular Biology, vol. 215,no. 3, pp. 403–410, 1990.
[16] A. Nag, C. Ramachandra, R. Balasubramonian, R. Stutsman, E. Gi-acomin, H. Kambalasubramanyam, and P.-E. Gaillardon, “GenCache:Leveraging In-Cache Operators for Efficient Sequence Alignment,” inMICRO, 2019.
[17] W. Huangfu, X. Li, S. Li, X. Hu, P. Gu, , and Y. Xie, “MEDAL:Scalable DIMM based Near Data Processing Accelerator for DNASeeding Algorithm,” in MICRO, 2019.
[18] W. Huangfu, S. Li, X. Hu, and Y. Xie, “RADAR: A 3D-reRAM BasedDNA Alignment Accelerator Architecture,” in DAC, 2018.
[19] S. Li, D. Niu, K. T. Malladi, H. Zheng, B. Brennan, and Y. Xie, “DRISA:A DRAM-based Reconfigurable In-Situ Accelerator,” in MICRO, 2017.
[20] V. Seshadri, D. Lee, T. Mullins, H. Hassan, A. Boroumand, J. Kim,M. A. Kozuch, O. Mutlu, P. B. Gibbons, and T. C. Mowry, “Ambit:In-memory Accelerator for Bulk Bitwise Operations Using CommodityDRAM Technology,” in MICRO, 2017.
[21] M. Lenjani, P. Gonzalez, E. Sadredini, S. Li, Y. Xie, A. Akel, S. Eilert,M. R. Stan, and K. Skadron, “Fulcrum: A simplified control andaccess mechanism toward flexible and practical in-situ accelerators,” in2020 IEEE International Symposium on High Performance ComputerArchitecture (HPCA), pp. 556–569, 2020.
[22] W. A. Wulf and S. A. McKee, “Hitting the memory wall: implicationsof the obvious,” ACM SIGARCH computer architecture news, 1995.
[23] R. Balasubramonian, J. Chang, T. Manning, J. H. Moreno, R. Murphy,R. Nair, and S. Swanson, “Near-Data Processing: Insights from aMICRO-46 Workshop,” MICRO, 2014.
[24] R. Sharifi and Z. Navabi, “Online Profiling for Cluster-Specific VariableRate Refreshing in High-Density DRAM Systems,” ETS, 2017.
[25] J. A. Andrzej Zielezinski, Susana Vinga and W. M. Karlowski,“Alignment-free sequence comparison: benefits, applications, and tools,”Genome Biology, vol. 18, 2017.
[26] K. L. A. Stinus Lindgreen and P. P. Gardner, “An evaluation of theaccuracy and speed of metagenome analysis tools,” Scientific Reports,vol. 6, 2016.
[27] S. Flygare, K. Simmon, C. Miller, Y. Qiao, B. Kennedy, T. Di Sera,E. H. Graf, K. D. Tardif, A. Kapusta, S. Rynearson, et al., “Taxonomer:an interactive metagenomics analysis portal for universal pathogen de-tection and host mRNA expression profiling,” Genome Biology, vol. 17,2016.
[28] Y. Kim, V. Seshadri, D. Lee, J. Liu, and O. Mutlu, “A case for exploitingsubarray-level parallelism (SALP) in DRAM,” in ISCA, 2012.
[29] V. Seshadri, K. Hsieh, A. Boroum, D. Lee, M. A. Kozuch, O. Mutlu,P. B. Gibbons, and T. C. Mowry, “Fast Bulk Bitwise AND and OR inDRAM,” CAL, 2015.
[30] A. Jacob, J. Lancaster, J. Buhler, and R. Chamberlain, “FPGA-accelerated seed generation in mercury BLASTP,” in FCCM, 2007.
[31] F. Gao, G. Tziantzioulis, and D. Wentzlaff, “Computedram: In-memorycompute using off-the-shelf drams,” in Proceedings of the 52nd AnnualIEEE/ACM International Symposium on Microarchitecture, MICRO’52, (New York, NY, USA), p. 100–113, Association for ComputingMachinery, 2019.
[32] N. Chatterjee, M. O’Connor, D. Lee, D. R. Johnson, S. W. Keckler,M. Rhu, and W. J. Dally, “Architecting an Energy-Efficient DRAMSystem for GPUs,” in HPCA, 2017.
[33] E. Fernandez, W. Najjar, and S. Lonardi, “String Matching in HardwareUsing the FM-Index,” in FCMM, 2011.
[34] K. K. Chang, P. J. Nair, D. Lee, S. Ghose, M. K. Qureshi, and O. Mutlu,“Low-cost inter-linked subarrays (lisa): Enabling fast inter-subarray datamovement in dram,” in HPCA, 2016.
[35] Micron, “Tn-40-07: Calculating memory power for ddr4 sdram in-troduction.” https://www.micron.com/-/media/client/global/documents/products/technical-note/dram/tn4007\ ddr4\ power\ calculation.pdf,2020.
[36] B. L. Derrick E Wood, Jennifer Lu, “Improved metagenomic analysiswith kraken 2,” Genome Biology, vol. 20, 2019.
[37] M. A. Kobus Robin, Hundt Christian and B. Schmidt, “Acceleratingmetagenomic read classification on CUDA-enabled GPUs,” BMC Bioin-formatics, 2009.
[38] A. Ahmed and K. Skadron, “Hopscotch: A Micro-benchmark Suite forMemory Performance Evaluation,” in MEMSYS, 2019.
profiler.[41] A. Jahanshahi, H. Sabzi, C. Lau, and D. Wong, “GPU-NEST: Character-
izing Energy Efficiency of Multi-GPU Inference Servers,” CAL, 2020.[42] “Predictive Technology Model (PTM).” http://ptm.asu.edu/.[43] “FreePDK45: 45nm variant of the FreePDK Process Design Kit.” https:
//www.eda.ncsu.edu/wiki/FreePDK45:Contents.[44] M. R. Guthaus, J. E. Stine, S. Ataei, Brian Chen, Bin Wu, and M. Sarwar,
“OpenRAM: An open-source memory compiler,” in ICCAD, 2016.[45] A. Stillmaker, Z. Xiao, and B. M. Baas, “Toward more accurate scaling
estimates of cmos circuits from 180 nm to 22 nm,” 2012.[46] J. B. Park, W. R. Davis, and P. D. Franzon, “3D-DATE: A Circuit-Level
Three-Dimensional DRAM Area, Timing, and Energy Model,” IEEETransactions on Circuits and Systems, 2019.
[47] “PCI-E Specification.” https://pcisig.com/specifications.[48] K. Song, J. Kim, J. Yoon, S. Kim, H. Kim, H. Chung, H. Kim, K. Kim,
H. Park, H. C. Kang, N. Tak, D. Park, W. Kim, Y. Lee, Y. C. Oh, G. Jin,J. Yoo, D. Park, K. Oh, C. Kim, and Y. Jun, “A 31 ns Random CycleVCAT-Based 4F 2 DRAM With Manufacturability and Enhanced CellEfficiency,” IEEE Journal of Solid-State Circuits, 2010.
[49] Micron, “4 f2 folded bit line dram cell structure having buried bit andword lines.” https://patents.google.com/patent/US6689660B1/en, 2020.
[50] J. Ahn, S. Hong, S. Yoo, O. Mutlu, and K. Choi, “A Scalable Processing-in-Memory Accelerator for Parallel Graph Processing,” in ISCA, 2015.
[51] H. S. Stone, “A Logic-in-Memory Computer,” IEEE Transactions onComputers, vol. C-19, no. 1, pp. 73–78, 1970.
[52] Yi Kang, Wei Huang, Seung-Moon Yoo, D. Keen, Zhenzhou Ge, V. Lam,P. Pattnaik, and J. Torrellas, “FlexRAM: toward an advanced intelligentmemory system,” in ICCD, 1999.
[53] D. Patterson, T. Anderson, N. Cardwell, R. Fromm, K. Keeton,C. Kozyrakis, R. Thomas, and K. Yelick, “A case for intelligent RAM,”MICRO, 1997.
[54] M. Hall, P. Kogge, J. Koller, P. Diniz, J. Chame, J. Draper, J. LaCoss,J. Granacki, J. Brockman, A. Srivastava, W. Athas, V. Freeh, JaewookShin, and Joonseok Park, “Mapping Irregular Applications to DIVA, aPIM-based Data-Intensive Architecture,” in SC, 1999.
[55] D. G. Elliott, W. M. Snelgrove, and M. Stumm, “Computational RAM:A Memory-SIMD Hybrid And Its Application To DSP,” in CICC, 1992.
[56] M. Gokhale, B. Holmes, and K. Iobst, “Processing in memory: theterasys massively parallel pim array,” Computer, 1995.
[57] M. Zhang, Y. Zhuo, C. Wang, M. Gao, Y. Wu, K. Chen, C. Kozyrakis,and X. Qian, “Graphp: Reducing communication for pim-based graphprocessing with efficient data partition,” in HPCA, 2018.
[58] K. Hsieh, S. M. Khan, N. Vijaykumar, K. K. Chang, A. Boroumand,S. Ghose, and O. Mutlu, “Accelerating pointer chasing in 3d-stackedmemory: Challenges, mechanisms, evaluation,” ICCD, 2016.
[59] M. Drumond, A. Daglis, N. Mirzadeh, D. Ustiugov, J. Picorel, B. Falsafi,B. Grot, and D. Pnevmatikatos, “The Mondrian Data Engine,” in ISCA,2017.
[60] S. Li, C. Xu, Q. Zou, J. Zhao, Y. Lu, and Y. Xie, “Pinatubo: Aprocessing-in-memory architecture for bulk bitwise operations in emerg-ing non-volatile memories,” in DAC, 2016.
[61] S. Aga, S. Jeloka, A. Subramaniyan, S. Narayanasamy, D. Blaauw, andR. Das, “Compute caches,” in HPCA, 2017.