Unconscious Physiological Effects of Search Latency on Users and Their Click Behaviour Miguel Barreda-Ángeles (Eurecat), Ioannis Arapakis (Yahoo Labs), Xiao Bai (Yahoo Labs) B. Barla Cambazoglu (Yahoo Labs), Alexandre Pereda-Baños (Eurecat)
Transcript
Unconscious Physiological Effects of Search Latency on Users and Their Click Behaviour Miguel Barreda-Ángeles (Eurecat), Ioannis Arapakis (Yahoo Labs), Xiao Bai (Yahoo Labs)
B. Barla Cambazoglu (Yahoo Labs), Alexandre Pereda-Baños (Eurecat)
Introduction
§ The core research in IR has been on improving the efficiency of search systems with the eventual goal of satisfying the information needs of users
§ Most research in this direction had a very system-oriented viewpoint
§ The impact of efficiency improvements on users’ searching behaviour and experience have been left unexplored
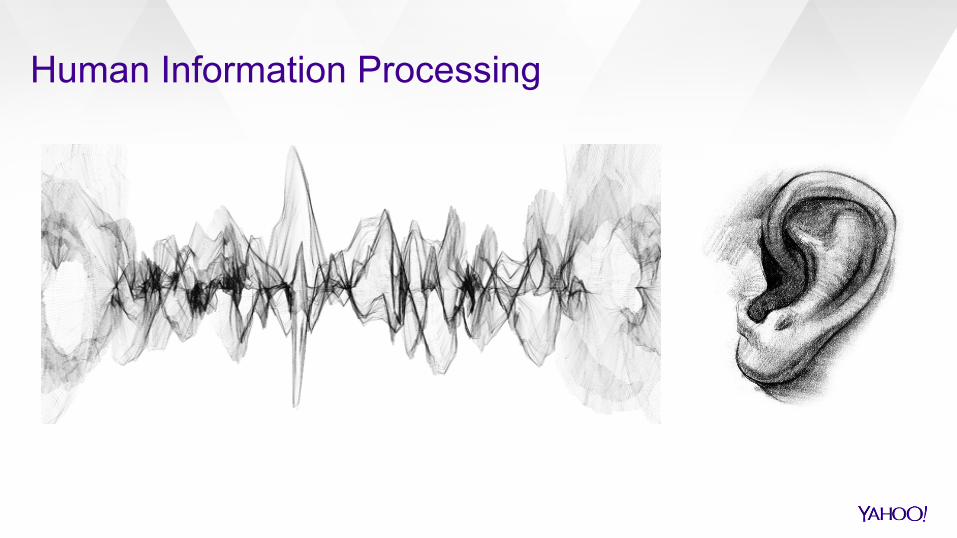
Human Information Processing
§ We are not consciously aware of the mental processes determining our behaviour
§ Such unconscious influences reach from basic or low-level mental processes to high-level psychological processes like motivations, preferences, or complex behaviours
Human Information Processing
Web Search Latency
§ Previous research in the context of web search has shown that response latency values lower than a certain threshold are unnoticeable by the users
§ Conclusions are based on self-report methods which are inherently limited, since users cannot provide information that is not consciously available to them
§ We cannot dismiss completely the possibility that even small latency increases can affect the web search experience
Study Focus
§ Impact of response latency increase on user behaviour in web search
§ Smaller latency values (≥1000ms) that may not be consciously perceived by users
§ We employ two different yet complementary approaches: • a small-scale controlled user study • a large scale query log analysis
Controlled User Study
Experimental Design
§ Repeated-measures design § One independent variable
• search latency* (with four levels in milliseconds: 0, 500, 750, and 1,000)
• experienced positive and negative affect • level of focused attention • perceived system usability • participants’ physiological responses
* Search latency was adjusted by a desired amount using a custom-made JS deployed using Greasemonkey.
Procedure
§ Participants performed four search tasks • evaluate the performance of four different backend search systems • submit as many navigational queries from a list of 200 randomly sampled
web domains • for each query they were asked to locate the target URL among the first ten
results of the SERP
§ Training queries were used to allow participants to familiarize themselves with the “default” search site speed
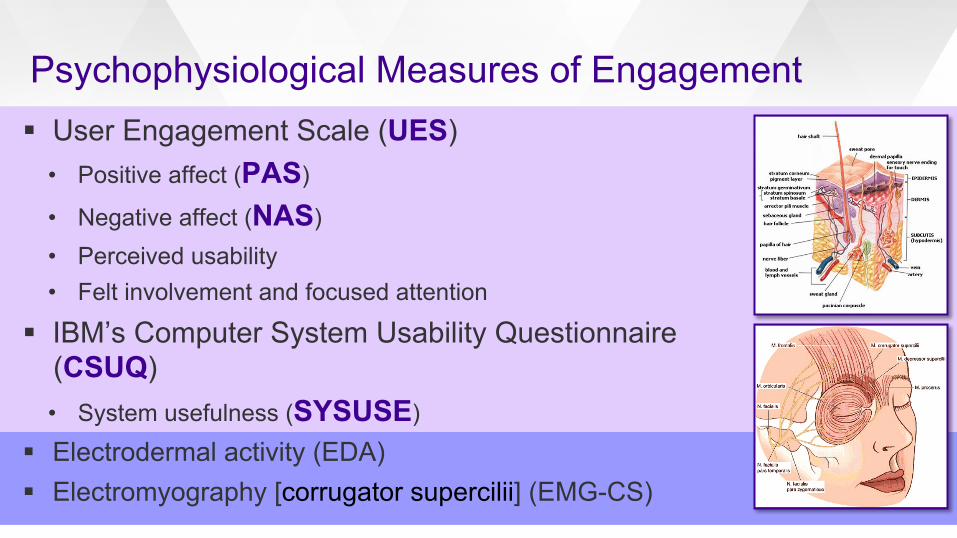
Psychophysiological Measures of Engagement § User Engagement Scale (UES)
§ Helpful in unveiling attentional and emotional reactions not consciously available to us
§ Offer high temporal and spatial resolution § Robust against cognitive biases (e.g., social desirability bias*) § Always provide “honest” responses § No direct question to the subject, no direct answer § The information on the research questions has to be inferred
from the variations on the physiological signals and the way they are related to psychological constructs
* The tendency of survey respondents to answer questions in a manner that will be viewed favorably by others.
Physiological Data
§ Mixed multilevel models (a regression-based approach) • allows comparison of data at different levels
• allows including random terms in the model for random factors • random intercepts for between-subject variability; accounts for the difference in means between
subjects • useful for physiological data, since between subject variability can be much larger than variability
due to experimental conditions, and, therefore, can mask it • random slopes for the effects of time and order of presentation
• Deals with autocorrelated data (e.g. physiological data)
EDA Signal § Applied 200ms smoothing filter & artifact removal § A temporal series was constructed from each physiological signal § Averaged the data every 1-second period (480 points == ~ 8 minutes) § Each 10-second period following a query submission was visually
inspected for SCRs (skin conductance responses) § Data sample: 132 SCRs; 10 points (seconds) by SCR
§ Factors considered in the model: § random intercept for participants § random slope for time and order of presentation § fixed factors:
§ latency (4 conditions) § seconds (10 seconds)
EDA Results
§ Significant increases in the values of EDA through SCRs associated to the three latency conditions
§ This can be interpreted that, when there is an SCR response, it is more intense in the three latency conditions (250ms, 500ms and 1000ms) compared to the 0ms condition, i.e., the arousal is higher for those conditions compared to the 0ms condition
-0.4-0.20.0 0.2 0.4 0.6 0.81.0 1.2 1.4
1 2 3 4 5 6 7 8 9 10
µS
Time after query onset (in seconds)
0ms500ms750ms1000ms
EDA Model Fixed factors Coefficients
Intercept - .31*
Latency 500ms .50***
Latency 750ms .42**
Latency 1000ms .60***
Seg 2 .11***
Seg 3 .36***
Seg 4 .68***
Seg 5 .88***
Seg 6 .90***
Seg 7 .80***
Seg 8 .74***
Seg 9 .72***
Seg 10 .69***
EMG-CS Signal
§ Band-pass filter 30-500Hz & artifact removal § A temporal series was constructed from each physiological
signal § Averaged the data every 1-second period (480 points == ~ 8
minutes) § Included the data for the entire 3-second period after each query
submission § Outliers excluded. Data sample: 7256 samples (4 seconds by
query)
EMG-CS Signal
§ Factors considered in the model: § random intercept for participants § random slope for time and order of presentation § fixed factors:
§ latency (4 conditions) § seconds (10 seconds)
EMG-CS Results
§ Significant increases in the values of EMG associated to the three latency conditions
§ Since EMG over corrugator supercilii is related to the negative valence of the emotions, the three latency conditions produced a more negative valence compared to the 0s latency condition.
EDA Model Fixed factors Coefficients
Intercept .0188***
Latency 500ms .0019***
Latency 750ms .0034***
Latency 1000ms .0010*
Seg 1 .0000393
Seg 2 .0002397***
Seg 3 .0003163***
Self-Reported Measures of Engagement Descriptive Statistics (M ± SD) for UE and SYSUSE
§ We compute two entropy-based features for the EDA and EMG-CS data: • Shannon entropy • Permutation entropy
§ Entropy has been extensively used in signal processing and pattern recognition
§ In information theory, entropy measures the disorder or uncertainty associated with a discrete, random variable, i.e., the expected value of the information in a message
Query Log Analysis
Setup
§ Random sample of 30m web search queries obtained from Yahoo Search (issued by approximately 6m users)
§ Each age group involved at least 100K users § Similar number of female and male users § To control for differences due to geolocation or device, we select
queries issued: • within the US • to a particular search data center • from desktop computers
Latency measurement
§ We use the end-to-end (user perceived) latency values § We quantify engagement using the clicked page ratio metric
User Searchfrontend
Searchbackend
tpre tproc
tpost
tfb
tbf
tuf
tfu
trender
Engagement metrics
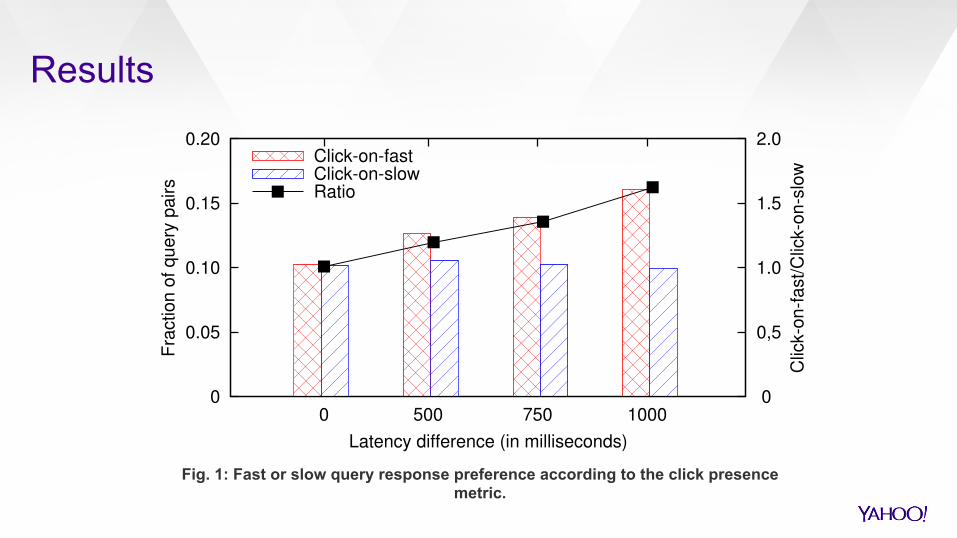
§ We compare the presence of clicks for two given query instances (qfast, qslow) that are: • submitted by the same user • having the same query string • matching the same search results
Fig. 1: Fast or slow query response preference according to the click presence metric.
Results
0
0.05
0.10
0.15
0.20
0 500 750 1000 0
0.5
1.0
1.5
2.0
Fra
ctio
n o
f q
ue
ry p
airs
Clic
k-m
ore
-on
-fa
st/C
lick-
mo
re-o
n-s
low
Latency difference (in milliseconds)
Click-more-on-fastClick-more-on-slowRatio
Fig. 2: Fast or slow query response preference according to the click count metric.
Conclusions § As the response latency of the search engine reaches higher
values, the arousal and the negative valence of the experienced emotions increase as well
§ Physiological data showed that the three latency conditions were associated to: • higher arousal (SCR data) • higher negative valence (EMG-CS data)
§ This can be interpreted as a more emotional and negative experience: a worse experience
Conclusions § Although the latency effects did not produce changes on the
self-reported data, their impact on users’ physiological responses is evident
§ Even if such short latency increases of under 500ms are not consciously perceived, they have sizeable physiological effects that can contribute to the overall user experience
Conclusions § A large-scale query log analysis ascertained the effect on the
clicking behaviour of users and revealed a significant decrease in users’ engagement with the search result page, even at small increases in latency
§ This highlights the need for a more inter-disciplinary approach to the evaluation of human information processing in HCI research