18
Application Note Signal Integrity Analysis of 28 Gbit/s High-S peed Digital Signal MP1800A Series Signal Quality Analyzer
| Date post: | 06-Feb-2018 |
| Category: |
Documents |
| Upload: | phamkhuong |
| View: | 222 times |
| Download: | 2 times |

Application Note
Signal Integrity Analysis of 28 Gbit/s High-Speed Digital SignalMP1800A SeriesSignal Quality Analyzer
2
1. High-speed interconnect market trends
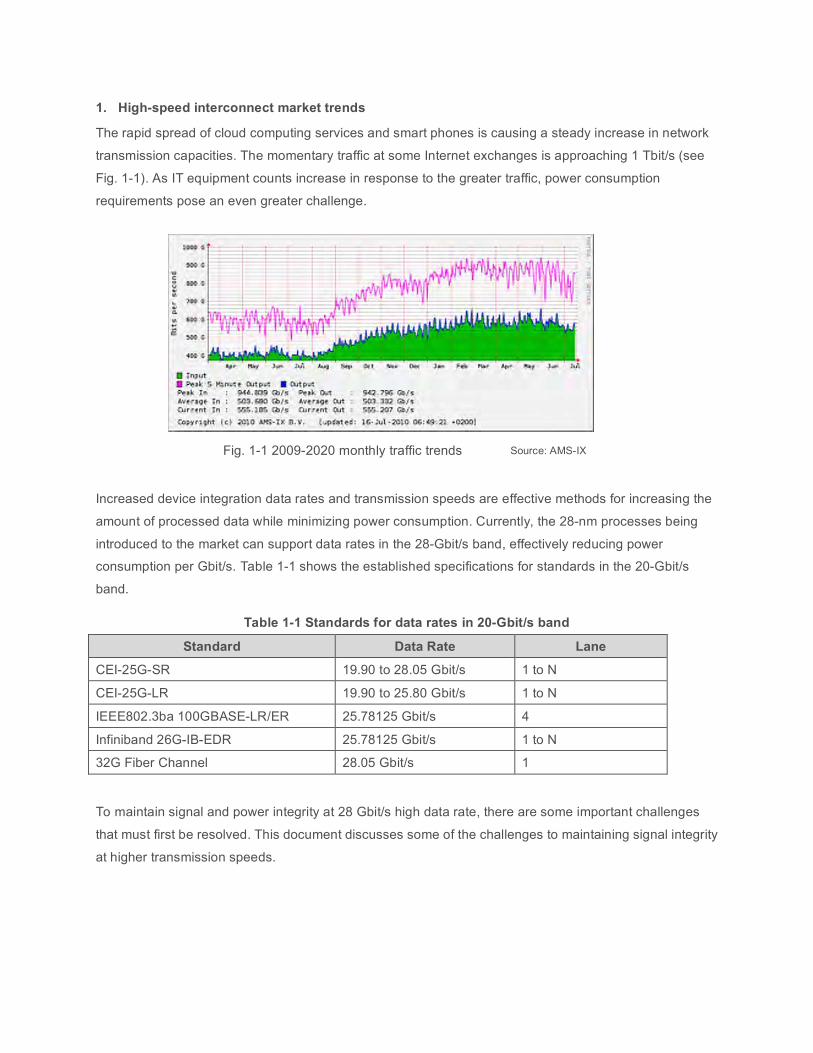
The rapid spread of cloud computing services and smart phones is causing a steady increase in network
transmission capacities. The momentary traffic at some Internet exchanges is approaching 1 Tbit/s (see
Fig. 1-1). As IT equipment counts increase in response to the greater traffic, power consumption
requirements pose an even greater challenge.
Increased device integration data rates and transmission speeds are effective methods for increasing the
amount of processed data while minimizing power consumption. Currently, the 28-nm processes being
introduced to the market can support data rates in the 28-Gbit/s band, effectively reducing power
consumption per Gbit/s. Table 1-1 shows the established specifications for standards in the 20-Gbit/s
band.
Table 1-1 Standards for data rates in 20-Gbit/s band
Standard Data Rate Lane
CEI-25G-SR 19.90 to 28.05 Gbit/s 1 to N
CEI-25G-LR 19.90 to 25.80 Gbit/s 1 to N
IEEE802.3ba 100GBASE-LR/ER 25.78125 Gbit/s 4
Infiniband 26G-IB-EDR 25.78125 Gbit/s 1 to N
32G Fiber Channel 28.05 Gbit/s 1
To maintain signal and power integrity at 28 Gbit/s high data rate, there are some important challenges
that must first be resolved. This document discusses some of the challenges to maintaining signal integrity
at higher transmission speeds.
Source: AMS-IX Fig. 1-1 2009-2020 monthly traffic trends

3
2. Reduction in signal integrity caused by increasing signal speed
Designing logic circuits for only a few Mbit/s required little concern about overall signal integrity. As long as
engineers applied experience and intuition - paying attention to parts layout, positioning smoothing
capacitors on the power line, and adding terminating resistors on the signal line - signal integrity was
relatively easily maintained.
For example, if noise of a 100 mVp-p overlays an LVTTL signal of 3.3 Vp-p, the margin is reduced by only
3.3%. Or if the propagation delay characteristics of an FR-4 PCB are 70 [ps/cm], then a delay of 70 ps
occurs when the wiring length differs by 1 cm. When a 100-Mbit/s signal is transmitted on a line, this same
FR-4 PCB with a wiring length that differs by 1 cm, a deviation of 70 ps occurs for 1-bit 10 ns, and a phase
difference of only 0.7% occurs. This does not greatly affect signal integrity.
But what happens when the data rate is increased to the 20 Gbit/s band?
To increase the data rate while maintaining amplitude, the rising and falling times must be faster. Using
this type of output circuit generates issues such as increased power consumption and higher product
prices. As frequency is increased, signal amplitudes are typically lower and bit periods significantly shorter.
Therefore, whatever impacts amplitude or phase has a much greater impact on signal integrity, resulting in
lower margins and a higher probability of errors. For this reason, low-amplitude signals are usually used.
The physical length differences between signal paths, especially two sides of a different pair, become
important to manage.
If noise of 100 mVp-p overlays a signal amplitude of 400 mVp-p, the threshold margin is reduced by as
much as 25 percent (see Fig. 2-1). When a 25-Gbit/s signal is transmitted on a line of an FR-4 printed
circuit board (PCB) with a wiring length that differs by 1 cm, a phase difference of more than 1 bit occurs
due to a deviation of 70 ps for 1-bit 40 ps. This greatly affects signal integrity (see Fig. 2-2).

Consequently, because it is difficult to maintain signal integrity for data rates in the 20-Gbit/s band,
thorough simulation and verification is essential.
3. Signal integrity analysis
As previously stated, when the data rate is increased, the effect on issues such as noise and error margin
of pattern layouts can no longer be ignored.
In addition, there are many other physical phenomena, such as jitter, inter-symbol interference (ISI) and
crosstalk, which contribute to reduced signal integrity. These phenomena cannot be eliminated completely
at high data rates. Therefore, it is important to take into account the signal integrity reduction for both the
transmitter circuit and the receiver circuit to ensure the quality of the output signal and receiver tolerance.
This section describes the analysis method for securing the quality of the output signal and the receiver
tolerance in terms of jitter, ISI and crosstalk.
• Jitter Evaluation
• ISI Evaluation
• Crosstalk Evaluation
The threshold margin is reduced with the same amount of noise and a low-amplitude signal.
Sufficient threshold margin maintained
Insufficient threshold margin is maintained
The phase margin is reduced with the same amount of delay and a high-speed signal.
Sufficient phase margin maintained
Insufficient phase margin maintained
Fig. 2-2 Phase margin difference
Fig. 2-1 Threshold margin difference

5
3-1. Jitter evaluation
3-1-1. What is jitter?
Jitter is fluctuation in the time-axis direction of a digital signal. In a cycle less than 10 Hz, this fluctuation is
called "wander," while fluctuation above 10 Hz is called "jitter." Figure 3-1 shows an ideal signal and a
signal that has jitter with a sine wave component. As shown, the jitter component causes a reduction in the
phase margin, making it difficult to maintain the setup and hold times necessary for logic evaluation. Thus,
errors are generated.
Figure 3-2 describes an example of jitter with a sine wave component only. However, actual jitter is
comprised of various components. Total jitter (TJ) is comprised of deterministic jitter (DJ) with a bounded
pattern, and random jitter (RJ) with an unbounded pattern. In addition, DJ is derived from data-dependent
jitter (DDJ) that is correlated to the signal pattern, and bounded uncorrelated jitter (BUJ) that is not
correlated to the signal pattern. DDJ comes from duty cycle distortion (DCD) that is dependent on the
characteristics of the input and output circuit, and ISI that is dependent on characteristics such as the
transmission path.
Ideal signal
Jittered signal
Fig. 3-1 Comparison of ideal and jittered signals
Jittered signal divided by single time unit
Sufficient phase margin maintained
Insufficient phase margin maintained

6
Figure 3-2 and Table 3-1 show jitter component types in actual signals and explain their characteristics.
Table 3-1 Jitter causes and characteristics
Name Causes and Characteristics
RJ
Random Jitter
Jitter caused by external factors such as thermal noise. With an
unbounded pattern, it typically follows a Gaussian distribution.
Because it has an unbounded pattern, it is expressed in rms.
BUJ
Bounded Uncorrelated
Jitter
Jitter caused by external factors such as the effect of crosstalk
from nearby signal lines. It has random characteristics similar to
random jitter, but because it has a bounded pattern, it is
expressed in p-p.
DCD
Duty Cycle Distortion
Phenomenon caused by factors such as deviation in the offset of
the transmission and reception circuits. This is the difference
between the Hi pulse width and the Low pulse width.
ISI
Intersymbol Interference
Phenomenon caused by factors such as insufficient bandwidth in
the transmission path or reflections due to an impedance
mismatch. It is the difference between the fastest and slowest
rising or the fastest and lowest falling after the components with
no correlation to the data are removed.
Fig. 3-2 Jitter Types
TJ
DJ
DDJ BUJ
DCD ISI
RJ

7
3-1-2. Jitter tolerance evaluation
An effective method for evaluating jitter reception tolerance for a device is to receive a signal for
which pseudo-imposition of jitter has been performed, measure the bit-error rate (BER), and
evaluate the resistance. As described in section 3-1-1, actual signals are comprised of various
jitter components, and the same components must be reproduced and imposed. Sinusoidal jitter
(SJ) is commonly used to simulate deterministic jitter (DJ) in a test environment. A typical block
diagram for jitter generation is shown in Fig. 3-3.
Figure 3-4 shows each jitter component of the data waveform and its spectrum distribution.
SJ RJ
BUJ DCD
Fig. 3-3 Block diagram for jitter generators
Clock Source
Arbitrary Waveform Generator (sine, triangle or square wave)
PRBS Generator
White Noise Generator
DJ
BUJ
RJ
ISI Pulse Pattern
Generator DCD
Jittered Signal
Fig. 3-4 Jitter histogram and spectrum distribution

8
10-4
10-6
10-8
10-10
10-12
Total Jitter
0UI 1UI
Optimum Phase
Optimum BER
3-1-3. Jitter analysis using “the bathtub curve”
At bathtub measurement, the distribution of bit errors
caused by fluctuation in phase direction is measured inside
the eye opening of the digital signal. The TJ, RJ, DJ and
optimum phase, along with the corresponding optimum bit
error rate, are then calculated (see Fig. 3-5). A TJ closer to
the optimum BER is attainable by measuring the BER at
10-12
(see Fig. 3-6).
The calculation method shown below uses the two-point
measurement of BER E-6 and E-12 introduced as Level 1
in MJSQ (Fiber Channel- Methodologies for Jitter and
Signal Quality Specification).
In general, RJ follows a normal distribution, and
TJ is calculated using the following equation:
TJ pk-pk = UI - t1 = DJ pk-pk + n RJ rms
UI: Bit cycle
t1: Measured values of phases for eye opening at BER E-12
n: n = 13.68 (BER 1.0E-12) that is expressed with the TJ normal distribution
in the specified BER
Fig. 3-5 Bathtub measurement concept

Next, TJ, DJ and RJRMS are calculated using
the following equations.
TJ = UI – t1 = DJ + 2 � Q1 � RJRMS
DJ = UI – t0 – (2�Q0 � RJRMS)
RJRMS = 0.5|(t1 - t0)/(Q1 - Q0)|
Q0, Q1: Calculated values of reverse
cumulative probability distribution for
BER E-6 and E-12
Q0 = - qnorm [(2/TD) � 10-6, 0, 1]
Q1 = - qnorm [(2/TD) � 10-12, 0, 1]
(TD: Transition Density = Mark Ratio)
When TD=1/2, Q0 = 4.465 and Q1 = 6.839
3-2. ISI analysis
3-2-1. What is ISI?
ISI is waveform distortion or attenuation that occurs when a data signal passes through a
transmission path, such as a PCB, with frequency-dependent loss. As the data rate increases,
ISI makes it more difficult for the signal to pass, mainly due to the effects of 1) the frequency
characteristics of the transmission path, 2) the skin effect, and 3) the dielectric loss. Thus, the
signal attenuates and the eye pattern closes. Figure 3-7 shows the effect of ISI using a PCB.
10-inch FR-4 PCB
Fig. 3-6 Bathtub measurement
PPG
TP1 TP2
Fig. 3-7 ISI effect evaluation system Fig 3-8 PCB frequency characteristics

10
As shown in Fig. 3-8, since the PCB causes more than 30 dB of attenuation at 20 GHz, the
20-Gbit/s waveform eye pattern closes due to the effect of ISI, making it difficult to transmit
error-free data (see Fig. 3-9).
TP1 Before passage of signal through PCB TP2 After passage of signal through PCB
10-Gbit/s
waveform
20-Gbit/s
waveform
3-2-2. ISI correction using emphasis signals
It is not possible to completely eliminate ISI and transmit high-speed signals without any
attenuation. As such, the ISI must be corrected to maintain the eye opening. A transmission
technique called pre-emphasis is effective for maintaining the eye opening. Emphasis boosts
high-frequency components of a signal to compensate for higher attenuation in the transmission
channel. Since high-frequency components suffer the most attenuation, emphasis technology is
used to emphasize the bits where this signal transition occurs, helping to suppress signal
attenuation.
Fig. 3-9 Effect of ISI on received data waveform

Figure 3-10 compares the attenuation amount when using a normal non-return-to-zero (NRZ)
signal and a four-tap emphasis signal. At the highest frequency part using the emphasis signal,
the amplitude increases to 410 mVp-p from 150 mVp-p, an improvement of about 173 percent.
Fig. 3-10 Attenuation improvement using emphasis
FR-4 PCB
3-inch
4-tap emphasis signal
Without Emphasis
150mVp-p
410mVp-p
20 Gbit/s, PRBS7
20 Gbit/s, PRBS7
FR-4 PCB
3-inch
4-tap emphasis signal

12
Figure 3-11 depicts the change in the degree of the eye
opening with different emphasis taps. At a bit rate of 10 Gbit/s,
the eye opening becomes largest when four-tap emphasis is
applied (3 dB at cursor 1, 1 dB at cursor 2, and 2 dB at cursor
3). The improvement is about 23 percent.
Number of taps TP1 Before passage of
signal through PCB
TP2 After passage of signal
through PCB
Eye
amplitude
1 Tap
Eye Amplitude
= 500 mVp-p
Cursor 1 : 0 dB
Cursor 2 : 0 dB
Cursor 3 : 0 dB
312 mVp-p
2 Taps
Eye Amplitude
= 500 mVp-p
Cursor 1 : 3 dB
Cursor 2 : 0 dB
Cursor 3 : 0 dB
361 mVp-p
3 Taps
Eye Amplitude
= 500 mVp-p
Cursor 1 : 3 dB
Cursor 2 : 0 dB
Cursor 3 : 2 dB
347 mVp-p
4 Taps
Eye Amplitude
= 500 mVp-p
Cursor 1 : 3 dB
Cursor 2 : 1 dB
Cursor 3 : 2 dB
384 mVp-p
Fig. 3-11 Effect of emphasis for each tap number at 10 Gbit/s

13
At a bit rate of 20 Gbit/s, the eye opening becomes largest
with four-tap emphasis (6 dB at cursor 1, 1 dB at cursor 2,
and 6 dB at cursor 3), and the improvement is about 194
percent (see Fig.3-12).
Number of taps TP1 Before passage of
signal through PCB
TP2 After passage of signal
through PCB
Eye
amplitude
1 Tap
Eye Amplitude
= 500 mVp-p
Cursor 1 : 0 dB
Cursor 2 : 0 dB
Cursor 3 : 0 dB
113mVp-p
2 Taps
Eye Amplitude
= 500 mVp-p
Cursor 1 : 6 dB
Cursor 2 : 0 dB
Cursor 3 : 0 dB
178 mVp-p
3 Taps
Eye Amplitude
= 500 mVp-p
Cursor 1 : 6 dB
Cursor 2 : 0 dB
Cursor 3 : 6 dB
295 mVp-p
4 Taps
Eye Amplitude
= 500 mVp-p
Cursor 1 : 6 dB
Cursor 2 : 1 dB
Cursor 3 : 6 dB
333 mVp-p
Fig. 3-12 Effect of emphasis for each tap number at 20 Gbit/s

14
3-3. Crosstalk
3-3-1. What is crosstalk?
Crosstalk occurs when a signal leaks from a nearby signal line. When large crosstalk occurs, it reduces the
signal integrity and causes incorrect operations. There are two main causes of crosstalk – mutual
capacitance and mutual inductance. In the example shown in Figure 3-13, Signal Line A (Aggressor) is
causing the effect and Signal Line B (Victim) is receiving the effect. Signal Line A's signal leaks to Signal
Line B due to mutual capacitance and mutual inductance. As the signal leaks, it reduces the signal integrity
(see Figure 3-14). A characteristic of mutual capacitance and mutual inductance is that the crosstalk effect
increases as the edge speed rises.
When the signal leaks from the transmitter end of the Aggressor to interfere with the transmitter end of the
Victim, it is called near-end crosstalk (NEXT). Interference with the receiver end of the Victim is called
far-end crosstalk (FEXT).
A closer look reveals that the crosstalk effect also varies with the timing of the Aggressor and Victim. As
shown in Fig. 3-15, the delay is increased when change is performed in a reversed phase, while the delay
is reduced when the change is in the same phase. When only the Aggressor is changed, the delay does
not change. However, waveform distortion occurs. Additionally, the worse case situation takes place when
the crosstalk occurs in the middle of the Victim eye, rather than the edges where the transitions occur,
since the data is usually sampled in the middle.
Signal line A (Aggressor)
Capacitance
Near End Crosstalk (NEXT) Far End Crosstalk (FEXT)
Signal line B (Victim)
Signal line B with no interference
Signal line B with interference
Fig. 3-13 Principle of crosstalk
Generation
Fig. 3-14 Effect on signal of crosstalk
Impedance
Impedance
Fig. 3-15 Effects of crosstalk on waveform
"Aggressor” net
"Victim" net
Delay increased Delay reduced No change in delay No change in delay

15
3-3-2. Checking for crosstalk
When checking for crosstalk, it is important to transmit signals to both the Victim line and Aggressor line to
generate the crosstalk.
The effect of crosstalk is checked using waveform observation after inputting the signal from the
programmable pulse generator (PPG) to both Victim and Aggressor lines (see Fig. 3-16). As shown by the
waveform on the left, the high and low of the input waveform are flat and clear. However, ringing occurs for
the output waveform from the signal line, as shown by the waveform on the right. This is the effect of signal
leak from the adjacent signal line, so the occurrence of crosstalk can be confirmed using an oscilloscope.
Next, the spectrum is checked by transmitting a sine wave signal to the Victim line and an "all-zeros"
pattern to the Aggressor line (see Fig. 3-17). In this case, there is no crosstalk effect because no signal is
transmitted to the Aggressor line, as shown by the waveform. However, when a PRBS7 pattern is
transmitted to the Aggressor line, crosstalk is received and noise is overlaid. Therefore, the spectrum
distribution can also be used to confirm that PRBS7 spectrum components are overlaid on the floor.
Fig. 3-16 Waveform of signal receiving crosstalk effect
Fig. 3-17 Spectrum distribution of signal affected by crosstalk

16
4. Conclusion
For interconnect technologies using high-speed signals of 20 Gbit/s or higher, closer attention must be
given to physical phenomena that can impact signal integrity. Three measurement solutions are available
for evaluating jitter, ISI, and crosstalk and properly employing the necessary countermeasures to ensure
signal integrity.
New challenges must be resolved for future research and development initiatives to move forward. With
the accelerating trend toward higher-speed interconnects, Anritsu will continue to rapidly respond to these
challenges with effective test and measurement solutions.

17
NOTES

Anritsu Corporation 5-1-1 Onna, Atsugi-shi, Kanagawa, 243-8555 JapanPhone: +81-46-223-1111Fax: +81-46-296-1238
• U.S.A.Anritsu Company1155 East Collins Blvd., Suite 100, Richardson, TX 75081, U.S.A.Toll Free: 1-800-267-4878Phone: +1-972-644-1777Fax: +1-972-671-1877
• CanadaAnritsu Electronics Ltd.700 Silver Seven Road, Suite 120, Kanata, Ontario K2V 1C3, CanadaPhone: +1-613-591-2003 Fax: +1-613-591-1006
• Brazil Anritsu Eletrônica Ltda.Praça Amadeu Amaral, 27 - 1 Andar01327-010 - Bela Vista - São Paulo - SP - BrasilPhone: +55-11-3283-2511Fax: +55-11-3288-6940
• MexicoAnritsu Company, S.A. de C.V.Av. Ejército Nacional No. 579 Piso 9, Col. Granada11520 México, D.F., MéxicoPhone: +52-55-1101-2370Fax: +52-55-5254-3147
• U.K.Anritsu EMEA Ltd.200 Capability Green, Luton, Bedfordshire, LU1 3LU, U.K.Phone: +44-1582-433200 Fax: +44-1582-731303
• FranceAnritsu S.A.12 avenue du Québec, Bâtiment Iris 1- Silic 612,91140 VILLEBON SUR YVETTE, FrancePhone: +33-1-60-92-15-50Fax: +33-1-64-46-10-65
• GermanyAnritsu GmbHNemetschek Haus, Konrad-Zuse-Platz 1 81829 München, Germany Phone: +49-89-442308-0 Fax: +49-89-442308-55
• ItalyAnritsu S.r.l.Via Elio Vittorini 129, 00144 Roma, ItalyPhone: +39-6-509-9711 Fax: +39-6-502-2425
• SwedenAnritsu ABBorgafjordsgatan 13, 164 40 KISTA, SwedenPhone: +46-8-534-707-00 Fax: +46-8-534-707-30
• FinlandAnritsu ABTeknobulevardi 3-5, FI-01530 VANTAA, FinlandPhone: +358-20-741-8100Fax: +358-20-741-8111
• DenmarkAnritsu A/S (Service Assurance)Anritsu AB (Test & Measurement)Kirkebjerg Allé 90, DK-2605 Brøndby, DenmarkPhone: +45-7211-2200Fax: +45-7211-2210
• RussiaAnritsu EMEA Ltd. Representation Office in RussiaTverskaya str. 16/2, bld. 1, 7th floor.Russia, 125009, MoscowPhone: +7-495-363-1694Fax: +7-495-935-8962
• United Arab EmiratesAnritsu EMEA Ltd.Dubai Liaison OfficeP O Box 500413 - Dubai Internet CityAl Thuraya Building, Tower 1, Suit 701, 7th FloorDubai, United Arab EmiratesPhone: +971-4-3670352Fax: +971-4-3688460
• SingaporeAnritsu Pte. Ltd.60 Alexandra Terrace, #02-08, The Comtech (Lobby A)Singapore 118502Phone: +65-6282-2400Fax: +65-6282-2533
• IndiaAnritsu Pte. Ltd. India Branch Office3rd Floor, Shri Lakshminarayan Niwas, #2726, 80 ft Road, HAL 3rd Stage, Bangalore - 560 075, IndiaPhone: +91-80-4058-1300Fax: +91-80-4058-1301
• P.R. China (Hong Kong)Anritsu Company Ltd.Units 4 & 5, 28th Floor, Greenfield Tower, Concordia Plaza, No. 1 Science Museum Road, Tsim Sha Tsui East, Kowloon, Hong KongPhone: +852-2301-4980Fax: +852-2301-3545
• P.R. China (Beijing)Anritsu Company Ltd.Beijing Representative OfficeRoom 2008, Beijing Fortune Building, No. 5, Dong-San-Huan Bei Road, Chao-Yang District, Beijing 100004, P.R. ChinaPhone: +86-10-6590-9230Fax: +86-10-6590-9235
• KoreaAnritsu Corporation, Ltd.8F Hyunjuk Building, 832-41, Yeoksam Dong, Kangnam-ku, Seoul, 135-080, KoreaPhone: +82-2-553-6603Fax: +82-2-553-6604
• AustraliaAnritsu Pty. Ltd.Unit 21/270 Ferntree Gully Road, Notting Hill, Victoria 3168, AustraliaPhone: +61-3-9558-8177Fax: +61-3-9558-8255
• TaiwanAnritsu Company Inc.7F, No. 316, Sec. 1, Neihu Rd., Taipei 114, TaiwanPhone: +886-2-8751-1816Fax: +886-2-8751-1817
Specifications are subject to change without notice.
1010
Printed on Recycled Paper
Please Contact:
No. MP1800A-Signal_Integrity-E-F-1-(1.00) Printed in Japan 2011-5 MG


