Significance Analysis of Spectral Count Data inLabel-free Shotgun Proteomics*□S
Hyungwon Choi‡§, Damian Fermin‡, and Alexey I. Nesvizhskii‡¶�
Spectral counting has become a commonly used ap-proach for measuring protein abundance in label-freeshotgun proteomics. At the same time, the developmentof data analysis methods has lagged behind. Currentlymost studies utilizing spectral counts rely on simple datatransforms and posthoc corrections of conventional sig-nal-to-noise ratio statistics. However, these adjustmentscan neither handle the bias toward high abundance pro-teins nor deal with the drawbacks due to the limitednumber of replicates. We present a novel statisticalframework (QSpec) for the significance analysis of dif-ferential expression with extensions to a variety of ex-perimental design factors and adjustments for proteinproperties. Using synthetic and real experimental datasets, we show that the proposed method outperformsconventional statistical methods that search for differ-ential expression for individual proteins. We illustratethe flexibility of the model by analyzing a data set with acomplicated experimental design involving cellular lo-calization and time course. Molecular & Cellular Pro-teomics 7:2373–2385, 2008.
MS-based shotgun proteomics is currently the most com-monly used approach for the identification and quantificationof proteins in large scale studies (1, 2). A variety of massspectrometry-driven protein quantification methods havebeen proposed involving stable isotope labeling of proteins orpeptides coupled with MS/MS sequencing, e.g. ICAT (3),stable isotope labeling by amino acids in cell culture (SILAC)(4), and multiplexed quantitation using isobaric tags for rela-tive and absolute quantitation (iTRAQ) (5) (for reviews, seeRefs. 6 and 7). The well known limitations of label based-methods include requirements for higher amounts of startingbiological material, increased complexity of the experimentalprotocols, and high costs of reagents (7).
As a result, in recent years, so-called label-free methodshave received increasing attention as promising alternativesthat automatically waive some of the disadvantages of usingstable isotope labeling methods. Popular methods in this areahave focused on the analysis of two-dimensional images of
ion intensities in the span of retention time and m/z from aLC-MS or LC-MS/MS run where peak intensities are used asthe abundance measure (8–11). Despite the rich informationcontained in the LC-MS data, daunting computational effortneeds to be spent on processing the data, including back-ground filtering, peak detection, and alignment (8, 11).
A viable label-free quantitative strategy is spectral countingwhere the number of spectra matched to peptides from aprotein is used as a surrogate measure of protein abundance.Although conceptually simple, recent studies have demon-strated that spectral counting can be as sensitive as ion peakintensities in terms of detection range while retaining linearity(12–20). A number of groups have proposed various types ofnormalized scores based on transformed spectral counts,including methods that explore weighted scoring by peptidematch score (16), normalization by the number of potentialpeptide matches (17), peptide sequence length, overall ex-periment-wide abundance (18), or incorporation of the prob-ability of identification into counting (19). Standard statisticaltests could also be applied on the raw/transformed counts toanalyze the protein expression data (20–22).
Despite published examples of using spectral counting inproteomics, there is a lack of computational and statisticalmethods for analyzing this type of data that are as well es-tablished as the counterparts in gene expression data. Theseinclude differential expression analysis such as significanceanalysis of microarray data (SAM) (23), clustering and classi-fication, and network analysis (24–26). Most studies demon-strating the use of spectral counts have resorted to data-driven corrections of conventional signal-to-noise ratiostatistics such as mean-variance model adjustment (27) anddetection rate adjustment (20). These adjustments are primar-ily used to correct the bias in the statistic that favors largedifferences in highly abundant proteins. However, the techni-cal challenges for modeling quantitative proteomics data aredistinct in their own right. First neither ion peak intensityextraction nor spectral counting generates data that can eas-ily be modeled with standard distributional assumptions aswith gene expression data sets. This increases the burden offinding the appropriate statistical model and estimation meth-ods. Second because of the limited amount of sample mate-rial available or MS instrument availability considerations, com-parative profiling of two or more distinct biological conditions israrely performed in sufficient number of replicates or samples.Lacking the opportunity to observe consistent evidence overmultiple samples in homogeneous biological condition makes it
From the Departments of ‡Pathology and §Biostatistics and ¶Cen-ter for Computational Medicine and Biology, University of Michigan,Ann Arbor, Michigan 48109
Received, May 6, 2008, and in revised form, July 14, 2008Published, MCP Papers in Press, July 20, 2008, DOI 10.1074/
difficult to perform robust estimation and inference on modelparameters. Unless there are more than four or five replicatesgenerated for each condition permutation-based methods forgenerating reference distributions will not work well.
Here we propose a general statistical framework for ana-lyzing spectral count data. This method addresses the issueof the appropriate probability distribution for count data aswell as tackles the paucity of information due to the absenceof replicate samples. The model is based on the use of hier-archical Bayes estimation of generalized linear mixed effectsmodel (GLMM)1 (28) where the spectral counts are consideredto be random numbers from a large population of proteins,and hence the model parameters are directly shared withinreplicates and across proteins. This comprehensive modelingstrategy is bound to be more powerful than calculating thesignal-to-noise ratio type of differential expression test statis-tics. These are performed on a per protein basis and refer-enced to an approximate null distribution especially when thenumber of replicates is limited.
This report is organized as follows. First the overall model-ing framework and its applicability to a wide variety of exper-imental designs is explained, and its advantages are dis-cussed. Then the performance of the proposed methodusing synthetic data sets is illustrated with a comparisonwith methods using signal-to-noise ratio statistics. Thecomparison focuses on the power to detect differentiallyexpressed proteins at fixed error rates and the property ofthe detected proteins such as abundance. For a real dataanalysis example, the experimental data set taken fromPavelka et al. (27) comparing proteome profiles of a yeaststrain at two different phases in cell growth is reanalyzed.The enrichment analysis compares the biological functionshighlighted by the protein signature detected by the pro-posed method with the conventional signal-to-noisemethod, and related computational and statistical issuesare discussed. Finally using the published data set of asystem-wide survey of the mouse proteome in congestiveheart failure (29) the proposed methodology is demon-strated in the presence of experimental design factors. Fur-ther discussion of potential improvements on the model andpossible extensions concludes the report.
EXPERIMENTAL PROCEDURES
Experimental Data Sets
Three data sets were obtained from two published studies (27, 29).In all cases, no reanalysis of the raw MS data was performed in thiswork, i.e. the spectral count data were taken as reported in thesupplemental materials provided in those publications. A brief de-scription of the data sets is given below.
Yeast Control Data Set—First Pavelka et al. (27) provided a data setcontaining four biological replicates of BY4741 strain of yeast grownin media enriched with different nitrogen isotopes (14N and 15N).Growing yeast in these two different media is not expected to resultin differences in protein expression between these two samples. Foreach growth condition and each replicate, the LC-MS/MS analysiswas performed on 500 �g of protein extract. Proteins were TCA-precipitated, urea-denatured, reduced, alkylated, and digested withLys-C followed by trypsin digestion. The resulting peptide mixtureswere separated using a 12-step multidimensional protein identifica-tion technology analysis. MS/MS spectra were collected on an LTQlinear ion trap mass spectrometer (ThermoFinnigan) equipped with anano-LC electrospray ionization source. Each full MS scan was fol-lowed by five MS/MS scans using data-dependent acquisition withthe dynamic exclusion option specified as follows: repeat count, 1;repeat duration, 30 s; exclusion duration, 300 s. The peak lists wereextracted from RAW files using the extract_ms.exe program withdefault parameter settings (consecutive scans acquired on the samepeptide ion grouped into a single .dta file). The resulting peak listswere searched using SEQUEST against a yeast protein sequencedatabase appended with decoy sequences. Protein level summarieswere generated using DTASelect with SEQUEST score thresholds setto achieve a less than 1% false protein identification error rate basedon decoy counts. The spectral count for each protein was calculatedas the number of .dta files assigned a peptide from that protein withhigh SEQUEST scores passing DTASelect filtering criteria. In total, thedata set contains four technical replicates for each of the two growthconditions (light and heavy isotope media) with 1307 proteins identi-fied at least once in the eight analyses. This data set was used as acontrol data set for simulation studies.
Yeast Comparative Growth Data Set—The second data set wasalso taken from Pavelka et al. (27) and represents four biologicalreplicates of the same BY4741 yeast strain grown up to two differentstages of cell growth, namely log and stationary phases. MS/MS spec-tra were collected and processed as described above. This data setcontains 1856 unique proteins identified in any of the eight experiments(four replicates for each of the two growth phases). This data setexhibits a significant difference in protein expression levels between thelog and stationary phase and was used in this study for the comparisonof functional annotation in a real data analysis scenario.
Mouse Data Set—The third data set was taken from a publishedmouse study on the causative effect of impaired calcium ion handlingthat leads to dilated cardiomyopathy and eventual death (29). Or-ganellar protein fractions (mitochondrial, microsomal, and cytosolic)were extracted from pooled ventricle tissue and separated usingcentrifugation. 100 �g of protein extract was used in each LC-MS/MSexperiment, TCA-precipitated, denatured, reduced, alkylated, anddigested sequentially with Lys-C and trypsin. The peptide mixtureswere separated using a 12-step multidimensional protein identifica-tion technology analysis followed by MS/MS sequencing on an LTQmass spectrometer equipped with an electrospray ion source. Pre-cursor ions were subjected to data-dependent sequencing with dy-namic exclusion enabled (one scan, no repeats, exclude for 90 s). Thepeak lists (.dta files) were extracted from RAW instrument files usingextract_ms.exe with default parameter settings. The peak lists weresearched using SEQUEST, and the search results were processedusing the STATQUEST analysis program. The spectral count for eachprotein was calculated as the number of .dta files assigned a peptidefrom that protein with high confidence. The spectral count profiles of6190 proteins in phospholamban mutant PLN R9C and wild type micewere compared at three time points in cytosol, microsome, andmitochondria. For each combination of time point and organelle, thespectral count profiles of the mutant and the wild type were paired,adding up to 18 spectral count profiles in total.
1 The abbreviations used are: GLMM, generalized linear mixedeffects model; FDR, false discovery rates; PLGEM, power law globalerror model; PLN, phospholamban; DAVID, database for annotation,visualization, and integrated discovery; GO, gene ontology; StN, sig-nal to noise.
Significance Analysis of Spectral Count Data in Proteomics
2374 Molecular & Cellular Proteomics 7.12
Simulation Data Sets
Using the first yeast data set described above, two groups ofsynthetic data sets were generated. Because the original cell cultureswere grown in 14N- and 15N-media and then mixed into four pools ata 1:1 ratio before LC-MS/MS analysis, in effect these data had no realsignals between the two groups in all proteins. To create syntheticdata sets with non-trivial differential expression, the rows of the datamatrix (proteins) were shuffled to ensure that the distribution of highand low abundance proteins is uniform across the rows. Then the first200 proteins in the matrix were selected, and 2-fold changes wereinserted to the selected proteins, generating the first synthetic dataset (F2). The second synthetic data set (F4) was generated by insert-ing 4-fold changes to the selected proteins. Inserting a fixed -foldchange has been achieved on a protein-by-protein basis. Counts inthe replicates grown in 14N-medium were multiplied by the -foldchange if the mean count in the four replicates in 14N-medium wasgreater than the mean count in 15N-medium and vice versa. If a countin the group with smaller mean was 0, a randomly generated Poissonrandom count was inserted with mean equal to the -fold change itselfon the opposite group to bypass the null effect of multiplying 0 by the-fold change.
To investigate the effect of the number of replicates on the powerof detecting differentially expressed proteins, additional variants ofthe two data sets described above were derived by varying thenumber of replicates used: F2-1rep (taking first replicate for eachcondition), F2-2rep (taking the first two replicates), and F2-3rep (tak-ing the first three replicates). The same was performed with the 4-foldchange data set to form subsets F4-1rep, F4-2rep, and F4-3rep,respectively. For the sake of consistency, the original data with all fourreplicates for each condition (growth media) were named F2-4rep andF4-4rep, respectively (data provided in supplemental Table 1). Inaddition, the aggregated counts across the four replicates within eachcondition were computed and saved as two columns of count sums(F2-sum and F4-sum). This last variant was generated to understandwhether generating replicates helps by adding more signals to thetotal signal or by providing any direct information on the variabilityacross replicates.
Functional Annotation
Interpretation of data was assisted by two annotation tools,FATIGO� (30) and DAVID (31). These tools were used to assignsignificantly enriched functional categories to a selected set of pro-teins. FATIGO� takes the set of target proteins and the set of back-ground proteins, compares the enrichment of each functional cate-gory in the two sets, and reports the statistical significance ofenriched functions in the former list. DAVID performs essentially thesame operation with the option of specifying the background proteinsas the complement of the target protein list among all proteins iden-tified in the particular experiment or as the complement in the pop-ulation of all known proteins in the public databases. FATIGO� wasutilized wherever the “background” list was well defined, and DAVIDwas used when it was otherwise.
Bayes Factors
A quantity called Bayes factor (32) was used as an indicator ofstatistical significance of the model parameters, e.g. regression co-efficients for differential expression. Bayes factors are essentiallylikelihood ratios of two competing statistical models where the likeli-hood of each competing model is averaged over all possible param-eter values by numerical integration. Suppose that we observe data X,and we have two models M1 and M2 that can describe the observa-tion of X. For each model, we have parameters �1 and �2, respec-
tively. Then for i � 1 and i � 2, one can calculate the averagedlikelihood.
p�X�Mi� ��p�X,�i�Mi�d�i ��p��i�Mi�p�X��i,Mi�d�i
(Eq. 1)
The Bayes factor is now defined as the ratio of the two averagedlikelihoods.
B�X� �p�X�M2�
p�X�M1��
�p��2�M2�p�X��2,M2�d�2
�p��1�M1�p�X��1,M1�d�1
(Eq. 2)
A large Bayes factor supports the second model M2 over M1 fordescribing the data X. If M2 is a model with a differential expressioncoefficient and M1 is a model without it, a large B indicates statisti-cally significant differential expression.
False Discovery Rate (FDR) Estimation
The rate of false positives in the selection of differentially expressedproteins based on Bayes factors can be estimated using a mixturemodel-based method of local FDR control (33, 34). Given a logtransformed Bayes factor B, the local FDR (denoted as fdr) can becalculated according to Equation 3,
fdr�B� ��0p0�B�
�0p0�B� � �1p1�B�(Eq. 3)
where p0(B) and p1(B) are the proteome-wide distribution of Bayesfactor for proteins with trivial and significant differential expression,respectively, and �0 and �1 are the corresponding proportion ofproteins. Using this method, one can choose a minimum thresholdBayes factor B* that controls the global FDR at a target rate of �5%as follows.
FDR�B*� �
�B�B*
�0p0�B�dB
�B�B*
�0p0�B� � �1p1�B�dB
(Eq. 4)
RESULTS
Statistical Model for Spectral Counts—For a data set with nsamples and p proteins, a model-based method is proposedto select proteins whose absolute abundance changes by astatistically significant amount under different biological con-ditions. The MS/MS spectral counts of a protein are modeledas observations from the Poisson distribution. This representsa natural choice reflecting the stochastic nature of the peptidesampling process by the mass spectrometer. Similar assump-tions are often made in related applications, e.g. in the serialanalysis of gene expression (SAGE) approach (35). The ex-pected counts are modeled as a linear function of normalizing
Significance Analysis of Spectral Count Data in Proteomics
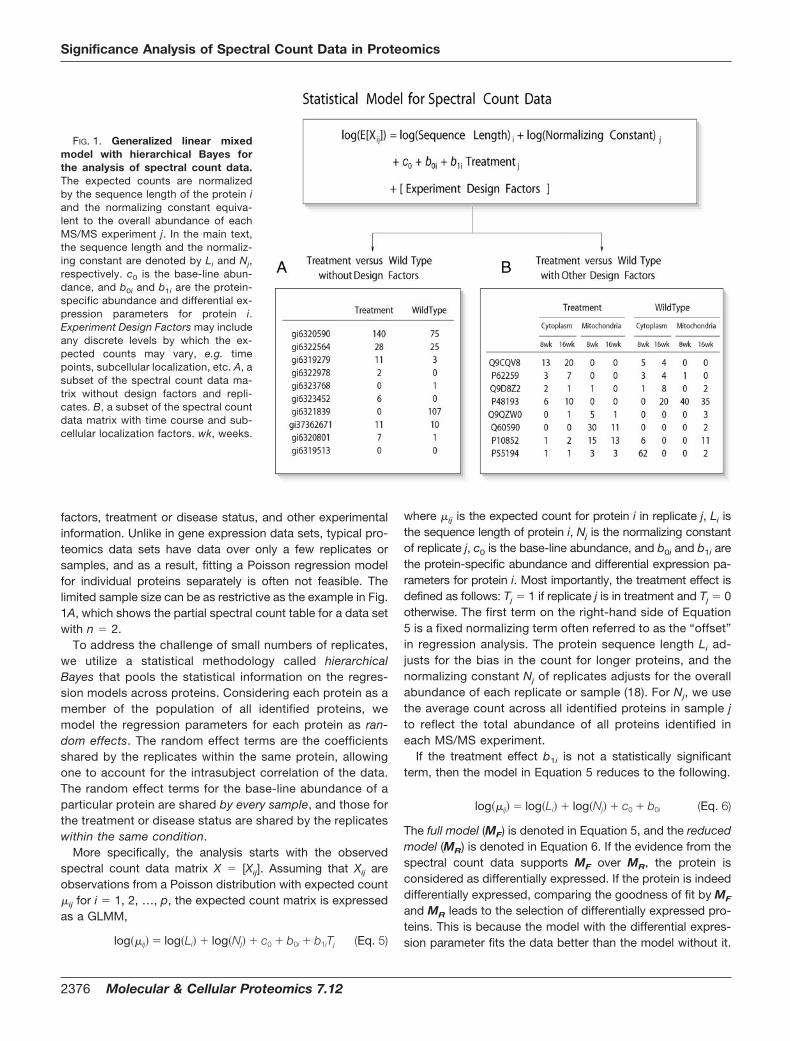
factors, treatment or disease status, and other experimentalinformation. Unlike in gene expression data sets, typical pro-teomics data sets have data over only a few replicates orsamples, and as a result, fitting a Poisson regression modelfor individual proteins separately is often not feasible. Thelimited sample size can be as restrictive as the example in Fig.1A, which shows the partial spectral count table for a data setwith n � 2.
To address the challenge of small numbers of replicates,we utilize a statistical methodology called hierarchicalBayes that pools the statistical information on the regres-sion models across proteins. Considering each protein as amember of the population of all identified proteins, wemodel the regression parameters for each protein as ran-dom effects. The random effect terms are the coefficientsshared by the replicates within the same protein, allowingone to account for the intrasubject correlation of the data.The random effect terms for the base-line abundance of aparticular protein are shared by every sample, and those forthe treatment or disease status are shared by the replicateswithin the same condition.
More specifically, the analysis starts with the observedspectral count data matrix X � [Xij]. Assuming that Xij areobservations from a Poisson distribution with expected count�ij for i � 1, 2, …, p, the expected count matrix is expressedas a GLMM,
where �ij is the expected count for protein i in replicate j, Li isthe sequence length of protein i, Nj is the normalizing constantof replicate j, c0 is the base-line abundance, and b0i and b1i arethe protein-specific abundance and differential expression pa-rameters for protein i. Most importantly, the treatment effect isdefined as follows: Tj � 1 if replicate j is in treatment and Tj � 0otherwise. The first term on the right-hand side of Equation5 is a fixed normalizing term often referred to as the “offset”in regression analysis. The protein sequence length Li ad-justs for the bias in the count for longer proteins, and thenormalizing constant Nj of replicates adjusts for the overallabundance of each replicate or sample (18). For Nj, we usethe average count across all identified proteins in sample jto reflect the total abundance of all proteins identified ineach MS/MS experiment.
If the treatment effect b1i is not a statistically significantterm, then the model in Equation 5 reduces to the following.
log��ij� � log�Li� � log�Nj� � c0 � b0i (Eq. 6)
The full model (MF) is denoted in Equation 5, and the reducedmodel (MR) is denoted in Equation 6. If the evidence from thespectral count data supports MF over MR, the protein isconsidered as differentially expressed. If the protein is indeeddifferentially expressed, comparing the goodness of fit by MF
and MR leads to the selection of differentially expressed pro-teins. This is because the model with the differential expres-sion parameter fits the data better than the model without it.
FIG. 1. Generalized linear mixedmodel with hierarchical Bayes forthe analysis of spectral count data.The expected counts are normalizedby the sequence length of the protein iand the normalizing constant equiva-lent to the overall abundance of eachMS/MS experiment j. In the main text,the sequence length and the normaliz-ing constant are denoted by Li and Nj,respectively. c0 is the base-line abun-dance, and b0i and b1i are the protein-specific abundance and differential ex-pression parameters for protein i.Experiment Design Factors may includeany discrete levels by which the ex-pected counts may vary, e.g. timepoints, subcellular localization, etc. A, asubset of the spectral count data ma-trix without design factors and repli-cates. B, a subset of the spectral countdata matrix with time course and sub-cellular localization factors. wk, weeks.
Significance Analysis of Spectral Count Data in Proteomics
2376 Molecular & Cellular Proteomics 7.12
The exact protein selection method will be described in thenext section more precisely.
Given the model setup, the probability distribution for themodel parameters are specified as follows. Because MR is anested model of MF, it suffices to write the model specifica-tion for MF. Although the expected spectral counts are ex-pressed in the form of a GLMM, the connection across themodel parameters in different proteins has yet to be estab-lished. To this end, assume the following.
likelihood: Xij � Poisson��ij� where �ij is a linear function of c0, b0i, b1i
prior: c0 � N�0,�c2�, b0i � N�0,�0
2�, b1i � N�0,�12� (Eq. 7)
hyperprior: 1/�02 � G��0,�0�,1/�1
2 � G��1,�1�
This framework is called hierarchical Bayes because the set ofparameters {b0i} and {b1i} for all proteins i � 1, 2, …, p arespecified as random variables from the Gaussian distributionwith inverse �-distributed variance parameters. Inverse � dis-tribution refers to the distribution of the reciprocal of the �
random variable with certain shape and scale parameters.Also it is a “conjugate” prior distribution in the sense that theposterior distribution is also an inverse � distribution. Thehierarchical structure in the model specification is known toresult in shrinkage estimates that have better statisticalproperties. This provides the basis for more robust statisti-cal estimation and inference procedures by pooling statis-tical information across all identified proteins (24), whichtends to be helpful in small sample problems. The goodproperty of information pooling has been a well establishedpractice in gene expression data analysis (24, 36). Modelparameters are estimated by sample averages of the pos-terior output from Markov chain Monte Carlo (26, 37) (seesupplemental methods for more specific details on the es-timation procedure).
Tests for Differential Expression and Multiple Testing Cor-rection—The strategy for determining whether each protein isdifferentially expressed between the two conditions isstraightforward. For each protein, the Bayes factor (32) wascalculated as follows.
Bi �p�Xi�MF�
p�Xi�MR�(Eq. 8)
In Equation 8, the numerator and the denominator are essen-tially the likelihoods of observing the counts under MF andMR, respectively. Thus if this ratio is large, the data supportthe model with the differential expression parameters over themodel without, providing probabilistic evidence that the pro-tein is differentially expressed (see “Experimental Proce-dures” for details).
Conventionally a Bayes factor greater than 10 suggests astrong evidence for the model in the numerator, and a Bayesfactor greater than 30 suggests a very strong evidence for thesame model (32). However, these conventional cutoffs maynot work efficiently in the high throughput data sets, and
appropriate cutoffs have to be chosen in a way that the overallglobal error is controlled to a desired level. In this work, thedistribution of Bayes factors with significant differential ex-pression is discriminated from that without by mixture mod-eling (see “Experimental Procedures” for details).
Solely applying the Bayes factor threshold, however, doeshave its own potential drawbacks when there are low qualityreplicates. Empirically the Bayes factor can be overestimatedbecause of the heterogeneity of counts across replicatesrather than the real differential expression. This is especiallytrue for extremely high abundance proteins. In this case, theaveraged likelihood in the model without the differential ex-pression parameter (MR) tends to be penalized more than themodel with the parameter (MF). To address this issue, theselected proteins were required to have a -fold change of noless than 50%. In the subsequent data analysis, of the pro-teins filtered by this step a small number were found to be inthe high abundance range.
Simulation Study—To assess the performance of the pro-posed method, it was compared with the conventional signal-to-noise ratio statistics coupled with FDR control. Particularlythe variance adjustment of t-statistics by the power law globalerror model (PLGEM) was reported to have improved thedetection of differentially expressed proteins in Pavelka et al.(27); hence that method (PLGEM-StN) was used in place ofthe conventional t-statistic.
The analysis was performed using a set of synthetic datasets containing 200 proteins with either 2- or 4-fold changeembedded in the much large list of proteins identified in thecomparative analysis of two biological replicates of yeast(grown in 14N- and 15N-media) with no differential expressionexpected between the replicates (see “Experimental Proce-dures” for details). The analysis was repeated for data setscontaining a varying number of replicates for each of the twoconditions (between one and four replicates). The raw spec-tral counts were converted into normalized spectral abun-dance factors (27), and the PLGEM-StN model of Pavelka etal. (27) was used to calculate moderated t-statistics and theirassociated FDR-adjusted p values. The proteins were se-lected using various cutoffs to examine the power over a widerange of FDRs.
Using the outputs from the two methods, PLGEM-StN andthe hierarchical Bayes method (referred to as QSpec fromhere on) presented here, the comparisons were made basedon the power of detection at a fixed FDR. Importantly becausethe signal-to-noise ratio statistics require the calculation ofvariance, methods like PLGEM-StN (27) cannot be applied todata sets that have less than three replicates. Therefore thePLGEM-StN analysis was performed for 2- and 4-fold datasets with three or four replicates only, F2-3rep, F2-4rep, F4-3rep, and F4-4rep, respectively. Because the QSpec modeldoes not have this limitation, it was applied on all data sets.
Fig. 2 illustrates the comparison using the synthetic datasets with 2-fold change (Fig. 2, A and B) and 4-fold change
Significance Analysis of Spectral Count Data in Proteomics
(Fig. 2, C and D), respectively. Several trends are apparent.With both methods, PLGEM-StN and QSpec, increasing thenumber of replicates leads to the selection of a higher numberof differentially expressed proteins. Also with the number ofreplicates fixed, both models are more successful at detectingproteins having higher -fold change (compare corresponding4- versus 2-fold curves for QSpec and PLGEM-StN models,Fig. 2, A versus C and B versus D, respectively). Comparingthe two methods with each other when applied to the samedata set, QSpec outperforms the PLGEM-StN across theentire range of FDR values (compare Fig. 2, A versus B and Cversus D, for 2- and 4-fold data, respectively). For example, inthe F2-4rep data set, QSpec selects 50 proteins (25%) at anFDR of 10%, whereas PLGEM-StN selects only 24 proteins(12.5%). In the F4-4rep data set, QSpec collects 193 proteins(96.5%) at the same FDR level, whereas the other methodselects 167 (83.5%). Furthermore the QSpec protein selectionfrom the single replicate data sets, F2-1rep, performs noworse than the PLGEM-StN selection from the three-replicateF2-3rep data set. Similarly the QSpec results in the two-replicate F4-2rep data set are equivalent to the PLGEM-StNresults in the three-replicate F4-3rep data.
As an important feature of the model, QSpec performedequally well when applied to the aggregate data sets, F2-sumand F4-sum (with spectral counts from all replicates summedand represented as a single number), as with the originalfour-replicate F2-4rep and F4-4rep data sets (data not
shown). This can be explained by the fact that all the infor-mation used to fit the Poisson model is summarized in thecount sum (sufficient statistic). More precisely, the Poissonmodel assumes that the expected count is equal to the vari-ability of the counts (variance) due to its parameterization, sothe model does not have a separate variance parameter. Theconsequences of this inherent assumption are further dis-cussed later.
Because it was found that the real signals accumulatethrough replicates, the properties of proteins that could not bedetected as differentially expressed in the synthetic data setswith only one or two replicates were investigated. One wouldexpect that the area where the gain in statistical power due toreplicates is most significant is among low abundance pro-teins. The ratio of biological signal to the technical noise in lowabundance proteins tends to be too low to be accuratelycharacterized using spectral counts in a single shotgun pro-teomics experiment. Fig. 3 shows the proportion of proteinsselected by QSpec among the 200 proteins with spiked sig-nals in the synthetic data sets. Indeed the protein selectionachieves greater power in the low abundance range as morereplicates are collected and is especially noticeable in thecase of proteins with 2-fold change (Fig. 3A).
Comparative Growth Analysis—With the evidence thatQSpec outperforms the method of conventional signal-to-noise ratio statistics in simulated settings, the data set fromthe comparative growth phase analysis (27) was reanalyzed.
FIG. 2. The number of true positiveproteins (from the total of 200) iden-tified by QSpec and PLGEM-StN atfixed FDRs in synthetic data setswith known -fold changes and usingdifferent number of replicates. A,QSpec, 2-fold change. B, PLGEM-StN,2-fold change. C, QSpec, 4-foldchange. D, PLGEM-StN, 4-fold change.rep, replicate(s).
Significance Analysis of Spectral Count Data in Proteomics
2378 Molecular & Cellular Proteomics 7.12
Before applying QSpec, the distributions of spectral counts ineach replicate were analyzed for homogeneity. The spectralcounts for one of the replicates (LP3) were vastly higher inmany midabundance proteins and lower in low and highabundance proteins relative to other replicates (see supple-mental Fig. 1). The degree to which this replicate differedfrom the others was deemed more than what can be cor-rected by normalization procedures. For this reason, thisreplicate was expected to introduce unnecessary heteroge-neity in the group logarithmic phase. Therefore, it was re-moved, and the analysis proceeded with the total of sevenreplicates. The final data set contained 1508 proteins in-cluding 10 contaminants that were excluded from the sub-sequent analysis.
Analysis with QSpec resulted in the selection of 298 pro-teins with a Bayes factor above 9.8 (see supplemental Table 2for details of the analysis). Considering all proteins satisfyingthis criterion as differentially expressed would introduce onaverage a 5% or less FDR according to the mixture model-based error estimation (see supplemental Fig. 2). Of the 298proteins, 121 were overexpressed in the stationary phase,and 177 were overexpressed in the log phase. The GO anno-tations and their significance measures were given byFATIGO�, and the most significant terms (FDR-corrected pvalue less than 0.05) located in a reasonably high hierarchy ofthe GO are shown in Fig. 4A (also see supplemental Table 3for the entire enrichment analysis results). For comparison,Fig. 4B shows the results of the original analysis presented inPavelka et al. (27).
It should be noted that in that work the PLGEM-StN methodwas applied not to the entire data set of all protein identifica-tions but to the selected subset of 511 proteins that wereidentified in both the logarithmic and stationary phases. Sub-sequently the set of 100 proteins with the highest signal-to-noise ratios was selected and categorized using gene ontol-ogy of which 34 were overexpressed in the stationary phaseand the remaining 66 were overexpressed in the log phase.Among those 100 proteins, 82 were also in the list of 298
proteins selected by QSpec; this implies that the top list fromPavelka et al. (27) was almost completely recovered by QSpec.
Fig. 4 shows that almost all statistically enriched functionsreported in the original study were also highlighted in thisanalysis. Biological processes such as translation and cellularbiosynthetic process are the common top significant terms inboth QSpec and PLGEM-StN lists of proteins overexpressedin the log phase. Notably the multiple testing-corrected pvalues were much lower in the QSpec annotation table (highersignificance), giving a high confidence explanation for theslowdown of biosynthesis machinery in the stationary phaseof cell growth. Furthermore a large number of terms selectedonly in the QSpec annotation were found to be enriched in thelist of proteins overexpressed in the stationary phase, includ-ing (especially glycolysis-related) catabolism, cellular respira-tion, and oxidoreductase activity. This finding extends thebiological interpretation beyond what was given in Pavelka etal. (27): as the cell growth process slows down in the station-ary phase, the focus of molecular activities shifts to breakingdown large molecules into smaller units and releasing energy,potentially creating energy required for chemical reactions inanabolism or more generally the maintenance of the cell.
The overlap of the lists of top differentially expressed pro-teins selected by QSpec and by PLGEM-StN analysis of theentire list of 1508 proteins was also examined. Using the Rimplementation by Pavelka et al. (27) (plgem package avail-able from BioConductor), PLGEM-StN selected 319 proteinswith the cutoff FDR-adjusted p value less than 0.05. Theoverlap with the QSpec-selected list (298 proteins) was only172 proteins with most of the discrepancies appearing in themid- and low abundance proteins. However, subsequent en-richment analysis of these 319 proteins demonstrated dilutedsignificance of relevant functional terms compared with thoseselected by QSpec and also by PLGEM-StN with 511 proteins(see supplemental Table 3).
Accounting for Experimental Design—Thus far the discus-sion has been limited to two-group comparisons. However,the model can be extended to more flexible study designs,
FIG. 3. The proportion of true posi-tive proteins (sensitivity of identifica-tion) identified by QSpec in the syn-thetic data sets with 2-fold change (A)and 4-fold change (B) across therange of protein abundance. (x–y) im-plies counts ranging from x to y. Rep,replicate.
Significance Analysis of Spectral Count Data in Proteomics
FIG. 4. Venn diagram of the selected proteins from QSpec with all 1508 proteins and PLGEM-StN with the subset of 511 proteins (27).Tables A and B correspond to the significantly enriched gene ontology terms in the protein list identified by QSpec and PLGEM-StN, respectively.
Significance Analysis of Spectral Count Data in Proteomics
2380 Molecular & Cellular Proteomics 7.12
including designs studying subcellular localization (29). Fig.1B shows a part of an example data matrix of spectralcounts of the proteins identified in different cellular com-partments at two different time points. The focus here wasto investigate whether differentially expressed proteins wereidentified in specific cellular compartments or at particulartime points.
These extra factors (localization and time course) can becoded into the model as additive main effect predictors andadditive interaction predictors of expected count as seen inEquation 9,
where b�2i and b�3i are the coefficient vectors for the maineffect and interaction effect terms corresponding to thedesign factors. Assuming that the study design factors havea finite number of levels, e.g. two cellular compartments ortwo time points as in Fig. 1B, a total of K factors can becoded in the standard analysis of variance form as follows.Let MF be the full model with all three sets of terms, i.e. 1)differential expression (treatment effect) b1i; 2) main effects ofdesign factors b�2i; and 3) interaction effects of design factorsand differential expression b�3i. For k � 1, 2, …, K, also letMR-k be the reduced model with the interaction effects be-tween the kth factor and differential expression excluded fromthe full model, i.e. with every term above preserved but thecoefficients for kth factor in b�3i.
Testing for the differential expression specific to some lev-els in design factors can be done equivalently using Bayesfactors. With K models now to compare with the full model, KBayes factors are calculated using Equation 8 with the de-nominator replaced by those averaged likelihoods of reducedmodels. That is, for k � 1, 2, …, K, Bayes factor can becalculated according to Equation 10.
Bik �
p�Xi�MF�
p�Xi�MR-k�(Eq. 10)
By comparing the averaged likelihoods in the models with andwithout the interaction effects between the differential expres-sion and the design factors, one can apply the same minimalthreshold filter by Bayes factor. This leads to the selection ofproteins whose differential expression is specific to certaincellular compartments or time points in the experiment.
Differential Expression with Time Course and SubcellularLocalization Factors—To demonstrate the use of the pro-posed methodology in the presence of experimental designfactors, it was applied to the mouse data generated for theaforementioned PLN R9C mutant model. To identify proteinsover- or underexpressed to varying degrees over time indifferent organelles, the full model and three reduced modelshave been fitted with the time factors nested within each
where Pj and Cj are indicators for organelle and time course.Then the Bayes factors comparing MF against the reducedmodels MR-(Cyto-Time), MR-(Micro-Time), and MR-(Mito-Time) ef-fectively test the significance of differential expression spe-cific to time course effects within each organelle (cytosol,microsome, and mitochondria), respectively.
Applying the same criterion of Bayes factor greater than orequal to 10, which gives an approximate FDR of 5% accord-ing to the mixture model-based assessment, 444 differentiallyregulated proteins between mutant and wild type mice inspecific time points within any of the three organelles wereidentified. Subsets of the 444 proteins pertaining to a partic-ular change in expression (up/down-regulation), time point (8,16, and 24 weeks), and organelle (cytosol, microsome, andmitochondria) were subjected to the functional annotation toolDAVID. Fig. 5A shows the clusters of proteins that were up-and down-regulated in the mutants at specific time points ineach organelle. Fig. 5B shows a heat map of differentialexpression between each pair of mutant and wild type. In thisfigure, overexpression in PLN R9C mutant is highlighted inyellow, and underexpression is highlighted in blue.
Overall mitochondrial proteins concerned with muscle de-velopment and calcium ion binding showed the most drasticchanges with up- and down-regulation in the earlier two timepoints (8 and 16 weeks). A good number of proteins involvedwith antioxidant activity and fatty acid metabolism were un-derexpressed in week 8 consistent with biological interpreta-tion in the original study (29). At the organelle level, cytoskel-eton organization- and actin cytoskeleton-related proteinswere consistently overexpressed across all time points incytosol. A cluster composed of endoplasmic reticulum target-ing sequence, response to protein stimulus, and protein un-
Significance Analysis of Spectral Count Data in Proteomics
Molecular & Cellular Proteomics 7.12 2381
FIG. 5. Selected proteins and functional annotation in the mouse mutant model data set. A, clustered time course graphs by time pointsand organelles. Time points (T1, T2, and T3) correspond to week 8, 16, and 24, respectively. B, heat map of differential expression in the ninecategories by time point and organelle. Yellow indicates overexpression in the PLN R9C mutant relative to the wild type, and blue indicatesunderexpression. Gene ontology terms with FDR-adjusted p value less than 0.05 are reported. dw, down; w, weeks.
Significance Analysis of Spectral Count Data in Proteomics
2382 Molecular & Cellular Proteomics 7.12
folding protein was highlighted in the up-regulated protein listin mitochondria at week 8. Many of the proteins in this list alsoappeared in the up-regulated list at week 16 with functionssuch as muscle protein, contractile fiber, muscle contraction,actin filament depolymerization, and negative regulation ofcell organization. These same functions remained significantat week 24 in mitochondria. In the microsome, glucose me-tabolism was enriched in the down-regulated protein list con-sistent with antioxidant activities. Oxidative phosphorylationand ion transporter activity remained enriched across the timepoints in the up-regulated list in this organelle as well as inothers. In summary, up-regulated calcium ion binding, cy-toskeleton organization, and response to intracellular stressseem to have a strong association with the functional impair-ment on the cardiac ventricular muscle (see supplementalTable 4 for the selected proteins and their functionalannotations).
DISCUSSION AND FUTURE WORK
At present, many studies that utilize spectral counting forrelative quantification still rely on simple data analysis meth-ods such as filtering based on -fold change ratios. Such anapproach selects proteins based solely on the effect sizewithout incorporating the variability. Therefore it may intro-duce a number of false positive calls in low abundance pro-teins where a small difference may result in artificially large-fold change ratios. More recently, a method has been de-scribed that improves the conventional signal-to-noise ratiostatistics by adjusting the variance terms based on the anal-ysis of the spectral counts across multiple replicates (27). Thelimiting factor of this method is that it requires a sufficientnumber of replicates. Because the variability is estimatedseparately for each protein, the estimates are likely to becoarse when the source of the variance calculation is merelya few data points. Moreover the limited number of or totalabsence of replicates makes it difficult to find a robust methodto assign significance to these statistics and reasonably con-trol global false discovery rates. For example, in the popularmethod of referencing observed statistics to the permutationdistribution, the number of possible permutations is 70 atmost when there are four replicates in each comparisongroup, which gives a low resolution permutation distributionvulnerable to outlying observations.
The method presented here has several advantages. It canbe applied to a variety of situations including the comparativeexperiments that feature no or a few numbers of replicateswithin each biological condition. In contrast to other methods,by assuming the equal mean and variance relationship, thePoisson model of QSpec faces no issues with the absence ofreplicates. Because the protein-specific parameters are mod-eled as random numbers from a common population distri-bution, the method effectively pools statistical informationneeded for robust estimation (24) and provides a simple wayto filter proteins based on a well established quantity known
as Bayes factor (32) with an option of model-based FDRcontrol.
The method can also be extended to more complex exper-imental designs where proteins are first separated into manyfractions. In this instance, one can insert protein fraction-specific parameters in the model to account for the initialseparation. In any case, hierarchical Bayes estimation willeffectively pool the statistical information across the proteinsfrom different fractions for more robust parameter estimationsand attempt to overcome the paucity of information becauseof the small sample sizes. Another advantage of the method isthe flexibility for possible extensions to more complicateddata structures. It was demonstrated in this work that thePoisson model can easily incorporate design factors in anal-ysis of variance form, including time course and subcellularlocalization factors. This class of GLMMs with hierarchicalBayes estimation can be applied to even more general dataanalysis scenarios. These include longitudinal profiling studywithout comparative design (no differential expression), rep-licate analysis where the reproducibility of quantitation isstudied by comparing the within and between replicate vari-ability, and protein-protein interaction study with a large num-ber of pulldown experiments where the strength of interactionbetween pairs of proteins is validated based on the number ofspectra corresponding to the interaction partners.
Yet there remain a number of areas for improvements in thismodeling strategy. One well known problem with Poissonmodels is the potential violation of the assumption of theequal mean-variance relationship also termed the overdisper-sion problem. In data sets with many replicates, for instance,the observed data can include heterogeneous counts acrossreplicates even within the same biological condition. In thatcase, the Poisson model with conventional assumptions maynot work as efficiently. Furthermore using this model aggre-gating counts over replicates in a data set will produce largelyidentical results as in the case of applying it to the same dataset but with replicates represented in it as separate experi-ments. In effect, this observation shows the drawback of theplain Poisson model from a different angle in that the modeldoes not make full use of the variability observed in the dataefficiently. Several extensions of the model are now beinginvestigated. In addition to using the overdispersed Poissonmodel, another possibility is to use alternative distributionssuch as negative binomial models replacing the Poissonmodel used here. The latter model has a natural connection toBayesian modeling through mixture model specification.
The discussion in this work was limited to spectral countsthat were defined as the number of MS/MS spectra identifiedfor each protein. However, related metrics such as the num-ber of unique peptides are likely to contain additional usefulinformation. Future work should involve detailed analysis ofthese different protein abundance parameters and their rela-tive performance in different applications. To this end, futureefforts should focus on designing multivariate statistical ap-
Significance Analysis of Spectral Count Data in Proteomics
proaches that can effectively combine different abundancemetrics leading to improved statistical power of detectingdifferential proteins. Furthermore such work should examinethe effects of various instrument control settings on the ac-curacy of spectrum counting-based quantification.
Finally the protein inference problem of shotgun proteomicsshould not be overlooked because it also affects quantifica-tion (38). Peptides whose sequence is present in multipleproteins often cannot be unambiguously assigned to a par-ticular protein or protein group in the protein summary file.The spectral counts for peptides shared among multiple pro-teins or protein isoforms should be appropriately weightedwhen computing the spectral count for each protein in amethod similar to apportioning the probability of a peptideamong all its corresponding proteins via peptide-proteinweights when computing protein probabilities in Protein-Prophet (39). For example, for a peptide identified from nMS/MS spectra and shared between two distinguishable pro-teins, A and B, its contribution to the spectral count of proteinA could be taken as n � NA
d/(NAd � NB
d) where NAd and NB
d arethe spectral counts of proteins A and B, respectively, deter-mined based on distinct (non-shared) peptides only. Note thatthe analysis presented in this work utilized spectral counts asprovided in the original publications. Although less of an issuewith yeast, in the mouse data set apportioning spectral countsof shared peptides as described above should provide moreaccurate protein abundance measures and thus more accu-rate results of the protein function enrichment analysis.
CONCLUSION
A statistical framework was presented for the significanceanalysis of differential expression in label-free shotgun pro-teomics using spectral counts. The statistical methodologydeveloped in this work is a proteome-wide model-based as-sessment of differential expression using GLMM equippedwith a hierarchical Bayes estimation procedure that borrowsstatistical strengths across all proteins. Unlike the conven-tional methods using ad hoc data transformation, signal-to-noise ratio, and posthoc data-driven adjustments, the pro-posed method is more powerful in finding differentiallyexpressed proteins and robust to the variation because of thelimited number of biological replicates at individual proteinlevels. The model showed superior performance in terms of itssensitivity of detection over existing methods. The real dataanalysis examples also illustrated the important advantagesof handling the challenges because of the limited number ofreplicates and providing flexibility of extension of the model tomore complicated study designs. It is expected that the com-putational framework presented in this work will be useful in awide range of applications in label-free shotgun proteomics.
Acknowledgments—We thank Andrew Emili and members of hislaboratory for critical reading of the manuscript and useful discus-sions and Mike Washburn for drawing attention to the data set pro-
vided in Ref. 27. We also thank both groups for providing additionalinformation regarding the data sets.
* This work was supported, in whole or in part, by National Insti-tutes of Health Grant R01 CA-126239 from the NCI. The costs ofpublication of this article were defrayed in part by the payment ofpage charges. This article must therefore be hereby marked “adver-tisement” in accordance with 18 U.S.C. Section 1734 solely to indi-cate this fact.
□S The on-line version of this article (available at http://www.mcponline.org) contains supplemental material.
� To whom correspondence should be addressed: Dept. of Pathol-ogy, University of Michigan, 1301 Catherine, 4237 MS1, Ann Arbor,Michigan 48109. E-mail: [email protected].
REFERENCES
1. Domon, B., and Aebersold, R. (2006) Mass spectrometry and protein anal-ysis. Science 312, 212–217
2. Nesvizhskii, A. I., Vitek, O., and Aebersold, R. (2007) Analysis and validationof proteomic data generated by tandem mass spectrometry. Nat. Meth-ods 4, 787–797
3. Gygi, S. P., Rist, B., Gerber, S. A., Turecek, F. Gelb, M. H., and Aebersold,R. (1999) Quantitative analysis of complex protein mixtures using iso-tope-coded affinity tags. Nat. Biotechnol. 17, 994–999
4. Ong, S. E., Blagoev, B., Kratchmarova, I., Kristensen, D. B., Steen, H.,Pandey, A., and Mann, M. (2002) Stable isotope labeling by amino acidsin cell culture, SILAC, as a simple and accurate approach to expressionproteomics. Mol. Cell. Proteomics 1, 376–386
5. Ross, P. L., Huang, Y. N., Marchese, J. N., Williamson, B., Parker, K.,Hattan, S., Khainovski, N., Pillai, S., Dey, S., Daniels, S., Purkayastha, S.,Juhasz, P., Martin, S., Bartlet-Jones, M., He, F., Jacobson, A., andPappin, D. J. (2004) Multiplexed protein quantitation in Saccharomycescerevisiae using amine-reactive isobaric tagging reagents. Mol. Cell.Proteomics 3, 1154–1169
6. Goshe, M. B., and Smith, R. D. (2003). Stable isotope-coded proteomicmass spectrometry. Curr. Opin. Biotechnol. 14, 101–109
7. Bantscheff, M., Schirle, M., Sweetman, G., Rick, J., and Kuster, B. (2007)Quantitative mass spectrometry in proteomics: a critical review. Anal.Bioanal. Chem. 389, 1017–1031
8. Qian, W. J., Jacobs, J. M., Liu, T., Camp, D. G., and Smith, R. D. (2006)Advances and challenges in liquid chromatography-mass spectrometry-based proteomics profiling for clinical applications. Mol. Cell. Proteomics5, 1727–1744
9. Li, X., Yi, E. C., Kemp, C. J., Zhang, H., and Aebersold, R. (2005) A softwaresuite for the generation and comparison of peptide arrays from sets ofdata collected by liquid chromatography-mass spectrometry. Mol. Cell.Proteomics 4, 1328–1340
10. Jaffe, J. D., Mani, D. R., Leptos, K. C., Church, G. M., Gillette, M. A., andCarr, S. A. (2006) PEPPeR, a platform for experimental proteomic patternrecognition. Mol. Cell. Proteomics 5, 1927–1941
11. Listgarten, J., and Emili, A. (2005) Statistical and computational methodsfor comparative proteomic profiling using liquid chromatography-tan-dem mass spectrometry. Mol. Cell. Proteomics 4, 419–434
12. Liu, H., Sadygov, R. G., and Yates, J. R., III (2004) A model for randomsampling and estimation of relative protein abundance in shotgun pro-teomics. Anal. Chem. 76, 4193–4201
13. Blondeau, F., Ritter, B., Allaire, P. D., Wasiak, S., Girard, M., Hussain, N. K.,Angers, A., Legendre-Guillemin, V., Roy, L., Boismenu, D., Kearney,R. E., Bell, A. W., Bergeron, J. J., and McPherson, P. S. (2004) TandemMS analysis of brain clathrin-coated vesicles reveals their critical involve-ment in synaptic vesicle recycling. Proc. Natl. Acad. Sci. U. S. A. 101,3833–3838
14. McAfee, K. J., Duncan, D. T., Assink, M., and Link, A. J. (2006) Analyzingproteomes and protein function using graphical comparative analysis oftandem mass spectrometry results. Mol. Cell. Proteomics 5, 1497–1513
15. Old, W. M., Meyer-Arendt, K., Aveline-Wolf, L., Pierce, K. G., Mendoza, A.,Sevinsky, J. R., Resing, K. A., and Ahn, N. G. (2005) Comparison oflabel-free methods for quantifying human proteins by shotgun proteom-ics. Mol. Cell. Proteomics 4, 1487–1502
Significance Analysis of Spectral Count Data in Proteomics
16. Ishihama, Y., Oda, Y., Tabata, T., Sato, T., Nagasu, T., Rappsilber, J., andMann, M. (2005) Exponentially modified protein abundance index forestimation of absolute protein amount in proteomics by the number ofsequenced peptides per protein. Mol. Cell. Proteomics 4, 1265–1272
17. Colinge, J., Chiappe, D., Lagache, S., Moniatte, M., and Bougueleret, L.(2005) Differential proteomics via probabilistic peptide identificationscores. Anal. Chem. 77, 596–606
18. Zybailov, B., Mosley, A. I., Sardiu, M. E., Coleman, M. K., Florens, L., andWashburn, M. P. (2006) Statistical analysis of membrane proteome ex-pression changes in Saccharomyces cerevisiae. J. Proteome Res. 5,2339–2347
19. Lu, P., Vogel, C., Wang, R., Yao, X., and Marcotte, E. M. (2007) Absoluteprotein expression profiling estimates the relative contributions of tran-scriptional and translational regulation. Nat. Biotechnol. 25, 117–124
20. Fu, X., Gharib, S. A., Green, P. S., Aitken, M. L., Frazer, D. A., Park, D. R.,Vaisar, T., and Heinecke, J. W. (2008) Spectral index for assessment ofdifferential protein expression in shotgun proteomics. J. Proteome Res.7, 845–854
21. Zhang, B., VerBerkmoes, N. C., Langston, M. A., Uberbacher, E., Hettich,R. I., and Samatova, N. F. (2006) Detecting differential and correlatedprotein expression in label-free shotgun proteomics. J. Proteome Res. 5,2909–2918
22. Xia, Q., Wang, T., Park, Y., Lamont, R. J., and Hackett, M. (2007) Differentialquantitative proteomics of Porphyromonas gingivalis by linear ion trapmass spectrometry: non-label methods comparison, q-values and LOW-ESS curve fitting. Int. J. Mass Spectrom. 259, 105–116
23. Tusher, V. G., Tibshriani, R., and Chu, G. (2001) Significance analysis ofmicroarrays applied to the ionizing radiation response. Proc. Natl. Acad.Sci. U. S. A. 98, 5116–5121
24. Parmigiani, G., Garrett, E. S., Irizarry, R. A., and Zeger, S. L. (2003) TheAnalysis of Gene Expression Data, Springer-Verlag, New York
25. Do, K. A., Muller, P., and Vannucci, M. (2006) Bayesian Inference for GeneExpression and Proteomics, Cambridge University Press, New York
26. Segal, E., Friedman, N., Kaminski, N., Regev, A., and Koller, D. (2005) Fromsignatures to models: understanding cancer using microarrays. Nat.Genet. 37, S38–S45
27. Pavelka, N. M., Fournier, M. L., Swanson, S. K., Pelizzola, M., Ricciardi-Castagnoli, P., Florens, L., and Washburn, M. P. (2008) Statistical simi-
larities between transcriptomics and quantitative shotgun proteomicsdata. Mol. Cell. Proteomics 7, 631–644
28. Zeger, S. L., and Karim, M. R. (1991) Generalized linear models withrandom effects; a Gibbs sampling approach. J. Am. Stat. Assoc. 86,79–86
29. Gramolini, A. O., Kislinger, T., Alikhani-Koopaei, R., Fong, V., Thompson,N. J., Isserlin, R., Sharma, P., Oudit, G. Y., Tivieri, M. G., Fagan, A.,Kanna, A., Higgins, D., Huedig, H., Hess, G., Arab, S., Seidman, J. G.,Seidman, C. E., Frey, B., Perry, M., Backx, P. H., Liu, P. P., MacLennan,D. H., and Emili, A. (2008) Comparative proteomic profiling of a phos-pholamban mutant mouse model of dilated cardiomyopathy revealsprogressive intracellular stress responses. Mol. Cell. Proteomics 7,519–533
30. Al-Shahrour, F., Minguez, P., Tarraga, J., Montaner, D., Alloza, E., Vazqueri-zas, J. M. M., Conde, L., Blaschke, C., Vera, J., and Dopazo, J. (2006)BABELOMICS: a systems biology perspective in the functional annota-tion of genome-scale experiments. Nucleic Acids Res. 34, W472–W476
31. Dennis, G., Jr., Sherman, B. T., Hosack, D. A., Yang, J., Gao, W., Lane,H. C., and Lempicki, R. A. (2003) DAVID: database for annotation, visu-alization, and integrated discovery. Genome Biol. 4, P3
32. Jeffreys, H. (1961) The Theory of Probability, Oxford University Press,Oxford
33. Efron, B. (2004) Large-scale simultaneous hypothesis testing: the choice ofa null hypothesis. J. Amer. Stat. Assoc. 99, 96–104
34. Efron, B. (2007) Size, power and false discovery rates. Ann. Stat. 35,1351–1377
35. Cai, L., Huang, H., Blackshaw, S., Liu, J. S., Cepko, C., and Wong, W. H.(2004) Clustering analysis of SAGE data using a Poisson approach.Genome Biol. 5, R51
36. Smyth, G. K. (2004) Linear models and empirical Bayes methods for as-sessing differential expression in microarray experiments. Stat. Appl.Genet. Mol. Biol. 3, Article 3
37. Robert, C. P., and Casella, G. (2004) Monte Carlo Statistical Methods,Springer, New York
38. Nesvizhskii, A. I., and Aebersold, R. (2005) Interpretation of shotgun pro-teomic data. Mol. Cell. Proteomics 4, 1419–1440
39. Nesvizhskii, A. I., Keller, A., Kolker, E., and Aebersold, R. (2003) A statisticalmodel for identifying proteins by tandem mass spectrometry. Anal.Chem. 75, 4646–4658
Significance Analysis of Spectral Count Data in Proteomics