+ All Categories
Home > Documents > Significant Fire Activity - National Interagency Fire … Significant Fire Activity Significant...

Significant Fire Activity - National Interagency Fire … Significant Fire Activity Significant...

Date post: 13-May-2018
Category:
Upload: votu
View: 218 times
Download: 1 times
Share this document with a friend
17
12 Significant Fire Activity Significant fires are defined in the National Mobilization Guide as fires that are a minimum of 100 acres in timber fuel types, 300 acres in grass and brush fuel types, or are managed by a Type 1 or 2 Incident Management Team, WFMT or NIMO. Percent of Reported Significant Fires by Geographic Area AK NW NO SO NR EB WB SW RM EA SA 1% 17% 5% 4% 5% 7% 2% 8% 6% 4% 40%
Transcript

12

Significant Fire Activity Significant fires are defined in the National Mobilization Guide as fires that are a minimum of 100 acres in timber fuel types, 300 acres in grass and brush fuel types, or are managed by a Type 1 or 2 Incident Management Team, WFMT or NIMO.

Percent of Reported Significant Fires by Geographic Area

AK NW NO SO NR EB WB SW RM EA SA

1% 17% 5% 4% 5% 7% 2% 8% 6% 4% 40%

13

Wildfires Reported to NICC In 2014 there were 63,312 wildfires in the U.S., which burned 3,595,613 acres. Both fires and acres are below the five and 10-year national averages. The charts below depict fires and acres as a percentage of the national total.

14

Wildfire Acres Reported to NICC

15

Wildfire Activity Levels by Geographic Area Percent of the ten year average for each Geographic Area.

16

Alaska Wildfire Activity In 2014 Alaska burned less than 7 percent of all burned acres in the U.S. Over the past 10 years Alaska has annually burned almost 17 percent of total acres nationally. The chart below compares annual acres burned between Alaska and the rest of the U.S. (including Hawaii).

17

Wildfires by Agency

18

Wildfire Acres by Agency

19

Lightning Fires and Acres by Geographic Area

Number of Lightning Caused Fires AK EA EB NO NR NW RM SA SO SW WB Total

55 34 937 477 1019 2417 689 922 259 840 284 7,933

Number of Lightning Caused Acres Burned

AK EA EB NO NR NW RM SA SO SW WB Total

10,652 286 62,187 292,861 114,263 1,235,931 6,522 80,876 6,136 156,022 47,107 2,012,843

20

Human Caused Fires and Acres by Geographic Area

Number of Human Caused Fires

AK EA EB NO NR NW RM SA SO SW WB Total

329 6996 782 3,605 1,646 2,155 1,667 33,345 3,527 1,380 247 55,679

Number of Human Caused Acres Burned AK EA EB NO NR NW RM SA SO SW WB Total

222,909 53,855 43,363 181,965 29,088 147,583 71,823 671,818 74,082 74,219 12,145 1,582,770

21

Wildfires and Acres Burned by Agency

Agency 2006 2007 2008 2009 2010 2011 2012 2013

2014 5-Yr Avg.

10-Yr Avg.

BIA Fires 6,768 4,593 4,934 4,375 3,825 4,274 5,753 3,239 3,377 4,094 4,627

Acres 376,824 266,593 168,336 200,562 106,978 364,767 866,444 173,491 327,352 367,806 304,610

BLM Fires 3,848 2,613 1,941 2,545 2,312 2,798 3,031 2,628 1,944 2,543 2,632

Acres 2,406,622 2,021,009 330,981 989,029 830,377 959,410 3,331,273 1,012,600 871,642 1,401,060 1,634,466

FS Fires 10,403 8,486 7,113 7,691 6,797 6,667 7,098 7,105 6,755 6,884 7,545

Acres 1,896,071 2,835,577 1,234,479 715,677 319,730 1,729,937 2,680,233 1,365,644 871,876 1,393,484 1,443,037

FWS Fires 524 396 425 448 323 442 394 332 348 368 415

Acres 236,746 501,038 95,952 821,838 187,991 171,368 101,752 138,284 17,404 123,360 619,355

NPS Fires 537 489 396 426 390 418 369 455 389 404 426

Acres 73,566 102,459 89,061 182,047 174,255 98,147 140,807 265,755 24,949 140,783 127,981

State / Other

Fires 74,305 69,128 64,140 63,307 58,324 59,527 51,129 33,820 50,799 50,720 57,521

Acres 4,883,916 3,601,369 3,373,659 3,012,633 1,803,393 5,387,738 2,205,729 1,363,772 1,482,390 2,448,604 2,926,542

Total Fires 96,385 85,705 78,949 78,792 71,971 74,126 67,774 47,579 63,612 65,012 73,165

Acres 9,873,745 9,328,045 5,292,468 5,921,786 3,422,724 8,711,367 9,326,238 4,319,546 3,595,613 5,875,098 6,848,092

Wildland Fire Use (WFU) fires and acres were merged with the wildfire data above from 2005 to 2008. This affected the 10-year average in the table above.

22

Wildfires and Acres Burned by Geographic Area

GACC 2006 2007 2008 2009 2010 2011 2012 2013

2014 5-Yr Avg.

10-Yr Avg.

AK Fires 308 448 340 527 689 515 416 603 384 521 484

Acres 266,266 525,017 62,648 2,951,597 1,125,419 293,018 286,887 1,316,876 233,561 651,152 1,150,144

EA Fires 14,483 12,783 11,323 15,781 15,844 9,153 11,147 7,110 7,030 10,057 11,784

Acres 150,191 250,052 69,816 118,657 130,103 213,172 146,208 64,992 54,141 121,723 128,476

EB Fires 3,202 2,482 1,661 1,812 1,846 1,880 2,399 2,214 1,719 2,012 2,137

Acres 1,244,452 2,411,428 145,712 136,970 712,019 462,499 1,888,892 767,954 105,550 787,383 882,884

NO Fires 4,624 3,667 4,807 4,567 2,943 3,092 3,536 5,299 4,082 3,790 3,981

Acres 321,653 208,548 943,155 107,411 35,674 24,200 771,486 165,194 474,826 294,276 311,522

NR Fires 4,273 3,368 2,650 2,556 1,740 2,053 3,433 2,773 2,665 2,533 2,744

Acres 1,166,476 1,084,569 229,389 69,016 70,474 198,624 1,497,972 179,459 143,271 417,960 476,832

NW Fires 4,836 3,832 2,989 3,467 2,188 2,150 2,305 4,389 4,572 3,121 3,355

Acres 956,082 863,214 282,959 177,920 150,553 303,260 1,515,596 503,993 1,383,514 771,383 647,823

RM Fires 5,447 3,548 2,557 2,524 2,903 3,433 5,584 2,621 2,356 3,379 3,431

Acres 658,782 161,944 228,701 107,188 151,631 517,004 1,244,073 237,121 78,345 445,635 347,100

SA Fires 48,632 45,659 43,749 38,660 37,176 42,362 30,964 14,448 34,267 31,843 36,535

Acres 2,632,358 1,865,655 2,204,237 1,227,610 624,440 3,892,567 718,624 182,650 752,694 1,234,195 1,467,790

SO Fires 3,575 5,431 5,382 4,591 3,610 4,891 4,412 4,608 3,786 4,261 4,434

Acres 367,096 899,592 480,389 305,974 83,986 104,829 99,914 412,481 80,218 156,286 297,548

SW Fires 5,731 3,599 3,040 3,620 2,547 3,782 2,634 2,757 2,220 3,068 3,515

Acres 761,518 167,855 573,532 686,078 314,558 2,278,026 543,460 325,985 230,241 738,454 672,003

WB Fires 1,274 888 451 687 485 815 944 757 531 706 763

Acres 1,348,871 890,171 71,930 33,365 23,867 424,168 613,126 162,841 59,252 256,651 465,971

Wildland Fire Use (WFU) fires and acres were merged with the wildfire data above from 2005 to 2008. This affected the 10-year average in the table above.

23

Prescribed Fire Projects and Acres National reporting of prescribed fires began in 1998.
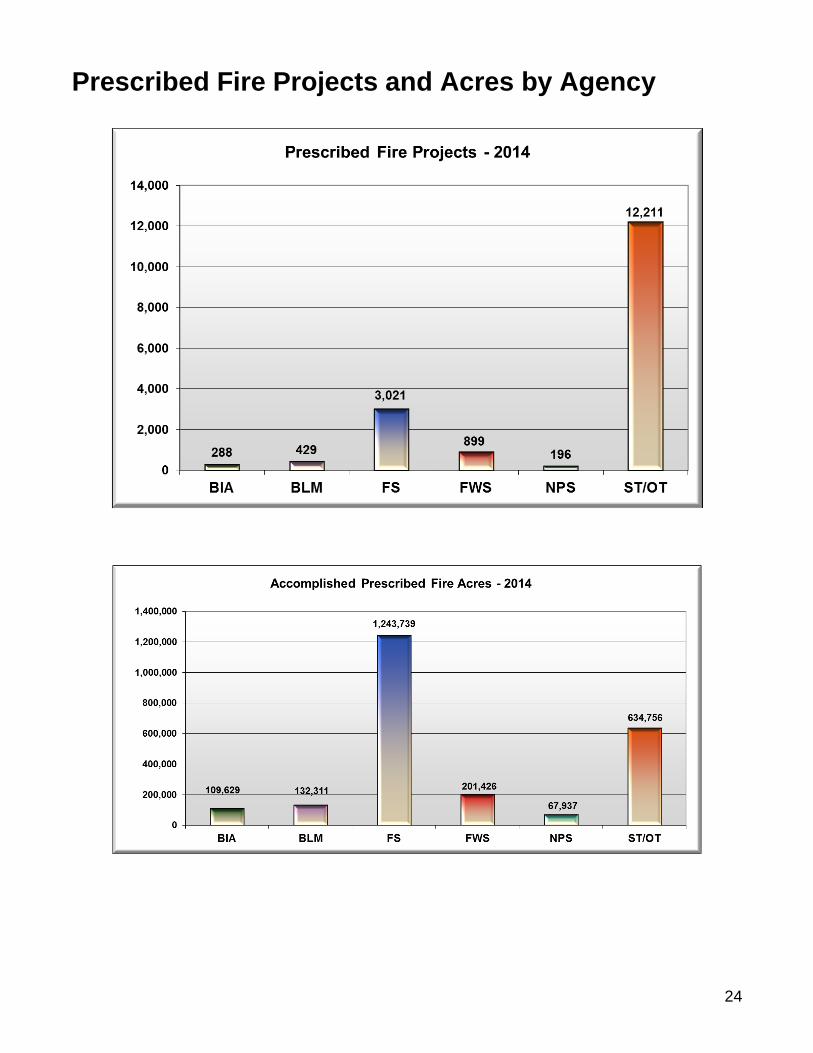
24

Prescribed Fire Projects and Acres by Agency

25

Prescribed Fire Projects by Agency and Geographic Area National reporting of Prescribed Fire projects and acres began in 1998.

Prescribed Fire Projects by Agency

Agency 2005 2006 2007 2008 2009 2010 2011 2012 2013 2014 10 - Yr Avg

BIA Fires 216 254 284 254 2,186 403 321 201 202 288 461

Acres 64,886 86,519 83,811 86,161 151,435 124,404 111,352 62,529 80,889 109,629 96,162

BLM Fires 522 484 462 447 552 431 383 304 328 429 434

Acres 156,037 87,169 100,121 109,128 152,420 91,622 242,658 39,675 34,492 132,311 114,563

FS Fires 3,782 5,138 4,771 3,193 3,795 3,766 2,890 2,719 2,497 3,021 3,557

Acres 1,329,439 1,091,714 1,291,889 955,016 1,244,342 1,408,693 960,992 969,560 1,006,955 1,243,739 1,150,234

FWS Fires 1,201 1,314 1,228 821 1,227 1,024 840 1,001 530 899 1,009

Acres 267,903 291,821 405,455 246,617 338,161 257,672 195,055 234,887 123,399 201,426 256,240

NPS Fires 226 233 271 223 815 251 213 203 154 196 279

Acres 106,921 84,524 111,879 105,497 137,719 94,500 72,045 62,357 44,347 67,937 97,759

State / Other

Fires 1,809 17,006 17,057 2,731 3,854 11,007 4,025 12,198 15,053 12,211 9,695

Acres 385,160 1,078,798 1,155,912 432,582 507,056 446,971 530,709 602,826 709,958 634,756 648,473

Total Fires 7,756 24,429 24,073 7,669 12,429 16,882 8,672 16,626 18,764 17,044 15,434

Acres 2,310,346 2,720,545 3,149,067 1,935,001 2,531,133 2,423,862 2,112,811 1,971,834 2,000,040 2,389,798 2,354,444

26

Prescribed Fire Projects by Geographic Area

GACC 2005 2006 2007 2008 2009 2010 2011 2012 2013 2014 10 - Yr

Avg

AK Fires 4 8 4 10 1 6 20 24 16 7 10

Acres 626 12,039 20,650 3,990 290 505 8,982 13,226 5,177 59,591 12,508

EA Fires 1,966 2,472 2,280 2,473 3,549 2,351 2,575 1,933 1,686 2,437 2,372

Acres 211,044 199,497 232,601 240,918 368,514 310,082 291,768 233,349 136,407 289,368 251,355

EB Fires 230 275 276 300 307 219 222 175 206 281 249

Acres 65,316 68,156 72,820 72,380 61,192 51,511 37,831 38,736 34,823 44,623 54,739

NO Fires 651 474 744 618 604 724 491 421 335 371 543

Acres 73,082 57,337 54,226 65,608 70,966 55,614 46,026 40,161 36,411 29,146 52,858

NR Fires 686 978 902 764 737 807 725 694 458 713 746

Acres 78,899 93,511 75,147 81,170 73,866 83,889 80,358 60,690 34,833 79,725 74,209

NW Fires 1,061 1,545 2,177 851 886 963 852 682 621 756 1,039

Acres 112,197 140,815 145,214 113,873 157,303 135,531 92,869 70,067 81,380 104,084 115,333

RM Fires 491 507 485 484 633 673 607 350 360 516 511

Acres 123,416 93,757 123,275 105,989 102,045 127,002 117,242 59,116 55,810 81,207 98,886

SA Fires 1,891 16,314 16,504 1,421 3,293 10,551 2,685 11,793 14,676 11,596 9,072

Acres 1,403,158 1,896,920 2,243,690 1,014,983 1,426,365 1,489,286 1,104,691 1,322,421 1,537,192 1,590,641 1,502,935

SO Fires 169 145 151 207 237 241 189 211 208 144 190

Acres 21,356 10,298 17,177 21,718 22,974 16,928 13,388 16,669 12,183 7,851 16,054

SW Fires 576 1,685 526 522 2,167 321 276 302 177 196 675

Acres 208,097 143,707 153,432 206,899 244,740 149,076 314,011 111,089 64,759 99,671 169,548

WB Fires 31 26 24 19 15 26 30 41 21 27 26

Acres 13,155 4,508 10,835 7,473 2,878 4,438 5,645 6,310 1,065 3,891 6,020

27

National Preparedness Levels

In 2014 the national Preparedness Level (PL) was elevated to PL 2 on May 14 then was reduced back to PL 1 on June 3. On June 9 it was raised again to PL 2 then reverted back to PL 1 June 23. On J uly 2 it was raised once again to PL 2 where it remained for two weeks. On July 15 the PL increased to 3 and again was raised to PL 4 on August 3. On August 18 it was lowered to PL 3 and a week later was once again reduced to PL 2. On September 29 the PL was lowered to 1 where it remained for the rest of the calendar year.

28

National Preparedness Level Summary In 2014 there were 15 days at Preparedness Levels 4 and 5.

Year PL1 PL2 PL3 PL4 PL5 Total Days at

PL 4 & 5

1990 247 74 31 6 7 13

1991 255 103 7 0 0 0

1992 278 67 15 6 0 6

1993 268 97 0 0 0 0

1994 235 26 54 4 46 50

1995 254 96 15 0 0 0

1996 99 178 60 8 21 29

1997 216 149 0 0 0 0

1998 157 172 30 6 0 6

1999 159 165 33 8 0 8

2000 179 73 61 13 40 53

2001 188 142 9 10 16 26

2002 187 76 14 26 62 88

2003 92 155 60 10 48 58

2004 249 57 60 0 0 0

2005 233 44 47 41 0 41

2006 110 145 44 16 50 66

2007 212 76 17 21 39 60

2008 209 84 15 36 22 58

2009 275 62 28 0 0 0

2010 231 134 0 0 0 0

2011 207 93 58 7 0 7

2012 212 49 60 45 0 45

2013 253 46 42 17 7 24

2014 242 82 26 15 0 15

5-yr Avg 229 81 37 17 1 18

10-yr Avg 218 82 34 20 12 32


Recommended