i IMPACT OF SERIES COMPENSATION ON THE PERFOMANCE OF DISTANCE PROTECTION ON ESKOM TRANSMISSION GRID Sihle Qwabe The dissertation submitted in fulfillment of the requirements for the degree of Master of Science In Engineering Faculty of Engineering University of KwaZulu Natal Date of Submission: June 2010 Supervisor: Dr. B.S. Rigby
Transcript
i
IMPACT OF SERIES COMPENSATION ON THE PERFOMANCE
OF
DISTANCE PROTECTION
ON
ESKOM TRANSMISSION GRID
Sihle Qwabe
The dissertation submitted in fulfillment of
the requirements for the degree of
Master of Science
In
Engineering
Faculty of Engineering
University of KwaZulu Natal
Date of Submission: June 2010
Supervisor:
Dr. B.S. Rigby
ii
DECLARATION I .......Sihle Qwabe........................ declare that (i) The research reported in this thesis, except where otherwise indicated, is my original
work.
(ii) This thesis has not been submitted for any degree or examination at any other
university.
(iii) This thesis does not contain other persons’ data, pictures, graphs or other information,
unless specifically acknowledged as being sourced from other persons.
(iv) This thesis does not contain other persons’ writing, unless specifically acknowledged
as being sourced from other researchers. Where other written sources have been
quoted, then:
a) their words have been re-written but the general information attributed to them has
been referenced;
b) where their exact words have been used, their writing has been placed inside
quotation marks, and referenced.
(v) Where I have reproduced a publication of which I am an author, co-author or editor, I
have indicated in detail which part of the publication was actually written by myself
alone and have fully referenced such publications.
(vi) This thesis does not contain text, graphics or tables copied and pasted from the
Internet, unless specifically acknowledged, and the source being detailed in the thesis
and in the References sections.
Signed:
iii
ACKNOWLEDGEMENTS I would like to acknowledge my family and my friends for the support they have given through
motivation that pushed me into completing this document.
Also I would like to acknowledge my research supervisors Dr. B.S. Rigby and Mr. Anura Perera for
the support they gave.
iv
ABSTRACT
Modern transmission systems are becoming heavily loaded. In addressing this issue Eskom has
been installing series capacitors in their power transmission grids for the purposes of
ensuring improved system stability, increased transmittable power, reduced transmission losses,
enhanced voltage control and more flexible power flow control. Environmental concerns are also
addressed at a fraction of the cost when compared to the alternative. However, with the utilization
of series capacitors and their over-voltage protection devices typically the Metal Oxide Varistors
and Spark Gaps when installed on transmission lines, several problems are created for the distance
protection relays. This is because series capacitors when used on transmission lines can have serious
effects on the performance of distance relay protection. This is because of the change of impedance
seen by the distance relay since the electrical impedance measured by the relay is no longer a
unique correspondence of the physical distance from the relay location to the point of fault when the
protection of the series capacitors comes into play. The research results will show that, because of
subsynchronous oscillations and voltage inversion phenomena as a result of series compensation,
can cause distance protection’s zone 1 directional elements to operate incorrectly, more specific to
internal faults which may appear as external faults and external faults which may appear as internal
faults.
The research will be investigating some of the challenges that are encountered by the distance
protection relays when protecting a transmission line incorporating series capacitors. In answering
the research question: “What are the issues associated with the utilization of series capacitors on
the Eskom Transmission grid to the performance of distance protection?” the Digsilent
PowerFactory software simulator package will be utilized to achieve the desired objectives. Other
research projects have looked into the research question at hand utilizing the physical REL 531
relays and a real time model of the Eskom Hydra South Network, a system that supplies power to
the Western Cape. In this research the author will be looking at the ability of Digsilent and its REL
531 Models to repeat and confirm the same conclusions, before considering possible alternative
solutions.
The Muldersvlei-Bacchus and Bacchus-Droerivier lines forming part of the Eskom Hydra South
Network were selected as the area of focus. The decision to select these two particular mentioned
lines as the area of focus was because the studies will be able to cover impact of external series
capacitors to both the performance of the relays on lines that are series compensated and those that
v
are not. The performance of the relays will involve analyzing the impact of series capacitors on the
relays for faults before and after series capacitors.
The research will also be investigating the possibility of utilizing the current supervised zone 1
configuration, which has recently been introduced on some Eskom distance protection relays as a
solution, to overcome the impact of series capacitors on the performance of the distance protection
relays.
vi
CONTENT INTRODUCTION 1
CHAPTER I Distance Protection 2 1.1 Distance Protection Philosophy 2
1.2 Distance Zones of Protection 3
1.3 Distance Relay Characteristics 5
1.4 Permissive Distance protection Schemes 16
1.5 Distance Relay Settings 29
CHAPTER II Series Compensation 2.1 Series Compensation of Transmission Lines 33
2.2 Series Capacitor Protection 35
2.3 Effects of Series Capacitors and its Protection 42
CHAPTER III System Under Study 3.1 System Layout 49
3.2 Studies Performed 51
3.3 Relay Settings Calculations 51
3.4 Response of the Relay at Muldersvlei for faults in front of the SC 56
3.5 Response of the Relay at Droerivier for faults in front of the SC 58
3.6 MOV Response on Faults In front and Behind SC 60
3.7 Response of the Relay at Muldersvlei for faults behind SC 64
3.8 Response of the Relay at Droerivier for faults behind SC 69
CHAPTER IV Current Supervised Zone 1 4.1 Background 73
4.2 Current Supervised Zone 1 Operating Philosophy 73
4.3 Impact of Bacchus SC on Current Supervised Zone 1 79
CHAPTER V
5. Conclusion and Recommendations 87 6. Future Work 90 7. References 91
vii
LIST OF ILLUSTRATIONS Figure 1-1 Distance Protection Philosophy 2
Current Supervised Zone 1 CSZ1 Current Transformers CTs Digsilent Simulator Language DSL Droerivier Dro Faults after Series Capacitor F Faults before Series Capacitor G Metal Oxide Varistors MOVs Muldersvlei Mul Spark Gaps SG Series capacitors SCs Single line to ground SLG Permissive over-reach POR Permissive under-reach
Power Swing Blocking
PUR
PSB Proteus Prot
xi
LIST OF APPENDIXES
Appendix A Series Capacitor Data on the Eskom Hydra Network. Appendix B Entire Eskom Hydra South Network. Appendix C Hydra South Network Sections Replaced with Equivalent Thevenin Circuit.
Appendix D MOV Characteristics of the Series Compensated Lines on the area of focus.
Appendix E Muldersvlei-Bacchus Line Settings. Appendix F Bacchus-Droerivier Line Setting.
xii
LIST OF TABLES Table 3-1 Summarized Mul-Bac line Relay Settings 53
Table 3-2 Summarized Bac-Dro line Relay Settings 54
1
INTRODUCTION Modern transmission systems are becoming heavily loaded, which consequently conveys the benefit
of the utilization of the series capacitors on the Eskom power transmission grids. It has been
effectively proven by a number of researchers all over the world that by having series compensation
as a feature on power transmission grids, that it is undoubtedly one of the cheapest and simplest
ways of ensuring that the transmission system has improved stability, increased transmittable power
, reduced transmission losses, enhanced voltage control and more flexible power flow control [4, 5,
7]. Environmental concerns are also addressed when compared to the alternative. However,
the utilization of series capacitors (SCs) and their overvoltage protection devices typically Metal
Oxide Varistors (MOVs) and/or Spark Gaps (SGs) when installed on transmission lines, create
several problems [7] for the protective relays i.e. distance relay protection.
The addition of series compensation can have serious effects on the performance of the protection
system more especially on distance relay protection relating to the change of impedance seen by the
relay since the electrical impedance measured by the relay is no longer a unique correspondence of
the physical distance from the relay location to the point of fault when the protection of the series
capacitors comes into play.
The document discusses some of these challenges that are encountered by the distance protection
relays when protecting transmission lines incorporating series capacitors. The research will involve
utilizing the Digsilent PowerFactory simulating package to set up a simplified version of the
network as existing on the Eskom Transmission grid for testing the performance of distance
protection relays, the protection of series capacitors and that of protection of lines adjacent to the
series compensated lines. The distance protection relays that will be studied are relay models that
are provided within the PowerFactory Package.
2
CHAPTER I 1. Distance Protection 1.1 Distance Protection Philosophy Distance protection is a non-unit system of protection, with capabilities of providing both primary
and back-up protection facilities within a single relay. The distance protection scheme can easily be
modified into a 'unit' system of protection by combining it with a signaling channel in this form it is
eminently suitable for the protection of important transmission lines. In Eskom transmission, dista-
nce protection schemes are supplied with signaling channels always.
Distance protection relaying is designed to measure line impedance since the impedance of a
transmission line is proportional to its length. Operation of the relay must only occur for faults
occurring between the relay location and up to the set reach point. This is accomplished by
arranging for the relay to have a balance point between operation and restraint at the selected reach
point. Figure 1-1 illustrates the concept of the distance protection philosophy.
Figure 1-1 Distance Protection Philosophy [11]
Ampere Turns : VF IZ Trip Conditions : VF < IFZ
Restrain
Spring Trip
Operate
IF
VF
Zone 1Zone 2
Zone 3
ZF A
B
C
3
The balance point on the distance protection relaying is defined by the zone reach settings of the
relay. Thus, the relay either operates or restrains depending on whether the measured impedance up
to the point of fault is respectively less than, or greater than, the relay reach setting. The reach
setting is adjustable to minimum and maximum relay design limits to ensure that the relay is
suitable for application on lines of varying length [2, 8].
1.2 Distance Zones of Protection A typical distance protection relay consists of a number of zones of protection, the reach for each
being determined by its reach setting. The zone reach is usually set as a percentage of the
parameters of the line being protected. The distance protection relaying does not only provide the
primary protection for the protected line, but also provides time delayed back-up protection for both
the protected and adjacent lines as well.
In distance relaying the primary protection is provided by the underreaching (set to reach less than
the impedance of the line) zone 1 reach elements, which operates only for faults occurring in the
direction of the protected line. The back-up protection is offered by one or more zones of
overreaching (set to reach more than the impedance of the line) elements, these being zone 2 and 3
reach elements. In Eskom transmission zone 3 elements are always set to reverse reach (look behind
the protected line) with its reach setting such that it always overreaches the remote zone 2. This is to
ensure protection security in cases of “weak in feed”. The underreaching zone 1 elements are by
philosophy set to issue a trip output instantaneously whenever they measure a fault to be within
their reach as such a fault can only have occurred on the protected line [2]. The ideology of the
zones of protection is well illustrated in Fig. 1-2.
4
Figure 1-2 Distance Zones of Protection [11] Any Zone element whose forward reach extends beyond the remote end of the line, or which
reaches in the reverse direction, can only be permitted to issue a trip output signal to the associated
circuit breaker after a pre-set time delay. This is to ensure protection scheme security and to avoid
loss of discrimination with the primary protection on the adjacent line(s). The timers on the
overreaching zones will be started on fault detection by the relay. When a fault falls within a
particular zone’s reach, and that zone element fails to operate to clear the fault after a set time has
elapsed, the tripping time of the relay will be extended to that of the next zone. Figure 1-3 illustrates
the concept of the distance protection zone timers. Removal of the fault from the system before the
time delays have expired will cause the timers to reset, preventing operation of the overreaching
1.3.4 Quadrilateral Distance Applications 1.3.4.1 Short Line Application Short transmission lines like the one on an R-X diagram depicted in Fig. 1-7, are generally
associated with low impedance values, causing the line impedance to be electrically very far from
the expected maximum load, as a result, this would challenge the measurement accuracies of mho
distance relays. Generally the mho distance relay ground elements are equipped with a natural
ability to expand and accommodate more of the resistive component (Rf) and this ground element
expansion is proportional to the source impedance (Zs) as shown in Fig. 1-7. This however creates
difficulties for mho characteristic elements when required to detect general faults that are even
without arc resistance. This is because if the tower footing resistances are in the range of line
impedances, this will add to Rf, causing the relay to under-reach. The situation is negatively
amplified if the source impedance (Zs) is very small. Moreover, the situation for phase fault
detection is similar to that of ground fault detection in short line applications. If the expected arc
resistance is approximately the same magnitude as the transmission line impedance, the mho phase
fault detecting elements will also experience problems [26].
11
Figure 1-7 Short line apparent impedance [26]
The problem of under-reaching endured with mho characteristic protection as a result of arc
resistance and or fault resistance to earth that tends to contribute to the highest values of fault
resistance is therefore eliminated with the use of quadrilateral characteristic, since this relay’s
ground elements can provide a larger margin to accommodate “Rf” by allowing an independent
settable maximum zone resistive reach setting. However, the use of a quadrilateral phase distance
element with extended resistive fault sensitivity is vulnerable to the probability of tripping under
heavy static load or power swings. It is therefore often necessary in practice to limit the resistive
reach coverage of quadrilateral distance elements. There are a couple of limitations that are
recommended by [16] in practice when setting the quadrilateral characteristic reach elements, and
these will be discussed in the sections to follow in this chapter. Nevertheless, even with these
limitations the performance of the quadrilateral relay is still a better option when compared to mho
relays.
1.3.4.3 Load Encroachment Supervision Application In traditional "mho" characteristic relays, increasing the reach setting of the ground elements in
order to improve resistive fault sensitivity generally increases the relay’s chances of picking up and
tripping on load. When a transmission line is heavily loaded and inductive in nature, the traditional
mho protection relay is not only susceptible to respond to system transient swings, but also may
Resistive coverage gained by using the quadrilateral characteristic instead of the standard mho circle (area outside the mho circle but inside quadrilateral
Quadrilateral characteristic having the same maximum sensitivity angle and same forward reach as the standard mho circle
12
detect steady-state load. A number of alterations in the relay’s zone characteristic have been
developed over the years to try and reduce the setback of the sensitively set zone reach elements
undesirably responding to load conditions. To mention a few, some of the alterations have included:
the variations in zone positioning, characteristic angle adjustment; offsetting characteristics; Lens
and other variations in zone shapes. The fundamentals of the mentioned relay alteration methods
will not form part of the discussions of this document as these methods have been shown by [26,
27] to generally always result in a significant loss of the impedance plane coverage whenever
loadability is improved. However, an alternate means of preventing, or even eliminating
completely, a distance zone's response to transient or steady state load conditions has been to
supervise its operation with other distance elements [26, 27], hence this document will only be
discussing this method.
Figure 1-8 Load encroachment characteristic for quadrilateral distance elements
The load-encroachment characteristic is one feature that some of the modern distance relaying
packages offer as a method of discriminating between a general load and an actual fault condition.
Since loads in transmission systems are in general, primarily balanced three phase loads,
supervisory restrictions are placed only on the operation involving the 3-phase distance elements,
and not on operation involving single phase to ground, two phase fault, and double phase-to-ground
faults [27]. The load-encroachment has the ability to define general load regions as illustrated in
Fig. 1-8. The supervision operating point of the load impedance in the blocking region (refer to Fig.
Load-encroachment blocking region. Resistive coverage lost only for events involving solely “Positive Sequence” impedance.
13
1-8) will clearly identify load conditions and result in only a minimal portion of resistive 3-phase
faults (corresponding to positive sequence impedance) that will be missed. “The relay calculates the
positive sequence elements from the measured phase quantities, and from them calculates the
magnitude and phase angle of the positive sequence impedance. If the measured positive sequence
impedance lies within a defined load region, the 3-phase distance element is blocked from
operating” [27]. It is to be noted that such faults are a very unlikely probability in transmission
systems.
1.3.4.2 Power Swing Blocking Application When power flows through power systems, there are transient oscillations that take place which can
cause unnecessary line trips, which can in turn lead to networks being exposed to undesirable
stability problems. Stability requirements demand that transmission lines remain in the power
system during power system oscillations. Power swing blocking (PSB) is a distance relay
application which monitors the power swings occurring on the network being protected and tries to
determine whether they are of a stable or unstable nature. This is the way in which the PSB
distinguishes if the impedance trajectories seen by a relay at that point in time, are associated with a
genuine fault condition or just a general power swing condition.
Figure 1- 9 Traditional dual-zone out-of-step characteristic [27]
If the oscillations are contained within a maximum oscillation envelope and are damped over time,
the power swings are said to be stable. Meanwhile, if the power swings are not damped over time,
the power swings are said to be unstable [26]. The PSB measuring elements generally incorporate
14
two zones inserted between the load and tripping characteristics. Some relays use a starter and/or
zone 4 for the detection of power swings. To differentiate between fault operating phenomena and a
power swing condition, the time difference between the outer and the inner zone characteristics
picking up (starter and zone 4) is measured [16]. Now the out-of-step detection techniques generally
take advantage of the slower speed movement of the apparent impedance trajectory through the
characteristic R-X plane for power swing conditions (the inner zone operates after a set time delay
(2 to 5 cycles) with reference to the outer zone), while if the impedance trajectory is due to a power
system fault, both zones will pick-up almost instantaneously. A traditional PSB scheme is illustrated
in Fig. 1-9. All unwanted distance relay protection operations during power swing conditions should
be blocked on transmission systems. The modern generation of distance relays are designed with
technology that is capable of detecting a genuine fault condition during power swings and releases
blocking to isolate the fault. However, in the old generation relays that do not have the facility to
detect faults during power swings, only the instantaneous tripping zone has to be blocked if it is
possible to do so.
The outer PSB zone must not encroach the load characteristic with a minimum of 50% margin
(1.5*ZPSB <ZLoad) [16]. In cases where this requirement cannot be met, an adequate compromise
of engineering judgment should be used to set the inner and outer zones, as well as the resistive
reach of the quadrilateral element.
1.3.4.4 Single-Pole Trip Application Transmission systems are required to perform single pole tripping in cases where lines experience
single phase to ground faults. This is a common standard in transmission systems that the protection
schemes have a functionality of tripping and isolating the only unhealthy phase when a line is
experiencing a single phase to ground fault, while the network still maintains synchronization via
the other two healthy phases. The rationale is that during the open single pole interval, if the fault
was of passive type, the arc is allowed to deionise and a reclosing command can be sent to the
breaker to reclose and bring the phase back to service. However, during the open-pole interval, the
power system gets unbalanced causing negative and zero-sequence currents to flow. This causes
major issues for distance elements as current polarization attained with zero-sequence currents
and/or negative-sequence currents is not reliable [27]. This is because negative-sequence currents
and zero-sequence currents will have different directions depending on the load flow direction
during this condition. However, distance elements of mho relays when polarized with positive-
15
sequence voltage, is one application that can be used to assure system stability during open-pole
intervals and can also assure protection reliability when required to detect system faults during
open-pole intervals [28]. Unfortunately, with quadrilateral schemes, the phase and ground elements
should be disabled when an open-pole condition is detected. However, high-speed quadrilateral
distance elements implemented with incremental quantities do not need to be disabled during this
condition [27].
16
1.4 Permissive Distance protection Schemes Both permissive under-reach (PUR) and permissive over-reach (POR) protection schemes are being
used on the Eskom transmission network. Both their performances will be reviewed, findings will
be analyzed and compared.
The main disadvantage of the unit protection schemes is their limitation in providing back-up
protection to the adjacent line section. A distance scheme is capable of providing back-up protection
but it does not provide high-speed tripping protection for the whole line length and the circuit
breakers do not trip simultaneously at both ends for the end zone faults. The instantaneous tripping
on distance schemes is only realized via zone 1 which only covers 80% of the line protected with
the remaining 20% of the line faults cleared at 400ms via Zone 2.
2.1 Series Compensation of Transmission Lines Modern transmission systems are becoming heavily loaded, which consequently conveys the benefit
of the utilization of the series capacitors on the Eskom power transmission grids. It has been
effectively proven by a number of researchers all over the world that by having series compensation
as a feature on power transmission grids, it is undoubtedly one of the cheapest and a simplest ways
of ensuring that the transmission system has improved stability, increased transmittable power, redu
ced transmission losses, enhanced voltage control and more flexible power flow control.
Environmental concerns are also addressed when compared to the alternative [4, 5, 7].
The amount of line compensation is usually represented as a percentage of the line inductive
reactance that is compensated with series capacitors. In Eskom Transmission the series
compensation values for lines are usually within the ranges of 20 – 60 percent [17].
2.1.1 Improved Power Transfer Capability
With regards to power transfer capability, the active power transfer from one system to another is
given by the following expression:
P = (V1*V2 sinδ)/X (2.1) X = XL (1 – k) (2.2) k = Xc/ XL (2.3) Here, “V1” and “V2” represent the magnitudes of the voltages at either end of the transmission line,
whereas “δ” represents the angular difference of the said voltages, XL is the reactance of the line, Xc
represents the reactance of the series capacitor and k is the degree of compensation. The setup is
illustrated in Fig.2-1.
34
Figure 2-1 Power Transmission Line with Series Capacitor
From equation (2.1) it is evident that by introducing series capacitors (see equation (2.2)) on the
interconnecting transmission line, this action would introduce a negative reactance to the positive
reactance on the non-compensated line [5], consequently, reducing the overall line reactance and
therefore increasing the amount of active power that can be transferred for a given transmission
angle δ.
On proving the phenomenon of increasing power transfer capability on a network by mere
introduction of series compensation on a transmission link, an experimental study performed by [5]
was followed, where the power transmission line depicted in Fig. 2-1 was considered as a case
study. The study involved analysis on how the transmitted power varies with the size of the
series capacitor, where it was assumed that the magnitude of the voltage at the sending bus to be V1
[kV] and that the magnitude of the voltage at the receiving bus to be V2 [kV].
Furthermore, it was assumed that the electrical phase angle between the voltage at the sending and
the voltage at the receiving end to be δ [degrees]. Furthermore, it was assumed that the series
reactance of the power transmission line is equal to XL [Ω] and that the series resistance of the line
is zero. Finally, it was assumed that the reactance of the series capacitor is Xc [Ω].
The conclusion attained [5] was proven to be correct, as the study involved keeping all system
parameters constant and only varying the degree of compensation i.e. k=0.0, k= 0.5 and finally
k=0.7. The results attained are demonstrated graphically in Fig. 2-2 where it is illustrated that a 70%
series compensated line shown in Fig. 2-1 will have a better power transfer capability compared to
the same line if it were 50% or even 0% series compensated.
V1 V2 jXl -jXc
G2G1
35
POWER ANGLE CURVE
0
1000
2000
3000
4000
5000
0 50 100 150 200
Tx Angle
MW
k 0.0 k 0.5 k 0.7
Figure 2-2 Power Transmission Curves for the Line
2.2 Series Capacitor Protection Series capacitors have proven to be a very important element economically with regards to long
distance power transmission. One of the most crucial considerations as far as the design and
application of these devices has been over-voltage protection. The traditional Spark Gaps (SG)
protected the series capacitors installed before the mid 1970s [3], this scheme bypasses the series
capacitors to avoid over-voltages. Though there are still SGs in the Eskom Transmission Network,
they are now being phased out with the metal oxide varistor protection. Fig. 2-3 shows the survey
statistics of the SC protection on the Eskom Hydra South Network. The survey done by Eskom
Transmission [13] conveyed that 50% of SG series capacitor over voltage protection still exists on
the Hydra South Network, while also about 50% of the remaining SC are protected with MOVs.
About three new projects are in place to install series capacitors and it has not been decided what
will be used for SC protection on these particular circuits, these being the following:
a) Iziko 1 Hydra Poseidon Line circuit 01
b) Iziko 2 Hydra Poseidon Line circuit 02
c) Serumular 1 Beta Delphi Line circuit 01
Tx Angle (degrees)
36
A complete survey attained from [13] of the SC on the Eskom Hydra Network is as shown
in Appendix A.
SC Over Voltage Protection Survey Statistics on The Eskom Hydra South Network
50%50%
MOV SG
Figure 2-3 SC Protection Survey Statistics on the Eskom Hydra South Network [13]
The problems of distance protection relaying on series compensated lines are promoted even further
with the utilization of these over-voltage protection schemes i.e. SG and/or MOV schemes. Spark
Gaps (introducing a varying resistance component), Metal Oxide Varistors (introducing a varying
and nonlinear resistance), [5] or even a circuit breaker which closes during faults creating a bypass
around the capacitor for high fault currents, thus, introducing uncertainty into the relay calculations.
2.2.1 Spark Gaps Fig. 2-4 shows a typical series capacitor protected by the spark gap scheme consisting of the basic
following elements: the Spark Gap and the by-pass switch. The spark gap protection is connected
directly in parallel with the series capacitor that it is protecting.
37
Figure 2-4 Typical Spark Gap Scheme for Over-voltage Protection
2.2.1.1 Principle of Operation During a power system fault, the spark gap is self triggered and will flash over when the voltage
across the series capacitor exceeds a threshold value. A by-pass switch will be operated by closing
for all extended current flow through the arcing spark gap, thus, completely bypassing the series
capacitor. The damping circuit is incorporated in the circuit for the sole purpose of limiting the
discharge current and absorbing the energy stored in the high-level charged series capacitor.
The series capacitor is reinserted into the system by opening the by-pass switch. The protection and
control will issue a reinserting command of the SC when the fault has been cleared, this will be
attained by opening the by-passing switch after a certain time interval has elapsed, this is to allow
the gap to deionize and ensuring that the SG withstand voltage has been regained. If the attempt for
reinsertion is made too soon, it is likely to cause re-ignition of the ionized SG, especially when the
line current is high. A de-ionizing time in the range of 200-300 ms is generally necessary [4, 5]. The
gap scheme is sufficient for many applications, however, when fast reinsertion following
disconnection of external fault is required (i.e. less then 100ms after fault clearing), the relatively
long deionization time of the gap is a drawback [4].
38
2.2.2 Metal Oxide Varistors
“MOVs for over voltage protection are derived from their unique conduction properties and ability
to remain stable under continuous energization even after repeated surge duties. Metal Oxide
Varistors display a non-linear conduction mode that is highly desirable for overvoltage protection.
The resistive intergranular molecular boundaries between the conductive zinc-oxide grains and the
rare metal additives become conductive under sufficient electrical field stress. Very simply, after a
certain threshold voltage is reached, small increase in electrical stress causes a drastic increase in
conduction current. This ‘non-linear’ resistive behavior supports the application of the system
voltage with very low leakage current, yet maintaining a remarkably constant voltage during high
current surges. This method of overvoltage protection provides a number of benefits that include
instantaneous reinsertion without transient, lower capacitor protective levels, greater reliability and
lower maintenance” [12].
Figure 2-5 Typical Gapless MOV Scheme for Overvoltage Protection
Figure 2-6 Capacitor/Varistor Goldsworthy equivalent model
MOV
Bypass Switch
Capacitor
Damping Circuit
39
2.2.2.1 Principle of Operation Fig. 2-5 shows a typical series capacitor protected by the MOV scheme consisting of the basic
following elements: the MOV, the damping circuit, and the by-pass switch. The MOV protection is
connected directly in parallel with the series capacitor that it is protecting. The non-linear resistance
characteristic of the MOV material shown in Fig. 2-7 makes it ideal for direct connection to the
capacitor [9] and for voltage limitation. According to Goldsworthy model [9], the apparent
impedance of the SC and MOV combination, as a function of the current flowing in the line can be
represented in the equivalent circuit shown in Fig. 2-6. The series impedance model is shown in Fig.
2-8, where the resistance and the capacitive reactance are nonlinear and are a function of
normalized capacitor bank current ILN expressed in per unit, where one per unit IL is the capacitor
bank rms current rating at which the MOV begins to conduct [4]. Therefore, for bank currents
below the SC protective level (“The protective level is the level of fault current at which MOV start
conducting” [14]), the series circuit is a constant capacitive reactance which equates to its full SC
rating. The moment the MOV protective level is exceeded, the MOV current will increase rapidly as
shown in Fig. 2-7. At this point the effective circuit series impedance decreases and the current is
diverted from the SC to the MOV. Now when currents much larger than the protective level flow
through the MOV, the capacitive reactance gets less than 5% of its rated value but there is still a
small value of the capacitive reactance component within the resistor/capacitor arrangement [4].
MOV CHARACTERISTIC
0
0.2
0.4
0.6
0.8
1
1.2
0 10 20 30 40 50 60 70
Imov (kA)
Vm
ov (p
u of
pr0
tect
ed
leve
l)
V - I
Figure 2-7 Non-linear resistance characteristic of the MOV
Peak SC Protective Voltage
40
Figure 2-8 Non-linear Resistance and Reactance of the Varistor-Protected Series Capacitor Bank as a Function of Normalized Bank Current [23]
In the event of a power system fault, the excessive high currents will flow though the SC causing
the MOV to conduct and absorb energy. When the maximum allowable MOV energy threshold is
reached, the bypass switch will be operated by closing, thus, completely bypassing the series
capacitor and the MOV connected in parallel to it. The damping circuit that is connected in series
with the triggered bypass gap consists of a current limiting reactor, a resistor and a varistor in
parallel with the reactor as illustrated in Fig.2-9, and has the following purpose: the resistor is there
to add damping to the capacitor discharge current and thus quickly reduces the voltage across the
capacitor after bypass operation, while the varistor is utilized for the purpose of avoiding the
fundamental frequency losses in the damping resistor during steady state operations [5].
Figure 2-9 Typical Damping Circuit Arrangement
Resistor
Reactor
Varistor
41
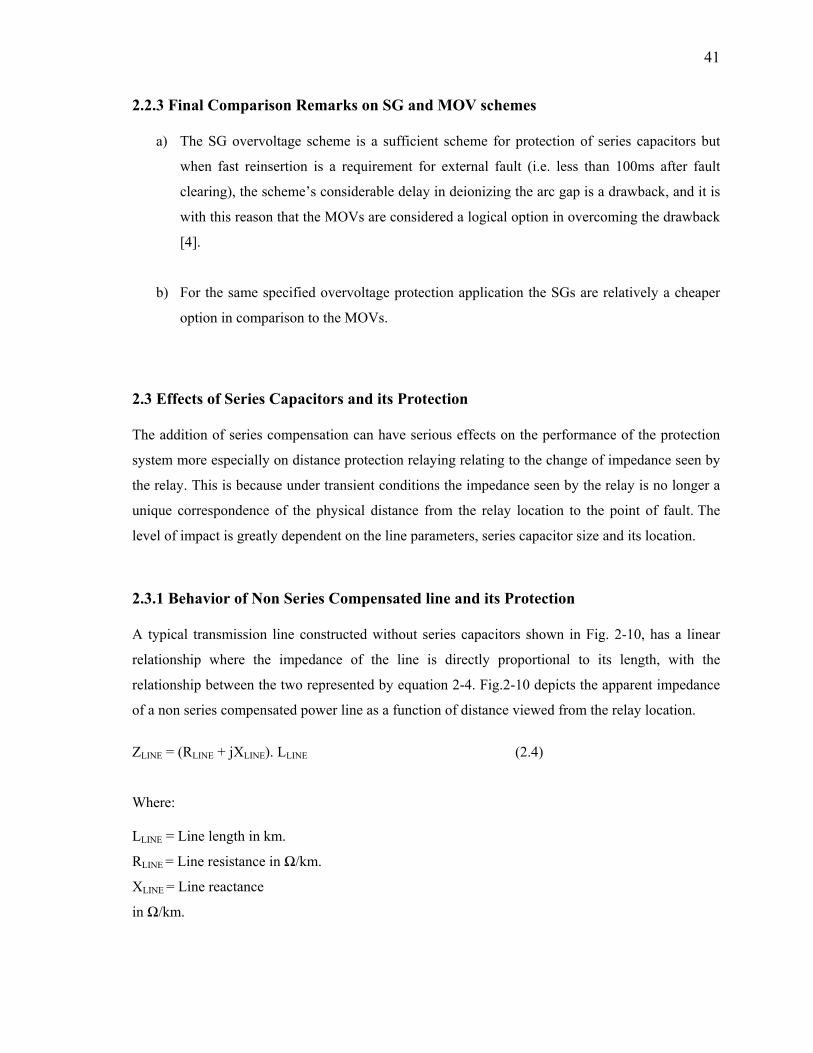
2.2.3 Final Comparison Remarks on SG and MOV schemes
a) The SG overvoltage scheme is a sufficient scheme for protection of series capacitors but
when fast reinsertion is a requirement for external fault (i.e. less than 100ms after fault
clearing), the scheme’s considerable delay in deionizing the arc gap is a drawback, and it is
with this reason that the MOVs are considered a logical option in overcoming the drawback
[4].
b) For the same specified overvoltage protection application the SGs are relatively a cheaper
option in comparison to the MOVs.
2.3 Effects of Series Capacitors and its Protection The addition of series compensation can have serious effects on the performance of the protection
system more especially on distance protection relaying relating to the change of impedance seen by
the relay. This is because under transient conditions the impedance seen by the relay is no longer a
unique correspondence of the physical distance from the relay location to the point of fault. The
level of impact is greatly dependent on the line parameters, series capacitor size and its location.
2.3.1 Behavior of Non Series Compensated line and its Protection A typical transmission line constructed without series capacitors shown in Fig. 2-10, has a linear
relationship where the impedance of the line is directly proportional to its length, with the
relationship between the two represented by equation 2-4. Fig.2-10 depicts the apparent impedance
of a non series compensated power line as a function of distance viewed from the relay location.
ZLINE = (RLINE + jXLINE). LLINE (2.4) Where: LLINE = Line length in km.
RLINE = Line resistance in Ω/km.
XLINE = Line reactance
in Ω/km.
42
Figure 2-10 Apparent Impedance for Non Series Compensated lines
Predominantly the power transmission lines are inductive, as a result, the internal fault currents in
such a network will cause phase currents flowing from a terminal into a protected line to lag the
source voltage, with the assumption that the reference direction of the relay currents is from the
busbar into the protected line. The phenomenon is illustrated in Fig.2-11. In most cases phase
comparison systems usually take the in-phase currents for internal faults and out-of-phase for
external faults. Now with the introduction of SC in the system, this can change these basic
relationships known to protection relaying, more especially for faults before and after the SC that
can give rise to voltage and current reversals [5]. Voltage and current reversals are the two
problematic phenomena that challenge the relay logic in positively identifying faults on the
transmission line [4]. As a result the reliability and security of the distance protection relaying is
compromised.
X Primary Ohms
R Primary Ohms
43
Figure 2.11 Fault Currents in Non Series Compensated lines [5]
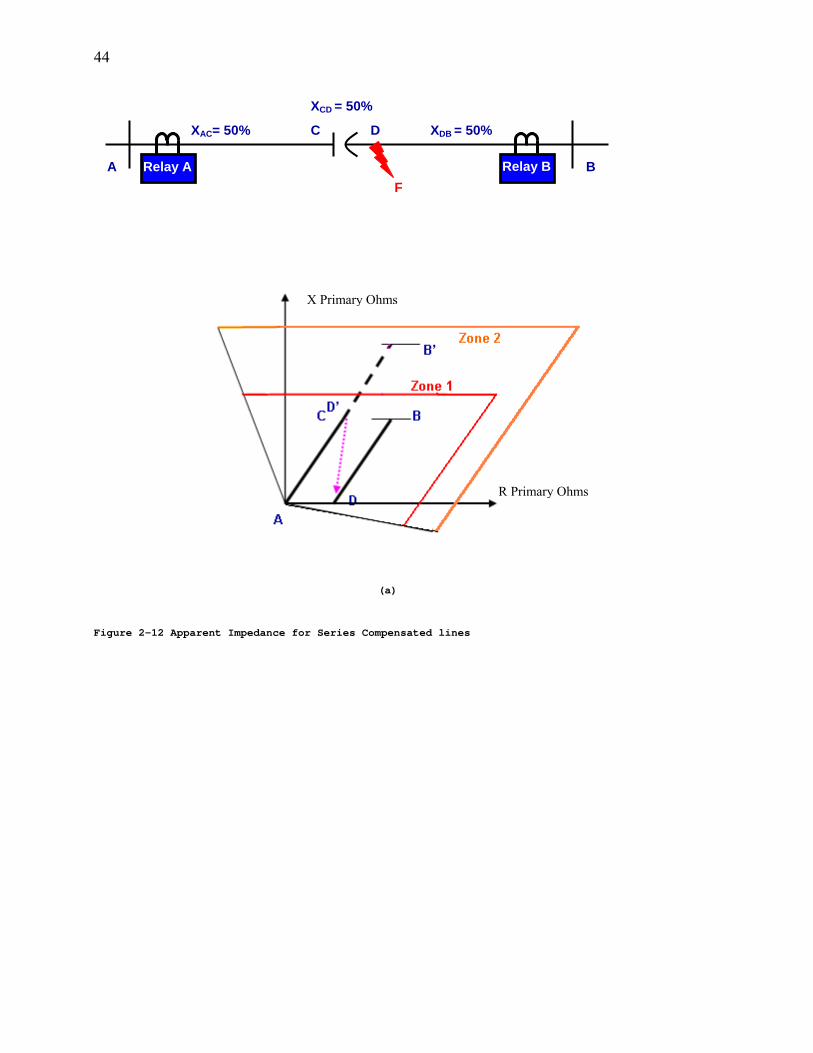
2.3.2 Behavior of Series Compensated line and its Protection Fig.2-12 (a) and (b) illustrate the apparent impedance seen by the relay at position A when a 50%
and 60% of series compensation is applied at the middle and end of the line respectively. Faults
beyond the SCs appear to be closer when a 50% SC is not completely bypassed while for the 60%
series compensation at the end of the line, the relay sees the fault in the reverse direction, as a result,
the under-reaching elements of the distance relay ‘Zone1’ operate erroneously for faults outside its
reach. This is because the impedance seen by the relay is no longer a unique correspondence of the
physical distance from the relay location to the point of fault.
44
(a)
Figure 2-12 Apparent Impedance for Series Compensated lines
XCD = 50%
XAC= 50% XDB = 50%
B A
C D
Relay A Relay B F
X Primary Ohms
R Primary Ohms
45
Figure 2-12 (continued) Apparent Impedance for Series Compensated Lines
2.3.3 Voltage Inversion Voltage inversion is defined as the change of the voltage phase angle by 180 degrees [15]. With
reference to a transmission line depicted in Fig. 2-13 below, when assuming that the SC overvoltage
protection is not conducting, the voltage inversion phenomena can be represented by equation 2.5.
XLA < XC < (XLA + XSA) (2.5)
XCD = 60%
XDB = 100%
B A
C D
Relay A Relay B
(b)
F
X Primary Ohms
R Primary Ohms
46
Figure 2-13 Voltage Inversion Phenomenon [5] The phenomenon occurs as a result of the relay at Substation A, looking forward into the line and
seeing the impedance to the point of fault as capacitive (XC > XLA) rather than inductive (XC < XLA),
causing the voltage measured at the relay point to be capacitive (i.e. the fault current leads the
measured voltage at relay A by 90˚)
Referring to Fig. 2-13, a three phase fault just in front of the SC, if we assume the arrangement of
(XC > XLA), VA and VA’ voltages will be 180 degrees out of phase, with VA’ being the normal
voltage for forward faults and VA voltage reversed in reference to VA’ voltage [15]. This means for
a fault condition depicted in Fig. 2-13, in order for the distance protection relays located at
Substation A to correctly identify the fault for what it is, a forward fault, then line side voltage data
VA’ should be utilized by the relay. The phenomenon is thus referred to as voltage inversion and or
voltage reversal, as the relay will proclaim a reverse fault on the adjacent line as a forward fault if
VA bus side voltage is used.
47
2.3.4 Current Inversion The phenomenon occurs on series compensated lines when a line experiences an internal fault as
depicted in Fig. 2-14, with one side of the equivalent system from a point of fault being capacitive
(i.e. left side of fault in Fig. 2-14, when (XSA < XC)), and the other equivalent system side (right side
of fault in Fig. 2-14) being inductive.
Figure 2.14 Current Inversion Phenomenon [15]
With bus “B” system section being inductive, current IB will lag voltage VB by 90 degrees, while the
bus “A” system section is capacitive, current IA will lead voltage VA by 90 degrees. As a result the
two currents will be 180 degrees out of phase. It goes without saying that this will create problems
for distance protection relaying, since when declaring an internal fault both currents need to be in
phase [5, 15, 24].
Current reversals are associated with high degrees of line compensation that result in high fault
currents [4]. The problem is easily resolved by the mere utilization of SC overvoltage protection
devices (MOVs and SGs) discussed in Section 2.2. Under high current line fault conditions the
overvoltage protection device will conduct and absorb energy in case of “MOV”, and when the
voltage across the series capacitor exceeds a threshold value, the SC will be completely bypassed by
the overvoltage protecting devices connected parallel to it. In reference to Fig. 2-14 setup, this
48
action will cause the capacitor reactance to be reduced and or even removed, as a result the SC
system section becomes inductive and completely eliminating the possibility of the current reversal
phenomenon.
On this note, this makes the current inversion phenomenon a highly unlikely occurrence in
compensated networks. However, in cases of high resistance faults, the low fault currents will
prevent the overvoltage series capacitor protection devices from operating, hence, allowing the
occurrence of the current inversion phenomenon.
49
CHAPTER III 3. System Under Study 3.1 System Layout Fig. 3-1 shows the expanded Hydra South Network section with relays under investigation. The rest
of the entire Eskom Hydra South Network is as shown in Appendix B. The system supplies power
to the Western Cape and is interconnected between two power stations, these being Koeberg a
strong source and Hydra a weak source. It encompasses a couple of long heavily series
compensated 400 kV transmission lines, which include Bacchus-Proteus, Proteus-Droerivier and
Muldervlei-Droerivier lines. The mentioned lines have a great impact to the performance of the
relays under investigation which are located at Muldervlei-Bacchus line, a non-series compensated
109km long 400kV transmission line, with the second relay located on the Bacchus-Droerivier line,
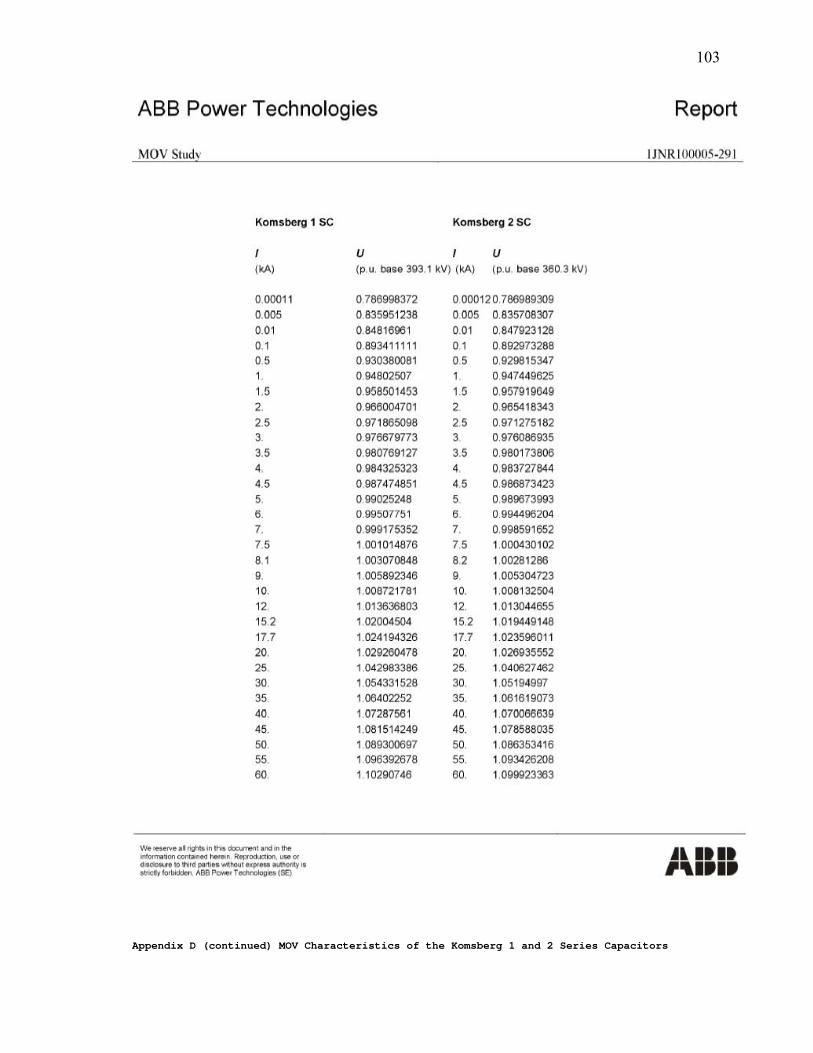
a 402km long and 60% series compensated 400kV transmission line. The MOV characteristics of
the series compensated lines of the area of focus for the studies of this research are shown in
Appendix D.
Figure 3-1 Hydra South Network section with fault positions and relays under investigation [14]
FG
50
The network topology was modeled on the Digsilent PowerFactory simulator with every line
represented using lumped parameter model. This was because when investigating setting
calculations and relay performance analysis, lumped model of the line parameters is normally
sufficient and very much recommended by Eskom System Operator. All line series capacitors
which included their over-voltage MOV protection were modeled as closely as possible to what is
on the field. The only setback in the PowerFactory simulator as far as SCs are concerned, is that the
model does not include the SC bypass breakers. Thus, for the objectives of this dissertation, the
bypass breakers were modeled manually across the SCs for the purposes of analyzing performance
of the relays if the SCs were completely bypassed during dynamic fault conditions. The SC bypass
breaker relay model was designed utilizing the Digsilent Simulator Language (DSL) function in
PowerFactory to simulate the bypassing of both the SC and the MOV when the maximum MOV
energy threshold is reached.
Also the entire network could not be modeled on the student version package that was utilized for
these studies as the package is limited to a specific number of nodes/buses (31) that can be
simulated. Some of the network sections were replaced with an equivalent Thevenin circuit in a
form of external grids, these included: all plant behind the Hydra busbar; all plant behind the
Koeberg busbar and all plant behind the Palmiet busbar including the Palmiet – Bacchus line; the
set up is illustrated in Appendix C.
The protection in the Muldersvlei – Bacchus (Mul-Bac) and Bacchus – Droerivier (Bac-Dro) lines
in the studies made use of the Digsilent model of the REL 531 distance protection relays.
Lastly relay zone impedance reach settings were also performed in accordance to the Eskom’s
System Operator distance relay protection setting philosophies. This was for the purposes of
analyzing the impact of SC on the performance of the relays as faithfully as possible to conditions
that would be experienced in the field.
51
3.2 Studies Performed In answering the research question the relays on the Mul-Bac and Bac-Dro lines were selected as
the area of focus. The decision to select these two particular mentioned lines as the area of focus
was because the studies will be able to cover impact to both the performance of the relays with lines
that are series compensated and those that are not.
The performance of the relays was analyzed by applying faults at point F and G in the study case
model to simulate and analyze the impact of series compensation on the relays located at
Muldersvlei and Droerivier for faults before and after series capacitors respectively. Point ‘F’ is
immediately behind the Bacchus series capacitor bank in the adjacent Bacchus – Proteus (Bac-Prot)
line as illustrated in Fig. 3-1. Point ‘G’ is immediately in front of the Bacchus series capacitor bank,
terminated on the Bacchus busbar. For faults located at these points immediately before and after
the SC (again refer to Fig. 3-1), the relays on the Mul-Bac and those at Bac-Dro lines are
not supposed to operate for these faults. However, due to the phenomenon mentioned in Section 2.3,
such a fault (point F) could appear in zone 1 of the relay at either Muldersvlei or Droerivier. On the
EMT dynamic study analysis performed, which were focusing mainly on the network topology
shown in Fig. 3-1, the results conveyed that not only does such a probability exist, but that the fault
would appear behind the relay at Muldersvlei [1] and at Droerivier, while for a fault located at point
G, the underreaching zone elements at Muldersvlei and Droerivier could not see this fault.
3.3 Relay Setting Calculations In the studies performed, all the settings were calculated utilizing a REL 531 setting calculating
programme developed by ref. [20]. This programme utilizes the primary side line parameter data
and converts this information into secondary data, the programme than uses this converted data to
calculate the relay settings, while at the same time caters for the limitations discussed in section 1.5.
The normal recommended settings were first calculated on the program for each line of focus in the
research without concern for the effects of the limitations within the line to be protected itself and or
on adjacent lines. In each case of the lines under investigation, these being Mul-Bac and Bac-Dro
lines, this meant that the zone 1 reach of the relays was set to 80% of the line length. The
programme than allowed the settings to be calculated catering for the limitations which in the case
of the Bac-Dro line, the zone 1 reach setting was reduced as the line is series compensated, this
action was taken to cater for the subharmonic oscillations caused by series capacitors under fault
52
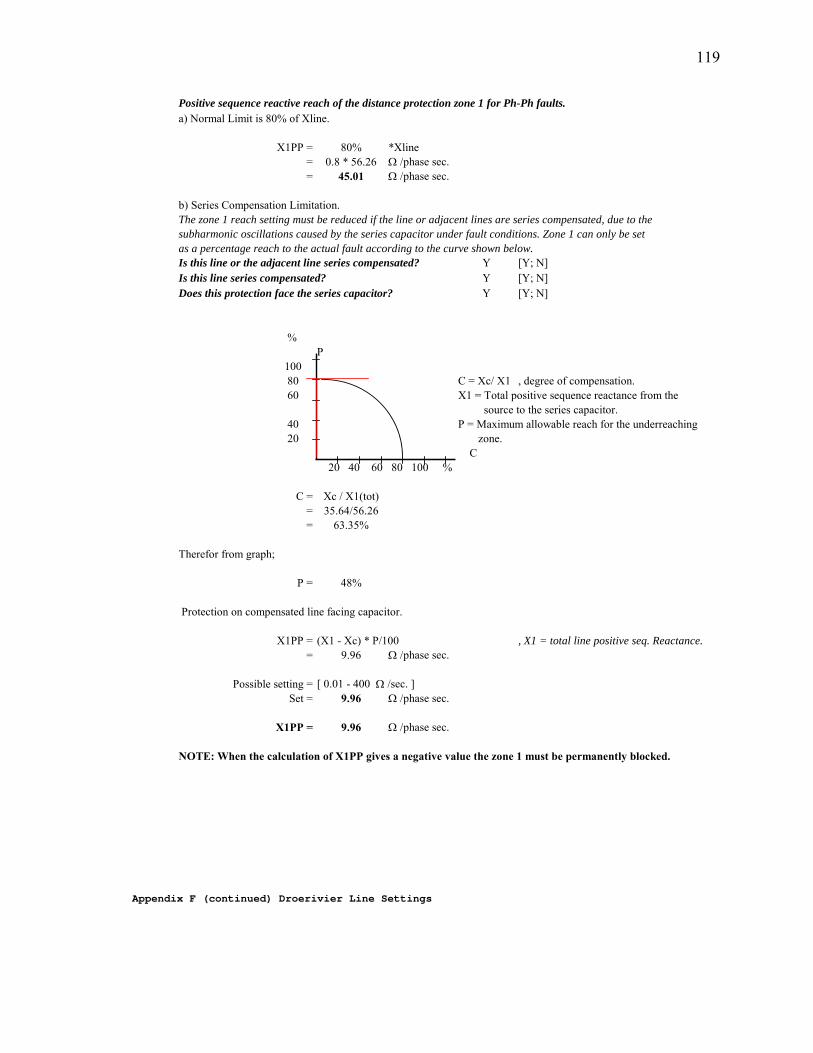
conditions. Zone 1 was then set as a percentage reach to the actual fault according to the
safety margin curve for zone 1 setting shown in Fig. 3-2.
Figure 3-2 Safety margin for zone 1 setting [20]
Where: C = Xc/X1, degree of compensation
X1 = Total positive sequence reactance from the source to the series capacitor
P = Maximum allowable reach for the underreaching zone.
C = Xc/X1 P is read from graph in reference to C Zone 1 reach = (X1 – Xc)*P/100
Note: The reach equates to 17.89% of the (Bac-Dro) physical uncompensated line reactance.
53
The setting programme therefore gives more than one set of setting results, one that’s catering for
normal case situation and followed by a result for each and every limitation that the system is
affected by. In the case of the investigation for the objectives of this document, only the normal case
setting and series compensation limitations discussed in section 1.5.2 were considered. Adequate
zone 1 settings were then selected within the calculated options on the basis that the reach setting
must not be less than the minimum requirement (20 ohms) and also ensuring maximum possible
resistive reach coverage (50 ohms) for the high resistance faults while at the same time making sure
that the zone reaches do not encroach on the load. The same principle was followed for the setting
of zone 2. The calculated line settings for Mul-Bac line are shown in Appendix E, while those of
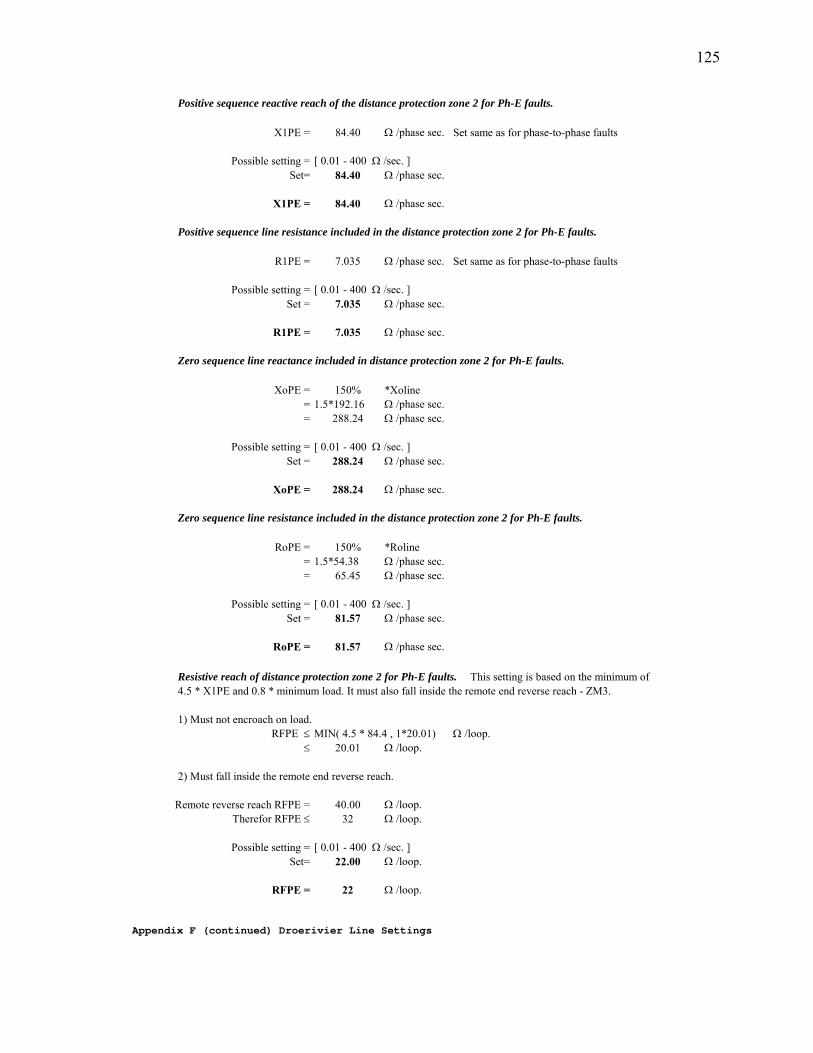
Bac-Dro line are shown in Appendix F, both settings are also summarized in Table 3-1 and Table 3-
2 respectively. Fig. 3-3 and 3-4 demonstrate how the above relay calculated settings are configured
on the Digsilent Power Factory program.
Primary Secondary Primary Secondary
X1PP 26.82 11.80 40.48 17.81 Ω/ph
R1PP 2.14 0.94 3.20 1.41 Ω/ph
RFPP 45.45 20.00 50.00 22.00 Ω/loop
TPP 0.00 0.00 0.40 0.40 S
X1PE 27.00 11.88 40.48 17.81 Ω/ph
R1PE 2.14 0.94 3.20 1.41 Ω/ph
X0PE 96.61 42.51 144.91 63.76 Ω/ph
R0PE 26.73 11.76 40.11 17.65 Ω/ph
RFPE 45.45 20.00 50.00 22.00 Ω/loop
TPE 0.00 0.00 0.40 0.40 S
Parameter
Positive sequence reactive reach of the distance protection zone 1 for Ph-Ph faults.Positive sequence line resistance included in the distance protection zone 1 for Ph-Ph faults.Resistive reach of the distance protection zone 1 for Ph-E faults.
Zone 1 Zone 2Unit Discription
Time delayed trip operation of the distance protection zone 1 for Ph-Ph faultsPositive sequence reactive reach of the distance protection zone 1 for Ph-E faults.
Zero sequence line resistance included in the distance protection zone 1 for Ph-E faults.Resistive reach of the distance protection zone 1 for Ph-E faults.Time delayed trip operation of the distance protection zone 1 for Ph-E faults
Positive sequence line resistance included in the distance protection zone 1 for Ph-E faults.Zero sequence line reactance included in distance protection zone 1 for Ph-E faults.
Table 3-1 Summarized Mul-Bac line Relay Settings [19]
54
Primary Secondary Primary Secondary
X1PP 22.64 9.96 191.80 84.39 Ω/ph
R1PP 8.64 3.80 15.99 7.04 Ω/ph
RFPP 45.45 20.00 50.00 22.00 Ω/loop
TPP 0.00 0.00 0.40 0.40 S
X1PE 22.64 9.96 191.82 84.40 Ω/ph
R1PE 8.64 3.80 16.00 7.04 Ω/ph
X0PE 272.98 120.11 655.09 288.24 Ω/ph
R0PE 77.48 34.09 185.39 81.57 Ω/ph
RFPE 45.45 20.00 50.00 22.00 Ω/loop
TPE 0.00 0.00 0.40 0.40 S
DiscriptionParameter Zone 1 Zone 2
Unit
Positive sequence reactive reach of the distance protection zone 1 for Ph-Ph faults.Positive sequence line resistance included in the distance protection zone 1 for Ph-Ph faults.Resistive reach of the distance protection zone 1 for Ph-E faults.Time delayed trip operation of the distance protection zone 1 for Ph-Ph faults
Resistive reach of the distance protection zone 1 for Ph-E faults.Time delayed trip operation of the distance protection zone 1 for Ph-E faults
Positive sequence reactive reach of the distance protection zone 1 for Ph-E faults.Positive sequence line resistance included in the distance protection zone 1 for Ph-E faults.Zero sequence line reactance included in distance protection zone 1 for Ph-E faults.Zero sequence line resistance included in the distance protection zone 1 for Ph-E faults.
Table 3-2 Summarized Bac-Dro line Relay Settings [19]
Figure 3-3 Zone 1 Phase to Phase Muldersvlei Relay window setting display
55
Figure 3-4 Zone 1 Phase to Earth Muldersvlei Relay window setting display
[)'5Ianc:e Polygon Muldersvle,\Cub _4\Mul Hac: Relay 400 kV\Z1G. Re\D,spoly rz:JL8J B .,~ic Ddi> I Descriplion I I "' I I E C 5 vmI:>oI Z « ANSI 5vm1:>o1: " Z~ , U~ E .... th ,-- I Ch", oocteristic ABB (RX)
I "- ID "-~ ,~ ..=J Libr",.,.\FtEL 531\zlG I r Out 0/ Service
T ripping Direction I Forw .... d 3 Directicor-..ol Unit I X>~ 111 .00 ::±I sec Ohm 27_ pO_Ohm
"'~ 1094 ::±I sec.Ohm 2_136J>.4 pri.Ohm
""~ pOCO ::±I sec.Ohm 45.45454 pri.Ohm
X~ 142 5 1 ::±I sec.Ohm 96_61363 pri.Ohm
"~ 11176 ::±I sec.Ohm 26_72727 pri.Ohm
Irnpedi>nce~
LinelBr...-.ch R. X 1_09302 sec .Ohm 15_68611 ~ec .Ohm
Cub_4\Mul - Bac Relay 400 kV Mul - Bac Relay 400 kV\Z1GImpedance AImpedance BImpedance C
Mul - Bac Relay 400 kVZ A 8.454 + j 63.751 pri.OhmZ B -373.436 - j 183.617 pri.OhmZ C -386.531 - j 3.135 pri.OhmZ(s) A 8.454 + j 63.751 pri.OhmZ(s) B -373.436 - j 183.617 pri.OhmZ(s) C -386.531 - j 3.135 pri.OhmZ(1) A 3.541 + j 31.583 pri.OhmZ(1) B 72.464 - j 60.963 pri.OhmZ(1) C -66.503 - j 20.732 pri.OhmFault Type: ATripping Time: 0.4441248 sZone 2 Z2G: 0.4441248 s
Mul - R-X Plot (SLG)
Date: 11/7/2009
Annex: Figure 3-6 Response of relay at Muldersvlei for a SLG fault in front of the SC
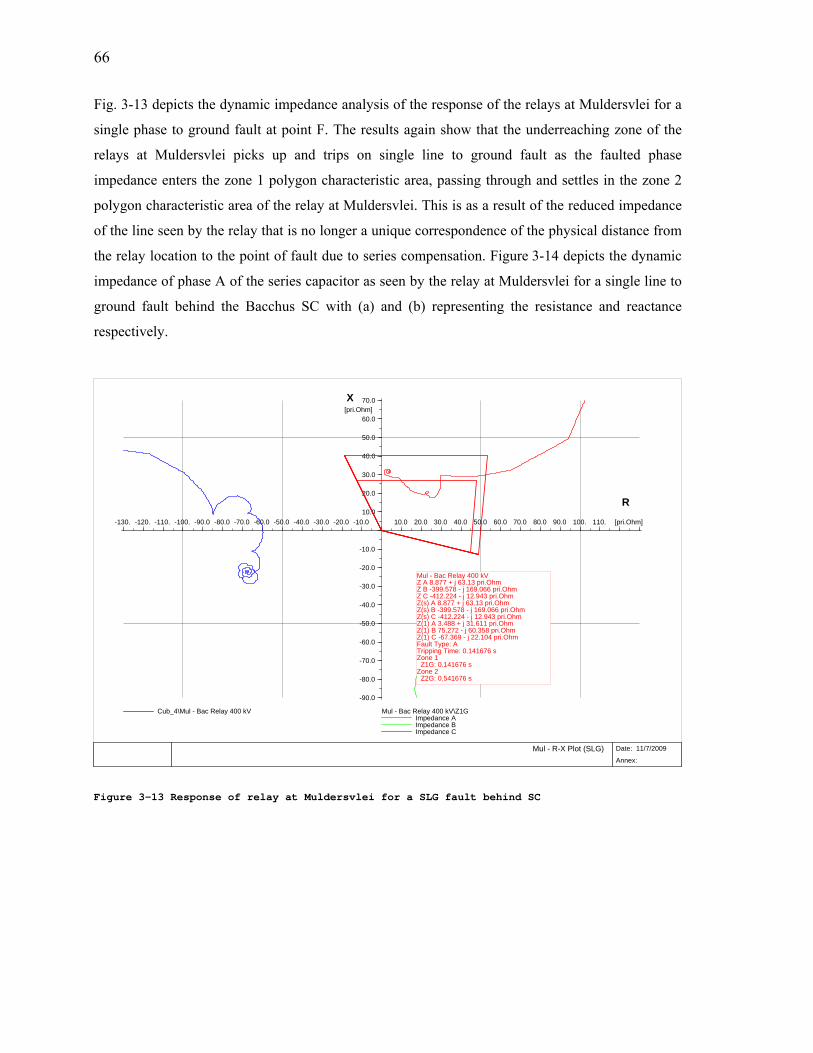
Fig. 3-6 depicts the dynamic impedance analysis of the response of the relay at Muldersvlei for a
single phase to ground fault at point G. The results again show that the underreaching zones of the
relay at Muldersvlei do not “see” the fault in their reach for a single phase to ground fault as the
faulted phase impedance does not enter the zone 1 polygon characteristic area, hence the zone 1
elements not tripping for this fault. However, also as in the case of the three phase fault, the zone 2
reach elements do see the fault, as a result, the fault is cleared in zone 2 time.
X
R
58
3.5 Response of Relay at Droerivier for a fault at ‘G’ As for the studies performed at Muldersvlei for a fault at point G, similarly, PowerFactory simulator
was utilized to perform a study of investigating the impact of series compensation on the
performance of distance protection of the transmission lines and this time focusing on the
Dro - Bac Relay 400 kVZ A 38.558 + j 132.889 pri.OhmZ B -1153.71 - j 222.915 pri.OhmZ C 484.013 - j 466.991 pri.OhmZ(s) A 38.558 + j 132.889 pri.OhmZ(s) B -1153.71 - j 222.915 pri.OhmZ(s) C 484.013 - j 466.991 pri.OhmZ(1) A 15.545 + j 35.567 pri.OhmZ(1) B 30.752 - j 84.847 pri.OhmZ(1) C -100.725 - j 8.743 pri.OhmFault Type: ATripping Time: 0.1580779 sZone 1 Z1G: 0.1580779 s
Bac - R-X Plot (Bac-Dro)
Date: 9/27/2009
Annex: Figure 3-17 Response of relay at Droerivier for a SLG fault behind the SC
Fig. 3-17 depicts the dynamic impedance analysis of the response of the relays at Droerivier for a
single phase to ground fault at point F. The results, similarly to the case of a three phase fault at the
same fault location, show that the underreaching zone of the relay at Droerivier picks up and trips
on single line to ground fault as the fault phase impedance locus enters the zone 1 reach
characteristic area, passing through and settling in zone 2 characteristic area. This is as a result of
the reduced impedance of the line seen by the relay at Droerivier that is no longer a unique
correspondence of the physical distance from the relay location to the point of fault due to series
compensation. Fig. 3-18 depicts the dynamic impedance of phase A of the series capacitor as seen
by the relay at Droerivier for a single line to ground fault behind the Bacchus SC with (a) and (b)
representing the resistance and reactance respectively.
It is also noted that despite the decision taken to reduce the reach setting of the underreaching zone
1 elements of the relay at Droerivier from the normal setting of 80% of the Bac-Dro line, for the
purposes of catering for the negative reactance that is introduced by the Komsberg 1 series
capacitors, in both fault studies performed (SLG and three phase faults behind the Bacchus SC), the
under reaching zone 1 still overreaches. To try and overcome this setback, reducing the zone 1
reach setting even further would not add value, since the fault impedance loci invades most of the
X
R
72
zone 1 characteristic area. It is with this reason that again the author recommends that the zone1
reach for the Droerivier relay be switched off.
(a) Resistance
(b) Reactance
Figure 3-18 Single Phase Impedance seen by the relay at Droerivier for SLG fault
behind the Bacchus SC
73
CHAPTER IV 4. Current Supervised Zone 1 4.1 Background Current supervised zone 1 is a distance protection relaying configuration that has recently been
introduced to some Eskom series compensated networks. This is one way that was developed in
trying to overcome the setback of incorrect trips on series compensated networks as a result of
subsynchronous oscillations, voltage and current inversion phenomena due to series compensation
within and or adjacent distance relaying protected lines.
Before CSZ1 configuration was considered for Eskom distance protection in order to overcome
instances where reduced reach settings were not possible, the under reaching zone 1 reach elements
had to be disabled altogether. However this option has a defect, since instantaneous tripping for
faults falling within the zone 1 reach of the protected line can then only be achieved via the aid of
telecommunication: if there should be failure in the communication channels, which is a probability,
this would mean that the faults could then only be cleared in the zone 2 time delay of 400ms.
Needless to say, that this again is unacceptable in Eskom transmission.
4.2 Current Supervised Zone 1 Operating Philosophy Fig. 4-1 depicts a magnified Hydra South Network with a relay under investigation, which was
studied to explain the ideology of the CSZ1 operating philosophy. This particular network was
considered as a case study to explain the CSZ1 philosophy because this is an example of the kind of
line where the philosophy has already been proven in [14] to work. This figure also shows a vector
diagram of a SC conveying the high negative reactance that gets magnified by network infeed
viewed by the relay protecting lines associated with SC. The effect is that the impedance locus falls
within the zone 1 characteristic area of the relay at Muldersvlei for an external fault behind the SC
at Bacchus. This has been proven by [14] especially for series capacitors located at midpoint of the
line with MOV overvoltage protection out of service.
74
Figure 4-1 CSZ1 Impedance Vector Diagram [14]
The “Current supervised zone 1” philosophy works on condition that the MOV is conducting, by
monitoring the fault current seen by the relay since the MOVs only conduct when there is sufficient
current flowing through the SC. The conduction of MOVs during fault occurrence changes the
impedance measured by the relays in the surrounding network, and this is the exact phenomenon
with which the CSZ1 configuration is based upon. First step is to select the ‘current level setting’
with which the reach setting of zone 1 can be adjusted to in covering faults that would deliver the
required fault current [14].
This current level setting by principle should not be less than 150% of the protective level of SCs
electrically closest to the protected line. This selection equates to 150% of twice the full load rating
of the SC [21]. The decision to use a standard current level setting of 150% of the MOV protective
level, was an engineering decision by [14] based on the physical behavior of a conducting MOV
discussed in section 2.2.2.1: that when bank currents much larger than the ‘protective level’ flow
through the MOV, the capacitive reactance in the ‘series R-X model’ is reduced to less than 5% of
its rated value, resulting in the circuit becoming mostly resistive. The impact is however reduced at
lower currents flowing through the SC.
Fault Impedance position with MOV in service (SC bypassed)
Fault impedance position with MOV out of service
75
Now since the CSZ1 configuration’s successful operation is based on the MOV conducting enough
current to ensure SC bypass, a current level setting of 150% of the SC’s protective level selected
was shown to be sufficient on studies conducted by [14] to ensure that the MOVs are conducting. In
some cases, such conduction of the MOV has been shown to be sufficient to ensure SC bypass, as a
result causing the fault impedance locus to settle far away from the zone 1 characteristic area as
illustrated in Fig. 4-1 and Fig 4-3. In Fig. 4-1, XCEFF represents the effective reactance of the SC and
its conducting MOV when the MOV is in service, while XC represents the negative reactance of the
SC. The actual value of reactance (XCEFF) that the SC and the MOV together end up settling at, is
greatly influenced by the fault current level [14].
To commit to a particular zone 1 reach setting to which zone 1 can be adjusted to in covering only
for in-zone internal line faults, the procedure is to calculate RMS fault currents by simulating faults:
(1) immediately in front of the measuring transformers; (2) at 80% of the line or in front of the SC if
the line is mid-series compensated and (3) behind the electrically closest capacitors, with priority
placed on the capacitors with the highest protective level. The rationale is that the protective level
must ensure that in any system configuration, the impedance loci must not enter the instantaneous
underreaching zone of relays under investigation with security margin for any fault behind SCs.
EMT simulation studies are required when calculating these fault currents. This is because the
studies conducted in EMT mode, also put into consideration the effect of subsynchronous
oscillations and damping effects of the nonlinear MOVs [14]. Unfortunately, Digsilent
PowerFactory simulator does not calculate EMT RMS fault currents.
However, the relays modelled in Digsilent PowerFactory get only the voltages and currents
measured by the respective line measuring transformers, regardless whether one calculates EMT
simulations or static short circuits studies [29]. So, since Digsilent PowerFactory is able to calculate
RMS fault currents when conducting studies in static short circuit mode, static short circuit studies
were conducted to calculate the fault currents on the above mentioned locations within the network
section of interest shown in Fig. 3-1. The calculated fault currents were then evaluated relative to
the current level setting selected, to which the reach setting of zone 1 can be adjusted to (examples
will be shown in the next sections), in ensuring that the distance protection only issues high-speed
tripping for in-zone internal line faults (assuming that when MOV is fully conducting for external
faults behind the SC, the fault impedance loci will settle outside the instantaneous underreaching
zone 1). It was however assumed on simulation studies conducted that since the MOV is inserted on
the line associated with the relays under investigation: the current the relay will “see” will be
76
reduced by the conduction of the MOV, with the impact extent to the relay calculations greatly
dependent on the size and placement of the MOV relative to the measurement transformers.
On investigating the probability of utilizing the CSZ1 configuration to eliminate the impact of series
compensation on the performance of the distance protection for the relay at Droerivier, the
following static short circuit studies were performed to attain the RMS fault currents on the network
depicted in Fig. 4-10. On the studies performed, first the current level setting was selected to be
4.44kA (i.e. 150% of the Bacchus SC MOV protective level). The fault current seen by the relay
just after the CTs at Droerivier was found to be 11.8kA and at 50% of the line, just in front of the
Komsberg 1 SCs, was found to be 1.59kA. These fault level currents were recorded from the relay
when the system was running in normal system configuration.
Now if the CSZ1 logic were to be used, then whenever the zone 1 elements see a current of greater
than 4.44kA they will pick up and trip instantaneously as this will mean the fault is between
Droerivier bus and approximately 25% reach of the protected line. The decision to reduce the zone
1 reach to 25% of the line was as a result of the Bac-Dro line fault currents beyond the 25% reach
point dropping below the selected current level setting (4.44kA). But also for a fault just behind the
Bacchus SC, where the current seen by the relay equates to 5.9kA and is greater than the current
level setting, this will cause the MOVs to conduct causing the impedance locus to settle right inside
the zone 1 characteristic reach area as depicted in Fig.4-10. Based on the CSZ1 logic illustrated in
Fig. 4-4, as in the case of the Muldersvlei relays, the Droerivier relay will also still overreach for
faults behind the Bacchus SC. This is because the logic governing inputs of the fault at this location
meet the two conditions that will cause the instantaneous trip operation of the relay. As a result, the
CSZ1 configuration will therefore also in this case not be a suitable solution.
Likewise, as in the case of Muldersvlei relay, even if the evaluation of currents on the application of
CSZ1 configuration on distance protection of the relay at Droerivier were to be disregarded for
reasons already discussed, the actual fault study shown in Fig. 4-9 was conducted in full EMT mode
and the results showed that for a fault immediately behind the Bacchus SC when the MOV is
conducting, the reactance of the SC is reduced sufficiently such that the impedance loci is seen
passing through the instantaneous reaching zone 1, resulting in the incorrect relay operation for an
out of zone fault.
Moreover, if we compare the performance of the relay at Muldersvlei for a fault immediately
behind the Komsberg 1 SC (a series capacitor located at the center of the adjacent line of the one
being protected), and that immediately behind the Bacchus SC (a series capacitor located on the
busbar of the adjacent line of the one being protected). The impedance trajectories on simulation
86
studies conducted, showed that the performance of the distance protection is indeed influenced by
the location and size of the SCs.
87
CHAPTER V 5. Conclusion It was shown that series capacitors do not have an impact on the performance of the distance
protection relaying when a fault in an adjacent line is in front of the series capacitor. This was a
conclusion reached based on the analytical and dynamic studies that were performed, where for
faults immediately in front of the Bacchus series capacitor, the studies showed that the under
reaching zone 1 elements at Muldersvlei and Droerivier do not “see” the fault in their reach. On
both the three phase and single phase to ground faults, the impedance locus was not seen entering
the zone 1 polygon characteristic area of these relays, but was settling in the zone 2 characteristic
area which by principle is correct, since the section in front of the Bacchus series capacitor is
covered on backup protection of zone 2 reach of both the relays at Muldersvlei and Droerivier.
However, in the case of the Droerivier relay for both single phase to ground and three phase faults,
it was noted that the fault impedance locus was passing very close to the underreaching zone 1, and
well inside the over-reaching zone 2. This conveyed the importance of the decision that was taken
to reduce the reach setting of the underreaching zone elements from the normal setting of 80%,
which was to cater for the negative reactance that is introduced by the Komsberg 1 series capacitor
on the Bacchus-Droerivier line. If the reach of zone 1 had not been reduced, the zone 1 element
would have overreached for the external faults in front of the Bacchus series capacitor due to the
impedance of the line no longer being a unique correspondence to the physical distance from the
relay location to the point of fault.
On the other hand for faults behind the external Bacchus series capacitor, the results shown agreed
with those presented in other research projects that have looked into the research question at hand,
but were utilizing the physical REL 531 relays and a real time model. The series capacitors do have
a great impact on the performance of the distance protection relays, when a line or adjacent lines are
compensated with series capacitors. The Muldersvlei to Bacchus line does not have series
capacitors but was affected by the series capacitor of the adjacent line for both three phase and
single phase to ground faults behind this external capacitor. This was a conclusion reached based on
the analytical and dynamic studies that were performed, for faults immediately behind the Bacchus
series capacitor. The studies showed that the under reaching zone 1 elements at Muldersvlei do
“see” the fault in their reach as for both the three phase and single phase to ground faults, the
88
impedance locus was seen entering the zone 1 characteristic area, picking up and tripping on these
elements.
Droerivier zone 1 reach setting was reduced before performing the studies to cater for the negative
reactance of the Komsberg 1 series capacitor within the Bacchus to Droerivier line. Needless to say
that the distance protection at Droerivier was affected the same way as the Muldersvlei relays for
both three phase and single phase to ground faults behind the Bacchus series capacitor on the
adjacent line.
In trying to overcome the setback of overreaching zone 1 elements as a result of subsynchronous
oscillations and voltage inversion phenomena due to the Bacchus series capacitors, the recently
introduced alternative configuration of the “current supervised zone 1” for Eskom distance
protection relays was reviewed as a possible solution. Based on the dynamic and analytical studies
performed, the current supervised zone 1 configuration was first shown to work when considering
the impact of series capacitors located at the midpoint of a line adjacent to the line being protected.
The analysis was looking at utilizing the current supervised zone 1 configuration to improve
security of the performance of the Muldersvlei relay for faults behind the Komsberg 1 series
capacitor. This line was selected as a case study because it is an example of the kind of line where
the current supervised zone 1 configuration philosophy has already been proven to work in previous
studies.
However, the current supervised zone 1 configuration was also shown not to provide a solution for
the relays at Muldersvlei and Droerivier for faults immediately behind the Bacchus series capacitor.
This is because the logic criterion that governs the instantaneous trip operation of the CSZ1
configuration of the relays at Muldersvlei and Droerivier were met, where for a fault immediately
behind the Bacchus series capacitor despite the MOV conducting, both relays under investigation
still did “see” the impedance locus in their instantaneous operating underreaching zone 1. Hence,
still the incorrect instantaneous trip operations of the relays for a fault on the adjacent line.
It is believed that current supervised zone 1 approach is not applicable to network configurations
that involve end of line or bus-bar series compensation as this configuration is more likely to create
the condition of voltage and current reversals. This is because there is no line impedance between
the relay location and the series capacitors. Moreover this also impacts the adjacent line protection
because of the negative reactance that is added to the adjacent line for faults behind the external
89
bus-bar SC, the higher the degree of line compensation the worse the impact effects to the distance
protection performance. To improve protection performance it is believed that transmission must do
away with bus-bar compensation and start implementing middle of line series compensation to all
of transmission networks.
It is thus the author’s conclusion and recommendation that: (1) for both the distance protection
schemes at Muldersvlei and Droerivier to maintain their security, the zone 1 reach elements are to
be disabled altogether, since zone 1 protection of the line will always overreach and operate
incorrectly for faults immediately behind the Bacchus series capacitor; (2) because of
subsynchronous oscillations and voltage inversion phenomena as a result of series compensation,
can cause distance protection directional elements to operate incorrectly, more specific to internal
faults which may appear as external faults and external faults which may appear as internal faults;
(3) to address the distance protection challenges associated with series capacitors, transient
simulations, protection applications and performance testing is recommended to ensure dependable
and secure protection schemes.
Based on the above mentioned findings, the results have shown that by utilizing the Digsilent
PowerFactory software simulator package together with its relay models, transient simulations,
protection application and performance testing to ensure dependable and secure protection schemes
can be done with confidence. This is because the research findings attained concur with those of
previous research work where the physical relays and real time models were utilized.
90
6. Further Work Recommended
The following problems should be considered for further wok:
a) Study impact if end of line series compensation is moved towards the middle of the line.
b) Test relays with source impedance variations.
c) Test relays with fault resistance variations
d) Digsilent SC/MOV model to be modeled with built-in bypass circuit breakers.
e) Study power system oscillations.
91
7. REFERENCES [1] Leoaneka M C, Rigby B S: “Investigation Into Under-Reaching of Distance Protection Relays In Heavily Series Compensated Transmission Networks”, Proceedings of the 17th South African Universities Power Engineering Conference SAUPEC 2008, Durban, South Africa, 24-25 January 2008, pp 115 – 121, ISBN 978-1-86840-6593. [2] M.J. Kockett, “Decription of Phase 3 EHV Feeder Schemes Including AC/DC Key and Logic Diagrams”, Eskom, 1996, source data is from the Eskom internal data base. [3] Sture Lindahl, Kent Wikkstom: “Adaptive Protection of Series Compensated Lines”, ABB Network Partner AB, Sweden, S-721 71 VÄSTERÅS. [4] P.M. Anderson, R.G. Farmer, “Series Compensation of Power Systems”, PBLSH! Inc, 1996. [5] Sture Lindahl, (date unknown) “Protection of Series Compensated Networks” Unpublished paper. [6] Leoaneka M C, Rigby B S: “Some Challenges Associated with Distance Protection of Series Compensated Transmission Lines”, Discussion Paper Presented at the 16th South African Universities Power Engineering Conference SAUPEC 2007, Cape Town, South Africa, 25-26 January 2007. [7] Bogdan Kasztenny: “Distance Protection of Series Compensated Lines Problems and Solutions”, Proceedings of the 28th Annual Protective Relay Conference 2001, Western Cape, South Africa, 22-25 October 2001. [8] Joan Gers, E.J. Holmers and Holmers: “Protection of Electricity Distribution Networks Hand-book”, Institution of Electrical Engineers, London, U.K. 1998. [9] Daniel L. Goldsworthy: “A linearized Model For MOV-Protected Series Capacitors ”, IEEE Transactions on Power Systems, Vol. PWRS-2, No. 4, November 1987, Page(s):953 – 957. [10] R. Grunbaum : “Thyristor-Cntrolled Series Compensation: A state of the Art Approach for Optimization of Transmission Over Power Lines ”, ABB Power Systems AB, Sweden, SE-721 64 Vasteras. [11] Steve Allett: Alstom training presentation on feeder protection, document sourced from the Eskom internal data base. [12] Metal Oxide Varistor Technology for systems through 345kV Catalogue. [Online] Available at: http://www.cooperpower.com/Library/pdf/96042.pdf. [13] Life Cycle Management document for capacitors in Eskom Transmission, document TBP 41-365, source data is from the Eskom internal data base. [14] Adam Bartylak, Anura Perera: “Alternative configuration of Impedance Relays on Series Compensated Networks”, Proceedings of the South African Power System Protection Conference Johannesburg, South Africa, 12-14 November, 2008.
92
[15] Hector J. Altuve, Joseph B. Mooney and George E. Alexander: “Advances in Series-Compensation Line Protection”, www.selinc.com/WorkArea/DownloadAsset.aspx?id=3540. [16] Adam Bartylak, Anita Oommen, Comfort Masike, Gift Moima, Harry Troskie, Malcolm Govender, Sheldon Klein, Simon Pomeroy and Thokozani Mthethwa “Protection Setting Philosophy for Transmission and Sub-Transmission Grids”, Revision 0, 10 November 2003, source data is from the Eskom internal data base. [17] Private conversation with Neels van Staden in Eskom Transmission. [18] Alstom, “Network Protection & Automation Guide”, Alstom, ISBN: 2951858906 Editions: Hardcover; 2002. [19] Hung Manh Tran and Henry Akyea, “Numerical Distance Protection Relay Commissioning and Testing”, [Online] Available at: http://webfiles.portal.chalmers.se/et/MSc/Akyea&TranMSc.pdf. [20] Eskom, Protection and Co-ordination Team, “Setting of the ABB REL 531 Distance Protection Relay”, a spreadsheet programme sourced from the Eskom internal data base. [21] Private conversation with Anura Perera in Eskom Transmission System Operator. [22] Private conversation with Adam Bartylak in Eskom Transmission System Operator. [23] Adam Bartylak, “Power Systems Protection Setting Verification Based on PowerFactory Simulations”, Revision 0, April 2008, source data is from the Eskom internal data base. [24] Stan Wilkinson, “Series Compensated Line Protection Issues”, [Online] Available at: http://pm.geindustrial.com/FAQ/Documents/Alps/GER-3972.pdf. [25] GEC Metering, “Protection Relaying Guide”, GEC Metering, Second Edition, 1975. [26] Fernando Calero, Armando Guzmán, and Gabriel Benmouyal, “Adaptive Phase and Ground Quadrilateral Distance Elements” Schweitzer Engineering Laboratories Inc., 2009, 20091214-TP6378-01. [27] Rusell W. Patterson “Application of Overreaching Distance Relays”, IEEE PSRS working group D4. [Online] Available at: http://www.pespsrc.org/Reports/D4_Application_of_Overreaching_Distance%20_Relays.pdf. [28] A. Guzmán, J. Mooney, G. Benmouyal, and N. Fischer, “Transmission Line Protection System for Increasing Power System Requirements,” Proceedings of the 55th Annual Conference for Protective Relay Engineers, College Station, TX, April 2002. [29] Robert Viereck, Digsilent support GmbH, Germany.
93
APPENDIXES
94
APPENDIX A
95
Reactance Rated current Bank rating Continuous 8 hours in 12 hours 30 minutes in 6 hours 10 minutes in 2 hours Transmission Over VoltageBank name (ohm) (A) = 3 * I2 *Xc Line Position Protection
= √3 * I * 400kV = 1,1 * continuous = 1,35 * continuous = 1,5 * continuous Type
ZE/ZL 0.901 Series Cap 0 Ω sec Own or adjacent lines.
TWIN DINOSAUR
Appendix E Muldersvlei Line Settings
106
ZMn - DISTANCE PROTECTION.
The distance protection function in REL 531 line protection consists of five independent zones, each comprising three measuring elements for phase to earth (Ph-E) faults and /or three measuringelements for phase-to-phase (PH-PH) faults. It uses the quadrilateral characteristic, with the reactive and resistive reach settings being set independently on the Y and X axis respectively. The zones are set as percentages of the line parameters (RnZn and XnZn)The directionality and operationality of the relay is determined by the settings below. Zones ZM1 - ZM4 are used for tripping. Zone ZM5 is used for switch onto fault purposes. ZM4 is also used in the power swing detection logic. ZM1, ZM2 and ZM4 are used as forward reaching zones whilst ZM3 is used as the reverse reaching zone. This is set in the relay's configuration tables and cannot be changed.
NOTE!
Z GeneralMinimum operating current for forward directed distance protection zones.
Possible setting = [ 10 -30 % of I1b]
Set = 10%
IminOp = 10%
DISTANCE ZONES.ZONE 1The zone 1 required reach must be set to 80 % of the line to be protected.
Operation mode and directionality of distance protection zone 1
Possible setting = [ Off / Nonedirectional /Forward / Reverse ]Set = Forward
Operation = Forward
Settings for the phase-to-phase measurement
Operating mode for distance protection zone 1 for phase-to-phase faults
Possible setting = [ Off / On ]Set = On
Operation PP = On
The interest of the studies under inverstigation are only base on Zone 1, therefore Zone 1 and 2 settings will be performed.
Appendix E (continued) Muldersvlei Line Settings
107
Positive sequence reactive reach of the distance protection zone 1 for Ph-Ph faults.a) Normal Limit is 80% of Xline.
b) Series Compensation Limitation.The zone 1 reach setting must be reduced if the line or adjacent lines are series compensated, due to thesubharmonic oscillations caused by the series capacitor under fault conditions. Zone 1 can only be setas a percentage reach to the actual fault according to the curve shown below.Is this line or the adjacent line series compensated? N [Y; N]Is this line series compensated? N [Y; N]Does this protection face the series capacitor? N [Y; N]
%P
100 80 C = Xc/ X1 , degree of compensation. 60 X1 = Total positive sequence reactance from the
source to the series capacitor. 40 P = Maximum allowable reach for the underreaching 20 zone.
C 20 40 60 80 100 %
C = Xc / X1(tot)= 0 / 18.95= 0.00%
Therefor from graph;
P = 80%
This option is not applicable.
X1PP = X1* P/100 , X1 = total line positive seq. Reactance.= 11.87 Ω /phase sec.
Possible setting = [ 0.01 - 400 Ω /sec. ]Set = 11.88 Ω /phase sec.
X1PP = 11.88 Ω /phase sec.
NOTE: When the calculation of X1PP gives a negative value the zone 1 must be permanently blocked.
Appendix E (continued) Muldersvlei Line Settings
108
Positive sequence line resistance included in the distance protection zone 1 for Ph-Ph faults.a) Normal Limit is 80% of Rline.
Limit 2 : This setting must cover a minimum fault of 20 ohms primary, unless restricted by the X1PP criteria.Remote end infeed must be considered. Do not set more than 50 ohms primary.
This setting provides a phase to phase fault resistance coverage of: 45.45 ohms prim.
Operating mode of time delayed trip for the distance protection zone 1 for Ph-Ph faults
Possible setting = [ Off / On ]Set = On
Timer T1pp = On
Time delayed trip operation of the distance protection zone 1 for Ph-Ph faults
Possible setting = [ 0.00 - 60.000 s. ]Set= 0.000 s.
T1pp = 0.000 s.
Resistive reach of distance protection zone 1 for Ph-Ph faults. This setting is based on the minimumof 3 * X1PP and 1.6 * minimum load. This setting could also be calculated using van Warringtonsformulae considering remote end infeed and earth resistance.
Appendix E (continued) Muldersvlei Line Settings
109
Settings for the phase-to-earth measurement
Operating mode for distance protection zone 1 for phase-to-earth faults
Possible setting = [ Off / On ]Set = On
Operation PE = On
Positive sequence reactive reach of the distance protection zone 1 for Ph-E faults.a) Normal Limit is 80% of Xline.
Resistive reach of distance protection zone 1 for Ph-E faults. This setting is based on the minimum of4.5 * X1PE and 0.8 * minimum load. This setting could also be calculated using the van Warringtonformula considering remote end infeed and earth resistance.
Appendix E (continued) Muldersvlei Line Settings
111
Operating mode of time delayed trip for the distance protection zone 1 for Ph-E faults
Possible setting = [ Off / On ]Set = On
Timer T1PE = On
Time delayed trip operation of the distance protection zone 1 for Ph-E faults
Possible setting = [ 0.00 - 60.000 s. ]Set= 0.000 s.
T1PE = 0.000 s.
ZONE 2.1.2
General zone setting parameters
Operation mode and directionality of distance protection zone 2
Possible setting = [ Off / Nonedirectional /Forward / Reverse ]Set = Forward
Operation = Forward
Settings for the phase-to-phase measurement
Operating mode for distance protection zone 2 for phase-to-phase faults
Possible setting = [ Off / On ]Set = On
Operation PP = On
a) The zone 2 required reach must be set to 120 % of the line to be protected.b) Ensure coordination with remote end reverse reach.
Positive sequence reactive reach of the distance protection zone 2 for Ph-Ph faults.
Limit 1:The zone 2 required reach must be set to 120 % of the line to be protected.
X1PP ≥ 1.2 * 14.84 Ω /phase sec. X1PP 17.81 Ω /phase sec.
Appendix E (continued) Muldersvlei Line Settings
112
Positive sequence line resistance included in the distance protection zone 2 for Ph-Ph faults.
This setting provides a phase to phase fault resistance coverage of: 50.00 ohms primary
Operating mode of time delayed trip for the distance protection zone 2 for Ph-Ph faults
Possible setting = [ Off / On ]Set = On
Timer T2PP = On
Time delayed trip operation of the distance protection zone 2 for Ph-Ph faults
Possible setting = [ 0.00 - 60.000 s. ]Set= 0.4s
T2PP = 0.4s
Settings for the phase-to-earth measurement
Operating mode for distance protection zone 2 for phase-to-earth faults.
Possible setting = [ Off / On ]Set = On
Operation PE = On
Resistive reach of distance protection zone 2 for Ph-Ph faults. Manufacturer recommends theminimum of 3 * X1PP and 1.6 * minimum load. Since the NERC recommendation is used, the factor of1.6 is ignored. This setting could also be calculated using the van Warrington formula consideringremote end infeed and earth resistance.
Appendix E (continued) Muldersvlei Line Settings
113
Positive sequence reactive reach of the distance protection zone 2 for Ph-E faults.
X1PE = 17.81 Ω /phase sec. Set same as for phase-to-phase faults
Possible setting = [ 0.01 - 400 Ω /sec. ]Set= 17.81 Ω /phase sec.
X1PE = 17.81 Ω /phase sec.
Positive sequence line resistance included in the distance protection zone 2 for Ph-E faults.
R1PE = 1.41 Ω /phase sec. Set same as for phase-to-phase faults
Possible setting = [ 0.01 - 400 Ω /sec. ]Set = 1.41 Ω /phase sec.
R1PE = 1.41 Ω /phase sec.
Zero sequence line reactance included in distance protection zone 2 for Ph-E faults.
Operating mode of time delayed trip for the distance protection zone 2 for Ph-E faults
Possible setting = [ Off / On ]Set = On
Timer T2PE = On
Time delayed trip operation of the distance protection zone 2 for Ph-E faults
Possible setting = [ 0.00 - 60.000 s. ]Set= 0.4s s.
T2PE = 0.4s s.
Resistive reach of distance protection zone 2 for Ph-E faults. This setting is based on the minimum of4.5 * X1PE and 0.8 * minimum load. It must also fall inside the remote end reverse reach - ZM3.
Appendix E (continued) Muldersvlei Line Settings
115
Directional Measuring Element - Zdir.This function is to be used with series compensated lines, and is able to cope with the condition of voltage reversal. This function will be enabled on series compensated- and lines adjacent to series compensated lines, and is controlled by the faulty phase criteria.
Operation mode and directionality of distance protection directional element.This function is only used for series compensated lines.
Possible setting = [ Non-series compensated, Series compensated]Set = Non-Series Compensated
Operation = Non-Series Compensated
These parameters define the position of the directional lines in the impedance plane. Default values of 15 and 25 degrees respectively for ArgDir an ArgNegRes should be used unless fault studies on long heavily loaded lines indicate a clear necessity for deviation from this. It needs to be noted that the reverse directionality will also be affected, since the reverse directional lines is a mirror image of the forward directional lines.
This setting is used to define the upper angle in the second quadrant. PSS/E results to be consulted when deciding to change this angle. 25 Degrees in the relay manual refers to 90 + 25 = 115 degrees.
ZE/ZL 0.846 Series Cap 35.64 Ω sec Own or adjacent lines.
TWIN DINOSAUR
Appendix F Droerivier Line Settings
118
ZMn - DISTANCE PROTECTION.
The distance protection function in REL 531 line protection consists of five independent zones, each comprising three measuring elements for phase to earth (Ph-E) faults and /or three measuringelements for phase-to-phase (PH-PH) faults. It uses the quadrilateral characteristic, with the reactive and resistive reach settings being set independently on the Y and X axis respectively. The zones are set as percentages of the line parameters (RnZn and XnZn)The directionality and operationality of the relay is determined by the settings below. Zones ZM1 - ZM4 are used for tripping. Zone ZM5 is used for switch onto fault purposes. ZM4 is also used in the power swing detection logic. ZM1, ZM2 and ZM4 are used as forward reaching zones whilst ZM3 is used as the reverse reaching zone. This is set in the relay's configuration tables and cannot be changed.
NOTE!
Z GeneralMinimum operating current for forward directed distance protection zones.
Possible setting = [ 10 -30 % of I1b]
Set = 10%
IminOp = 10%
DISTANCE ZONES.ZONE 1The zone 1 required reach must be set to 80 % of the line to be protected.
Operation mode and directionality of distance protection zone 1
Possible setting = [ Off / Nonedirectional /Forward / Reverse ]Set = Forward
Operation = Forward
Settings for the phase-to-phase measurement
Operating mode for distance protection zone 1 for phase-to-phase faults
Possible setting = [ Off / On ]Set = On
Operation PP = On
The interest of the studies under inverstigation are only base on Zone 1, therefore Zone 1 and 2 settings will be performed.
Appendix F (continued) Droerivier Line Settings
119
Positive sequence reactive reach of the distance protection zone 1 for Ph-Ph faults.a) Normal Limit is 80% of Xline.
b) Series Compensation Limitation.The zone 1 reach setting must be reduced if the line or adjacent lines are series compensated, due to thesubharmonic oscillations caused by the series capacitor under fault conditions. Zone 1 can only be setas a percentage reach to the actual fault according to the curve shown below.Is this line or the adjacent line series compensated? Y [Y; N]Is this line series compensated? Y [Y; N]Does this protection face the series capacitor? Y [Y; N]
%P
100 80 C = Xc/ X1 , degree of compensation. 60 X1 = Total positive sequence reactance from the
source to the series capacitor. 40 P = Maximum allowable reach for the underreaching 20 zone.
C 20 40 60 80 100 %
C = Xc / X1(tot)= 35.64/56.26= 63.35%
Therefor from graph;
P = 48%
Protection on compensated line facing capacitor.
X1PP = (X1 - Xc) * P/100 , X1 = total line positive seq. Reactance.= 9.96 Ω /phase sec.
Possible setting = [ 0.01 - 400 Ω /sec. ]Set = 9.96 Ω /phase sec.
X1PP = 9.96 Ω /phase sec.
NOTE: When the calculation of X1PP gives a negative value the zone 1 must be permanently blocked.
Appendix F (continued) Droerivier Line Settings
120
Positive sequence line resistance included in the distance protection zone 1 for Ph-Ph faults.a) Normal Limit is 80% of Rline.
Limit 2 : This setting must cover a minimum fault of 20 ohms primary, unless restricted by the X1PP criteria.Remote end infeed must be considered. Do not set more than 50 ohms primary.
This setting provides a phase to phase fault resistance coverage of: 45.45 ohms prim.
Operating mode of time delayed trip for the distance protection zone 1 for Ph-Ph faults
Possible setting = [ Off / On ]Set = On
Timer T1pp = On
Time delayed trip operation of the distance protection zone 1 for Ph-Ph faults
Possible setting = [ 0.00 - 60.000 s. ]Set= 0.000 s.
T1pp = 0.000 s.
Resistive reach of distance protection zone 1 for Ph-Ph faults. This setting is based on the minimumof 3 * X1PP and 1.6 * minimum load. This setting could also be calculated using van Warringtonsformulae considering remote end infeed and earth resistance.
Appendix F (continued) Droerivier Line Settings
121
Settings for the phase-to-earth measurement
Operating mode for distance protection zone 1 for phase-to-earth faults
Possible setting = [ Off / On ]Set = On
Operation PE = On
Positive sequence reactive reach of the distance protection zone 1 for Ph-E faults.a) Normal Limit is 80% of Xline.
Resistive reach of distance protection zone 1 for Ph-E faults. This setting is based on the minimum of4.5 * X1PE and 0.8 * minimum load. This setting could also be calculated using the van Warringtonformula considering remote end infeed and earth resistance.
Appendix F (continued) Droerivier Line Settings
123
Operating mode of time delayed trip for the distance protection zone 1 for Ph-E faults
Possible setting = [ Off / On ]Set = On
Timer T1PE = On
Time delayed trip operation of the distance protection zone 1 for Ph-E faults
Possible setting = [ 0.00 - 60.000 s. ]Set= 0.000 s.
T1PE = 0.000 s.
ZONE 2.1.2
General zone setting parameters
Operation mode and directionality of distance protection zone 2
Possible setting = [ Off / Nonedirectional /Forward / Reverse ]Set = Forward
Operation = Forward
Settings for the phase-to-phase measurement
Operating mode for distance protection zone 2 for phase-to-phase faults
Possible setting = [ Off / On ]Set = On
Operation PP = On
a) The zone 2 requirement for series comp. lines or protection on lines affected by it is greater or equal to 150%b) Ensure coordination with remote end reverse reach.
Positive sequence reactive reach of the distance protection zone 2 for Ph-Ph faults.
Limit 1:The zone 2 requirement for series compensated lines or protection on lines affected by it is greater or equal to 150%The safety factor of 150% are required due to operating speed requirements and possible underreaching.
This setting provides a phase to phase fault resistance coverage of: 50.00 ohms primary
Operating mode of time delayed trip for the distance protection zone 2 for Ph-Ph faults
Possible setting = [ Off / On ]Set = On
Timer T2PP = On
Time delayed trip operation of the distance protection zone 2 for Ph-Ph faults
Possible setting = [ 0.00 - 60.000 s. ]Set= 0.4s
T2PP = 0.4s
Settings for the phase-to-earth measurement
Operating mode for distance protection zone 2 for phase-to-earth faults.
Possible setting = [ Off / On ]Set = On
Operation PE = On
Resistive reach of distance protection zone 2 for Ph-Ph faults. Manufacturer recommends theminimum of 3 * X1PP and 1.6 * minimum load. Since the NERC recommendation is used, the factor of1.6 is ignored. This setting could also be calculated using the van Warrington formula consideringremote end infeed and earth resistance.
Appendix F (continued) Droerivier Line Settings
125
Positive sequence reactive reach of the distance protection zone 2 for Ph-E faults.
X1PE = 84.40 Ω /phase sec. Set same as for phase-to-phase faults
Possible setting = [ 0.01 - 400 Ω /sec. ]Set= 84.40 Ω /phase sec.
X1PE = 84.40 Ω /phase sec.
Positive sequence line resistance included in the distance protection zone 2 for Ph-E faults.
R1PE = 7.035 Ω /phase sec. Set same as for phase-to-phase faults
Possible setting = [ 0.01 - 400 Ω /sec. ]Set = 7.035 Ω /phase sec.
R1PE = 7.035 Ω /phase sec.
Zero sequence line reactance included in distance protection zone 2 for Ph-E faults.
Resistive reach of distance protection zone 2 for Ph-E faults. This setting is based on the minimum of4.5 * X1PE and 0.8 * minimum load. It must also fall inside the remote end reverse reach - ZM3.
Appendix F (continued) Droerivier Line Settings
126
Operating mode of time delayed trip for the distance protection zone 2 for Ph-E faults
Possible setting = [ Off / On ]Set = On
Timer T2PE = On
Time delayed trip operation of the distance protection zone 2 for Ph-E faults
Possible setting = [ 0.00 - 60.000 s. ]Set= 0.4s s.
T2PE = 0.4s s.
Directional Measuring Element - Zdir.This function is to be used with series compensated lines, and is able to cope with the condition of voltage reversal. This function will be enabled on series compensated- and lines adjacent to series compensated lines, and is controlled by the faulty phase criteria.
Operation mode and directionality of distance protection directional element.This function is only used for series compensated lines.
Possible setting = [ Non-series compensated, Series compensated]Set = Series Compensated
Operation = Series Compensated
These parameters define the position of the directional lines in the impedance plane. Default values of 15 and 25 degrees respectively for ArgDir an ArgNegRes should be used unless fault studies on long heavily loaded lines indicate a clear necessity for deviation from this. It needs to be noted that the reverse directionality will also be affected, since the reverse directional lines is a mirror image of the forward directional lines.
This setting is used to define the upper angle in the second quadrant. PSS/E results to be consulted when deciding to change this angle. 25 Degrees in the relay manual refers to 90 + 25 = 115 degrees.