26
Silgan Holdings (NASDAQGS: SLGN) Victor Murthi Vignesh Murali Wei Yan Date Presented: April 27 2010
| Date post: | 22-Dec-2015 |
| Category: |
Documents |
| Upload: | arleen-glenn |
| View: | 215 times |
| Download: | 3 times |

Silgan Holdings(NASDAQGS: SLGN)
Victor MurthiVignesh Murali
Wei Yan
Date Presented: April 27 2010

Screening ProcessEnergy Diamond Offshore Drilling Inc. (DO)Materials Silgan Holdings Inc. (SLGN)Industrials General Cable Corp. (BGC)Consumer Discretionary McDonalds (MCD)Consumer Staples Walgreens (WAG)Health CareFinancialsInformation Technology Jack Henry Associate (JKHY), MEMC Electronic Materials Inc. (WFR)Telecommunication ServicesUtilities
Screening Criteria
1) Industry Classifications: Materials (Primary)2) Geographic Locations: United States of America (Primary)3) Market Capitalization [Latest] ($USDmm, Historical rate): is greater than 5004) TEV/ LTM Total Revenues [Latest]: Rank is Less than 26 Relative to Screen Results as of Criterion 35) P/ LTM Normalized EPS [Latest]: Rank is Less than 26 Relative to Screen Results as of Criterion 46) Total Revenues, 5 Yr CAGR % [LTM]: Rank is Less than 26 Relative to Screen Results as of Criterion 57) Net Income, 5 Yr CAGR % [LTM]: Rank is Less than 26 Relative to Screen Results as of Criterion 68) EBIT Margin % [LTM]: Rank is Less than 6 Relative to Screen Results as of Criterion 7

Presenting – Silgan Holdings Inc. (NASDAQ: SLGN)
• 23 year old company headquartered in Stamford, CT. Market Cap $ 2.3 Billion
• One of the top manufacturers and sellers of metal and plastic consumer goods packaging products. 2009 revenues : approx. $ 3 billion
• 3 business segments▫ Metal and Aluminum Food
Containers (63%) ( largest in US) ▫ Closures ( Lids and Caps ) (20%) ▫ Plastic Containers (17%)
Business OneSource
Link
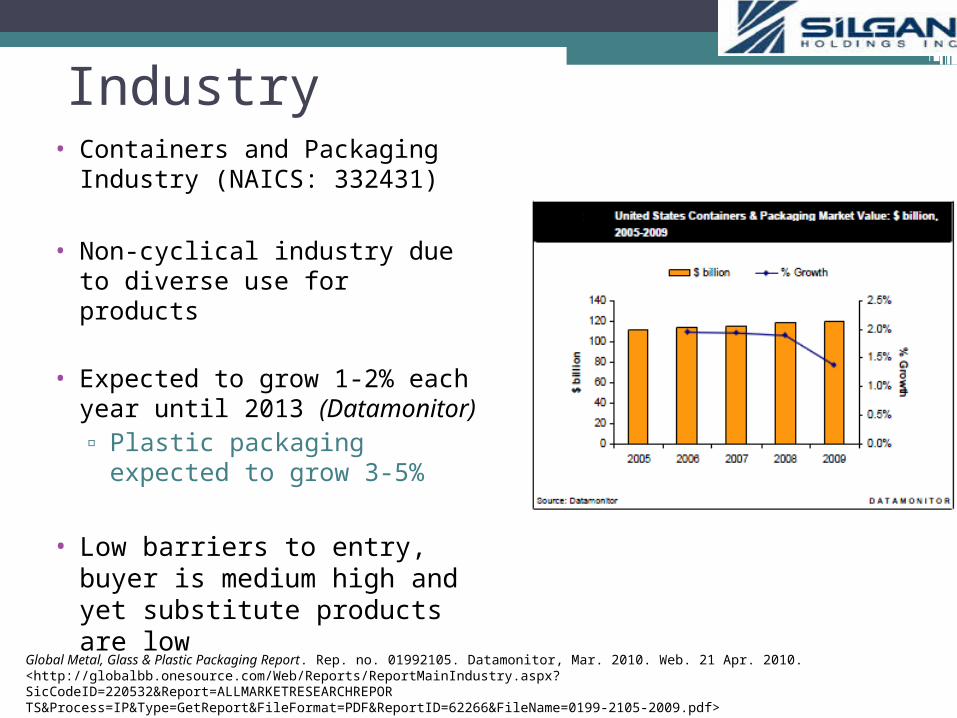
Industry• Containers and Packaging
Industry (NAICS: 332431)
• Non-cyclical industry due to diverse use for products
• Expected to grow 1-2% each year until 2013 (Datamonitor) ▫ Plastic packaging expected
to grow 3-5%
• Low barriers to entry, buyer is medium high and yet substitute products are low
Global Metal, Glass & Plastic Packaging Report. Rep. no. 01992105. Datamonitor, Mar. 2010. Web. 21 Apr. 2010. <http://globalbb.onesource.com/Web/Reports/ReportMainIndustry.aspx?SicCodeID=220532&Report=ALLMARKETRESEARCHREPORTS&Process=IP&Type=GetReport&FileFormat=PDF&ReportID=62266&FileName=0199-2105-2009.pdf>

Industry Trends▫ Highly competitive despite
slow growth
▫ Rising costs: High price of raw materials and production reducing margins
▫ Niche markets: Customized packaging for diverse clientele Medical goods packaging
expected to grow 5% each year(Datamonitor)
Global Metal, Glass & Plastic Packaging Report. Rep. no. 01992105. Datamonitor, Mar. 2010. Web. 21 Apr. 2010. <http://globalbb.onesource.com/Web/Reports/ReportMainIndustry.aspx?SicCodeID=220532&Report=ALLMARKETRESEARCHREPORTS&Process=IP&Type=GetReport&FileFormat=PDF&ReportID=62266&FileName=0199-2105-2009.pdf>

SWOTStrengths Weaknesses
1. Strong market presence
2. Good established customer base ( Coke, Campbell soup)
1. High leverage
2. Declining operating margins
3. Declining market share
Opportunities Threats
1. Strategic Acquisitions
2. Growing opportunities in the packaging industry
3. Niche markets
1. Slowdown in US economy
2. Higher Competition
3. Environmental Costs
Macroeconomic Factors
• Prices of raw materialsIncrease in demand for biodegradable plastic as well as aluminum/ copper have driven up prices and pressured margins
• Derived DemandDemand depends on demand for other products such as food and beverages, medical supplies and chemicals. Demand for these products are projected to increase in the near-term future
• Emerging MarketsAs industrial activity in developing economies picks up, so does demand for goods to store and transport raw materials and finished goods.
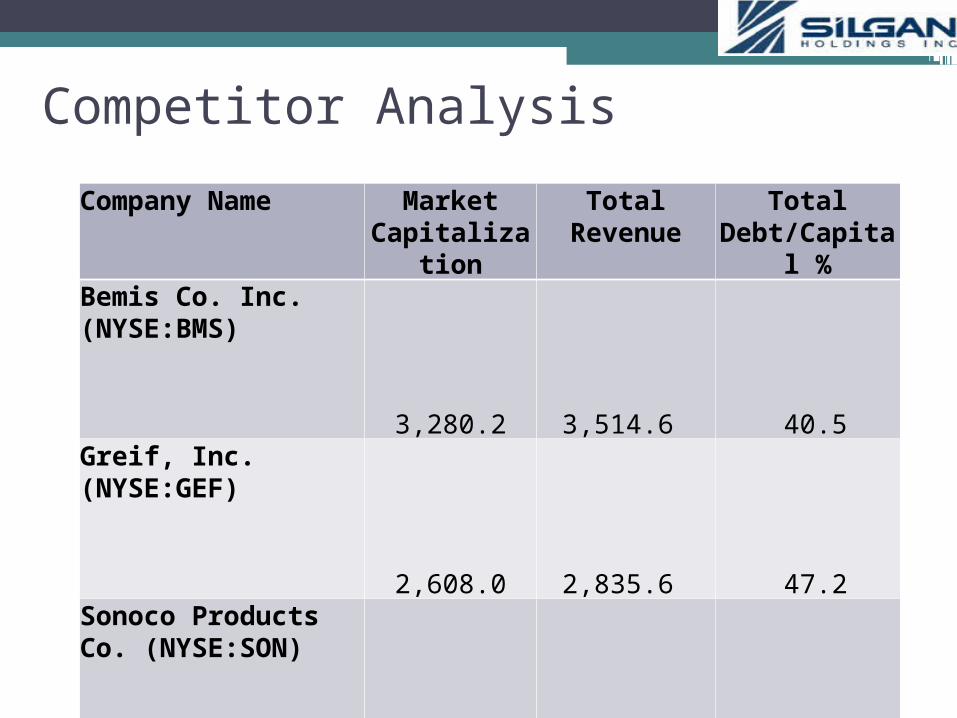
Company Name Market Capitalizati
on
Total Revenue
Total Debt/Capita
l %Bemis Co. Inc. (NYSE:BMS)
3,280.2
3,514.6
40.5 Greif, Inc. (NYSE:GEF)
2,608.0
2,835.6
47.2 Sonoco Products Co. (NYSE:SON)
3,185.2
3,597.3
29.6 Temple-Inland Inc. (NYSE:TIN)
2,328.0
3,577.0
50.3 Silgan Holdings Inc. (NASDAQ: SLGN)
2,421.6
3,066.8
54.3
Competitor Analysis
Greif, Inc:
• A global producer of industrial packaging products.
• The Company operates in three business segment: Industrial Packaging; Paper Packing: and Land Management.
• In July 2009, the company completed the acquisition of Ennis Containers, Inc.
Competitor Analysis

Sonoco Products Company, Inc:
Provides industrial and consumer packaging products, and
packaging services in North and South America, Europe,
Australia, and Asia.
The Company operates in four segments: ConsumerPackaging, Tubes and Cores/Paper, Packaging
Services
Competitor Analysis

Bemis Company, Inc:
• Manufactures and sells flexible packaging products and pressure sensitive materials in the United States, Canada, Mexico, South America, Europe, and Asia.
• The company operates in two segments, Flexible Packaging and Pressure Sensitive Materials.
Competitor Analysis

Temple-Inland, Inc:
• Manufactures and sells corrugated packaging and building products primarily in the United States and Mexico.
• The Corrugated Packaging segment serves customers operating in the food, beverage, paper, glass containers, chemical, appliance, and plastics industries.
• Temple-Inland’s Building Products segment offers various products, including lumber, gypsum wallboard, particleboard, medium density fiberboard, and fiberboard.
Competitor Analysis

Profitability
Leverage
Efficiency
Company Name
Gross Margin %
Net Income Margin
%
ROE % ROA % Total
Debt/Capital %
EBIT / Interest
Exp.
Total Asset
Turnover
Bemis Co. Inc.
19.9
4.2
9.3
5.6
40.5
7.3
0.9
Greif, Inc.
20.7
5.6
15.2
6.9
47.2
5.4
1.0
Sonoco Products Co.
18.5
4.2
12.0
5.7
29.6
6.8
1.3
Temple-Inland Inc.
13.6
5.8
27.8
4.4
50.3
4.5
0.6
Peer Average
18.2
5.0
16.1
5.7
41.9
6.0
1.0
Silgan Holdings Inc.
15.0
5.2
26.3
8.6
54.3
6.0
1.3
Ratio analysis
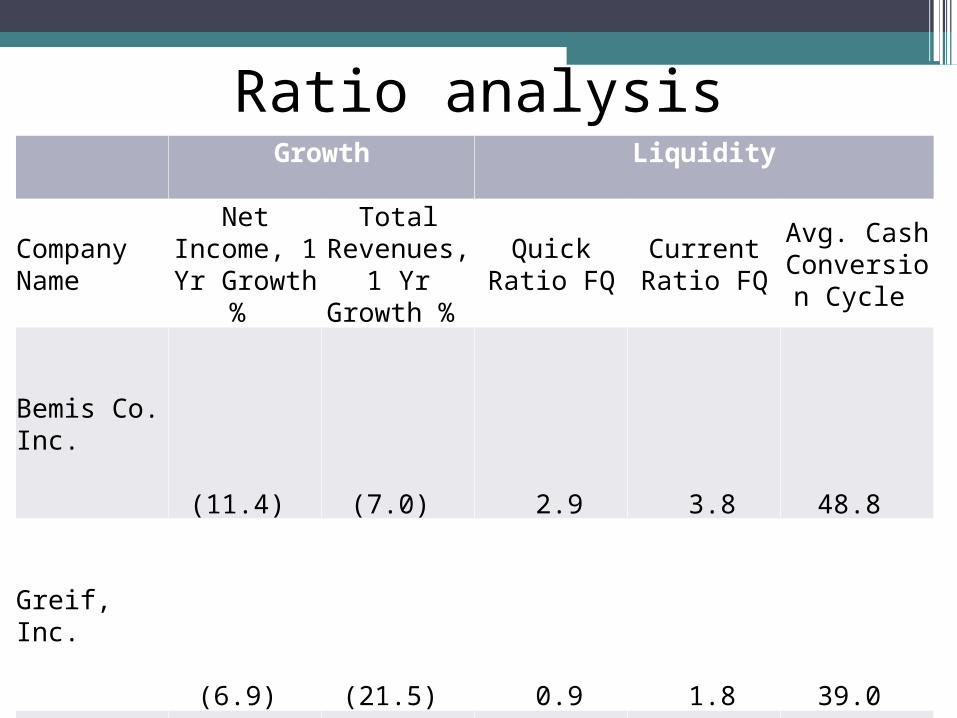
Growth
Liquidity
Company Name
Net Income, 1 Yr Growth
%
Total Revenues,
1 Yr Growth %
Quick Ratio FQ
Current Ratio FQ
Avg. Cash Conversion
Cycle
Bemis Co. Inc.
(11.4)
(7.0)
2.9
3.8
48.8
Greif, Inc.
(6.9)
(21.5)
0.9
1.8
39.0
Sonoco Products Co.
(8.0)
(12.7)
0.8
1.2
32.3
Temple-Inland Inc.
(7.0)
(7.9)
1.0
2.1
73.7
Peer Average
(8.32)
(12.3)
1.4
2.2
48.5
Silgan Holdings Inc.
27.5
(1.7)
1.2
2.2
68.0
Ratio analysis

Relative Valuation
P/Sales TEV/EBITDA TEV/EBIT Trailing P/E Trailing P/B
Min 52.22 35.34 36.01 47.61 32.42
Mean 63.46 49.30 49.34 63.48 63.23
Max 75.51 72.57 70.51 91.04 52.49
Price Range : $32.42 – $91.04
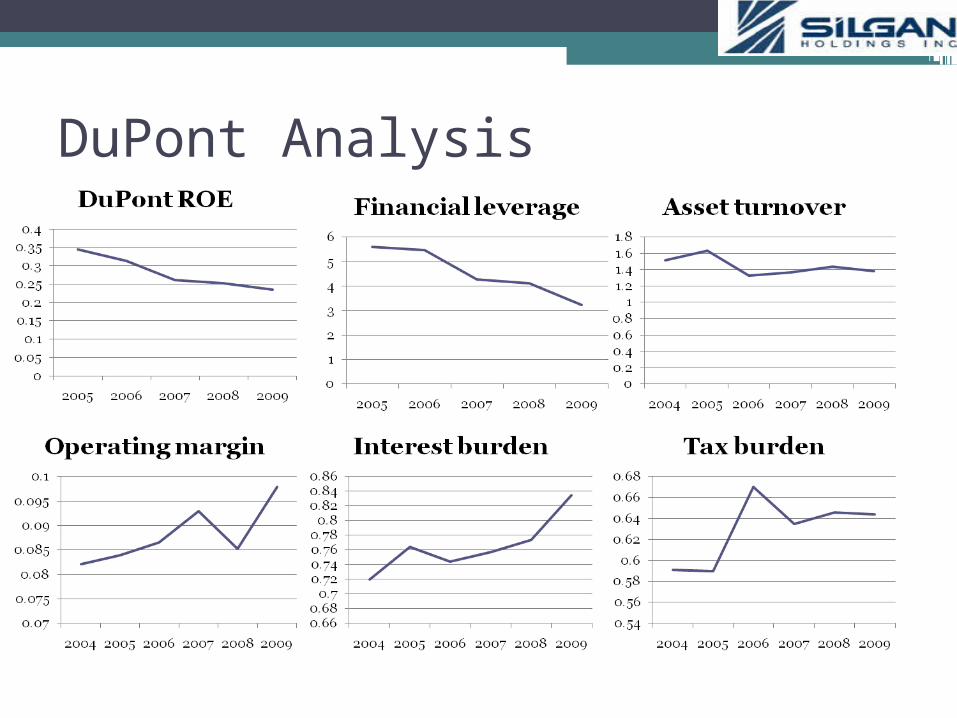
DuPont Analysis

DCF Valuation - Revenue
• Metal Food container▫ “Cash cow”, growing at 5-year CAGR of 3.5%▫ Count for 66% of revenue, organic growth is mature
but it able to past on raw material cost to customers▫ Projected to grow at 5-year CAGR of 3.5%
• Closure▫ Grow through acquisition, with CAGR of 17.18%▫ Organic grow is around 12%, projected to be
decreasing to 8% over 5 years period.
• Plastic container▫ Organic growth is around 5 – 6%. Projected to be
stable in 6% range.

DCF Valuation – Income Statements• Cost of goods sold
▫ Around 87% in the past but decrease to 85% due to increase in “manufacturing efficiency”, projected to fluctuate from 85% to 86%
• SG&A▫ Around 4.5% in the past but increase to 5.25% due to currency
translation impact, projected to be around 5%
• Interest expense▫ Interest coverage ratio is 4.23 in 2005 but increase to 6 in
2009 due to higher leverage for acquisition. Projected to increase from 6 due to debt repayment
• Income tax expense▫ Income tax is projected around 35%

DCF Valuation – Balance Sheets• Account receivable
▫Receivable turnover is around 15 – 16, projected to be stable
• Inventory ▫ Inventory turnover is around 6 – 7, projected to be
6.7
• Net capital investment▫Positive number, meaning they have to spend more
for Capex in the future, projected to be -0.5% of revenue
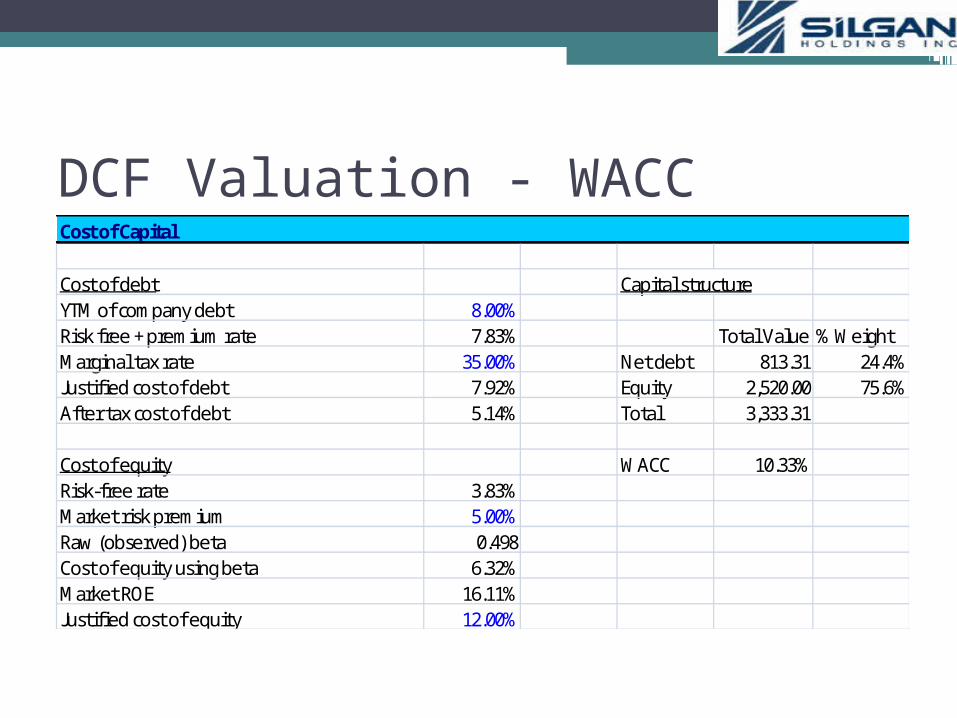
DCF Valuation - WACCCost of Capital
Cost of debt Capital structureYTM of company debt 8.00%Risk free + premium rate 7.83% Total Value % WeightMarginal tax rate 35.00% Net debt 813.31 24.4%Justified cost of debt 7.92% Equity 2,520.00 75.6%After tax cost of debt 5.14% Total 3,333.31
Cost of equity WACC 10.33%Risk-free rate 3.83%Market risk premium 5.00%Raw (observed) beta 0.498Cost of equity using beta 6.32%Market ROE 16.11%Justified cost of equity 12.00%

DCF Valuation - FCFFEnterprise value 3,059.380Less: debt 813.314Total equity value 2,246.066Diluted sharesouts. 38.486Price per share 58.36$ Market price as of 04/23/2010 65.79$ Margin of safety -11.29%
58.36$ 9.5% 10.0% 10.5% 11.0% 11.5%2.0% 58.87 53.67 49.08 45.01 41.372.5% 63.38 57.54 52.44 47.94 43.943.0% 68.58 61.97 56.24 51.24 46.823.5% 74.65 67.08 60.59 54.97 50.06
WACC
Term
inal
gr
owth
rate

5 Year Stock Price

Management Assessment
•Founded in 1987 by current Co-Chairmen of the Board: Phil Silver and Greg Horrigan.
•Grow through organic growth and acquisitions, able to increase overall share of the U.S. metal food container market from approximately 10% in 1987 to approximately half of the market in 2009
•Communicative in explaining operating result.

Ownership Composition

Portfolio CorrelationSLGN AEO DO JKHY MCD MOS WAG WFR BGC
SLGN 1.00AEO 0.18 1.00DO 0.12 0.20 1.00JKHY 0.32 0.23 0.13 1.00MCD 0.41 0.04 0.15 0.42 1.00MOS 0.19 0.09 0.50 0.14 0.29 1.00WAG -0.05 0.34 0.18 0.07 0.09 0.04 1.00WFR 0.29 0.24 0.51 0.23 0.21 0.47 0.15 1.00BGC 0.17 0.38 0.52 0.30 0.32 0.48 0.36 0.57 1.00

Recommendation
• Stable “value” company with clean balance sheet and strong cash flow.
• Good management experienced in both improving organic growth and acquisition growth
• Low correlation with other holdings, stock price has been increasing six fold in the past 5 years.
• Suggestion: watch list.
SLGN AEO DO JKHY MCD MOS WAG WFR BGC CashDollar holdings value -$ 27,045.00$ 4,250.00$ 10,132.00$ 14,206.00$ 10,588.00$ 178,855.00$ 9,492.00$ 5,804.00$ 221,450.00$ Individual weight 0.00% 5.61% 0.88% 2.10% 2.95% 2.20% 37.12% 1.97% 1.20% 45.96%Yearly port. standard deviation 11.19% Yearly port. expected return 3.92% Sharpe ratio 0.28


