Proceedings International Workshop on Mineral Scaling 2011 Manila, Philippines, 25-27 May 2011 11 Silica Scaling in Tiwi – Current Solutions Larry B. Villaseñor and Aimee A. Calibugan CGPHI, 14F 6750 Ayala Ave., Makati City, Philippines [email protected]; [email protected]Keywords: Amorphous silica scaling, Tiwi ABSTRACT Silica scaling has remained one of the challenges in the Tiwi production field, particularly in the brine disposal systems and the two-phase production facilities. The brine disposal systems include both “cold” brine and “hot” brine disposal. Cold brine refers to fluid that is collected from atmospheric flash tanks and then flows through the sumps and pipelines to the injection wells. Flashing to atmospheric pressure results in highly over-saturated brine and amorphous silica scales frequently clog-up the brine handling system. In the hot brine disposal systems (MRBDS and SEHBIS), the brine is injected directly from the separators through the pipelines to the injection wells by gravity and this then minimizes the silica saturation. However, scaling of the injection wells still occurs over time, requiring remediation measures at regular intervals. Scaling is also found to occur in the two-phase production facilities, particularly at wellsites where mixing of fluids with different characteristics from the production wells (dry steam vs. two phase) leads to incompatible blends at the production headers, resulting in scaling. In addition, some sectors of the Tiwi reservoir have shown changes with exploitation – some wells that used to produce dry steam have started to produce two-phase fluids while other wells showed cycling behavior or increasing brine production. The chemistry changes brought about by these reservoir changes have also caused the formation of silica scales in the wells and pipelines. This paper reports on some of the engineering solutions and adjustments on operations that have been implemented to minimize the effects of silica scale on Tiwi‟s generation. These solutions range from re-designing of the outlets of flash tanks and sumps to re-routing of production lines. For the injection system, cold brine disposal is only used in emergency situations or as back-up to avoid injecting over-saturated brine. However, scaling is still found to occur in both the cold and hot brine injection wells and scale drill-outs and acidizing of the wells is required periodically. A tool (SSI calculator) was also developed to aid in monitoring and modeling the scaling potential of the injection lines. 1. INTRODUCTION The Tiwi Geothermal Field is located on the northeast flanks of Mt. Malinao in Albay Province, Philippines (see Figure 1). It was the first geothermal field in the Philippines to go on commercial production. The geothermal resource is a liquid-dominated system with the upflows located in the southern and northwestern portions of the field (Gambill and Beraquit, 1993). Source temperatures based on the NakCa-Mg geothermometer range from 280 to 315 o C while the discharge enthalpies of the current production wells vary from 970 kJ/kg to that of dry steam. The silica concentrations of the brine from these wells separated at system pressure range from 300 to 1000 ppm. Figure 1 Location of the Tiwi Geothermal Field 2. BRINE DISPOSAL IN TIWI During the early stages of the development of the Tiwi field, all separated brine and power plant condensates were disposed of through a canal to Lagonoy Gulf. The separated brine is first collected at the wellsite sumps then this passes through cold brine lines to the disposal canal. Injection was started in 1983 within the Naglagbong area using existing wells that had encountered acid fluids. The negative impact that this had on nearby producers prompted the relocation of injection to the southeastern „edgefield‟ wells. Later, this was also moved farther out to the „outfield‟ injection wells. Tiwi attained 100% injection of separated brine in 1993 (Menzies, et al, 2010). 2.1 Tiwi Cold brine system Steam production in Tiwi started in the Naglagbong lowlands. Due to the detrimental effects of infield injection, rapid pressure drawdown, and coldwater influx, production wells were successively drilled towards the higher elevations to the west and south. Initially, there was not much brine production from the western portion of the field as
Transcript
Proceedings International Workshop on Mineral Scaling 2011 Manila, Philippines, 25-27 May 2011
11
Silica Scaling in Tiwi – Current Solutions
Larry B. Villaseñor and Aimee A. Calibugan
CGPHI, 14F 6750 Ayala Ave., Makati City, Philippines
Silica scaling has remained one of the challenges in the Tiwi production field, particularly in the brine disposal systems and the two-phase production facilities.
The brine disposal systems include both “cold” brine and “hot” brine disposal. Cold brine refers to fluid that is collected from atmospheric flash tanks and then flows through the sumps and pipelines to the injection wells. Flashing to atmospheric pressure results in highly over-saturated brine and amorphous silica scales frequently clog-up the brine handling system. In the hot brine disposal systems (MRBDS and SEHBIS), the brine is injected directly from the separators through the pipelines to the injection wells by gravity and this then minimizes the silica saturation. However, scaling of the injection wells still occurs over time, requiring remediation measures at regular intervals.
Scaling is also found to occur in the two-phase production facilities, particularly at wellsites where mixing of fluids with different characteristics from the production wells (dry steam vs. two phase) leads to incompatible blends at the production headers, resulting in scaling. In addition, some sectors of the Tiwi reservoir have shown changes with exploitation – some wells that used to produce dry steam have started to produce two-phase fluids while other wells showed cycling behavior or increasing brine production. The chemistry changes brought about by these reservoir changes have also caused the formation of silica scales in the wells and pipelines.
This paper reports on some of the engineering solutions and adjustments on operations that have been implemented to minimize the effects of silica scale on Tiwi‟s generation. These solutions range from re-designing of the outlets of flash tanks and sumps to re-routing of production lines. For the injection system, cold brine disposal is only used in emergency situations or as back-up to avoid injecting over-saturated brine. However, scaling is still found to occur in both the cold and hot brine injection wells and scale drill-outs and acidizing of the wells is required periodically. A tool (SSI calculator) was also developed to aid in monitoring and modeling the scaling potential of the injection lines.
1. INTRODUCTION
The Tiwi Geothermal Field is located on the northeast flanks of Mt. Malinao in Albay Province, Philippines (see Figure 1). It was the first geothermal field in the Philippines to go on commercial production. The geothermal resource is a liquid-dominated system with the upflows located in the southern and northwestern portions of the field (Gambill and Beraquit, 1993). Source
temperatures based on the NakCa-Mg geothermometer range from 280 to 315
oC while
the discharge enthalpies of the current production wells vary from 970 kJ/kg to that of dry steam. The silica concentrations of the brine from these wells separated at system pressure range from 300 to 1000 ppm.
Figure 1 Location of the Tiwi Geothermal Field
2. BRINE DISPOSAL IN TIWI
During the early stages of the development of the Tiwi field, all separated brine and power plant condensates were disposed of through a canal to Lagonoy Gulf. The separated brine is first collected at the wellsite sumps then this passes through cold brine lines to the disposal canal. Injection was started in 1983 within the Naglagbong area using existing wells that had encountered acid fluids. The negative impact that this had on nearby producers prompted the relocation of injection to the southeastern „edgefield‟ wells. Later, this was also moved farther out to the „outfield‟ injection wells. Tiwi attained 100% injection of separated brine in 1993 (Menzies, et al, 2010).
2.1 Tiwi Cold brine system
Steam production in Tiwi started in the Naglagbong lowlands. Due to the detrimental effects of infield injection, rapid pressure drawdown, and coldwater influx, production wells were successively drilled towards the higher elevations to the west and south. Initially, there was not much brine production from the western portion of the field as
majority of the wells within the Bariis and Matalibong sectors produced dry steam. This small amount of brine was injected into Mat21 as cold brine. The separators discharged brine into the sumps and this was collected by interconnected lines and cascaded downhill to the injectors in the north - Mat01 and Mat21 (see figures 1 and 2) where the brine was injected by gravity.
Figure 2 Google Earth representation of the Mat ridge cold brine system. The distance from WS07 to WS13 is approximately 2 kilometers. (Google Earth Pro).See text.
This system obviously had scaling problems starting at the brine outlets of the separators up to, possibly, the injection wells. A good portion of the scales formed at the diffuser and main sumps. Scaling also caused the clogging of the sump risers and the cold brine lines. Some of these are shown in Figure 3 below.
Figure 3 Silica scales on cold brine line.
In extreme cases, the de-clogging of these pipelines requires a shut-down of a wellsite and disrupts operation. Pipe cleanups were normally done during periods of low generation, when the demand for steam is low at which time wells with high enthalpies were preferentially flowed to minimize brine production. This was possible until the late 1990s when brine production within the Bariis and Matalibong sectors were relatively low as shown in Figure 4.
The Mat ridge cold brine system was converted to a hot brine disposal system around 2000. With cold brine dumping from the separators to the
sumps taking place during upset conditions and the occasional stroking of the dump valves, the system was able to handle more separated brine. The existing cold brine lines served as back-up for the hot brine systems.
Figure 4 Brine production within the Matalibong ridge.
2.2 Tiwi Hot brine system
The Matalibong ridge hot brine system or Mat Ridge system was designed taking into account the concerns at the time:
A number of wells that produce from the shallow steam zone in the Mat Ridge exhibited superheating and some of these wells were producing HCl with the steam causing corrosion of the surface facilities.
The deeper wells that produce from the two-phase, deeper zone were producing considerable amounts of brine.
Some of the two-phase wells had silica saturation indices that were almost at saturation at the separator pressure.
With these concerns, several options were considered in the design of the Mat ridge system:
Maintain the cold brine system and let the silica scale drop in the sumps by chemical treatment – this, however, introduced issues on solid waste disposal.
Prevent silica deposition in the cold brine system by chemical treatment either by pH modification or injection of chelating agents – it is thought however, that these, do not guarantee that silica deposition will not occur in the lines or in the injection wells.
Convert the cold brine system into a hot brine disposal system – this is the most expensive of all the options as it would entail the construction of new pipelines.
The hot brine system was eventually chosen, based on the experiences in the South East Hot brine system (SEHBIS) which did not show significant concerns at the time, that a hot brine system would have less issues and maintenance costs in the long run.
The concern on superheated wells that could produce HCl in steam was addressed by a
0
100
200
300
400
80 85 90 95 00 05 10
Bri
ne
, kg/
s
Date, yr
Bar Mat
Villaseñor and Calibugan
13
cascading system where the separated brine from upstream wellsites was passed through the wellsite headers of downstream pads. This effectively provided a steamwash for the superheated steam to dilute the HCl thus preventing corrosion of the surface facilities. The two-phase mixture was then passed through separators. Mass and energy balance calculations were done on the possible mixtures to ensure that dehydration of the two-phase fluids do not cause silica deposition at the tie-in points.
To ensure that the intended mass and energy balances along the pipelines of the Mat ridge system were maintained even during start-ups, commissioning of wells, and shutdowns, detailed standard operating procedures (SOPs) were written. All the affected groups were involved in the preparation and review of these SOPs. This included the Facilities Engineering, Operations, Maintenance and Resource Management groups. The final SOPs were eventually rolled-out to operators and the other field support groups to gain understanding of the system‟s design and operating philosophy. Reviews of the procedures are done either periodically or as the need arises, i.e., when there are system or reservoir changes that could affect the integrity of the system. Changes on the surface facilities are also done through a Management of Change, MOC, process to ensure compliance to the design intent.
The occasional opening of the emergency dump valves (EDV), however, have also caused some scaling challenges. The pictures on figures 5 and 6 illustrate these. Figure 5 shows the outlets of an atmospheric flash tank (AFT) where the discharge from an EDV passes before the brine goes to the sump. Silica scales clog the discharge pipes leading to the sump. Figure 6 shows the other parts of the piping downstream of the AFT. Declogging of these pipes requires a wellsite shutdown and this causes generation losses as the activity requires the shutting-in of approximately 4 wells, on the average, for the duration of the maintenance job.
Figure 5 Silica scales on Atmospheric Flash Tanks
Figure 6 Part of the AFT discharge piping leading to the sump.
Figure 7 shows how the outlet of the AFT was eventually „upgraded‟ into an open canal. This design allows the cleaning of the brine‟s pathway without the need for a shutdown. Not shown in the picture are the „steps‟ of the canal that allows the hot brine to cascade, inducing further the deposition of silica along the canal. This could lessen the deposition of silica scales in the sump where accessibility is more difficult compared to the brine canal.
Figure 7 The AFT canal at Wellsite 7.
In many cases, however, the sump risers, as previously shown in Figure 3, gets clogged up with hard silica scales. A simple reconfiguration of the outlet was done in one of the wellsite sumps – a low dam was constructed upstream of the outlet to prevent scales from going into the cold brine line (and eventually the cold brine injection well). This has worked quite well. The sump is shown in Figure 8.
Villaseñor and Calibugan
14
Figure 8 The sump riser has been eliminated from this sump and a low dam was built just upstream of the outlet.
Not seen, unfortunately, in the above figure is the low dam to the left of the picture. The mound in the distance, upper right portion, is the cascade from the diffuser sump. The pale color is due to the silica deposits. This sump used to require a shut down almost every 8 months for de-clogging of the riser for almost a week.
The South East hot brine injection system, SEHBIS, is represented by the red and orange lines in figure 1. This hot brine disposal system currently processes approximately 270 kg/s of brine when all wells on the eastern portion of the field are flowing. It was constructed in the early 1990s to dispose of the brine from the production wells in the Kapipihan and Naglagbong areas. Spent brine was eventually injected in the wells in the southeastern portion of the field as initial brine injection nearby in the north and east showed thermal effects on the production wells in the Naglagbong lowlands.
Due possibly to the long brine lines and the changes in the capacity of the injection wells, sections of low flow gave rise to silica scaling. Around 2000, an opportunity for inspection of the brinelines revealed severe scaling of portions of the SEHBIS. Some of the pictures are shown in Figures 9 – 12.
Figure 9 Portions of the SEHBIS line where boiling might have occurred.
Figure 10 Silica scaling possibly due to cooling of the brine as a result of the long distances.
Figure 11 More evidence of low flow conditions possibly as a result of the reduction in the capacity of the injection wells.
Figure 12 Accumulation of scale and debris were also observed at low points in the brine lines.
Based on these findings, the response of the reservoir to injection, and the changes in the injection wells‟ capacities, some of the solutions that were implemented included:
Removal of some of the vertical loops that caused low flow conditions.
Villaseñor and Calibugan
15
Operational changes such as minimization of injection rates into selected injectors were also implemented.
Another operational change that was implemented is the proper draining of sections of brine lines that would not be used for some time to prevent formation of silica scales that would serve as „seed‟ to further scaling. This was coupled with presentations to operators and technicians on the factors that induce the formation of silica scales and inclusion of the procedures in SOPs of the brine disposal system.
A parallel line was also built to redistribute brine flow. This parallel line also served to prevent or minimize separator dumping due to backpressures along the brine line.
Workovers of some of the injectors were also done to regain the capacity lost to wellbore scaling.
More frequent monitoring of brine line pressures and temperatures were also done and the data was used in determining if flashing is occurring in these sections.
With the addition of new wells that produce more brine, studies are also being conducted to optimize the injection system, bearing in mind the scaling potentials of the different designs. This is done by simulating the scaling potential of the different routes and mixtures through the use of an Excel spreadsheet. This will be discussed in a later section of this paper.
3. SCALING IN PRODUCTION WELLS AND PRODUCTION LINES.
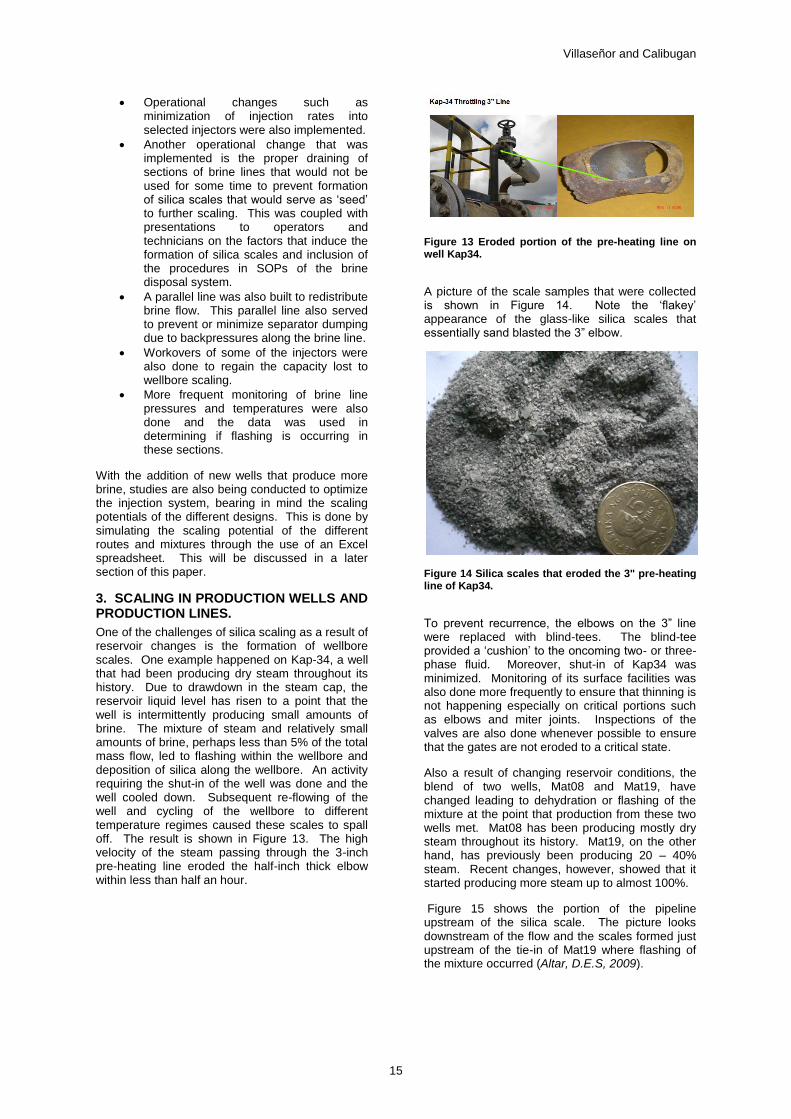
One of the challenges of silica scaling as a result of reservoir changes is the formation of wellbore scales. One example happened on Kap-34, a well that had been producing dry steam throughout its history. Due to drawdown in the steam cap, the reservoir liquid level has risen to a point that the well is intermittently producing small amounts of brine. The mixture of steam and relatively small amounts of brine, perhaps less than 5% of the total mass flow, led to flashing within the wellbore and deposition of silica along the wellbore. An activity requiring the shut-in of the well was done and the well cooled down. Subsequent re-flowing of the well and cycling of the wellbore to different temperature regimes caused these scales to spall off. The result is shown in Figure 13. The high velocity of the steam passing through the 3-inch pre-heating line eroded the half-inch thick elbow within less than half an hour.
Figure 13 Eroded portion of the pre-heating line on well Kap34.
A picture of the scale samples that were collected is shown in Figure 14. Note the „flakey‟ appearance of the glass-like silica scales that essentially sand blasted the 3” elbow.
Figure 14 Silica scales that eroded the 3" pre-heating line of Kap34.
To prevent recurrence, the elbows on the 3” line were replaced with blind-tees. The blind-tee provided a „cushion‟ to the oncoming two- or three-phase fluid. Moreover, shut-in of Kap34 was minimized. Monitoring of its surface facilities was also done more frequently to ensure that thinning is not happening especially on critical portions such as elbows and miter joints. Inspections of the valves are also done whenever possible to ensure that the gates are not eroded to a critical state.
Also a result of changing reservoir conditions, the blend of two wells, Mat08 and Mat19, have changed leading to dehydration or flashing of the mixture at the point that production from these two wells met. Mat08 has been producing mostly dry steam throughout its history. Mat19, on the other hand, has previously been producing 20 – 40% steam. Recent changes, however, showed that it started producing more steam up to almost 100%.
Figure 15 shows the portion of the pipeline upstream of the silica scale. The picture looks downstream of the flow and the scales formed just upstream of the tie-in of Mat19 where flashing of the mixture occurred (Altar, D.E.S, 2009).
Villaseñor and Calibugan
16
Figure 15 Silica scaling along a two-phase line where a dry-steam well mixes with a two-phase well.
Subsequent declogging of the tie-in and re-routing of Mat19 to a section where the brine to steam ratio will not cause dehydration was done. The removal of the obstruction on this wellsite header also resulted to an additional steam production of approximately 3MW.
Minimal silica scaling has also been observed in the separators. Figure 16 shows the two-phase, tangential inlet of one of Tiwi‟s separators taken during one of the inspections. The thin scales were probably formed after use of this separator for more than a year. At this stage, no engineering solutions have been implemented as it is thought that the scaling rate is not high enough to warrant changes in the design of the separator.
Figure 16 Silica scaling at the inlet of a separator.
4. SILICA SATURATION INDEX (SSI) TOOL
The SSI tool is an Excel-based program that calculates the amorphous silica saturation index of the fluid as it flows from production well into the pipelines, through separators and finally as it gets reinjected into the injection wells. It is primarily used to monitor and predict scaling potential of the hot brine injection systems in Tiwi. The tool has
also the capability to simulate the SSI for any modifications done to the current injection setup, which is useful in planning optimization projects for Tiwi‟s hot brine injection systems.
4.1 SSI Tool Features
Some of the key features of the SSI tool are the main control worksheet, the SSI database, the SSI plotter, the SSI field model and the SSI simulator.
The main control worksheet is the starting point for running the SSI tool. It basically displays the default hot brine line configuration as well as the link for the database, plots and the field model, as shown in Figure 17. The SSI calculations will greatly depend on the configuration selected in the main control worksheet.
Figure 17 Main Control Worksheet
The SSI database primarily contains the SiO2 (ppm), discharge enthalpy (BTU/lb), FWHP and sampling pressure (psig) and the total mass flow (kph) of the production wells (Fig. 18). For convenience, these data are arranged chronologically per wellsite and are color-coded for every quarter. Aside from filtering the data upon extraction from the Geochem/Production databases, manual selection is also done to indicate the correct pairing of datasets for more realistic results.
Figure 18 Sample Database for SSI Calculations
The SSI plotter provides the historical SSI plots for
production wells, wellsites, key junctions of the hot brine lines and separators. Some examples of SSI plots are shown in sections 4.3 – 4.4.
The SSI field model displays the latest available
fieldwide SSI values. It prompts users when segments of the injection system are at risk of scaling by highlighting those areas.
Villaseñor and Calibugan
17
The SSI simulator is particularly useful in optimizing the injection strategy of the field as it allows users to model the effective SSI for any line diversion or line interconnection scenarios. In the current version of the tool, the SSI simulation can be done in the main control worksheet by manually inputting the desired line connections or diversions.
4.2 Calculation Procedure
Figure 19 Simplified flowchart of the SSI Spreadsheet
Figure 19 shows the simplified flowchart for SSI calculations. From the database, the steam and water fractions and the temperature of the fluid are computed using the Steam Table function stmPHQ, which returns steam quality as a function of fluid pressure and enthalpy (Eqns. 1-3).
stmPHQSF (1)
SFWF 1 (2)
stmPHTFT )( (3)
where P, H, Q, T, SF, WF are pressure, discharge enthalpy, steam quality, temperature, steam fraction and water fraction, respectively. stmPHT is another Steam Table function that returns fluid temperature as a function of pressure and enthalpy. The calculated T (F) is then converted to T (K).
Next, the theoretical and calculated silica concentrations of the fluid are determined. The theoretical silica concentration is obtained using the equation developed by Fournier (1977) for the solubility of amorphous silica (Eqns. 4-5).
52.4)(
731)(log 2
KTtheoSiO (4)
52.4
)(
731^10)(2
KTtheoSiO (5)
The calculated silica concentrations, on the other hand, are determined using equations 6, 7 or 8 depending on which portion of the injection system is the area of interest. Silica concentration in the total flow at the wellhead is calculated by multiplying SiO2 (analyzed in the liquid) by the WF (eqn. 6). At the wellsite and 2-phase junctions, silica concentrations are obtained summing of the products of the upstream silica concentrations and their mass fractions (MF) (eqn. 7). Silica concentration of the separated brine, i.e. downstream of separators, is obtained by dividing the SiO2 with the WF (Eqn. 8).
WFSiOcalcSiO WH 22 )( (6)
i
MFSiOcalcSiO junctWS1
22 /)( (7)
WFSiOcalcSiO sep 22 )( (8)
The silica saturation index is finally obtained by dividing the calculated silica concentration with the theoretical silica concentration (Eqn. 9).
)(
)(
2
2
theoSiO
calcSiOSSI (9)
Scaling potential of the fluid is ranked based on the calculated SSI values. Actual occurrence of scaling is a complex function of SSI, reaction kinetics, and other factors known and unknown. For Tiwi, SSI <0.8 is considered low risk, SSI between 0.8 and 1.4 is considered moderate risk and SSI > 1.4 is considered high risk for silica scaling. These rankings are based on experience.
4.3 SSI Monitoring of Tiwi Hot Brine Injection Systems
Silica scaling along brine disposal systems and the two-phase production facilities remains a perennial problem in Tiwi. Using the tool, the SSI of the brine lines, production headers and production wells are monitored to be able to predict which segments of the injection system are at risk of silica scaling.
The SSI tool has only recently been developed and put into routine use. It has been tested using earlier data sets. An example is the Wellsite-10 SSI chart (Fig. 20). As shown in the plot, the 2009 SSI values went up to ~1.4, approaching a high risk rating for silica scaling. Subsequent line inspection confirmed scaling along the WS-10 production line. The formation of scale was attributed to the changing characteristics of the production wells in
Villaseñor and Calibugan
18
WS-10 resulting to „incompatible blend‟ of fluids. To prevent recurrence of scaling, the 2-phase line configuration at WS-10 was modified.
Figure 20 WS-10 SSI Plot
Examples of SSI plots of separated brine (e.g. Sep-06 and Sep-07B) are shown in Figures 21 and 22. Sep-06 SSI has been consistently close to saturation (SSI~1.0) in the last 10 years (Fig. 21). Sep-07B SSI, in contrast, was initially well below saturation but then it showed an increase in the last 5 years and is currently close to 1.0 (Fig. 22). Both examples indicate moderate risk of scaling and as such these will be closely monitored.
Figure 21 SSI Plot of the Separator at WS-06
Figure 22 Separator-07B SSI Plot
An example of SSI plot for the brine line just upstream of an injector is depicted in Figure 23. The SSI values, as shown in the plot, are scattered
between 0.6 and 1.0 indicating low to moderate risk of scaling.
Figure 23 SSI of brine line going to the SEHBIS injectors
4.4 SSI Modeling for Injection Optimization Projects
The SSI simulator is useful in optimizing the field‟s injection strategy. Specifically, it can simulate the resulting SSI of various proposed brine diversions or line interconnection projects. It can also model the projected SSI resulting from hook-up of additional makeup wells.
As discussed previously, SSI simulation is simply done by manually inputting the desired pipeline configuration in the main control worksheet before
clicking on the data processing button.
To demonstrate this use of the SSI simulator, consider the SSI of Sep-07B. Figure -22 illustrates the SSI of the existing configuration at Sep-07B which indicates that the brine SSI is close to saturation. Figure -24, on the other hand, shows the simulated SSI at Sep-07B if Bar-08RD fluid will be diverted to WS-07. Note the improvement in the SSI of Sep 07B.
Figure 24 Simulated Sep-07B SSI
Figures 25 and 26 illustrate the SSI pre- and post- Bar-08RD diversion to WS-07. It is clearly shown that WS-07 SSI remains acceptable after the diversion suggesting it is a feasible optimization option.
Villaseñor and Calibugan
19
Figure 25 WS-07 SSI (-existing configuration)
Figure 26 WS-07 SSI (with Bar-08RD)
5. CONCLUSIONS
Just like the approach to any of the challenges that face the mature Tiwi Geothermal reservoir, the solutions implemented to minimize silica scaling have always prioritized field production and Operations. Minimal production disruptions and/or additions to daily operations and maintenance work is the priority. The simple engineering solutions discussed above were balanced against the
economics of generation losses during declogging of pipelines (and accompanying shutdowns) as well as the operability of the resulting setup. The recent development of an Excel-based SSI tool is expected to enhance our ability to anticipate and prevent future scaling incidents.
ACKNOWLEDGEMENTS
We would like to thank the Management of Chevron Geothermal Philippines Holdings, Inc. for encouraging the publication of this paper.
The macros for SSI spreadsheet was done by GeePee Tolentino.
Fournier, R. O., Chemical Geothermometers and Mixing Models for Geothermal Waters, Geothermics, 5, (1977), 41-50.
Gambill, D.T. and Beraquit, D.B.: Development History of the Tiwi Geothermal Field, Philippines. Geothermics, 22, No. 5/6, (1993),
403-416.
Google Earth Pro. Ver. 5.1.3533.1731.
Menzies, A.J., Villaseñor, L.B., and Sunio, E.G.: Tiwi Geothermal Field, Philippines: 30 Years of Commercial Operation, Proc. World Geothermal Congress, (2010).
Various scaling and corrosion reports from the Facilities and Operations Engineering groups of CGPHI.