PNNL-23288 EMSP-RPT-021 Rev 0.0 Prepared for the U.S. Department of Energy under Contract DE-AC05-76RL01830 Silicate Based Glass Formulations for Immobilization of U.S. Defense Wastes Using Cold Crucible Induction Melters GL Smith JB Lang D Kim JV Crum MJ Schweiger CL Crawford JC Marra JD Vienna May 2014
Transcript
PNNL-23288 EMSP-RPT-021 Rev 0.0
Prepared for the U.S. Department of Energy under Contract DE-AC05-76RL01830
Silicate Based Glass Formulations for Immobilization of U.S. Defense Wastes Using Cold Crucible Induction Melters GL Smith JB Lang D Kim JV Crum MJ Schweiger CL Crawford JC Marra JD Vienna May 2014
DISCLAIMER This report was prepared as an account of work sponsored by an agency of the United States Government. Neither the United States Government nor any agency thereof, nor Battelle Memorial Institute, nor any of their employees, makes any warranty, express or implied, or assumes any legal liability or responsibility for the accuracy, completeness, or usefulness of any information, apparatus, product, or process disclosed, or represents that its use would not infringe privately owned rights. Reference herein to any specific commercial product, process, or service by trade name, trademark, manufacturer, or otherwise does not necessarily constitute or imply its endorsement, recommendation, or favoring by the United States Government or any agency thereof, or Battelle Memorial Institute. The views and opinions of authors expressed herein do not necessarily state or reflect those of the United States Government or any agency thereof.
PACIFIC NORTHWEST NATIONAL LABORATORY operated by BATTELLE
for the UNITED STATES DEPARTMENT OF ENERGY
under Contract DE-ACO5-76RL01830
Printed in the United States of America
Available to DOE and DOE contractors from the Office of Scientific and Technical Information,
Silicate Based Glass Formulations for Immobilization of U.S. Defense Wastes Using Cold Crucible Induction Melters GL Smith JB Lang D Kim JV Crum MJ Schweiger CL Crawford1 JC Marra1 JD Vienna May 2014 Prepared for the U.S. Department of Energy under Contract DE-AC05-76RL01830 Pacific Northwest National Laboratory Richland, Washington 99352
1 Savannah River National Laboratory Aiken, South Carolina 29808
iii
Abstract
The cold crucible induction melter (CCIM) is an alternative technology to the currently deployed liquid-fed, ceramic-lined, Joule-heated melter (LFCM) for immobilizing of U.S. tank waste generated from defense related reprocessing. In order to accurately evaluate the potential benefits of deploying a CCIM, glasses must be developed specifically for that melting technology. Related glass formulation efforts have been conducted since the 1990s including a recent study that is first documented in this report (Section 4.0). The purpose of this report is to summarize the silicate based glass formulation efforts for CCIM testing of U.S. tank wastes. Summaries of phosphate based glass formulation and phosphate and silicate based CCIM demonstration tests are reported separately (Day and Ray 2013 and Marra 2013, respectively). Combined these three reports summarize the current state of knowledge related to waste form development and process testing of CCIM technology for U.S. tank wastes.
Unique aspects of the CCIM technology allow for higher processing temperatures and higher tolerance to solid inclusions in the melt as compared to the LFCM. Insufficient testing and system design work has been performed to identify the exact melter processing related glass property limits. However, a preliminary set of limits has been developed based on the testing performed to date. These limits include: viscosity at the melting temperature (TM) between 0.6 to 6 Pa·s, electrical conductivity at TM between 20 to 80 S/m, spinel content in the melt of ≤10 volume % at TM, and no metal or ceramic corrosion limits. These preliminary limits can serve as a starting point for glass formulation until sufficient testing data is available to refine them.
Hanford tank wastes from tanks C-102 (characterized by high-aluminum) and 244-TX (high-iron) were selected for glass formulation development in this study. They are two among eight tank wastes with appreciable quantity of large particulate Pu oxide and Pu metal that could challenge the criticality safety for these Hanford tanks and possibly the Hanford Tank Waste Treatment and Immobilization Plant (WTP). The C-102 glass with 34 wt% Al2O3 (54.4 wt% waste loading) was successfully formulated to satisfy the major constraints for the high-alumina glasses, crystallinity after slow cooling and product consistency test (PCT) of as-prepared and slow cooled glasses. The glass formulation with high-iron 244-TX waste also resulted in the maximum loading of 34 wt% Fe2O3 (55.9 wt% waste loading) that satisfy the major constraints for the 244-TX glasses, no salt formation and PCT of as-prepared and slow cooled glasses. The C-102 glass with 34 wt% Al2O3 was recommended for CCIM melter testing and was fully characterized for all the properties required for melter operation.
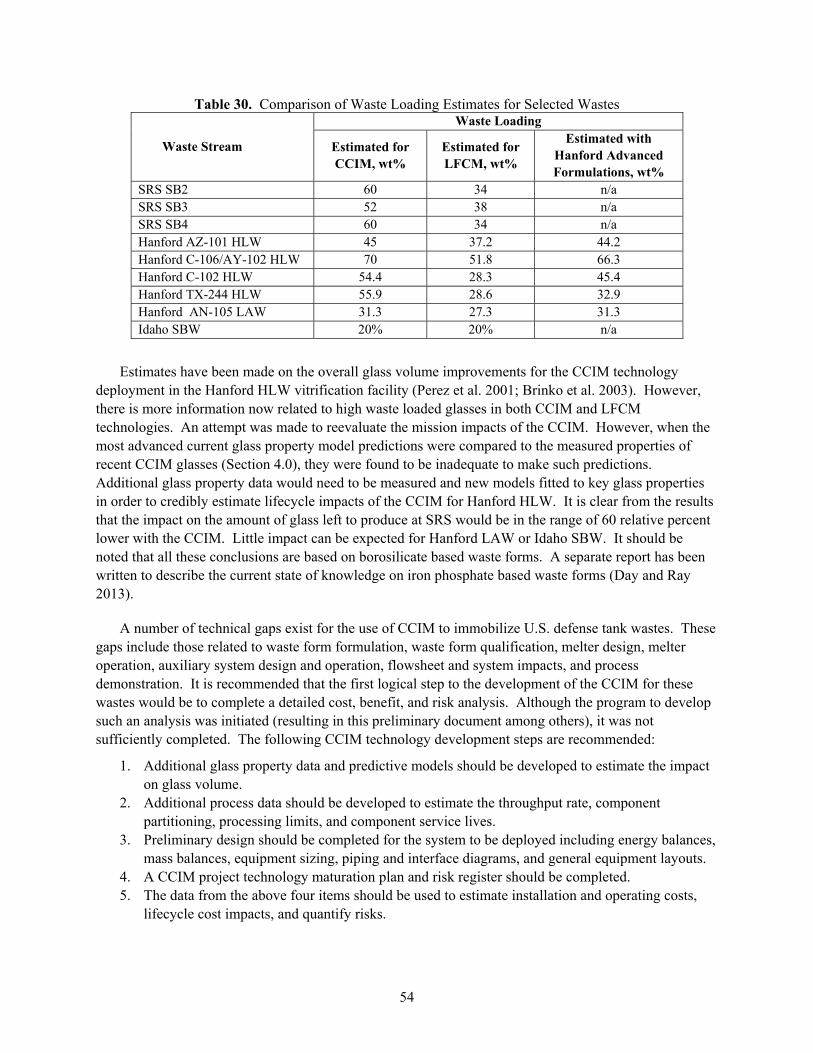
A number of glasses have been formulated to take advantage of the higher processing temperature and tolerance to solid inclusions aspects of the CCIM and are summarized in this report. Generally, waste loading can be increased for the CCIM. The loading of selected Savannah River Site high-level wastes (HLW) in glass increases by between 37 and 76 relative percent. The loading of selected Hanford HLWs increase by between 21 and 95 relative percent compared to the current system plan waste loading estimates (Certa et al. 2011). However, in comparison to recent advanced LFCM glass formulations (Vienna et al. 2013), the loading increase is between 2 and 70 relative percent (with all but one value below 20 relative percent). The loadings of Hanford low-activity waste and Idaho sodium-bearing waste don’t significantly differ between the two melter technologies. Lifecycle glass mass estimates could not be estimated for any U.S. waste stream due to a lack of data and predictive models.
v
Acknowledgments
The authors are grateful to the U.S. Department of Energy’s Environmental Management Office of Tank Waste Management (EM-21) for funding of the Cold Crucible Induction Melter (CCIM) development and testing program. Programmatic direction and support by Steve Schneider and Nick Machara at EM-21 are greatly appreciated.
vii
Acronyms and Abbreviations
ARM Approved Reference Material
ART Advanced Remediation Technologies
CCC canister centerline cooling
CCIM cold crucible induction melter
CEA Commissariat à l'énergie atomique
CSER Criticality Safety Evaluation Report
CUA Catholic University of America
DC direct current
DOE U.S. Department of Energy
DWPF Defense Waste Processing Facility
EA environmental assessment (glass)
EM U.S. Department of Energy, Office of Environmental Management
EM-21 U.S. Department of Energy, Office of Tank Waste Management
EPA U.S. Environmental Protection Agency
ETU Electrotechnical University of St. Petersburg (Russia)
REDOX Reduction-Oxidation (Process or Plant at the Hanford Site)
RPD relative percent difference
RPP River Protection Project (Hanford)
SIA Radon Scientific Industrial Association Radon Institute (Russia)
SB sludge batch
SBW sodium bearing waste (Idaho)
SEM scanning electron microscope
SGN Société générale pour les techniques nouvelles (Areva)
SRNL Savannah River National Laboratory
SRS Savannah River Site
T1% temperature at 1 volume % spinel in equilibrium with melt
TCLP Toxicity Characteristic Leach Procedure
TL liquidus temperature
TM melt temperature
TWRS-P Tank Waste Remediation Systems – Privatization
VHT Vapor Hydration Test
VSL Vitreous State Laboratory
WAPS Waste Acceptance Product Specifications
WL waste loading
WTP Hanford Tank Waste Treatment and Immobilization Plant
WVDP West Valley Demonstration Project
XRD X-ray diffraction
ix
Contents
Abstract ........................................................................................................................................................ iii
Acknowledgments ......................................................................................................................................... v
Acronyms and Abbreviations ..................................................................................................................... vii
1.0 Introduction and Background .............................................................................................................. 1
Appendix A ............................................................................................................................................... A.1
Appendix B ................................................................................................................................................B.1
xi
Figures
1. Equilibrium Crystal Fraction for Selected AZ-101 Glasses as a Function of Waste Loading ............. 16
2. Spinel Vol% as a Function of Temperature of the C34-5 Glass........................................................... 37
3. Viscosity of C34-5 Glass as a Function of Temperature ...................................................................... 38
4. Electrical Conductivity of C34-5 Glass as a Function of Temperature ................................................ 39
5. Effect of Cr2O3 wt% and TL Constraints on Projected Hanford HLW Glass Canisters ....................... 47
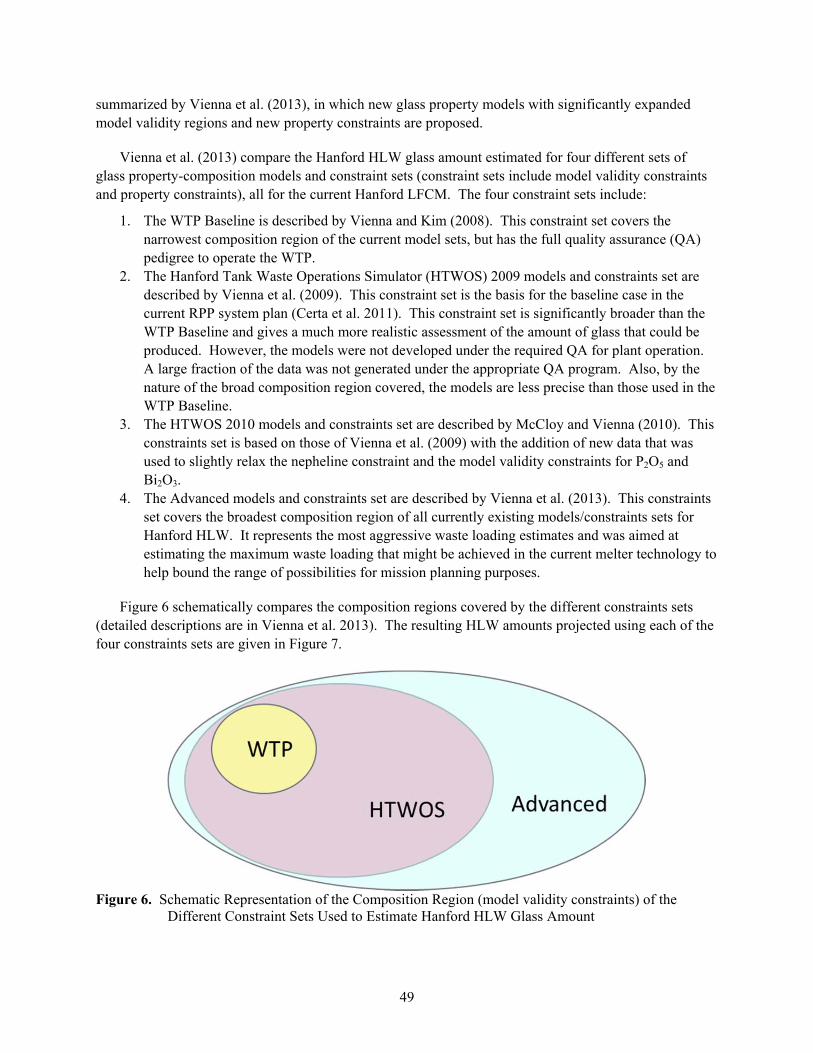
6. Schematic Representation of the Composition Region of the Different Constraint Sets Used to Estimate Hanford HLW Glass Amount ............................................................................................ 49
7. Comparison of Hanford HLW Glass Amount for Different Model and Constraint Sets ..................... 50
8. Comparison of Predicted and Measured Ln[PCT-A] Response for Recent CCIM Glasses ................. 51
9. Comparison of Measured Nepheline vol% and the Predicted Probability of Nepheline Formation upon CCC for Recent CCIM Glasses ................................................................................. 51
10. Comparison of Predicted and Measured Spinel vol% at 950°C for Recent CCIM Glasses ................. 52
Tables
1. Glass Compositions Formulated for CCIM Testing, wt% ..................................................................... 4
2. Nominal Composition for C-106/AY-102 Waste Simulant, wt% .......................................................... 5
3. Frit Compositions and Waste Loadings for C-106/AY-102 Glasses, wt% ............................................ 6
10. Candidate Frit Compositions and Predicted Properties at 50% SB3 Loading Plus Max Waste Loading at Viscosity and Nepheline Limits ......................................................................................... 10
15. Nominal Composition of AN-105 LAW, wt% ..................................................................................... 17
16. Compositions and Measured Properties of Initial AN-105 LAW Glasses ........................................... 18
17. Summary of Key Processing Related Properties for CCIM Test Glasses ............................................ 21
18. Wastes Considered for Glass Formulation for CCIM .......................................................................... 24
19. Adjusted Composition of Wastes Selected for CCIM Glass Formulation and Testing........................ 25
20. CCC Profile for HLW Glasses ............................................................................................................. 26
xii
21. Composition and Predicted Properties of High-Al2O3 Glasses ............................................................ 30
22. Analyzed Composition of Selected High-Al2O3 Glasses and Relative Percent Difference Between Analyzed and Target Compositions ...................................................................................... 33
23. Measured Properties of High-Al2O3 Glasses ........................................................................................ 34
24. Viscosity and Electrical Conductivity of the C34-5 Glass as a Function of Temperature ................... 38
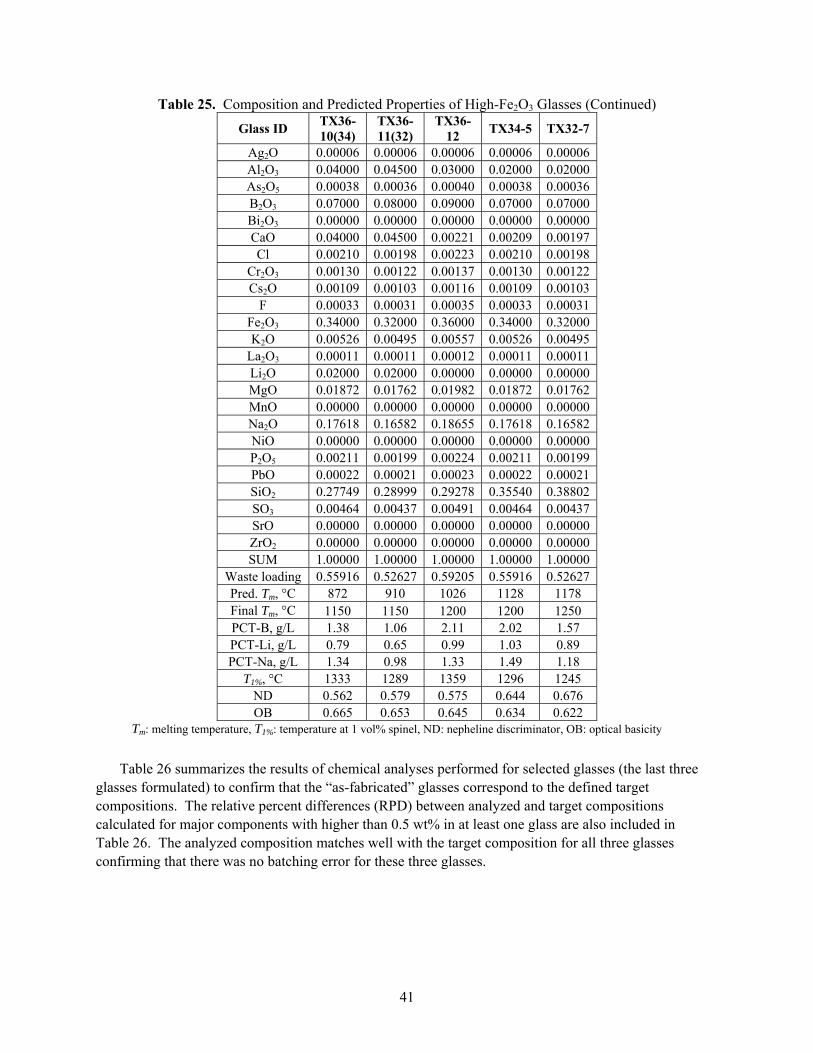
25. Composition and Predicted Properties of High-Fe2O3 Glasses ............................................................ 40
26. Analyzed Composition of Selected High-Fe2O3 Glasses and Relative Percent Difference Between Analyzed and Target Compositions ...................................................................................... 42
27. Measured Properties of High-Fe2O3 Glasses ........................................................................................ 43
28. Comparison of Key Property Limits and Resulting Glass Masses for Baseline and CCIM Melter Technologies ............................................................................................................................. 48
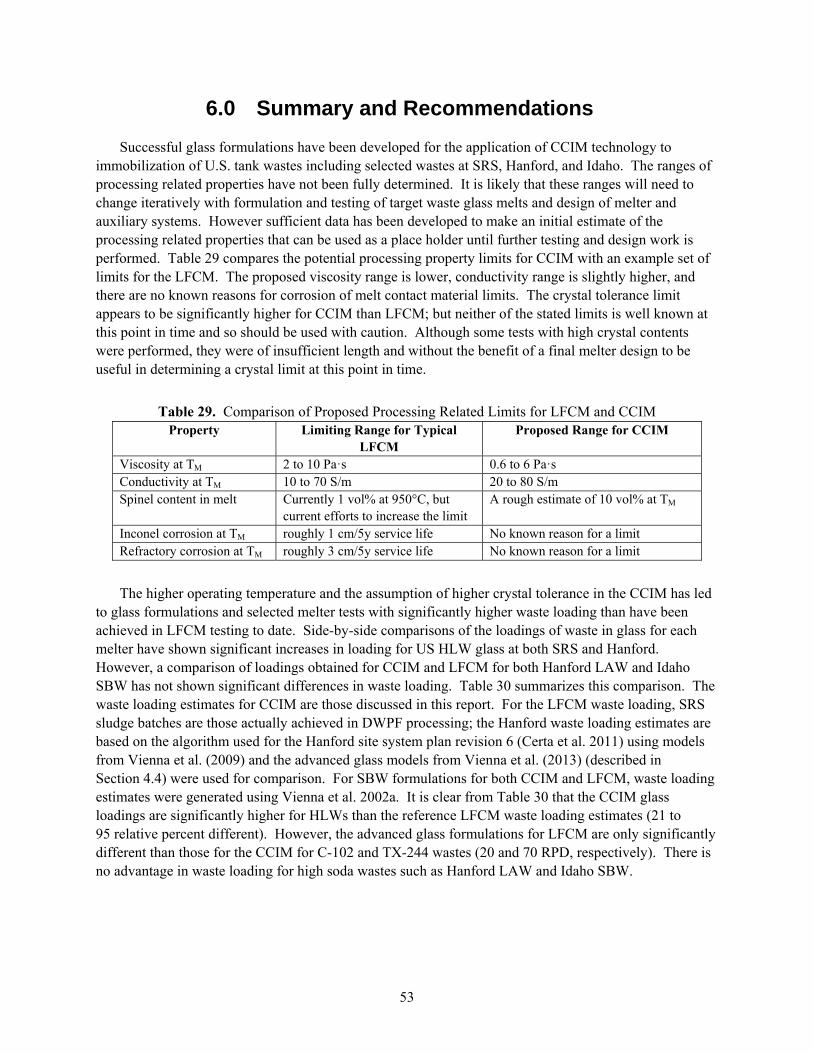
29. Comparison of Proposed Processing Related Limits for LFCM and CCIM ........................................ 53
30. Comparison of Waste Loading Estimates for Selected Wastes ............................................................ 54
1
1.0 Introduction and Background
The U.S. Department of Energy (DOE) is committed to cleaning up the legacy wastes from roughly 50 years of nuclear weapons materials production at the Hanford and Savannah River Sites. The cornerstone of these efforts is the vitrification of high-level radioactive tank waste (HLW). At the Savannah River Site (SRS), HLW is being retrieved from the tanks, separated into low-activity waste (LAW) and HLW fractions. The HLW fraction is being vitrified into borosilicate waste glass at the Defense Waste Processing Facility (DWPF) while the LAW fraction is immobilized in a cementitious waste form called salt stone. The DOE Office of River Protection (ORP) is constructing the Hanford Tank Waste Treatment and Immobilization Plant (WTP) to separate Hanford HLW into LAW and HLW fractions, to vitrify the HLW fraction into borosilicate glass, and to vitrify a portion of the LAW fraction into a borosilicate glass. The melters used at DWPF and planned to be used at WTP are liquid-fed, ceramic-lined, metal-electroded, Joule-heated melters (LFCM). The LFCM, first developed at the Pacific Northwest National Laboratory in 1970 has been fully developed, tested, and deployed at the West Valley Demonstration Project (WVDP), DWPF and a number of international waste vitrification plants; and therefore represents the most mature technology for treatment of current US HLW inventories. The LFCM was selected for Hanford HLW vitrification after a number of expert reviews of potential melter technologies (Brinko et al. 2003; Calmus 1995; Elliott et al. 1996; Perez et al. 2001) and was the technology proposed by the contractors selected for the Hanford Waste Vitrification Plant (HWVP), Tank Waste Remediation System – Privatization (TWRS-P), and WTP projects. The selection of the LFCM, in each case, was primarily due to good general performance and high technical readiness.
The rate of glass production and loading of waste in glass is strongly dependent on glass melter design and operation. Melters with higher throughput rate may shorten cleanup missions; in addition melters that allow for higher waste loading in glass may significantly reduce lifecycle costs. The cold crucible induction melter (CCIM) technology offers the potential for higher vitrification process temperatures which could lead to increased waste loading and melting rates for feeds that are troublesome for the reference LFCM technology. Furthermore, the bottom pouring configuration and ability to fully empty may make the CCIM more tolerant to crystallization within the melter and reduce some of the constraints associated with crystal formation in the LFCM. Recently completed melter demonstrations with varying melter feeds have shown that the CCIM is flexible and robust with respect to variations in feeds as a result of different vitrification flowsheet conditions.
A number of recent studies have been performed to generate the data necessary to determine the suitability and quantify the costs, risks, and benefits of the CCIM technology in immobilizing DOE HLW. These studies include scaled melter tests, preliminary plant design, and waste form development and testing. Scaled melter tests were performed with the aim of process proof-of-principle, generation of design data, and determining process limits as summarized by Marra (2013). Preliminary design work was performed for a potential retrofit of the DWPF with a CCIM under the Advanced Remediation Technologies (ART) project (Lauzel and Thurin 2009). Preliminary design efforts for a potential retrofit of the WTP using CCIM were initiated, but, not completed or reported. Glass development efforts have been conducted for vitrification of Hanford and Savannah River Site tank wastes and Idaho sodium bearing waste using a CCIM. Phosphate based glass formulations have been described by Day and Ray (2013). The previously completed silicate-based waste form development efforts are summarized in this report along with new CCIM glass formulation results for Hanford HLW compositions.
2
2.0 Quality Assurance
The Pacific Northwest National Laboratory (PNNL) Quality Assurance (QA) Program is based on the requirements defined in U.S. Department of Energy (DOE) Order 414.1D, Quality Assurance, and 10 CFR 830, Energy/Nuclear Safety Management, Subpart A – “Quality Assurance Requirements” (also known as the “Quality Rule”). PNNL has chosen to implement the following consensus standards in a graded approach:
ASME NQA-1-2000, Quality Assurance Requirements for Nuclear Facility Applications, Part I, “Requirements for Quality Assurance Programs for Nuclear Facilities.”
ASME NQA-1-2000, Part II, Subpart 2.7, “Quality Assurance Requirements for Computer Software for Nuclear Facility Applications”, including problem reporting and corrective action.
ASME NQA-1-2000, Part IV, Subpart 4.2, “Guidance on Graded Application of Quality Assurance (QA) for Nuclear-Related Research and Development.”
To provide detailed instructions to staff performing research work under the Environmental Management Support Program (EMSP), the EMSP supplements the PNNL Laboratory-wide QA Program and procedures with the program-specific EMSP QA Program and an associated suite of implementing procedures. The EMSP implements an NQA-1-2000 Quality Assurance Program, graded in accordance with the approach presented in NQA-1-2000, Part IV, Subpart 4.2, which defines the three phases of research and development as Basic Research, Applied Research, and Developmental Work.
The research work described in this report was planned as Applied Research in accordance with the EMSP QA Program and is documented in Test Plan TP-EMSP-0012, Next Generation Cold Crucible Induction Melter Glass Formulation Development. Shortly after the Test Plan was issued, funding for this activity was de-obligated and project closeout was initiated. Although the planned experimental work and reporting tasks were completed, the full QA rigor associated with Applied Research was not implemented. Therefore, the results presented in this report should be considered “For Information Only” (FIO) and are not provided with the full QA pedigree associated with Applied Research.
3
3.0 Previous Silicate Glass Formulation Efforts for CCIM Processing of U.S. Tank Wastes
To take full advantage of the potential benefits of the CCIM in processing U.S. tank waste, glass compositions must be tailored specifically for the melter in which the waste is vitrified. The subsections below list the silicate based glass formulation efforts performed specifically for vitrification of U.S. tank wastes in CCIMs. Appendix A summarizes the property constraints assumed for each of the formulation efforts. A summary of silicate based CCIM demonstration tests and associated CCIM melter descriptions are reported in a companion document (Marra 2013).
3.1 Hanford TWRS-P HLW
In 1998 a team comprised of Société générale pour les techniques nouvelles (SGN), Commissariat à l'énergie atomique (CEA), and Pacific Northwest National Laboratory (PNNL) developed and tested for the first time, Hanford HLW glass formulations targeted to be produced in a CCIM (Nicaise et al. 1999). In this study, glasses were formulated for two simulated Hanford HLW compositions representing the first three tanks to be immobilized under the Tank Waste Remediation System – Privatization (TWRS-P) program: 1) a blend of tanks 241-AZ-101 and 241-AZ-102; and, 2) 241-C-106. The property limits used for the formulation included the waste form quality related requirements derived from the Waste Acceptance Product Specifications for Vitrified High-Level Waste Forms (WAPS) (DOE 1996), plus specific processing related properties for the CCIM based on roughly 15 years of testing at CEA:
Product Consistency Test method A (PCT-A) normalized releases of Na, B, and Li below the Defense Waste Processing Facility (DWPF) Environmental Assessment (EA) glass for both quenched and simulated canister-centerline cooled (CCC) samples.
No measureable nepheline in the quenched or CCC samples (to ensure that CCC PCT was both acceptable and predictable).
Processing temperature of 1200°C. Viscosity (η) at 1200°C between 7 and 15 Pa·s. Electrical conductivity (ε) at 1200°C between 10 and 50 S/m. Liquidus temperature (TL) less than 1200°C
The resulting formulations are given in Table 1. Pilot scale (at 40% of full plant scale) testing based on these two compositions suggested that they could be successfully processed in a CCIM with calciner and would meet all product quality constraints (Nicaise et al. 1999). The processing temperature for the AZ-Blend waste was increased from the target of 1200°C to 1300°C during the test to reduce viscosity (from 15.5 to 7.4 Pa·s) and increase melting rate; while the C-106 glass was successfully processed at 1200°C. The temperature and crystal content constraints assumed did not fully challenge the potential for the CCIM. Ladirat et al. (2001) reported follow-on formulation and melter testing work with the same HLW compositions. Although they do not report the specifics of the formulation, they do report increased waste loading (~31% for AZ-Blend; ~44% for C-106) until both the TL = 1220°C and the nepheline constraint were met. The glass was successfully processed with liquid slurry fed directly into the CCIM and a melt temperature of 1300°C.
4
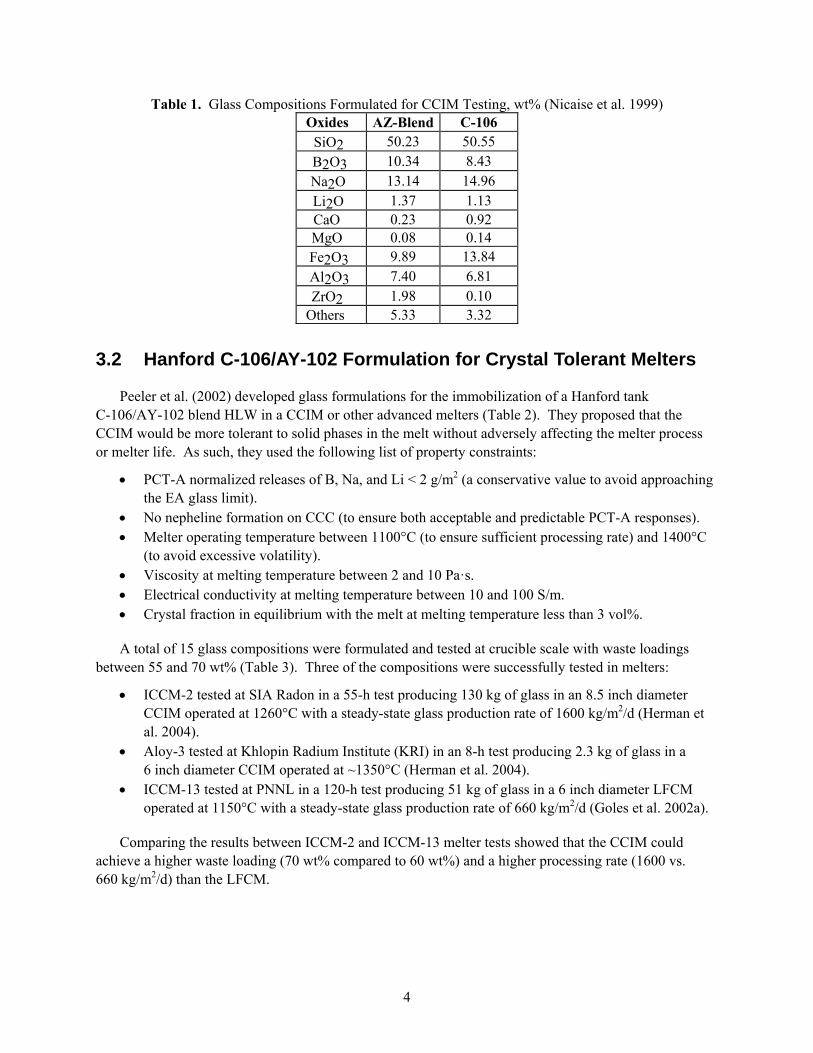
Table 1. Glass Compositions Formulated for CCIM Testing, wt% (Nicaise et al. 1999) Oxides AZ-Blend C-106
3.2 Hanford C-106/AY-102 Formulation for Crystal Tolerant Melters
Peeler et al. (2002) developed glass formulations for the immobilization of a Hanford tank C-106/AY-102 blend HLW in a CCIM or other advanced melters (Table 2). They proposed that the CCIM would be more tolerant to solid phases in the melt without adversely affecting the melter process or melter life. As such, they used the following list of property constraints:
PCT-A normalized releases of B, Na, and Li < 2 g/m2 (a conservative value to avoid approaching the EA glass limit).
No nepheline formation on CCC (to ensure both acceptable and predictable PCT-A responses). Melter operating temperature between 1100°C (to ensure sufficient processing rate) and 1400°C
(to avoid excessive volatility). Viscosity at melting temperature between 2 and 10 Pa·s. Electrical conductivity at melting temperature between 10 and 100 S/m. Crystal fraction in equilibrium with the melt at melting temperature less than 3 vol%.
A total of 15 glass compositions were formulated and tested at crucible scale with waste loadings between 55 and 70 wt% (Table 3). Three of the compositions were successfully tested in melters:
ICCM-2 tested at SIA Radon in a 55-h test producing 130 kg of glass in an 8.5 inch diameter CCIM operated at 1260°C with a steady-state glass production rate of 1600 kg/m2/d (Herman et al. 2004).
Aloy-3 tested at Khlopin Radium Institute (KRI) in an 8-h test producing 2.3 kg of glass in a 6 inch diameter CCIM operated at ~1350°C (Herman et al. 2004).
ICCM-13 tested at PNNL in a 120-h test producing 51 kg of glass in a 6 inch diameter LFCM operated at 1150°C with a steady-state glass production rate of 660 kg/m2/d (Goles et al. 2002a).
Comparing the results between ICCM-2 and ICCM-13 melter tests showed that the CCIM could achieve a higher waste loading (70 wt% compared to 60 wt%) and a higher processing rate (1600 vs. 660 kg/m2/d) than the LFCM.
(a) Components Cl, F, SO3, and UO2 were removed and the waste compositions renormalized for crucible-scale and melter-scale testing.
(b) Component PdO, Rh2O3, and RuO2 were removed for melter-scale testing (but, included in crucible scale testing) and the waste compositions renormalized.
6
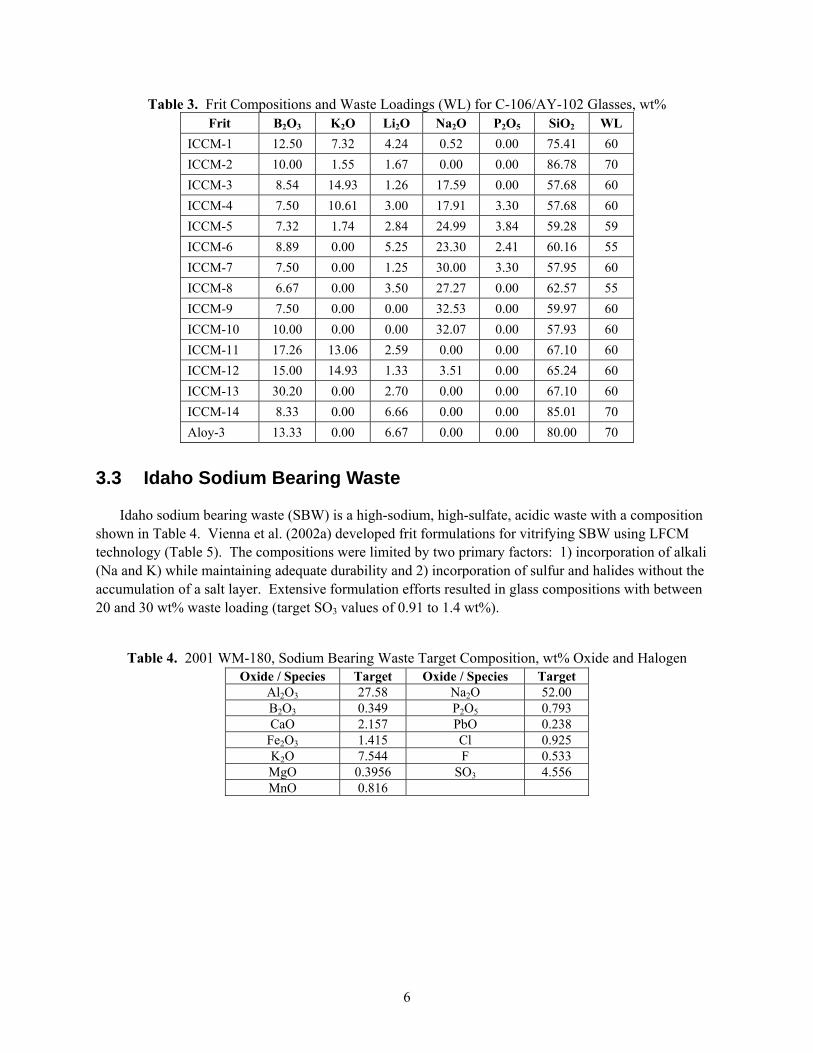
Table 3. Frit Compositions and Waste Loadings (WL) for C-106/AY-102 Glasses, wt% Frit B2O3 K2O Li2O Na2O P2O5 SiO2 WL
ICCM-1 12.50 7.32 4.24 0.52 0.00 75.41 60
ICCM-2 10.00 1.55 1.67 0.00 0.00 86.78 70
ICCM-3 8.54 14.93 1.26 17.59 0.00 57.68 60
ICCM-4 7.50 10.61 3.00 17.91 3.30 57.68 60
ICCM-5 7.32 1.74 2.84 24.99 3.84 59.28 59
ICCM-6 8.89 0.00 5.25 23.30 2.41 60.16 55
ICCM-7 7.50 0.00 1.25 30.00 3.30 57.95 60
ICCM-8 6.67 0.00 3.50 27.27 0.00 62.57 55
ICCM-9 7.50 0.00 0.00 32.53 0.00 59.97 60
ICCM-10 10.00 0.00 0.00 32.07 0.00 57.93 60
ICCM-11 17.26 13.06 2.59 0.00 0.00 67.10 60
ICCM-12 15.00 14.93 1.33 3.51 0.00 65.24 60
ICCM-13 30.20 0.00 2.70 0.00 0.00 67.10 60
ICCM-14 8.33 0.00 6.66 0.00 0.00 85.01 70
Aloy-3 13.33 0.00 6.67 0.00 0.00 80.00 70
3.3 Idaho Sodium Bearing Waste
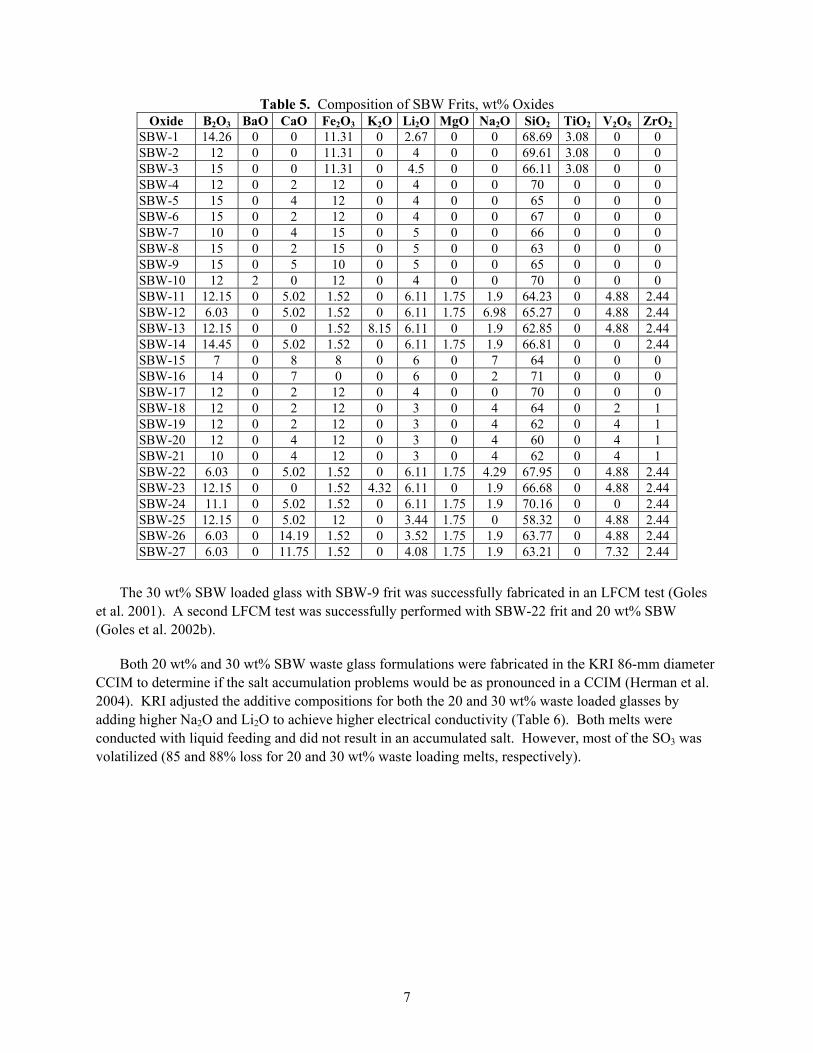
Idaho sodium bearing waste (SBW) is a high-sodium, high-sulfate, acidic waste with a composition shown in Table 4. Vienna et al. (2002a) developed frit formulations for vitrifying SBW using LFCM technology (Table 5). The compositions were limited by two primary factors: 1) incorporation of alkali (Na and K) while maintaining adequate durability and 2) incorporation of sulfur and halides without the accumulation of a salt layer. Extensive formulation efforts resulted in glass compositions with between 20 and 30 wt% waste loading (target SO3 values of 0.91 to 1.4 wt%).
Table 4. 2001 WM-180, Sodium Bearing Waste Target Composition, wt% Oxide and Halogen Oxide / Species Target Oxide / Species Target
The 30 wt% SBW loaded glass with SBW-9 frit was successfully fabricated in an LFCM test (Goles et al. 2001). A second LFCM test was successfully performed with SBW-22 frit and 20 wt% SBW (Goles et al. 2002b).
Both 20 wt% and 30 wt% SBW waste glass formulations were fabricated in the KRI 86-mm diameter CCIM to determine if the salt accumulation problems would be as pronounced in a CCIM (Herman et al. 2004). KRI adjusted the additive compositions for both the 20 and 30 wt% waste loaded glasses by adding higher Na2O and Li2O to achieve higher electrical conductivity (Table 6). Both melts were conducted with liquid feeding and did not result in an accumulated salt. However, most of the SO3 was volatilized (85 and 88% loss for 20 and 30 wt% waste loading melts, respectively).
8
Table 6. Target Composition of Modified SBW Glasses Tested at KRI, wt% Oxide
The recommended SBW-22 frit with 20 wt% SBW loading glass composition (same composition as the LFCM test reported above) was successfully fabricated at Radon in the 216 mm CCIM operated at 1350°C (Herman et al. 2004). Despite the higher melting temperature, only 18% loss of SO3 was measured.
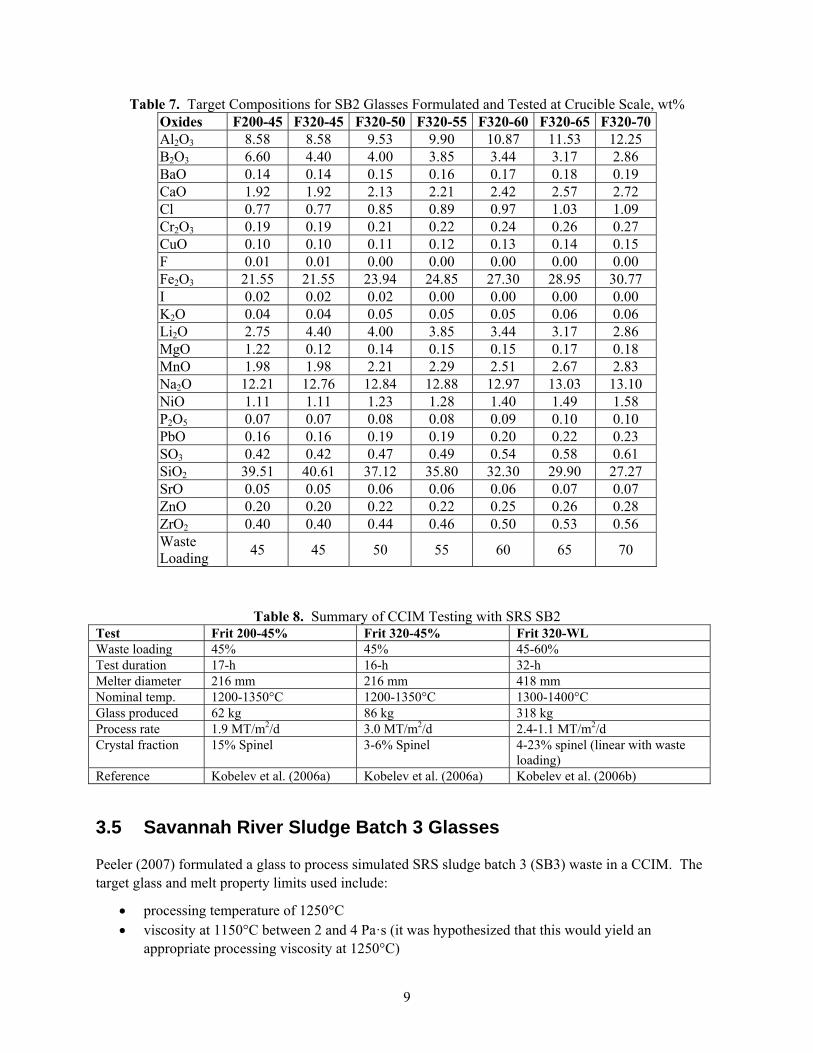
3.4 Savannah River Sludge Batch 2 Glasses
Frit 200 was formulated for the Savannah River coupled flowsheet which combined the HLW sludge with the Precipitate Hydrolysis Aqueous (PHA) product of the in tank precipitation (ITP) process (Jantzen 1988). As the ITP process was never fully implemented at SRS, frit 200 was an adequate but not ideal frit formulation for operation of the DWPF. Frit 320 was formulated as a joint SRNL and PNNL activity to increase the loading and throughput of the DWPF operating a sludge only flowsheet (Peeler et al. 2001). Both these frits were used in DWPF processing and were tested in CCIM tests with SRS sludge batch 2 (SB2) simulated waste composition for direct comparison. Although the frit compositions were not adjusted compared to those used in DWPF, the waste loading did increase for CCIM testing. Table 7 lists the laboratory-scale crucible melt compositions for the CCIM test glasses developed. Table 8 summarizes the SB2 frit 200 and frit 320 glass results chosen for CCIM melter testing. Column “Frit 320-WL” in Table 8 is a compilation of data from melter runs that incrementally reached a 60 wt% waste loading to evaluate maximum waste loading. It is interesting to note that the crystal contents ranged from 3 to 23 wt% spinel in melter pour stream samples, suggesting that high crystal content glasses could be processed in the CCIM.
Table 8. Summary of CCIM Testing with SRS SB2 Test Frit 200-45% Frit 320-45% Frit 320-WL Waste loading 45% 45% 45-60% Test duration 17-h 16-h 32-h Melter diameter 216 mm 216 mm 418 mm Nominal temp. 1200-1350°C 1200-1350°C 1300-1400°C Glass produced 62 kg 86 kg 318 kg Process rate 1.9 MT/m2/d 3.0 MT/m2/d 2.4-1.1 MT/m2/d Crystal fraction 15% Spinel 3-6% Spinel 4-23% spinel (linear with waste
loading) Reference Kobelev et al. (2006a) Kobelev et al. (2006a) Kobelev et al. (2006b)
3.5 Savannah River Sludge Batch 3 Glasses
Peeler (2007) formulated a glass to process simulated SRS sludge batch 3 (SB3) waste in a CCIM. The target glass and melt property limits used include:
processing temperature of 1250°C viscosity at 1150°C between 2 and 4 Pa·s (it was hypothesized that this would yield an
appropriate processing viscosity at 1250°C)
10
TL < 1150°C normalized releases of B, Na, and Li below the EA glass level by PCT-A no nepheline formation on CCC.
A paper study was performed in which the target SB3 was combined with a series of frit compositions and the properties of the resulting glasses were estimated using the DWPF process models. Table 9 lists the nominal SB3 composition used and Table 10 lists the candidate frit compositions considered. Based on this analysis, the Frit 202-11A composition allowed for the maximum waste loading before exceeding predicted property requirements and was selected for further testing (Peeler et al. 2007a).2
2 Composition 202-11A should not be confused with composition 202 (B2O3 = 8, Na2O = 6, Li2O = 7, MgO = 2, and SiO2 = 77 wt %) developed by C. M. Jantzen, Glass Compositions and Frit Formulations Developed for DWPF (Aiken, SC: Savannah River Laboratory, 1988).
11
Glass samples composed of frit 202-11A and SB3 in waste loading of 44, 45, 46, 48, 50, 52, 54, 55, 56, and 58 were fabricated at crucible scale for characterization. Glasses above 50% waste loading did not form nepheline on slow cooling while several glasses below 50% waste loading did. The TL of the 50% waste loading glass was measured at slightly above the target processing temperature of 1250°C. The viscosities of the 50% waste loading glass were 2 and 1.3 Pa·s at 1250 and 1300°C, respectively. Based on these results, it was recommended that a 50% waste loading glass with frit 202-11A and SB3 be tested in the CCIM (Peeler et al. 2007b).
An exploratory test was performed in the 650 mm CCIM at CEA with a melt temperature of 1250°C (Girold et al. 2008). During this run, 336 kg of glass were fabricated with a steady state glass production rate of 898 kg/m2/d. The PCT-A response of the CCC cooled glass samples were found to be significantly degraded compared to the as-poured glass with the cause identified as nepheline in the CCC samples. Therefore it was decided to increase the loading of waste in glass for the baseline test to 52 wt% waste loading.
A baseline test was performed in the 650 mm CCIM at CEA using two melt temperatures – 1250 and 1300°C (Girold et al. 2008). A total of 477 kg of glass were produced with melting rates of 1512 and 1807 kg/m2/d for the two process temperatures. Glass product analyses showed no presence of nepheline on as-poured or CCC samples and good, and predictable, PCT-A responses. No mention was made of the spinel content of the melter glass, although crucible tests showed spinel in the quenched and CCC samples of this glass (Peeler et al. 2007a).
3.6 Savannah River Sludge Batch 4 Glasses
Marra et al. (2008) formulated glasses for CCIM fabrication of SRS sludge batch 4 (SB4) waste (Table 11). In determining the property constraints for glass formulation it was recognized that previous tests showed that significant crystal fractions can be processed through a CCIM, at least during short term tests. Although a specific crystallinity criterion is needed for long-term application of CCIM to U.S. wastes, Marra et al. (2008) opted to formulate glass compositions with TL ≤ melter operating temperature. The target properties used in the formulation effort include:
Melting temperature of 1250°C TL ≤ 1250°C No nepheline formation in quenched or CCC glass PCT-A responses below those of the EA glass
Redox, viscosity, electrical conductivity, and thermal conductivity were to be monitored, but, not constrained in initial formulation efforts.
12
Table 11. Nominal SB4 Composition, wt% Oxide Concentration Al2O3 28.16 BaO 0.08 CaO 3.06
Frit 503, developed for DWPF operation, was used as a starting point for formulation efforts and systematic variations around that frit composition were made for candidate SB4 glass formulations. Frit 503-R4 was developed and used for SB4 CCIM testing with higher levels of spinel crystallization due to higher liquidus temperatures. Frit 503-R4 was then modified by increased boron or alkali content to decrease the liquidus temperature. Table 12 lists these frit compositions derived from frit 503-R4 (i.e., 503-R3, 503-R6, and 503-R7). Compositions of frits 503 and 503-R4 are provided in Table 12 for comparison. Glasses were fabricated and tested with frits 503-R3, -R4, -R6, and –R7 at 45, 50, and 55 wt% SB4 loading (plus 503-R4 at 40 wt% waste loading).
Frit 503-R4 replaced the 4 wt% Na2O in frit 503 with additional 2 wt% of both B2O3 and SiO2. It was selected for a series of CCIM tests conducted at Radon with waste loadings varying from 40 to 70 wt% (Kobelev et al. 2009; Kobelev et al. 2007; Marra et al. 2010; Stefanovsky et al. 2010; Stefanovsky et al. 2009). These tests, summarized by Marra (2013), investigated the ability to process melts with increasing concentrations of spinel. The melt with 40% SB4 and 60% frit 503-R4 has essentially no crystal content in the melt (TL = 1088°C). The 50% waste loading melt contained 5-7 vol% spinel while the 60% waste loading melt had 10 vol% spinel in small (236 mm) CCIM tests (Kobelev et al. 2007). The larger CCIM (418 mm) test using 50% waste loading produced roughly 12 vol% spinel (Kobelev et al. 2009). The
13
higher spinel fraction in the larger test was attributed to a larger pour canister of glass with slower cooling.
Marra et al. (2010) found strong evidence of spinel accumulation in the 216 mm CCIM test performed with frit 503-R4 and 55 wt% SB4 loading. Roughly 250% relative increase in spinel components were found in chemical analysis of the melter dead-zone compared to the pour stream. This suggests that although short-term tests with significant concentration of spinel (~10 vol%) in the melt is possible, long-term operation may be more problematic.
3.6.2 Frit 503-R3 (KHNP)
Frit 503-R3 replaced 2 wt% of Na2O in frit 503 with additional 2 wt% of B2O3. It was selected for a 550 mm CCIM (with 12 bubblers) test conducted at Korea Hydro and Nuclear Power (KHNP) research center with waste loading of 50 wt% (Smith 2008; Smith et al. 2009). The total alkali content of this glass was slightly increased from that of frit 503-R4 to increase the electrical conductivity at the targeted melting temperature of 1250°C. Crucible tests determined the TL of this glass to be 1252°C. Trace amount of spinel were seen in the as-received pour stream samples from the KHNP test. Smith (2008) notes difficulty in glass pouring that may have been due to crystal accumulation in the melter bottom.
An additional note of concern from this test was a higher concentration of Na2O in the fabricated glass compared to the target value (15% vs 11.3). Because of this composition difference, CCC heat-treated samples from the KHNP melter test contained a significant concentration of nepheline and had PCT-A responses more than an order of magnitude higher than the as-received samples and exceeded the EA glass limit.
3.6.3 Frit 503-R6 (CEA)
Frit 503-R6 replaced 1 wt% of the Na2O in frit 503 with Li2O. It was selected for a 650 mm CCIM test conducted at CEA with a waste loading of 46 wt% (Marra et al. 2008). This composition and waste loading reduced TL to well below the 1250°C target operating temperature and added sufficient room for potential composition variation while maintaining all the properties in the acceptable range. A 12 glass study was performed to determine the properties of the glass with expected potential composition variations around the target formulation (Marra et al. 2008). Across the expected composition region, only two of the 12 glasses contained trace concentrations of spinel in as fabricated glass (48% waste loading and high Cr2O3 + NiO). The PCT responses were all well below the EA glass limit for both as-fabricated and CCC samples of the composition variation study glasses. The PCT responses of the CCC samples were generally higher than the as fabricated samples. One glass contained a small amount of nepheline after CCC and resulted in the largest difference between as fabricated and CCC PCT responses.
During a 72 hour test performed using the 650 mm (Creuset Froid Avancé) CCIM at CEA 2259 kg of glass were produced with average and maximum production rates of 2,260 and 2,921 kg/m2/d (Delaunay et al. 2009; Veyer et al. 2009). Small concentrations of spinel were discharged in the melter pour stream and there was some evidence of a spinel layer at the bottom of the melter that did not appear to grow with time or disrupt pouring.
14
3.7 Hanford AZ-101 High Level Waste Glass
Hanford tank AZ-101 was selected as a representative PUREX waste with relatively high iron, aluminum, and zirconium concentration for glass formulation efforts (Kim et al. 2011). Table 13 lists the nominal composition used in glass formulation efforts. Initial formulation development was performed with the following property constraints:
Melting temperature (TM) < 1500°C Viscosity at TM ≅ 4 Pa·s Electrical conductivity at TM between 10 and 100 S/m TCLP Cd response for quenched and CCC samples < 0.48 mg/L PCT-A response for quenched and CCC samples < EA glass values No nepheline in CCC samples.
Variable TM and crystal fraction as a function of temperature values were evaluated during the formulation. Glass property models (Vienna et al. 2009) were used to formulate a series of 16 candidate glass formulations as listed in Table 14. Seven of the 16 compositions did not form a homogeneous glass when melted at the targeted TM (temperature at predicted viscosity of roughly 4 Pa·s). These glasses, marked with “No” in the “char” row were not further characterized. The CCC crystallinity of all glasses were acceptable with between 4 and 6 vol% spinel, between 0 and 1.3 vol% baddeleyite, and no nepheline. PCT-A responses of all quenched and CCC samples were roughly an order of magnitude below the EA limit with no significant difference between quenched and CCC heat treatments. The TCLP responses of all quenched and CCC samples were acceptable. The crystal fraction of samples decreased systematically with both increasing temperature and decreasing waste loading. Three compositions were selected for the best mix of properties for their target waste loadings AZ-10 (45.1 wt% waste loading), AZ-16 (42.5), and AZ-29 (39.8). The viscosity (3.8-4.1 Pa·s) and electrical conductivity (21-30 S/m) of these formulations were all measured to be satisfactory at the target TM=1200°C.
TM, °C 1250 1250 1200 1300 1200 1200 1200 1200 1150 1200 1200 1200 1200 1200 1200 1200 Char No No No No No Yes Yes Yes Yes No No Yes Yes Yes Yes Yes
16
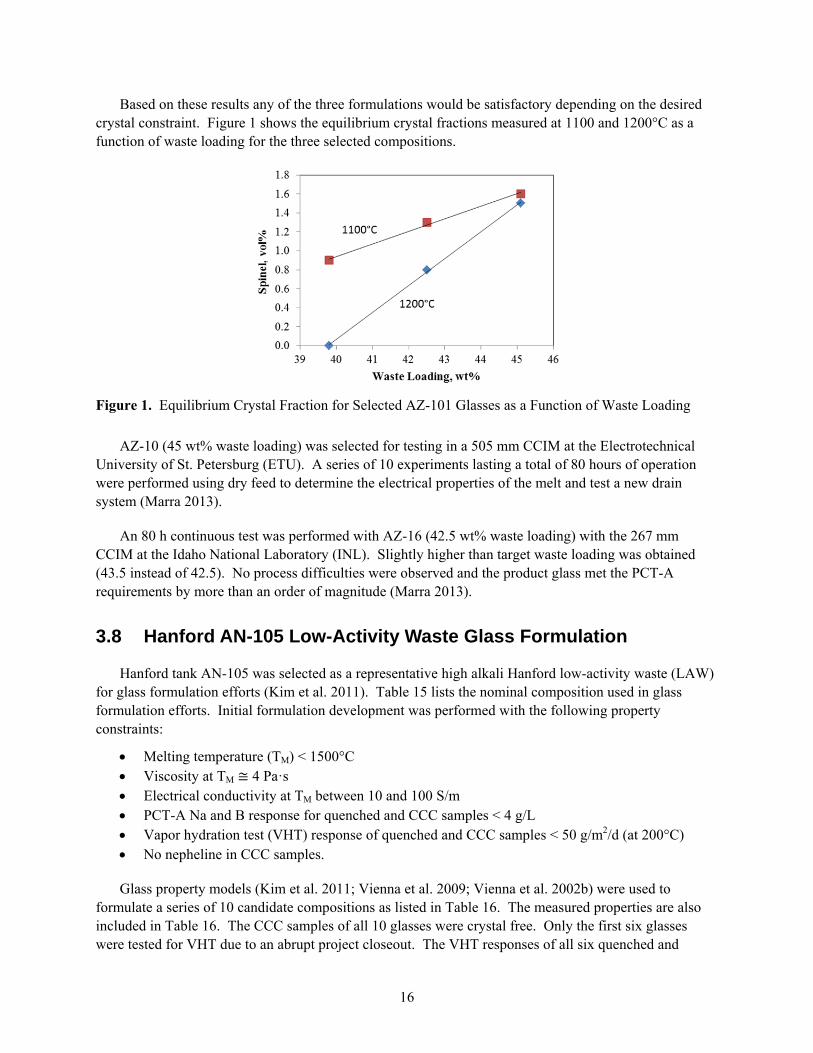
Based on these results any of the three formulations would be satisfactory depending on the desired crystal constraint. Figure 1 shows the equilibrium crystal fractions measured at 1100 and 1200°C as a function of waste loading for the three selected compositions.
Figure 1. Equilibrium Crystal Fraction for Selected AZ-101 Glasses as a Function of Waste Loading
AZ-10 (45 wt% waste loading) was selected for testing in a 505 mm CCIM at the Electrotechnical University of St. Petersburg (ETU). A series of 10 experiments lasting a total of 80 hours of operation were performed using dry feed to determine the electrical properties of the melt and test a new drain system (Marra 2013).
An 80 h continuous test was performed with AZ-16 (42.5 wt% waste loading) with the 267 mm CCIM at the Idaho National Laboratory (INL). Slightly higher than target waste loading was obtained (43.5 instead of 42.5). No process difficulties were observed and the product glass met the PCT-A requirements by more than an order of magnitude (Marra 2013).
Hanford tank AN-105 was selected as a representative high alkali Hanford low-activity waste (LAW) for glass formulation efforts (Kim et al. 2011). Table 15 lists the nominal composition used in glass formulation efforts. Initial formulation development was performed with the following property constraints:
Melting temperature (TM) < 1500°C Viscosity at TM ≅ 4 Pa·s Electrical conductivity at TM between 10 and 100 S/m PCT-A Na and B response for quenched and CCC samples < 4 g/L Vapor hydration test (VHT) response of quenched and CCC samples < 50 g/m2/d (at 200°C) No nepheline in CCC samples.
Glass property models (Kim et al. 2011; Vienna et al. 2009; Vienna et al. 2002b) were used to formulate a series of 10 candidate compositions as listed in Table 16. The measured properties are also included in Table 16. The CCC samples of all 10 glasses were crystal free. Only the first six glasses were tested for VHT due to an abrupt project closeout. The VHT responses of all six quenched and
17
six CCC samples were roughly an order of magnitude below the limit with no significant increase between quenched and CCC heat treatments. The PCT responses of all quenched and CCC samples were acceptable with the exception of the quenched PCT boron response of AN-11 which was slightly above 4 g/L. Based on the results of the initial tests, two glasses AN-09 and -18 were selected for further characterization – both with 24 wt% Na2O. The measured viscosity was roughly 4 Pa·s for both glasses at TM = 1250°C. The electrical conductivities at TM of 44 and 53 S/m were well within the acceptable range.
Table 15. Nominal Composition of AN-105 LAW, wt% Component Concentration
No CCIM tests were performed with these AN-105 glass compositions.
3.9 Hanford HLW Waste Cluster Groups
Kim et al. (2011) performed statistical analyses of projected Hanford HLW compositions to “clusters” of like waste composition. The clusters were further combined into groups of waste compositions based on the projected glass compositions and associated waste loading limitations. The six groups are:
High-Al2O3 which contain more than roughly 50% Al2O3 in waste. Formulation for these wastes is dominated by controlling nepheline formation and to a lesser extent TL (or other spinel crystal constraint).
High-Fe2O3 which contain roughly 35% Fe2O3 in waste. Formulation for these wastes is dominated by controlling TL (or other spinel crystal constraint) and to a lesser extent nepheline formation. Examples of wastes similar to those in this group include SB2, SB3, SB4, and AZ-101 discussed earlier.
19
Spinel limited which contain intermediate concentrations of Fe2O3 (15-20 wt%) and Al2O3 (15-40 wt%) and relatively high concentrations of Cr2O3 plus NiO (3.5 to 6 wt%). Formulation for these wastes is dominated by controlling TL (or other spinel crystal constraint).
Cr2O3 and SO3 limited which contain between 5 and 11 wt% Cr2O3 plus SO3. Formulation for these wastes is dominated by controlling salt accumulation in the melter and to a lesser extent TL (or other spinel/eskolaite related constraint).
P2O5 and CaO limited which contain between 10 and 15 wt% P2O5 and CaO. Formulation for these wastes is dominated by controlling immiscible phase separation of the melt and refractory phases in the cold-cap (so-called killer scum).
High-Na2O which contain greater than 50 wt% Na2O. Formulation for these wastes is dominated by chemical durability.
All of the Hanford HLW composition estimates from 2008 can be grouped into one of these categories. It was decided to formulate high waste loading glasses for each of these six groups for both the reference LFCM and the CCIM in order to directly compare the waste loadings and processing rates. Although the work was initiated for the spinel limited and Cr2O3 and SO3 limited waste groups, the project ended before it could be completed. The results to date are documented in Kim et al. (2011) and summarized here.
No complete testing was performed on any glass formulated for the spinel limited and Cr2O3 and SO3 waste groups; however, several glass compositions were batched and melted. Only a fraction of the formulated spinel limited glasses formed a single phase glass on melting at their target temperature of 1200°C. One parameter that appeared to strongly influence the ability to form a glass at 1200°C was the combined Al2O3+Fe2O3+ZrO2 wt% which ranged from 27-35 for successful glasses. Salt accumulation was found in all Cr2O3 and SO3 waste group crucible glass melts with all but one glass containing 3 wt% Cr2O3 and 0.81 wt% SO3. The one glass (CCIM-HCC14-2) contained the highest B2O3 concentration (14 wt%) and the lowest Na2O concentration (12.3 wt%) of the test glasses. Based on this, four glasses were fabricated with a higher waste loading (containing 3.5 wt% Cr2O3 and 0.94 wt% SO3); all with higher B2O3 (14-17 wt%) and lower Na2O (9.1-12.7 wt%). All four higher loaded glasses formed a salt in the crucible upon melting at 1200°C. This suggests that the optimal Cr2O3 and SO3 concentrations for this waste would be roughly 3 and 0.8 wt%. It should be noted that formation of a salt in crucible melts is not necessarily indicative of formation of salt in a melter. Also, previous experience has shown that the tendency to form salt (in either crucible melts or melter tests) is strongly dependent on the melt composition and operating conditions.
3.10 Summary of Key Processing Related Properties for CCIM Test Glasses
Summarizing the results from melter testing will give insight into the range of allowable viscosity, electrical conductivity, and crystal content in the melt. This will aid in future CCIM glass formulation efforts. Table 17 summarizes these properties for the tests described in Marra 2013. Many of the key properties were not reported in the test report. In those cases, the viscosity and conductivity were estimated using glass property models from Vienna et al. 2009. Generally our experience is that these particular models are relatively accurate across a wide range of composition as shown in Section 3.0. However, it should be noted that, when significant crystal content is present in the melt (more than roughly 5 volume percent), the rheology may be strongly impacted by the crystals and therefore viscosity
20
measurements (which were measured using procedures appropriate for single phase melts) and model predictions (which were predicted for models only appropriately applied to single phase melts) are not valid.
The first comment is that successful melts were obtained with significant concentration of spinels in the melt. Multiple tests with between 10 and 15 vol% spinel (roughly 20 to 30 wt% spinel) were successful, at-least for the sort term tests performed. One test with 17 vol% spinel showed difficulty pouring along with another test that reported the presence of spinel, but without the volume fraction information. This suggests significantly higher spinel tolerance than what is anticipated from the reference LFCM technology currently deployed in the U.S. To determine the exact crystal phase tolerance, longer-term tests with melters containing prototypic mixing and pouring mechanisms to the melter likely to be deployed would be required. Until a final design is set and tested, formulation and testing should be performed with significant crystal content including melts with 10 vol% or more.
Generally, slow melting was observed when measured (or predicted) viscosity values at the melting temperature (TM) exceeded 6 Pa·s. There are three exceptions:
1. the mechanically stirred CEA melter that processed fine at 7.4 and 11 Pa·s, but not at 15.5 Pa·s 2. the very small (86 mm diameter) KRI melter that processed fine with one melt at 11 Pa·s, but
processed slow with a different melt at 6 Pa·s.
Based on this observation and the inherent tolerance to melt corrosion, it is recommended that the target viscosity range for CCIM waste glass formulations span between 0.6 and 6 Pa·s with a nominal target at the average point for successful melts of roughly 2 Pa·s at TM.
Successful melts were achieved with electrical conductivity values ranging from 21 to 79 S/m at TM. The conductivity and viscosity as functions of temperature need to be tuned for the melter keeping in mind the coil frequency, number of coils, melter diameter, and other key melter parameters. Roach (2014)3 gives a discussion of these factors. Until a final design is set and tested, it is recommended to use a conductivity constraint of 20 to 80 S/m at TM for formulation purposes.
3 Roach JA and DB Lopukh. “Topical Report – Cold Crucible Induction Melter Technology.” NuVision Engineering, Frederick, MD 21704. (To be published May 2014).
21
Table 17. Summary of Key Processing Related Properties for CCIM Test Glasses
Glass Reference Melter TM
(°C) Spinel @
TM (vol %) η (Pa·s) @ TM
ε (S/m) @ TM
Comment
AZ-Blend Nicaise et al. 1999 CEA
550 1200 0 15.5 25* Too high η 1300 0 7.4 36* OK
C-106 Nicaise et al. 1999 CEA
550 1200 0 10* 31* OK
ICCM-2
Peeler et al. 2002 Herman et al. 2004 Radon
216
1260 small but detectable
6 21 OK
1200 small but detectable
17
17
Too high nepheline & η
Aloy-3 Peeler et al. 2002 Herman et al. 2004
KRI 155
1350 small but detectable
0.6* 43 OK (reformulated glass)
KRI SBW-20
Herman et al. 2004 KRI 86
1150 NR 6* 39* Too high η 1250 NR 3* 55* OK
KRI SBW-30
Herman et al. 2004 KRI 86
1150 NR 11* 36* OK
SBW-22-20 Vienna et al. 2002a Herman et al. 2004
Radon 216
1350 NR 2 79 OK
SB2-Frit 200-45
Kobelev et al. 2006a Radon 216
1200-1350
~15 1-3* 34-49* Surface temp ranged from 1200 to 1350°C throughout the test, Test OK
SB2-Frit 320-45
Kobelev et al. 2006a Radon 216
1200-1350
4 1-2* 50-69* Surface temp ranged from 1200 to 1350°C throughout the test, Test OK
SB2-Frit 320-50
Kobelev et al. 2006b Radon 418
1350 7 1* 66* OK
SB2-Frit 320-55
Kobelev et al. 2006b Radon 418
1350 12 0.8* 65* OK
SB2-Frit 320-60
Kobelev et al. 2006b Radon 418
1350 17 0.7* 62* Some difficulty in pouring
SB3-Frit 202-A11
Peeler et al. 2007b Girold et al. 2008
CEA 650
1250 some 2 ~43 Slow melting 1300 some 1.3 ~50 Increased temp. = 20% increase in process rate
SB4-Frit 503-R4-40
Marra et al. 2008 Kobelev et al. 2007
Radon 236
1000 to 1310
0 33* 2*
14* 42*
Too high η, increased temp. required for melt pouring OK at 1300-1310°C
SB4-Frit 503-R4-50
Marra et al. 2008 Kobelev et al. 2007
Radon 236
1300 5-7 2* 42* OK
SB4-Frit 503-R4-60
Marra et al. 2008 Kobelev et al. 2007
Radon 236
1300 10 1.5* 45* OK
SB4-Frit Marra et al. 2008 Radon 1300 12 2* 42* OK once 1300°C was used
22
Glass Reference Melter TM
(°C) Spinel @
TM (vol %) η (Pa·s) @ TM
ε (S/m) @ TM
Comment
503-R4-50 Kobelev et al. 2007 418
SB4-Frit 503-R3 -50
Marra et al. 2008 Smith et al. 2008 Smith et al. 2009
KHNP 1250 Detectable,
small amount
~5 ~45 Difficult to pour w/time; possible crystallization in drain valve
SB4-Frit 503-R6-46
Marra et al. 2008 Delaunay et al. 2009 Veyer et al. 2009
*Property predicted using Vienna et al. 2009 models, not measured. NR = not reported
23
4.0 Glass Formulation and Testing for Hanford High-Alumina and High-Iron HLWs
The subsections below describe the results of new CCIM glass formulation efforts for Hanford HLW compositions.
4.1 Selection of Wastes
The selection of wastes for the present glass formulation and testing efforts focused on Hanford waste streams because they are likely to show the highest cost benefit to implementation, considering the size and cost of the Hanford tank waste cleanup program and the timing of startup. INL treatment is likely to show a cost increase because of the low cost baseline options selected, and DWPF will be so far progressed in their program before CCIM implementation that it will have only moderate cost impacts.
Settling of plutonium-bearing particles > 10 µm in WTP process vessels is a concern for the WTP pretreatment facility (PTF) (Sams 2012). Recently it was estimated that approximately 30 kg of plutonium present in the tank farms was delivered to the Hanford tank farm as >10 µm particulate Pu oxide and Pu metal from processing at the Plutonium Finishing Plant (PFP), PUREX, and REDOX facilities. This inventory is located in 16 tanks; eight with minimal quantities, and eight with appreciable quantities that could challenge the Criticality Safety Evaluation Report (CSER). The eight tanks with appreciable quantity (> 750 g) are TX-105, TX-109 and TX-118, 244-TX, SY-102, C-102, AN-101, and S-108.
Alternative treatment approaches for these tanks with safety concerns for processing within the WTP PTF are being considered. Direct vitrification using a near-tank CCIM unit is a strong candidate. The compositions of the above eight tanks considered for use in initial CCIM glass formulations are given in Table 18, expressed in terms of mass fraction of oxides and halogens (referred to as “oxides” in this report). Table 18 shows only the components that had 0.01 wt% or higher in at least one of the eight tank wastes.
The tank wastes 244-TX and C-102 were selected for initial glass formulations and demonstration for CCIM based on the following reasons. The 244-TX composition has an exceedingly high iron oxide concentration (>59 wt%). This high iron concentration would significantly limit waste loading using the current LFCM technology with a process temperature limit of 1150°C and relatively low crystal tolerance. The C-102 composition has a high Al2O3 concentration (>60 wt%). The high alumina concentration limits waste loading due to the propensity to form nepheline and spinel in glasses with high alumina contents. These wastes also represent Hanford HLW composition families in general (as described by Kim et al. 2011). Therefore, the information gained from this study may also be helpful for future glass formulation development efforts for Hanford HLWs in general. Table 19 shows the composition of these two wastes after adjusting the full composition (Appendix A) by removing radioactive components (UO3), by replacing PuO2 and ThO2 with ZrO2 and lanthanide and actinide oxides with La2O3 (molar equivalent), and by removing minor components with <0.01 wt%. Each waste was also spiked with Cs2O to ensure adequate analysis of this key volatile component after melter tests if performed.
After deleting components with < 0.0001 in all eight tank wastes (the full composition is given in Appendix A). Bold face represents the concentration of component that is likely to limit waste loading.
(a) Shown for components with >0.01 wt% at least in one of eight tank wastes (the full composition is given in Appendix A).
25
Table 19. Adjusted(a) Composition of Wastes Selected for CCIM Glass Formulation and Testing Comp. 244-TX C-102 Ag2O 0.00011 0.00000 Al2O3 0.00815 0.62541 As2O5 0.00068 0.00000 Bi2O3 0.00000 0.00322 CaO 0.00374 0.01101 Cl 0.00376 0.00213
Cr2O3 0.00232 0.00112 Cs2O 0.00195 0.00202
F 0.00059 0.00493 Fe2O3 0.60805 0.03001 K2O 0.00941 0.00171
(a) Normalized after removing radioactive components (UO3) and minor components with <0.01 wt% and replacing PuO2 and ThO2 with ZrO2 and lanthanide and actinide oxides with La2O3 (molar equivalent).
4.2 Experimental Methods
This section describes the experimental procedures to test the glasses formulated for tank wastes C-102 (High-Al2O3) and 244-TX (High-Fe2O3) described in Section 3.1.
4.2.1 Glass Fabrication and Canister Centerline Cooling Treatment
Glasses for property measurements were prepared in platinum-alloy crucibles with a lid following a two-step melting process. The first melt was of raw materials after mechanically mixing them in an agate milling chamber. Melting was performed nominally for 1 h at a recommended melting temperature that was estimated based on model predicted viscosity (recommended melting temperature is given for all glasses formulated in this study in Sections 3.4 and 3.5). A second melt of the glass was performed after the quenched glass was ground to a fine powder in a tungsten carbide mill. Generally, the temperature of second melt was adjusted, based on the fluidity of the melt estimated during pouring of the first melt. For some glasses with evidence of undissolved materials, a third melt was performed at a higher temperature.
Selected glass melts were cooled according to the CCC profile for WTP HLW glasses as given in Table 20. This cooling is intended to simulate the center line temperature/time profile of melts prepared at 1150C. For glasses with the melting temperature of 1200C or higher, the melt was brought to 1150C, cooled to 1050C at -2C /min, and then cooled following the profile given in Table 20.
26
Table 20. CCC Profile for HLW Glasses Segment Time (min) Start Temp (°C) Rate (°C/min)
To confirm that the “as-fabricated” glasses correspond to the defined target compositions, a representative sample of each glass for selected compositions was chemically analyzed at the SRNL Process Science Analytical Laboratory (PSAL). Two preparation methods were used in measuring these chemical compositions: HNO3 dissolution or lithium metaborate fusion followed by HNO3 dissolution. For each glass, measurements were obtained from samples prepared in duplicate. All of the prepared samples were analyzed (twice for each element of interest) by inductively coupled plasma-atomic emission spectroscopy (ICP-AES).
4.2.3 Product Consistency Test
PCT responses were measured in triplicate on each selected glass, including quenched or CCC samples using Method A of the procedure (ASTM C1285). Also included in the experimental test matrix and tested in triplicate was the environmental assessment (EA) (Jantzen et al. 1993) glass, the Approved Reference Material-1 (ARM-1) (Mellinger and Daniel 1984) glass, and blanks from the vessel cleaning batch. Glass samples were ground, washed, and prepared according to the standard PCT procedure. The resulting solutions were sampled (filtered and acidified) and analyzed. Normalized release rates were calculated based on target compositions using the average of the logs of the leachate concentrations.
The normalized elemental mass loss, ri, is calculated from:
(g/L) ii
i
cr
f (1)
where ci is the concentration of the ith element in the leachate (g/m3 = ppm = g/ml = mg/L assuming a solution density of 1 g/mL) and fi is the mass fraction of the ith element in glass (unitless), which is calculated from target glass composition.
4.2.4 Viscosity
The viscosity of glass was measured as a function of temperature following PNNL procedure GDL-Visc-Test-014 using a Brookfield rotating spindle digital viscometer (DV-III) staged above a high-temperature Deltech® furnace and equipped with a Pt/Rh spindle which fits through a hole in the top of the furnace. A 50 mL glass sample, measured by liquid displacement, was added into a Pt/Rh crucible 4 GDL-Visc-Test-01, Rev. 0. 2013. High-Temperature Viscosity Measurement.
27
and placed into the furnace set at 1150°C. The spindle was immersed into the molten glass in the center of the crucible with the lower end of the rod at 5.1 mm above the bottom. A thermocouple was located directly under the bottom center of the crucible. The furnace was set to the required ramp/soak schedule and digital data collection of spindle torque and temperature commenced. The temperature sequence was 1150°C, 1100°C, 1050°C, 1000°C, 950°C, 1050°C, 1150°C, 1200°C, and then 1150°C. The soak time was 30 min. at each temperature, except the second soak at 1150°C was for 45 min. The hysteresis approach allows for the potential impacts of crystallization (at lower temperatures) to be assessed (via reproducibility) with duplicate measurements being taken in the range at which the melter is anticipated to be operating. Volatilization (at higher temperatures) is minimized by measuring viscosity at temperatures above 1150°C as the final viscosity measurement. The viscometer was calibrated with a standard glass (DWPF start-up frit) at specified intervals following PNNL procedure GDL-VSC.
4.2.5 Electrical Conductivity
The electrical conductivities of molten glasses were measured as a function of temperature using a probe with two platinum-10% rhodium blades according to the PNNL procedures GDL-Elec-Test-015. The 50 mL of glass used for viscosity measurements was added back into a platinum/rhodium crucible and placed into the furnace at 1100°C. The probe was then lowered through a hole in the top of the furnace and into the melt, making sure that the probe was in the center of the crucible. Using the automated Solartron Analytical 1455 Cell Test System which was connected to the probe, the probe was lowered into the glass precisely 1.27 cm (0.5 inch) below the glass melt surface. The glass soaked at temperatures between 950 and 1350°C for 30 minutes at each temperature, allowing the program to collect impedance data at frequencies 0.1 to 106 Hz. The results are extrapolated to zero frequency by the electrical conductivity system to obtain the DC conductivity.
The electrical conductivity system was checked at specified intervals in 0.1 and 1 M solutions of KCl at room temperature to determine a cell constant. Two measurements were taken at intervals of approximately 5 min. for each solution. The cell constant was then used to calculate the conductivity of each glass melt.
4.2.6 Equilibrium Crystal Fraction and Crystal Identification After Canister Centerline Cooling
The equilibrium crystal fraction as a function of temperature was measured in Pt-alloy crucibles and boats with tight fitting lids (to minimize volatility) according the PNNL procedure GDL-LQT6. The heat treatment time was 24 ± 2 hours for 950-1150°C to ensure equilibrium was achieved without excessive volatility. Selected glasses were subjected to simulated CCC treatments (roughly 150 g glass sample in Pt-alloy boats) according to the profiles given in Table 20. Samples were analyzed by X-ray diffraction (XRD) to determine the type and quantity of crystal fractions (quantitative analyses) according to PNNL procedure APEL-D-8-ADV7.
5 GDL-Elec-Test-01, Rev 0. 2012. High-Temperature Electrical Conductivity. 6 GDL-LQT, Rev. 4. 2008. Standard Test Methods for Determining the Liquidus Temperature (TL) of Waste Glasses and Simulated Waste Glasses. 7 APEL-D-8-ADV, Rev. 1. 2013. Operation of Bruker D-8 Advanced X-Ray Diffractometer.
28
4.3 Glass Formulation Approaches
The primary objective of glass formulation efforts for CCIM tests with two representative Hanford HLW was to estimate the maximum waste loading that can be processed by a CCIM while satisfying glass quality and processing requirements and select the glass composition for melter tests.
Glass quality constraints are concerned with the resistance against corrosion to prevent the spread of the radioactive and toxic elements into the environment. The current regulation for immobilized HLW product at Hanford uses two standard test methods—product consistency test (PCT) (ASTM C1285) and toxicity characteristic leach procedure (TCLP) (EPA 1997). The PCT normalized releases should be less than the EA glass (Jantzen et al. 1993). As Hanford tank waste is a listed hazardous waste, a delisting action is required. A draft petition for delisting specifies that the CdO concentration in glass is below 0.1 wt% or the TCLP cadmium concentration is below 0.48 mg/L and the Tl2O concentration in glass is below 0.465 wt%. However, two selected wastes given in Table 19 do not contain CdO or Tl2O and hence the TCLP requirement is not a concern in this study.
The PCT requirements need to be met for both as-prepared (referred to as “quenched”) and CCC treated glasses. To make sure that the glasses satisfy the PCT requirement when produced in the melter considering the uncertainties in controlling the glass composition and measuring the PCT responses, one half of the PCT responses for EA glass was used as “provisional” constraints for the glass formulations in this study. That is, the provisional PCT limits of 8.4 g/L for B, 4.8 g/L for Li, and 6.7 g/L for Na were used.
Slowly cooled glasses are more susceptible to amorphous phase separation or crystallization. Crystallization of the slowly cooled glass near the center of the canister, simulated by the CCC treatment, can result in a severe deterioration of glass chemical durability as determined by PCT, especially if nepheline (NaAlSiO4) is formed (Kim et al. 1995; Li et al. 1997). Therefore no nepheline formation after CCC treatment was used as a constraint in this study. It has been known that the formation of spinel crystals in many HLW glasses does not affect the PCT durability (Bickford and Jantzen 1984). To formulate glasses without nepheline precipitation, empirical rules based on nepheline discriminator (NSi) (Li et al. 2003) and optical basicity (OB) have been developed (see McCloy and Vienna 2010 for how to calculate OB from glass composition):
2
2 2 2 3
0.62SiOSi
SiO Na O Al O
gN
g g g
(2)
OB (Optical Basicity) ≤ 0.575 (3)
where ig is the mass fraction of the ith oxide in glass. The nepheline rule is met, i.e., nepheline is
predicted not to form, when either the NSi or OB rule is satisfied (McCloy and Vienna 2010).
The processing constraints are used to make sure of adequate processability of glass in the melter in terms of melt properties (viscosity, electrical conductivity, temperature at 1 vol% spinel) and component concentrations to avoid the formation of separated phases (sulfate and phosphate). The viscosity and electrical conductivity of the glass melt should be maintained within a certain range for acceptable processing. Unlike LFCM that imposes a fixed processing temperature, the processing temperature for
29
the CCIM is set for each composition based on the desired viscosity within the acceptable range. The permitted range for electrical conductivity of molten glass is wide and its requirement is met usually when the viscosity is within the acceptable range.
To prevent a potential problem with precipitation of crystalline phases, especially spinel, in the melter, the WTP has developed a constraint to limit the equilibrium volume percent of spinel crystal at 950°C to less than 1%, i.e. T1% ≤ 950°C for the glasses processed at 1150°C. For the high-iron and high-aluminum wastes in this study, the crystal fraction versus temperature has a potential to limit the waste loading, although the main potential benefit of the CCIM compared to that of the WTP baseline LFCM melter is higher tolerance to crystallization. Because there is no established limit for CCIM on the crystal fraction versus temperature, no constraints were imposed. However, the crystal fraction at 950°C was measured for some glasses as necessary to sort out the glasses that form massive amount of crystals. The crystal fraction as a function of temperature was determined for the selected glasses recommended for melter tests.
In addition, single or multiple component constraints are used to limit the concentrations of the potential troublesome components and thereby reduce the risk of their deleterious effects on glass processing. For WTP, the SO3 concentration constraint and a set of phosphate phase rules are applied. For the high-iron and high-aluminum wastes in this study, there is no need to pay attention to the phosphate limit because of low phosphorous concentrations. However, there is a potential that the waste loading can be limited by sulfate salt formation. The glass formulation testing in this study focused on avoiding sulfate salt formation in crucible melts. However, because sulfate salt formation can be evaluated accurately only through melter tests, melter verification is essential.
Available glass property models (Vienna et al. 2009; McCloy and Vienna 2010) were used to predict some of the key properties including viscosity, PCT responses, T1%, and nepheline formation (NSi/OB rule) whenever possible. However, the predicted values were used only as guidelines for glass formulation because the high waste loaded glasses that are considered in this study are well outside the model validity composition range of these models or, any models of which the authors are aware.
4.4 High-Al2O3 Glass Formulation and Testing for C-102
Table 21 summarizes the glass composition (in mass fraction of oxides and halogens), waste loading, and predicted properties of interest for high-Al2O3 glasses formulated for C-102 waste. The properties of interest include predicted melting temperature (Tm), T1%, NSi and OB. The predicted PCT responses were near zero (<< 0.0001 g/L) for all glasses implying the inapplicability of the PCT models for these high-Al2O3 glasses that are well outside the model validity range. The predicted melting temperatures were based on the predicted viscosity of 4 Pa·s for the glasses tested initially (up to C36-14 in Table 21), but it was changed to 3 Pa·s because the testing of initial glasses indicated a general tendency of under-predicting the melting temperature. Table 21 also includes the final melting temperatures used to prepare the glass. The predicted T1%, ranged from 1084 to 1453 °C, which are much higher than the WTP requirements of 950°C as expected. All glasses except for one glass (C32-3) with the lowest waste loading failed the nepheline rules, i.e., were predicted to form nepheline according to McCloy and Vienna (2010).
30
Table 21. Composition and Predicted Properties of High-Al2O3 Glasses Glass ID C36-7 C36-8 C38-1 C40-1 C42-1 C42-2 C36-9 C36-10 C36-11
Waste loading 0.57563 0.54365 0.54365 0.51167 Pred. Tm, °C 1318 1307 1301 1290 Final Tm, °C 1350 1350 1350 1350
T1%, °C 1201 1155 1138 1084 ND 0.319 0.362 0.358 0.396 OB 0.579 0.584 0.576 0.571
Tm: melting temperature, T1%: temperature at 1 vol% spinel, ND: nepheline discriminator, OB: optical basicity
Table 22 summarizes the results of chemical analyses performed for selected glasses (C36-17 and the last five glasses formulated) to confirm that the “as-fabricated” glasses correspond to the defined target compositions. The relative percent differences (RPD) between analyzed and target compositions calculated for major components with higher than 0.5 wt% in at least one glass are also included in Table 22. The analyzed composition matches reasonably well with the target composition for five glasses out of six indicating that there was no batching error. However, the C36-21 glass showed high RPD values for Li2O, P2O5, and ZrO2, suggesting a likely batching error. The difference in P2O5 is relatively small (0.3 wt% lower than the target) to have noticeable impacts on glass properties (P2O5 is also one of the “neutral” components that do not have strong influence on general glass properties), but the differences in Li2O (2 wt% higher than the target) and ZrO2 (0.5 wt% lower than the target) may not be negligible.
33
Table 22. Analyzed Composition of Selected High-Al2O3 Glasses and Relative Percent Difference (RPD) Between Analyzed and Target Compositions
Analyzed Composition Glass ID C36-17 C36-20 C36-21 C34-4 C34-5 C32-3
(a) Calculated as (gi,m – gi,t)/gi,t, where gi,m is the measured and target mass fraction of ith component. Empty cell represents that the component was below detection (composition) or target concentration is lower than 0.5 wt% or less in all glasses (RPD).
34
Table 23 summarizes the measured properties for the high-Al2O3 glasses tested. For some glasses with duplicate or triplicate test results, the average values are given except for crystallinity for which the replicate results are given.
Table 23. Measured Properties of High-Al2O3 Glasses Glass ID C36-7 C36-8 C38-1 C40-1 C42-1 C42-2
Q XRD vol% Sp 0.4 Sp 3.8
CCC XRD vol%
Np 52, Sp 9.8,
CaAl2B2O7 0.8, Li2SO4
1.9
Np 41.5, Sp 10.3,
CaAl2B2O7 1.7, Li2SO4
3.6
Np 39.8, Sp 8, CaAl2B2O7
1, Li2SO4 5.2, Melilite 7
almost fully crystallized
almost fully crystallized
almost fully crystallized
Empty cell: not measured, Sp: spinel, Np: nepheline, Q: quenched
Table 23. Measured Properties of High-Al2O3 Glasses (Continued) Glass ID C36-9 C36-10 C36-11 C36-12 C36-13 C36-14
A set of six glasses with between 36 and 42 wt% of Al2O3 (C36-7 through C42-2) were tested to determine a rough estimate of the highest waste loading achievable. All the quenched glasses were glassy visually even at 42 wt% Al2O3. The two glasses with 42 wt% Al2O3 tested by XRD for quenched samples showed the presence of spinel at 0.4 and 4 vol%. However the CCC glasses with 40 and 42 wt% Al2O3 almost fully crystallized (quantification of crystals not performed) and the CCC glasses with 36 and 38 wt% Al2O3 formed 40 to 52 vol% nepheline along with spinel and other crystals in smaller fractions. No additional tests were performed on these glasses.
The second set of six glasses (C36-9 through C36-14) tested focused on finding the compositions with low or no nepheline formation at 36 wt% Al2O3. Out of the five glasses tested for XRD crystallinity in quenched samples, three (C36-9, C36-13, and C36-14) were crystal free and two glasses, C36-10 and C36-11, had 11 and 7 vol% spinel. These two glasses, that formed spinel in quenched samples, contained MgO while the other three glasses did not, which may suggest that the addition of MgO promotes crystallization of spinel in these high-Al2O3 glasses. All six glasses were tested for crystallinity after CCC treatment. Five out of six CCC glasses in this set formed nepheline between 6 and 45 vol% along with 8 to 15 vol% spinel and small fractions of other crystals. One glass (C36-13) that did not form nepheline after CCC had 7.2 vol% spinel along with small fractions of clinopyroxene group crystals and baddeleyite. Three compositions were tested by the PCT for both quenched and CCC treated samples. All three quenched glasses failed the “provisional” PCT constraints. Considering that these three quenched samples were crystal free, it is likely that the high Al2O3 concentration in these glasses is responsible for poor PCT performance. It is known that Al2O3 exhibits a non-linear effect on the PCT performance, i.e., Al2O3 addition strongly decreases the PCT releases initially (the range of Al2O3 concentration depends on the base composition), but, further addition increases the PCT releases after reaching the minima (Vienna et al. 2013). Of three CCC treated glasses tested for PCT, two passed the “provisional” PCT constraints. It is interesting to note that the PCT releases decreased after CCC treatment for all three glasses. It is possible that the crystallization of spinel (identified as Al2.667O4 in these samples by XRD, a non-stoichiometric alumina with a spinel-type structure) removes Al2O3 from the matrix glass and results in the improved PCT performance.
The third set of six glasses (C36-15 through C36-20) was formulated based on the idea that the precipitation of spinel crystals in quenched glasses may improve PCT performance. It was suggested from the previous set of glasses that the addition of MgO may promote the formation of spinel in quenched samples. All six glasses with 3 to 7 wt% MgO formed 1 to 10 vol% spinel in quenched
36
samples. All CCC glasses formed nepheline between 3 and 42 vol% along with spinel and/or various other crystals. Two glasses with low nepheline, C36-17 (4 vol%) and C36-20 (3 vol%), were tested for PCT for both quenched and CCC treated samples. The C36-17 glass failed but the C36-20 passed the “provisional” PCT constraints for both quenched and CCC samples. The PCT results on these two quenched samples suggest that the idea of precipitating spinel crystals in quenched glasses to improve PCT performance does not always work. The C36-20 glass, although it formed a small fraction of nepheline, is a potential candidate for a CCIM melter test as it is the only glass that passed the PCT constraints out of 14 glasses tested at 36 wt% Al2O3.
A final set of four glasses were tested at 36, 34, and 32 wt% Al2O3. All four quenched glasses were crystal free by XRD. None of the four glasses formed nepheline after CCC treatment, and formed spinel only at 2 to 5 vol%. For the C36-21 glass with 36 wt% Al2O3, the quenched sample failed the “provisional” PCT constraints although the CCC sample passed. However, the high PCT releases in quenched samples can be partly attributed to a potential batching error as shown in Table 22, i.e., both higher Li2O and lower ZrO2 tend to increase PCT releases. The two glasses with 34 wt% Al2O3 and one with 32 wt% Al2O3 all passed the “provisional” PCT constraints for both quenched and CCC samples. These results suggest that the maximum Al2O3 concentration in the glass that can be achieved while satisfying the PCT constraints is roughly 36 wt%. Considering the likeliness that the glass with this maximum loading may be susceptible to failing the property requirements upon relatively small change of composition, the glass with 34 wt% Al2O3 is recommended for CCIM melter testing. Out of two glasses with 34 wt% Al2O3, the C34-5 was selected because its higher B2O3 is preferred for nepheline tolerance although neither glass formed nepheline after CCC. This C34-5 glass was characterized for crystal vs temperature, viscosity, and electrical conductivity.
Figure 2 shows the effect of the heat treatment temperature on the spinel vol% determined by XRD for the C34-5 glass. Linear extrapolation of the data to 1 vol% results in the T1% value of 1138 °C, which is the same as the predicted value by the model (Vienna et al. 2009) as given in Table 21.
37
Figure 2. Spinel Vol% as a Function of Temperature of the C34-5 Glass
Table 24 summarizes the viscosity and electrical conductivity of the C34-5 glass. Figure 3 and Figure 4 display the results of viscosity and electrical conductivity of this glass as a function of temperature. Also shown in Figure 3 and Figure 4 are the curves of fitted data (Arrhenius form) to the measured values and of predicted data by the model (Vienna et al. 2009). The measured viscosities were significantly lower than the predicted values (Figure 3). The large difference between measured and predicted viscosities is understandable because the composition of this glass is well outside the model validity range. The recommended processing temperature is 1200°C based on the measured (interpolated) viscosity of ~3 Pa·s. The measured electrical conductivities agree reasonably well with the predicted values, which is likely due to the fact that the electrical conductivity is primarily affected by the alkali oxides, i.e., the concentrations of alkali oxides are well within the model validity range although other components, especially Al2O3 and SiO2, are outside the model validity range. The measured (interpolated) electrical conductivity at 1200°C is 29.7 S/m, which is well within the desired range of 10 S/m to 100 S/m according to Marra et al. (2008).
0
1
2
3
4
5
900 950 1000 1050 1100 1150 1200
Sp
inel
vol
%
Temperature (°C)
38
Table 24. Viscosity and Electrical Conductivity of the C34-5 Glass as a Function of Temperature
Figure 3. Viscosity of C34-5 Glass as a Function of Temperature
0
5
10
15
20
1000 1050 1100 1150 1200 1250 1300 1350 1400
Vis
cosi
ty (
Pa·
s)
Temperature (°C)
Measured
Fitted
Predicted by model
39
Figure 4. Electrical Conductivity of C34-5 Glass as a Function of Temperature
4.5 High-Fe2O3 Glass Formulation and Testing for 244-TX
Table 25 summarizes the glass composition (in mass fraction of oxides and halogens), waste loading, and predicted properties of interest for high-Fe2O3 glasses formulated for 244-TX waste. The properties of interest include predicted melting temperature (Tm), PCT responses, T1%, NSi and OB. The predicted melting temperatures were based on the predicted viscosity of 4 Pa·s for the glasses tested initially (up to TX36-11(32) in Table 25), but it was changed to 3 Pa·s after melting initial glasses and determining a general tendency of under-predicting the measured melting temperature. Table 25 also includes the actual melting temperature. All 14 glasses were predicted to satisfy the provisional PCT requirements. The predicted T1%, ranged from 1245 to 1499°C, which are 300–550°C higher than WTP requirements of 950°C. Out of 14 glasses formulated 5 glasses were predicted to pass the nepheline rules, i.e., predicted not to form nepheline according to McCloy and Vienna (2010).
0
10
20
30
40
50
60
900 1000 1100 1200 1300 1400
Ele
ctri
cal C
ond
cuti
vity
(S
/m)
Temperature (°C)
Measured
Fitted
Predicted by model
40
Table 25. Composition and Predicted Properties of High-Fe2O3 Glasses Glass ID TX36-1 TX36-2 TX36-3 TX36-4 TX36-5 TX36-6 TX36-7 TX36-8 TX36-9
T1%, °C 1333 1289 1359 1296 1245 ND 0.562 0.579 0.575 0.644 0.676 OB 0.665 0.653 0.645 0.634 0.622
Tm: melting temperature, T1%: temperature at 1 vol% spinel, ND: nepheline discriminator, OB: optical basicity
Table 26 summarizes the results of chemical analyses performed for selected glasses (the last three glasses formulated) to confirm that the “as-fabricated” glasses correspond to the defined target compositions. The relative percent differences (RPD) between analyzed and target compositions calculated for major components with higher than 0.5 wt% in at least one glass are also included in Table 26. The analyzed composition matches well with the target composition for all three glasses confirming that there was no batching error for these three glasses.
42
Table 26. Analyzed Composition of Selected High-Fe2O3 Glasses and Relative Percent Difference (RPD) Between Analyzed and Target Compositions
Glass ID Analyzed Composition RPD Between Measured and Target(a)
(a) Calculated as (gi,m – gi,t)/gi,t, where gi,m is the measured and target mass fraction of ith component. Empty cell represents that the component was below detection (composition) or target concentration is lower than 0.5 wt% or less in all glasses. NA: not applicable
Table 27 summarizes the measured properties for the high-Fe2O3 glasses. A set of four glasses (TX36-1 through TX36-4) were initially formulated at 36 wt% Fe2O3 (59.2 wt% waste loading). The first glass (TX36-1) was formulated with SiO2 as the only additive; the TX-244 waste has already high concentration of Na2O (31.5 wt% Na2O in waste and 18.7 wt% Na2O at 36 wt% Fe2O3 loading). The next three glasses were formulated focusing on improving PCT performance considering that this glass may fail the “provisional” PCT requirements. They were formulated with the addition of Al2O3 alone (TX36-2) or Al2O3 combined with B2O3 (TX36-3) or CaO (TX36-4). The PCT of quenched samples performed on two glasses, TX36-1 and TX36-2, showed that the addition of 6 wt% of Al2O3 decreased the PCT Na releases (B and Li are not present in these glasses) from 9.8 g/L (fail) to 2.8 g/L (pass). This suggests that the PCT requirements can readily be met by the addition of Al2O3 to these high-Fe2O3 glasses. However, all four glasses formed a significant amount of a separate salt layer after the first and second melts (re-melted after grinding the glass from the first melt). Although it is not possible to conclude that these glasses will form a salt layer during processing in a CCIM melter, it is likely that salt formation can be a limiting factor. The TX36-3 was characterized for crystallinity after a 24 h heat treatment at 950°C resulting in 7.4 vol% hematite. The TX36-4 was fabricated but not characterized for any property.
43
Table 27. Measured Properties of High-Fe2O3 Glasses Glass ID TX36-1 TX36-2 TX36-3 TX36-4 TX36-5 TX36-6 TX36-7
Provisional PCT
Limits (g/L)
Salt – first melt Yes Yes Yes Yes Yes Yes No
Salt – second melt Yes Yes Yes Yes No Yes No
Q XRD vol% amorphous 950C 24h, XRD
vol% Hm 7.4 (IA:
Hm 9.9) Hm 5.2 Hm 6.4,
Sp 0.6 CCC XRD vol% Hm 4.4 Hm 6.1 Hm 8.1
Q-PCT B, g/L No B No B 5.1 No B 1.8 8.4
Q-PCT Li, g/L No Li No Li No Li No Li No Li 4.8
Q-PCT Na, g/L 9.8 2.8 3.2 2.1 2.9 6.7
CCC-PCT B, g/L 5.4 6.0 8.4
CCC-PCT Li, g/L No Li No Li 4.8
CCC-PCT Na, g/L 9.2 10.2 6.7 Empty cell: not measured, Q:quenched, Sp: spinel, Hm: hematite, IA: SEM image analysis. No B/Li represents that the glass does not contain B or Li.
Table 27. Measured Properties of High-Fe2O3 Glasses (Continued)
Glass ID TX36-8 TX36-9 TX36-10
(34) TX36-11
(32)
Provisional PCT
Limits (g/L)
Salt – first melt Yes Yes No No
Salt – second melt No No No No
Q XRD vol%
950C 24h, XRD vol% Hm 5.5, Sp
0.1 Sp 8 (IA: Sp
14) Sp Sp+Hm
CCC XRD vol% Hm 6.5 Sp 4.1 Hm 4.6, Sp
1.0, Np 6.5 Q-PCT B, g/L 3.3 7.0 8.2 8.4
Q-PCT Li, g/L No Li 8.3 10.4 4.8
Q-PCT Na, g/L 5.3 12.7 14.6 6.7
CCC-PCT B, g/L 6.5 1.8 6.4 8.4
CCC-PCT Li, g/L No Li 2.0 7.7 4.8
CCC-PCT Na, g/L 12.2 3.8 12.3 6.7 Empty cell: not measured, Q:quenched, Sp: spinel, Hm: hematite, IA: SEM image analysis Np: nepheline, NB: tested on the glass prepared from new batch. No B/Li represents that the glass does not contain B or Li.
Table 27. Measured Properties of High-Fe2O3 Glasses (Continued)
CCC-PCT Na, g/L 7.7 6.6 3.3 6.7 Empty cell: not measured, Q:quenched, Hm: hematite, NB: tested on the glass prepared from new batch. No B/Li represents that the glass does not contain B or Li.
44
The second set of five glasses (TX36-5 through TX36-9) at 36 wt% Fe2O3 was formulated focused on eliminating or decreasing the salt phase. The TX36-7 composition did not form salt after the first or second melt. The remaining four glasses all formed salt after the first melt, but only one glass (TX36-6) formed salt after the second melt. However, the amount of salt formed in the first melt of the four glasses (TX36-5 and TX36-7 through TX36-9) was significantly smaller than the first set of four glasses (TX36-1 through TX36-4). These four glasses (TX36-5 and TX36-7 through TX36-9) were tested for crystallinity after a 24 h heat treatment at 950°C and three glasses (TX36-5, TX36-7, TX36-8) formed 5 to 6 vol% hematite with a small fraction of spinel and one glass (TX36-9) had 8 vol% spinel. Since spinel has a higher potential for settling, the three glasses (TX36-5, TX36-7, and TX36-8), which formed hematite after 24 h at 950°C and did not form salt in the second melt, are preferred CCIM melter glass candidates. Four glasses (TX36-5 through TX36-8) were tested for CCC crystallinity and all formed 4 to 8 vol% hematite without forming nepheline. PCT was performed on four quenched glasses (TX36-5 through TX36-8) and they all passed the “provisional” PCT requirements. However, the three preferred candidate glasses (TX36-5, TX36-7, and TX36-8) all failed the “provisional” PCT requirements for the CCC treated samples. It is surprising that these glasses formed hematite only after CCC treatment but they all had increased PCT releases after CCC.
The third set of two glasses [TX36-10(34) and TX36-11(32)]8 formulated were initial efforts to evaluate the effect of lower Fe2O3 content at 34 and 32 wt% Fe2O3. Both glasses did not form salt from the first and second melts. After a 24 h heat treatment at 950°C, TX36-10(34) formed spinel only and TX36-11(32) formed spinel and hematite (crystal quantification was not performed). After CCC treatment, TX36-10(34) formed spinel only, but surprisingly TX36-11(32) formed 6.5 vol% nepheline along with hematite and spinel. Both glasses failed the “provisional” PCT requirements on quenched samples. However, for the CCC samples, TX36-10(34) at 34 wt% Fe2O3 passed the “provisional” PCT requirements but surprisingly TX36-11(32) at 32 wt% Fe2O3 failed. Additional tests to investigate the cause of these unexpected results were not pursued because the combination of relatively high Al2O3 (≥ 4 wt%) and high CaO (≥ 4 wt%) is a likely reason for poor performance in these two glasses.
The last set of three glasses (TX36-12, TX34-5, and TX32-7) were formulated at 36, 34, and 32 wt% Fe2O3 with 2 to 3 wt% Al2O3 and 7 to 9 wt% B2O3 without CaO. They are modifications of TX36-5 that had the best PCT performance after CCC treatment among three preferred candidate glasses in the second set of glasses tested. The TX36-12 glass had increased Al2O3 from 2 to 3 wt% and increased B2O3 from 7 to 9 wt% at the expense of SiO2 starting from TX36-5. The TX34-5 and TX32-7 were designed to keep the same 2 wt% Al2O3 and 7 wt% B2O3 as TX36-5 while increasing SiO2 as the waste loading decreased. These three glasses formed salt in both first and second melts, which was not anticipated because the lower waste loading glasses (TX34-5, and TX32-7) are not likely to form more salt than the higher waste loading glass (TX36-5). Careful examination of all lab records did not give any indication of batching errors, which was confirmed later by the chemical analyses as presented in Table 26. To resolve this discrepancy, melting was repeated for TX36-5 glass twice and for TX36-12 once but with the same results, i.e., all three newly batched glasses resulted in the formation of salt in both first and second melts. Various efforts to identify the source of the discrepancy pointed to the hematite (Fe2O3) (used to prepare the last set of three glasses (TX36-12, TX34-5, and TX32-7) and the additional three glasses (TX36-5 twice and TX36-12) being contaminated with sulfur (the other glasses formulated used a different brand
8 Note that the ID in these two glasses had the Fe2O3 concentration in parenthesis unlike all other glasses that specified the Fe2O3 or Al2O3 concentration right after the tank ID abbreviations, e.g., TX36-1 is a glass with 36 wt% Fe2O3 formulated for 244-TX tank waste.
45
of hematite). This finding was confirmed by re-melting the TX36-5 glass with the other source of hematite (used in all previous sets of glasses formulated), which produced the same result as the original glass, i.e., a slight salt in the first melt and no salt in the second melt. The repeat glasses were not characterized for any properties. The last set of three glasses (TX36-12, TX34-5, and TX32-7) was then prepared with the no-sulfur hematite for further characterization. Table 27 includes the results from both the glasses prepared with high-sulfur hematite initially and with low-sulfur hematite later (denoted as “NB” to specify that the test results are from the “new batch” glass).
The initial three glasses prepared with high-sulfur hematite were tested for the crystallinity after CCC treated samples and the PCT on quenched and CCC samples. The new batch glasses were characterized for salt formation and the crystallinity of quenched, 950°C 24 h heat treated, and CCC treated samples. It is not likely that the minor difference in SO3 concentration in glass would make any noticeable difference in glass properties. The results of CCC crystallinity testing from the new batch glasses were very similar to those from the initial glasses with high-sulfur hematite. The quenched glass at 36 wt% Fe2O3 (TX36-12) formed 1 vol% hematite and the lower waste loaded glasses (TX34-5 and TX32-7) were crystal free. After 24 h 950°C and CCC treatments only hematite formed and its amount decreased as the waste loading decreased. Similar to the second set of glasses, all quenched samples passed the “provisional” PCT requirements. For the CCC samples, the 36 wt% Fe2O3 glass (TX36-12) failed the “provisional” PCT requirements while the two glasses (TX34-5 and TX32-7) at lower waste loading passed, showing the decreasing trend of PCT normalized release as the waste loading decreased.
Based on the glasses tested in the present study it has been shown that a loading of 34 wt% Fe2O3 is readily possible while satisfying the major constraints evaluated. It is likely that glasses with the higher waste loading (at 36 wt% Fe2O3) are likely to be successful for CCIM processing if additional formulation efforts are completed. Selection and full characterization of the glass for CCIM melter tests were not performed for the high-Fe2O3 glasses.
4.6 Summary of Glass Formulation Results for C-102 and 244-TX
The major constraints that limit the waste loading in the high-Al2O3 loaded glasses for C-102 tank waste were crystallinity after CCC treatment and PCT responses in quenched (as-prepared) and CCC treated samples. One glass (C36-5) was successfully formulated at 36 wt% Al2O3 to pass the “provisional” PCT requirements for both quenched and CCC samples. However, this glass did not pass the nepheline constraint because it formed 3 vol% nepheline after CCC treatment although this small amount of nepheline did not cause the glass to fail the PCT after CCC treatment. The glasses with 34 and 32 wt% Al2O3 passed both the nepheline constraint after CCC and the “provisional” PCT requirements for both quenched and CCC samples. The glass with 34 wt% Al2O3 (C34-5) was recommended for CCIM melter testing. The recommended melting temperature for this glass is 1200°C at the measured (interpolated) viscosity of ~3 Pa·s and electrical conductivity is 29.7 S/m at 1200°C. The selected glass had the T1% of 1138 °C and the estimated crystal fraction at 1000°C (analogues to 950°C for the glasses with the nominal melting temperature of 1150°C) was 3.5 vol%.
The initial focus of glass formulation for the high-Fe2O3 loaded glasses for 244-TX tank waste was to design the composition without sulfate salt formation that may interfere with normal melter operation. However, the primary focus shifted to the PCT requirements for both quenched and CCC glasses after finding the composition regions that avoid salt formation. The maximum Fe2O3 loading that passed all the major constraints evaluated was 34 wt%.
46
5.0 Evaluation of Glass Formulations for Hanford Tank Waste Using CCIM
To determine the optimal loading of wastes in glasses to be fabricated in any melter technology, glasses must be optimized and tested through an iterative process of optimization calculations, laboratory experiments, and melter tests. To make reasonable estimates of glass volumes to be produced from Hanford wastes in the reference LFCM technology, numerical optimization methods have been used. Glass property models were fit to glass compositions designed to adequately cover certain composition regions (Hrma et al. 1994; Vienna et al. 2002b; Piepel et al. 2007; Piepel et al. 2008; Vienna et al. 2009; McCloy and Vienna 2010; and Vienna et al. 2013). The each model has a composition and property region over which they are valid (model validity). A set of property constraints are developed to reduce the risks of unprocessable or unacceptable glass compositions. Using the waste composition estimates, the property-composition models, the model validity constraints, and the property constraints, numerical optimization is applied to determine the maximum waste loading achievable by each waste composition. This process has been successfully applied a number of times and forms the basis for glass volume estimates in the Hanford system plan (Certa et al. 2011).
The results obtained by such a numerical method are only as good as the models and assumptions used to generate them. Four notable concerns are inherent in the assumptions typically used for glass volume estimates for the life of the Hanford tank waste treatment mission:
1) The data used to fit the glass property models are limited resulting in either using overly restrictive model validity constraints or risking the extrapolation of model predictions beyond their validity region; making them unreliable.
2) Not all the properties important to successful waste vitrification can be modeled and used to calculate glass compositions (e.g., melting rate, volatility, melter corrosion, etc.).
3) Uncertainties in normal plant operation and property prediction are not accounted for in glass optimization. If a glass is calculated to have a maximum allowable waste loading within the range of constraints, then small variations or uncertainties in composition may cause the glass to fail. During plant operation, the loading of waste in glass is lowered sufficiently that the final glass will pass all constraints with sufficient statistical confidence (Vienna and Kim 2008, Kim and Vienna 2012).
4) Waste composition and mass estimates are highly uncertain and change from time to time with additional data and revised assumptions. This problem encompasses a number of aspects in waste composition estimation including: a) uncertain estimates of current tank farms inventories, b) uncertain projections of waste blending during retrieval and staging, and c) uncertain waste component partitioning during pretreatment to separate LAW from HLW fractions; among other uncertainties.
To apply the numerical method to CCIM technology there are two added concerns:
5) The property constraints for operating the CCIM are not yet known. This issue is particularly important when considering the tolerance of CCIM to solid inclusions such as spinel crystals.
6) The currently existing property models were developed based on data for glasses targeting the LFCM technology. So they are centered on compositions with lower melting temperatures and lower crystal fractions than would be possible with the CCIM. Even if the current model validity
47
constraints were used, the compositions would be at the edges of the model validity regions where their uncertainty is the highest.
Despite these issues, efforts have been made to determine the glass volume likely to be produced from Hanford tank wastes with either LFCMs or CCIMs. A few of these efforts are summarized below.
5.1 High-Level Waste Melter Study Report
Perez et al. (2001) performed a detailed analysis of the impacts of various property constraints on the volume of HLW glass projected for Hanford. It was a challenge to represent the potential for CCIM processing using the glass property models available at the time. It was assumed that the CCIM would reasonably allow for a higher melting temperature and more crystals in the melt. To implement these improvements with existing models the temperature at which the viscosity and electrical conductivity constraints were applied was increased from 1150 to a maximum of 1350°C. The crystal tolerance was more difficult to address. The TL limit was progressively changed from TM-150°C to TM and to TM+200°C. The Cr2O3 limit was also changed from 0.5 to 1.0 and to 1.5 wt%; the theory being that increasing TL and Cr2O3 would increase crystal content in the melt. The impacts of these changes were described by Kim and Vienna (2002) and are shown in Figure 5. Comparing the glass produced from the LFCM baseline (TM=1150°C, 1 wt% Cr2O3, and TL=1000°C) to the most optimistic CCIM case (TM=1350°C, 1.5 wt% Cr2O3, TL=1550°C) reduced the glass mass by 16 relative percent (26,539 to 22,243 MT).
Figure 5. Effect of Cr2O3 wt% and TL Constraints on Projected Hanford HLW Glass Canisters (Kim and Vienna 2002)
5.2 Evaluation of Hanford HLW Vitrification Process Alternatives
Brinko et al. (2003) evaluated the suitability of a number of different melter technologies for vitrification of Hanford HLW. To estimate the glass masses to be generated by each melter technology, an optimization was performed using glass property models from Vienna et al. (2002b). The property limits assumed for the baseline (LFCM) and the CCIM are compared in Table 28. Two estimates of CCIM glass were made. The first estimate (Case 8 in Table 28) assumed a 3 wt% limit for Cr2O3, a TM ≤ 1350°C, and TL ≤ 1350°C; this resulted in a 10 relative percent reduction in glass mass compared to
7000
8000
9000
10000
11000
0.0 0.5 1.0 1.5 2.0
Cr2O3 Constraint (mass% )
Num
ber
of C
anis
ters
TM=1150°CTM=1350°C
6000
7000
8000
9000
-200 -100 0 100 200
TL(constraint) - TM (°C)
Num
ber
of C
anis
ters
TM=1150°CTM=1350°C
48
the baseline. The second estimate (Case 9 in Table 28) assumed a TM ≤ 1350°C, unlimited TL and Cr2O3, and did not apply any model validity constraints; this resulted in a 26 relative percent reduction in glass mass compared to the baseline. The purpose of the two cases was to bound the range of likely outcomes by deploying the CCIM as the Hanford HLW melter system.
Table 28. Comparison of Key Property Limits and Resulting Glass Masses for Baseline and CCIM Melter Technologies (Brinko et al. 2003) Constraints Unit Baseline CCIM Case 1 Case 8 Case 9 TM °C 1150 ≤1350 ≤1350 TL (spinel) ºC ≤1050 ≤1350 NL TL (zircon) ºC ≤1050 ≤1350 NL Viscosity (η) (at TM) Pa·s 2–10 1–30 1–30 Electrical Conductivity (ε) (at TM) S/m 10–100 10–100 10–100 PCT rB g/m2 ≤4.18 ≤4.18 ≤4.18 PCT rLi g/m2 ≤2.39 ≤2.39 ≤2.39 PCT rNa g/m2 ≤3.34 ≤3.34 ≤3.34 All Model Validity Constraints wt% limited limited NL [Cr2O3] wt% ≤1 ≤3 NL [SO3] wt% ≤0.8 NL NL [SiO2]/([SiO2]+[Na2O]+[Al2O3]) ≥0.62 ≥0.62 NL TCLP cCd mg/L ≤0.11 ≤0.11 ≤0.11 Resulting HLW Glass Mass MT 20,239 18,144 14,933 NL = not limited
5.3 River Protection Project System Plan (Current Baseline)
The River Protection Project (RPP) System Plan includes the Hanford tank waste treatment baseline. To help determine mission life, the amount of glass produced from both the HLW and LAW fractions of Hanford tank waste are estimated using glass property models from Vienna et al. (2009) and Hamel et al. (2004). The plan is currently on its sixth revision (Certa et al. 2011). The current system plan estimates 31,968 MT of HLW glass (10,586 canisters) and 527,838 MT of LAW glass (95,825 containers). The HLW constraints most responsible for determining glass mass are: 55% model validity constraints (24% Bi2O3, 19% SO3, 11% Cr2O3, and 1% P2O5) and 45% combined property constraints (including nepheline, temperature at 1 vol% spinel [T1%=950°C], and viscosity). The LAW constraints include 20 wt% Na2O or 0.8 wt% SO3. However, the SO3 constraint is based on the amount in glass and as the concentration of SO3 increases, the fraction volatilized is estimated to increase. On average 17.8 wt% Na2O was incorporated into glass.
5.4 Advanced HLW Glass Property Models and Constraints
Significant advancements have been made in glass formulations for both the baseline (LFCM) and the CCIM technology since the impacts of melter technology on Hanford HLW glass mass were estimated by Perez et al. (2001) and Brinko et al. (2003). Many of the advancements for LFCM glass formulation are
49
summarized by Vienna et al. (2013), in which new glass property models with significantly expanded model validity regions and new property constraints are proposed.
Vienna et al. (2013) compare the Hanford HLW glass amount estimated for four different sets of glass property-composition models and constraint sets (constraint sets include model validity constraints and property constraints), all for the current Hanford LFCM. The four constraint sets include:
1. The WTP Baseline is described by Vienna and Kim (2008). This constraint set covers the narrowest composition region of the current model sets, but has the full quality assurance (QA) pedigree to operate the WTP.
2. The Hanford Tank Waste Operations Simulator (HTWOS) 2009 models and constraints set are described by Vienna et al. (2009). This constraint set is the basis for the baseline case in the current RPP system plan (Certa et al. 2011). This constraint set is significantly broader than the WTP Baseline and gives a much more realistic assessment of the amount of glass that could be produced. However, the models were not developed under the required QA for plant operation. A large fraction of the data was not generated under the appropriate QA program. Also, by the nature of the broad composition region covered, the models are less precise than those used in the WTP Baseline.
3. The HTWOS 2010 models and constraints set are described by McCloy and Vienna (2010). This constraints set is based on those of Vienna et al. (2009) with the addition of new data that was used to slightly relax the nepheline constraint and the model validity constraints for P2O5 and Bi2O3.
4. The Advanced models and constraints set are described by Vienna et al. (2013). This constraints set covers the broadest composition region of all currently existing models/constraints sets for Hanford HLW. It represents the most aggressive waste loading estimates and was aimed at estimating the maximum waste loading that might be achieved in the current melter technology to help bound the range of possibilities for mission planning purposes.
Figure 6 schematically compares the composition regions covered by the different constraints sets (detailed descriptions are in Vienna et al. 2013). The resulting HLW amounts projected using each of the four constraints sets are given in Figure 7.
Figure 6. Schematic Representation of the Composition Region (model validity constraints) of the
Different Constraint Sets Used to Estimate Hanford HLW Glass Amount
50
Figure 7. Comparison of Hanford HLW Glass Amount for Different Model and Constraint Sets (Vienna
et al. 2013)
The key glass property models used in the advanced constraints and models set were compared to the measured values for recent CCIM testing (described in Section 3.0). The most critical properties to estimating the amount of Hanford HLW to be produced with a CCIM include formation of nepheline on CCC, PCT-A response of quenched glass, and spinel crystal formation as a function of temperature.
No correlation was found between the measured PCT-A values and those predicted by the advanced model as shown in Figure 8. Also, no correlation was found between the measured concentration of nepheline and the predicted probability of nepheline formation as shown in Figure 9. Because several glasses did not form any nepheline and so would be good glasses but had significantly higher probability of forming nepheline than the 27% probability cut-off, this model is not suitable. The differences between prediction and measurement are not surprising as the glasses tested fall well outside the model validity region (particularly for the C-102, high-Al2O3 glasses). Figure 10 compares the predicted and measured spinel (plus hematite in the case of measurement) for the CCIM glasses using the advanced model. The correlation is significantly better for this property and reasonably good considering that the model is significantly extrapolated beyond its validity region.
51
Figure 8. Comparison of Predicted and Measured Ln[PCT-A] Response for Recent CCIM Glasses
Figure 9. Comparison of Measured Nepheline vol% and the Predicted Probability of Nepheline
Formation upon CCC for Recent CCIM Glasses
52
Figure 10. Comparison of Predicted and Measured Spinel vol% at 950°C for Recent CCIM Glasses
Based on the lack of predictability for two of the three key properties, it is not currently feasible to update the projection of Hanford HLW glass volumes for CCIM. To enable such a projection, additional data and glass property-composition models in the composition regions of interest to CCIM formulations for Hanford HLW glasses are needed.
53
6.0 Summary and Recommendations
Successful glass formulations have been developed for the application of CCIM technology to immobilization of U.S. tank wastes including selected wastes at SRS, Hanford, and Idaho. The ranges of processing related properties have not been fully determined. It is likely that these ranges will need to change iteratively with formulation and testing of target waste glass melts and design of melter and auxiliary systems. However sufficient data has been developed to make an initial estimate of the processing related properties that can be used as a place holder until further testing and design work is performed. Table 29 compares the potential processing property limits for CCIM with an example set of limits for the LFCM. The proposed viscosity range is lower, conductivity range is slightly higher, and there are no known reasons for corrosion of melt contact material limits. The crystal tolerance limit appears to be significantly higher for CCIM than LFCM; but neither of the stated limits is well known at this point in time and so should be used with caution. Although some tests with high crystal contents were performed, they were of insufficient length and without the benefit of a final melter design to be useful in determining a crystal limit at this point in time.
Table 29. Comparison of Proposed Processing Related Limits for LFCM and CCIM Property Limiting Range for Typical
LFCM Proposed Range for CCIM
Viscosity at TM 2 to 10 Pa·s 0.6 to 6 Pa·s Conductivity at TM 10 to 70 S/m 20 to 80 S/m Spinel content in melt Currently 1 vol% at 950°C, but
current efforts to increase the limit A rough estimate of 10 vol% at TM
Inconel corrosion at TM roughly 1 cm/5y service life No known reason for a limit Refractory corrosion at TM roughly 3 cm/5y service life No known reason for a limit
The higher operating temperature and the assumption of higher crystal tolerance in the CCIM has led to glass formulations and selected melter tests with significantly higher waste loading than have been achieved in LFCM testing to date. Side-by-side comparisons of the loadings of waste in glass for each melter have shown significant increases in loading for US HLW glass at both SRS and Hanford. However, a comparison of loadings obtained for CCIM and LFCM for both Hanford LAW and Idaho SBW has not shown significant differences in waste loading. Table 30 summarizes this comparison. The waste loading estimates for CCIM are those discussed in this report. For the LFCM waste loading, SRS sludge batches are those actually achieved in DWPF processing; the Hanford waste loading estimates are based on the algorithm used for the Hanford site system plan revision 6 (Certa et al. 2011) using models from Vienna et al. (2009) and the advanced glass models from Vienna et al. (2013) (described in Section 4.4) were used for comparison. For SBW formulations for both CCIM and LFCM, waste loading estimates were generated using Vienna et al. 2002a. It is clear from Table 30 that the CCIM glass loadings are significantly higher for HLWs than the reference LFCM waste loading estimates (21 to 95 relative percent different). However, the advanced glass formulations for LFCM are only significantly different than those for the CCIM for C-102 and TX-244 wastes (20 and 70 RPD, respectively). There is no advantage in waste loading for high soda wastes such as Hanford LAW and Idaho SBW.
54
Table 30. Comparison of Waste Loading Estimates for Selected Wastes
Estimates have been made on the overall glass volume improvements for the CCIM technology deployment in the Hanford HLW vitrification facility (Perez et al. 2001; Brinko et al. 2003). However, there is more information now related to high waste loaded glasses in both CCIM and LFCM technologies. An attempt was made to reevaluate the mission impacts of the CCIM. However, when the most advanced current glass property model predictions were compared to the measured properties of recent CCIM glasses (Section 4.0), they were found to be inadequate to make such predictions. Additional glass property data would need to be measured and new models fitted to key glass properties in order to credibly estimate lifecycle impacts of the CCIM for Hanford HLW. It is clear from the results that the impact on the amount of glass left to produce at SRS would be in the range of 60 relative percent lower with the CCIM. Little impact can be expected for Hanford LAW or Idaho SBW. It should be noted that all these conclusions are based on borosilicate based waste forms. A separate report has been written to describe the current state of knowledge on iron phosphate based waste forms (Day and Ray 2013).
A number of technical gaps exist for the use of CCIM to immobilize U.S. defense tank wastes. These gaps include those related to waste form formulation, waste form qualification, melter design, melter operation, auxiliary system design and operation, flowsheet and system impacts, and process demonstration. It is recommended that the first logical step to the development of the CCIM for these wastes would be to complete a detailed cost, benefit, and risk analysis. Although the program to develop such an analysis was initiated (resulting in this preliminary document among others), it was not sufficiently completed. The following CCIM technology development steps are recommended:
1. Additional glass property data and predictive models should be developed to estimate the impact on glass volume.
2. Additional process data should be developed to estimate the throughput rate, component partitioning, processing limits, and component service lives.
3. Preliminary design should be completed for the system to be deployed including energy balances, mass balances, equipment sizing, piping and interface diagrams, and general equipment layouts.
4. A CCIM project technology maturation plan and risk register should be completed. 5. The data from the above four items should be used to estimate installation and operating costs,
lifecycle cost impacts, and quantify risks.
55
7.0 References
ASTM C 1285-02(2008). Standard Test Methods for Determining Chemical Durability of Nuclear, Hazardous, and Mixed Waste Glasses and Multiphase Glass Ceramics: The Product Consistency Test (PCT). ASTM International, 100 Barr Harbor Drive, P.O. Box C700, West Conshohocken, PA, 19428-2959.
Bickford DF and CM Jantzen. 1984. Devitrification of SRL Defense Waste Glass. In Sci. Basis for Nuclear Waste Management VII, ed. GL McVay, Elsevier, New York, pp. 557-565.
Brinko AJ, V Descamp, WL Ebert, JA Gentilucci, RW Goles, CM Jantzen, LD Pye, RL Treat, FE Woolley and RG Wymer. 2003. Technical Evaluation of Hanford HLW Vitrification Process Alternatives: Report of the Independent Project Evaluation Team. TFA-0108, U.S. Department of Energy, Office of Environmental Management, Washington, D.C.
Certa PJ, RD Adams, GK Allen, JD Belsher, PA Empey, JH Foster, TM Hohl, RT Jasper, RA Kirkbride, RL Lytle, FL Meinert, JS Ritari, RM Russell, KR Seniow, EB West, MN Wells, and LM Bergmann. 2011. River Protection Project System Plan. ORP-11242, Rev. 6, U.S. Department of Energy, Office of River Protection, Richland, WA.
Day DE and CS Ray. 2013. A Review of Iron Phosphate Glasses and Recommendations for Vitrifying Hanford Waste. Missouri University of Science and Technology, Rolla, MO.
Delaunay M, A Ledoux, JL Dussossoy, P Boussier, J Lacombe, C Girold, C Veyer, and E Tchemitcheff. 2009. "Vitrification of Savannah River Site HLW Sludge Simulants at Cea Marcoule Industrial-Scale Cold Crucible Induction Melter Demonstration Platform – 9186." Waste Management 2009, Phoenix, AZ.
DOE. 1996. Waste Acceptance Product Specifications for Vitrified High-Level Waste Forms (WAPS). DOE/EM-0093, U.S. Department of Energy, Office of Environmental Management, Washington, D.C.
EPA—U.S. Environmental Protection Agency. 1997. Test Methods for Evaluation of Solid Waste Physical/Chemical Methods. SW-846, 3rd. ed., as amended, U. S. Environmental Protection Agency, Washington, D.C.
Elliott ML, PJ Shafer, DA Lamar, RA Merrill, W Grunewald, G Roth, and W Tobie. 1996. Hanford High-Level Waste Melter System Evaluation Data Package. PNNL-11016, Pacific Northwest National Laboratory, Richland, WA.
Girold C, M Delaunay, JL Dussossoy, J Lacombe, SL Marra, DK Peeler, CC Herman, M Smith, RE Edwards, A Barnes, M Stone, D Iverson, R Doquang, E Tchemitcheff, and C Veyer. 2008. "Cold Crucible Induction Melter (CCIM) Demonstration Using a Representative Savannah River Site Sludge Simulant on the Large-Size Pilot Platform at the CEA-Marcoule – 8503." Waste Management 2008, Phoenix, AZ.
56
Goles RW, JM Perez, BD MacIsaac, DD Siemer, and JA Mccray. 2001. Test Summary Report INEEL Sodium-Bearing Waste Vitrification Demonstration RSM-01-1. PNNL-13522, Pacific Northwest National Laboratory, Richland, WA.
Goles RW, WC Buchmiller, CR Hymas, and BD MacIsaac. 2002a. Test Summary Report Vitrification Demonstration of an Optimized Hanford C-106/AY-102 Waste-Glass Formulation. PNNL-14063, Pacific Northwest National Laboratory, Richland, WA.
Goles RW, JA Del Debbio, RJ Kirkham, BD MacIsaac, JA Mccray, DD Siemer, and NR Soleberg. 2002b. Test Summary Report INEEL Sodium-Bearing Waste Vitrification Demonstration RSM-01-2. PNNL-13869, Pacific Northwest National Laboratory, Richland, WA.
Hamel WF, LK Holton, and LE Demick. 2003. An Assessment of the Factors Affecting the Ability to Increase the Na2O Loading in the Waste Treatment and Immobilization Plant (WTP) Low Activity Waste (LAW) Glass. D-03-DESIGN-004, U.S. Department of Energy, Office of River Protection, Richland, WA.
Herman CC, DF Bickford, DK Peeler, R Goles, JD Vienna, A Aloy, S Stefanovsky, D Gombert, and J Richardson. 2004. "Cold Crucible Induction-Heated Melter Test Results with Surrogate DOE High-Level Wastes." Environmental Issues and Waste Management Technologies in the Ceramic & Nuclear Industries IX, 239-248 pp.
Hrma P, GF Piepel, MJ Schweiger, DE Smith, DS Kim, PE Redgate, JD Vienna, CA LoPresti, DB Simpson, DK Peeler, and MH Langowski. 1994. Property/Composition Relationships for Hanford High-Level Waste Glasses Melting at 1150°C. PNL-10359, Vol. 1 and 2, Pacific Northwest Laboratory, Richland, WA.
Jantzen CM. 1988. Glass Compositions and Frit Formulations Developed for DWPF. DPST-88-952, Savannah River Laboratory, Aiken, SC.
Jantzen CM, NE Bibler, DC Beam, CL Crawford, and MA Pickett. 1993. Characterization of the Defense Waste Processing Facility (DWPF) Environmental Assessment (EA) Glass Standard Reference Material. WSRC-TR-92-346, Revision 1, Westinghouse Savannah River Company, Aiken, SC.
Kim D, DK Peeler, and P Hrma. 1995. Effect of Crystallization on the Chemical Durability of Simulated Nuclear Waste Glasses. In Environmental Issues and Waste Management Technologies, Ceramic Transactions, Vol. 61, 177-185.
Kim DS and JD Vienna. 2002. "Influence of Glass Property Restrictions on Hanford HLW Glass Volume." Environmental Issues and Waste Management Technologies in the Ceramic and Nuclear Industries VII, Vol. 132, 105-115 pp., American Ceramic Society, Westerville, OH.
Kim DS, MJ Schweiger, CP Rodriguez, WC Lepry, JB Lang, JV Crum, JD Vienna, FC Johnson, JC Marra, and DK Peeler. 2011. Formulation and Characterization of Waste Glasses with Varying Processing Temperature. PNNL-20774, Pacific Northwest National Laboratory, Richland, WA.
57
Kim DS and JD Vienna. 2012. Preliminary ILAW Formulation Algorithm Description. 24590-LAW-RPT-RT-04-0003, Rev. 1, River Protection Project, Hanford Tank Waste Treatment and Immobilization Plant, Richland, WA.
Kobelev AP, SV Stefanovsky, VN Zakharenko, MA Polkanov, TN Laschchenova, AG Ptashkin, VA Perepelkin, ON Tsveshko, EA Kachalova, AS Sorokaletova, OA Knyazev, NP Penionžkiewicz, SV Yudintsev, BS Nikonov, EW Holtzscheiter, and JC Marra. 2006a. Final Report on Contract Work for FY 2004/2005 - Advanced Melter Technology Application to the Defense Waste Processing Facility (DWPF) – Cold Crucible Induction Heated Melter (CCIM). SIA Radon, Moscow, R.F.
Kobelev AP, SV Stefanovsky, VN Zakharenko, MA Polkanov, TN Laschchenova, AG Ptashkin, VA Perepelkin, ON Tsveshko, EA Kachalova, AS Sorokaletova, OA Knyazev, MA Zen’kovskaya, NP Penionžkiewicz, BS Nikonov, YA Oskolkov, LA Kalashnikova, AV Efimov, EW Holtzscheiter, JC Marra, and B Calloway. 2006b. Maximizing Waste Loading for Application to Savannah River High Level Waste - 2006 & 2007 Scope: Subtask 1, CCIM Testing to Demonstrate Maximized Waste Loading with SB2. SIA Radon, Moscow, R.F.
Kobelev AP, SV Stefanovsky, VV Lebedev, MA Polkanov, VV Gorbunov, AG Ptashkin, TN Laschchenova, VA Perepelkin, EA Kachalova, AS Sorokaletova, OA Knyazev, MS Zen'kovskaya, NP Penionžkiewicz, BS Nikonov, AV Efimov, and JC Marra. 2007. Interim Report on Contract Work for FY 2006/2007: Maximizing Waste Loading for Application to Savannah River High Level Waste - 2006 & 2007 Scope (Task 1), Subtask 3. CCIM Testing to Demonstrate Maximized Waste Loading with SB4. SIA Radon, Moscow, R.F.
Kobelev AP, SV Stefanovsky, VV Lebedev, MA Polkanov, VV Gorbunov, AG Ptashkin, OA Knyazev, JC Marra, and KD Gerdes. 2009. "Full-Scale Cold Crucible Test on Vitrification of Savannah River Site SB4 HLW Surrogate." Environmental Issues and Waste Management Technologies in the Materials and Nuclear Industries XII, Vol. 207, 9-20 pp., American Ceramic Society, Westerville, OH.
Ladirat C, C Fillet, R Do Quang, G Mehlman, and T Flament. 2001. "The Cold-Crucible Melter: A Key Technology for the DOE Cleanup Effort." Waste Management 2001, Tucson, AZ.
Lauzel J and F Thurin. 2009. Summary of Art CCIM Phase II-A CCIM Sizing Studies, SGN-9139000025. Societe Generale Pour Les Techniques Nouvelles (SGN), Paris, France.
Li H, JD Vienna, P Hrma, DE Smith, and MJ Schweiger. 1997. Nepheline Precipitation in High-Level Waste Glasses: Compositional Effects and Impact on the Waste Form Acceptability, Scientific Basis for Nuclear Waste Management. Vol. 465, 261-268.
Li H, P Hrma, JD Vienna, M Quin, Y Su, and DE Smith. 2003. “Effects of Al2O3, B2O3, Na2O, and SiO2 on Nepheline Formation in Borosilicate Glasses: Chemical and Physical Correlations.” Journal of Non-Crystalline Solids, Vol. 331, 202-216.
Marra JC, A Youchak-Billings, ME Stone, DK Peeler, TB Edwards, C Girold, and JL Dussossoy. 2008. Glass Formulation Development and Testing for Cold Crucible Induction Melter Technology Retrofit and Deployment Project. SRNS-STI-2008-00036, Savannah River National Laboratory, Aiken, SC.
58
Marra J, S Stefanovsky, V Lebedev, and D Suntsov. 2010. "The Results of Testing to Evaluate Crystal Formation and Settling in the Cold Crucible Induction Melter." 12th International Conference on Environmental Remediation and Radioactive Waste Management 2009, 851-857 pp.
Marra JC. 2013. Review of DOE-EM Cold Crucible Induction Melter Testing Conducted from 2001-2012. SRNL-STI-2013-00696, Savannah River National Laboratory, Aiken, SC.
McCloy JS and JD Vienna. 2010. Glass Composition Constraint Recommendations for Use in Life-Cycle Mission Modeling. PNNL-19372, Pacific Northwest National Laboratory, Richland, WA.
Mellinger GB and JL Daniel. 1984. Approved Reference and Testing Materials for Use in Nuclear Waste Management Research and Development Programs. PNL-49552, Pacific Northwest Laboratory, Richland, WA.
Nicaise E, C Veyer, S Goetghebeur, P Hrma, EV Morrey, GL Smith, JD Vienna, JL Dussossoy, C Ladirat, A Ledoux, and M Puyou. 1999. "Hanford High Level Waste Processing in a Cold Crucible Melter: Test Results Obtained in the Framework of the Twrs-P Contract." Waste Management 1999, Tucson, AZ.
Peeler DK, TH Lorier, DF Bickford, DC Witt, TB Edwards, KG Brown, IA Reamer, PJ Workman, and JD Vienna. 2001. Melt Rate Improvement for DWPF MB3: Frit Development and Model Assessment (U). WSRC-TR-2001-00131, Westinghouse Savannah River Company, Aiken, SC.
Peeler DK, TB Edwards, CC Herman, PJ Workman, IA Reamer, JD Vienna, JV Crum, DE Smith, and DS Kim. 2002. Development of High Waste Loading Glasses for Advanced Melter Technologies. WSRC-TR-2002-00426, Westinghouse Savannah River Company, Aiken, SC.
Peeler DK. 2007. CCIM Testing: Status of Glass Formulation Activities. SRNL-PSE-2007-00070, Westinghouse Savannah River Company, Aiken, SC.
Peeler DK, KM Fox, TB Edwards, DR Best, IA Reamer, and PJ Workman. 2007a. Data Packet for the Frit 202-A11 – Sb3 Glass System: A Candidate for the Cold Crucible Induction Melter (CCIM) Demonstration. WSRC-STI-2007-00302, Savannah River National Laboratory, Aiken, SC.
Peeler DK, KM Fox, TB Edwards, ME Smith, DR Best, IA Reamer, and PJ Workman. 2007b. An Experimental Assessment of the Impact of Sludge Variation on the Frit 202-A11 – Sb3 Glass System. WSRC-STI-2007-00616, Savannah River National Laboratory, Aiken, SC.
Perez JM, DF Bickford, DE Day, DS Kim, SL Lambert, SL Marra, DK Peeler, DM Strachan, MB Triplett, JD Vienna, and RS Wittman. 2001. High-Level Waste Melter Study Report, PNNL-13582, Pacific Northwest National Laboratory, Richland, WA.
Piepel GF, SK Cooley, IS Muller, H Gan, I Joseph, and IL Pegg. 2007. ILAW PCT, VHT, Viscosity, and Electrical Conductivity Model Development. VSL-07R1240-4, Rev. 0, Vitreous State Laboratory, The Catholic University of America, Washington, D.C.
59
Piepel GF, SK Cooley, A Heredia-Langner, SM Landmesser, WK Kot, H Gan, and IL Pegg. 2008. IHLW PCT, Spinel T1%, Electrical Conductivity, and Viscosity Model Development. VSL-07R1240-4, Rev. 0, Vitreous State Laboratory, The Catholic University of America, Washington, D.C.
Sams TL. 2012. EXECUTIVE SUMMARY: Review of Plutonium Oxide Receipts Into Hanford Tank Farms. WRPS-51744, Rev. 0, Washington River Protection Solutions, Richland, WA.
Smith ME. 2008. Technical Evaluation of the NETEC 550mm Cold Crucible Induction Melter (CCIM) Demonstrations with Simulated Sludge Batch 4 Feed (U). WSRC-TR-2008-00118, Savannah River National Laboratory, Aiken, SC.
Smith ME, AB Barnes, AS Choi, and JC Marra. 2009. "NETEC Cold Crucible Induction Melter Demonstration for SRNL with Simulated Sludge Batch 4 DWPF Waste." Ceramic Transactions, Vol. 207, 29-37 pp., American Ceramic Society, Westerville, OH.
Stefanovsky SV, JC Marra, and AA Akatov. 2009. "Characterization of Vitrified Savannah River Site SB4 Waste Surrogate Produced in Cold Crucible Induction Melter." Ceramic Transactions, Vol. 207, 127-140 pp., American Ceramic Society, Westerville, OH.
Stefanovsky S, A Kobelev, V Lebedev, O Knyazev, M Polkanov, and J Marra. 2010. "Cold Crucible Vitrification of SRS SB4 Waste at High Waste Loadings." 12th International Conference on Environmental Remediation and Radioactive Waste Management 2009, Vol. 1, 843-849 pp.
Veyer C, M Delaunay, and A Ledoux. 2009. Vitrification of a Representative Simulated SB4 Sludge in a CCIM Pilot Platform at Marcoule – Demonstration Report. DTCD/SCDV/2009.279, Commissariat à l’énergie atomique (CEA), Marcoule, France.
Vienna JD, WC Buchmiller, JV Crum, DD Graham, DS Kim, BD Macisaac, MJ Schweiger, DK Peeler, TB Edwards, IA Reamer, and RJ Workman. 2002a. Glass Formulation Development for INEEL Sodium-Bearing Waste. PNNL-14050, Pacific Northwest National Laboratory, Richland, WA.
Vienna JD, DS Kim, and P Hrma. 2002b. Database and Interim Glass Property Models for Hanford HLW and LAW Glasses. PNNL-14060, Pacific Northwest National Laboratory, Richland, WA.
Vienna JD and DS Kim. 2008. Preliminary IHLW Formulation Algorithm Description. 24590-HLW-RPT-RT-05-001, Rev 0, River Protection Project, Hanford Tank Waste Treatment and Immobilization Plant, Richland, WA.
Vienna JD, A Fluegel, DS Kim, and P Hrma. 2009. Glass Property Data and Models for Estimating High-Level Waste Glass Volume. PNNL-18501, Pacific Northwest National Laboratory, Richland, WA.
Vienna JD, DS Kim, DC Skorski, and J Matyas. 2013. Glass Property Models and Constraints for Estimating the Glass to Be Produced at Hanford by Implementing Current Advanced Glass Formulation Efforts. PNNL-22631, Pacific Northwest National Laboratory, Richland, WA.
Appendix A
Table of Target Properties for Formulation Efforts
A.1
Appendix A
Table of Target Properties for Formulation Efforts
Sum 1.000E+00 1.000E+00 1.000E+00 1.000E+00 1.000E+00 1.000E+00 1.000E+00 1.000E+00
PNNL-23288 EMSP-RPT-021 Rev 0.0
Distribution*
Distr.1
U.S. Department of Energy Office of Environmental Management NP Machara SP Schneider U.S. Department of Energy Office of River Protection AA Kruger Idaho National Laboratory VC Maio GE Matthern NR Soelberg Savannah River National Laboratory CL Crawford CC Herman JE Marra DK Peeler
Pacific Northwest National Laboratory PR Bredt CF Brown JV Crum BR Johnson DS Kim JB Lang RA Peterson LM Peurrung MJ Schweiger GL Smith JD Vienna JH Westsik, Jr.