+ All Categories
Home > Documents > Silicon and nitrogen cycling in the upwelling area …...Silicon and nitrogen cycling in the...

Silicon and nitrogen cycling in the upwelling area …...Silicon and nitrogen cycling in the...

Date post: 17-Mar-2020
Category:
Upload: others
View: 3 times
Download: 0 times
Share this document with a friend
16
Silicon and nitrogen cycling in the upwelling area off Peru: A dual isotope approach Patricia Grasse,* 1 Evgenia Ryabenko, 2 Claudia Ehlert, 3 Mark A. Altabet, 4 Martin Frank 1 1 GEOMAR Helmholtz Center for Ocean Research Kiel, Ocean Circulation and Climate Dynamics, Kiel, Germany 2 Helmholtz Center Munich, Institute for Groundwater Ecology, Neuherberg, Germany 3 Max Planck Research Group for Marine Isotope Geochemistry, Institute for Chemistry and Biology of the Marine Environment (ICBM), University of Oldenburg, Oldenburg, Germany 4 School for Marine Science and Technology (SMAST), Department of Estuarine and Ocean Sciences, University of Massachusetts Dartmouth, New Bedford, Massachusetts Abstract We present a comparison of the dissolved stable isotope composition of silicate (d 30 Si(OH) 4 ) and nitrate (d 15 NO 2 3 ) to investigate the biogeochemical processes controlling nutrient cycling in the upwelling area off Peru, where one of the globally largest Oxygen Minimum Zones (OMZs) is located. Besides strong upwelling of nutrient rich waters mainly favoring diatom growth, an anticyclonic eddy influenced the study area. We observe a tight coupling between the silicon (Si) and nitrogen (N) cycles in the study area. Waters on the shelf showed high Si(OH) 4 concentrations accompanied by diminished NO 2 3 concentration as a consequence of intense remineralization, high Si fluxes from the shelf sediments, and N-loss processes such as anammox/ denitrification within the OMZ. Correspondingly, the surface waters show low d 30 Si(OH) 4 values (12&) due to low Si utilization but relatively high d 15 NO 2 3 (113&) values due to upwelling of waters influenced by N- loss processes. In contrast, as a consequence of the deepening of the thermocline in the eddy center, a pro- nounced Si(OH) 4 depletion led to the highest d 30 Si(OH) 4 values (13.7&) accompanied by high d 15 NO 2 3 val- ues (116&). In the eddy center, high NO 2 3 : Si(OH) 4 ratios favored the growth of non-siliceous organisms (Synechococcus). Our data show that upwelling processes and the presence of eddies play important roles con- trolling the nutrient cycles and therefore also exert a major influence on the phytoplankton communities in the Peruvian Upwelling. Our findings also show that the combined approach of d 30 Si(OH) 4 and d 15 NO 2 3 can improve our understanding of paleo records as it can help to disentangle utilization and N-loss processes. Introduction The upwelling area off Peru is characterized by extremely high primary productivity (Thiede and Suess, 1983; Berger et al., 1989; Pennington et al., 2006) and one of the globally largest Oxygen Minimum Zones (OMZs) with oxygen levels below 5 lmol L 21 mainly between 100 m and 500 m water depth (Karstensen et al., 2008; Fuenzalida et al., 2009). The extent and strength of the OMZ is a function of ventilation via ocean circulation and degradation of organic matter depending on primary productivity in the euphotic zone, which is driven by upwelling, and exerts major influence on nutrient cycling. The high productivity close to the shelf is mainly induced by upwelling of subsurface waters with high phosphate (PO 32 4 ), silicic acid (Si(OH) 4 ), and iron (Fe) concentrations (Bruland et al., 2005). Besides strong surface and subsurface currents, eddies are reoccurring hydrographic features in the area off Peru (Chaigneau et al., 2008; Stramma et al., 2013), which have a strong influence on the local biogeochemical cycles. A model study of eastern boundary upwelling systems by Gruber et al. (2011) suggested that high eddy activity is associated with low levels of biological production, leading to reduced export of organic matter. This is in contrast to other studies in the open ocean, which came to the conclusion that eddies lead to enhanced productivity due to intrusion of nutrients into surface waters (e.g., McGillicuddy et al., 1998). In general, cyclonic eddies and mode water eddies inject nutrients from below into the euphotic zone, while anticyclonic eddies decrease the nutrient content of the euphotic zone, which has also implications on the phytoplankton communities (e.g., Thompson et al., 2007; Bibby and Moore et al., 2011; Stramma et al., 2013). The dominant phytoplankton species in the *Correspondence: [email protected] Additional Supporting Information may be found in the online version of this article. 1661 LIMNOLOGY and OCEANOGRAPHY Limnol. Oceanogr. 61, 2016, 1661–1676 V C 2016 Association for the Sciences of Limnology and Oceanography doi: 10.1002/lno.10324
Transcript

Silicon and nitrogen cycling in the upwelling area off Peru: A dualisotope approach

Patricia Grasse,*1 Evgenia Ryabenko,2 Claudia Ehlert,3 Mark A. Altabet,4 Martin Frank1

1GEOMAR Helmholtz Center for Ocean Research Kiel, Ocean Circulation and Climate Dynamics, Kiel, Germany2Helmholtz Center Munich, Institute for Groundwater Ecology, Neuherberg, Germany3Max Planck Research Group for Marine Isotope Geochemistry, Institute for Chemistry and Biology of the MarineEnvironment (ICBM), University of Oldenburg, Oldenburg, Germany

4School for Marine Science and Technology (SMAST), Department of Estuarine and Ocean Sciences, University ofMassachusetts Dartmouth, New Bedford, Massachusetts

Abstract

We present a comparison of the dissolved stable isotope composition of silicate (d30Si(OH)4) and nitrate

(d15NO23 ) to investigate the biogeochemical processes controlling nutrient cycling in the upwelling area off

Peru, where one of the globally largest Oxygen Minimum Zones (OMZs) is located. Besides strong upwelling

of nutrient rich waters mainly favoring diatom growth, an anticyclonic eddy influenced the study area. We

observe a tight coupling between the silicon (Si) and nitrogen (N) cycles in the study area. Waters on the

shelf showed high Si(OH)4 concentrations accompanied by diminished NO23 concentration as a consequence

of intense remineralization, high Si fluxes from the shelf sediments, and N-loss processes such as anammox/

denitrification within the OMZ. Correspondingly, the surface waters show low d30Si(OH)4 values (12&) due

to low Si utilization but relatively high d15NO23 (113&) values due to upwelling of waters influenced by N-

loss processes. In contrast, as a consequence of the deepening of the thermocline in the eddy center, a pro-

nounced Si(OH)4 depletion led to the highest d30Si(OH)4 values (13.7&) accompanied by high d15NO23 val-

ues (116&). In the eddy center, high NO23 : Si(OH)4 ratios favored the growth of non-siliceous organisms

(Synechococcus). Our data show that upwelling processes and the presence of eddies play important roles con-

trolling the nutrient cycles and therefore also exert a major influence on the phytoplankton communities in

the Peruvian Upwelling. Our findings also show that the combined approach of d30Si(OH)4 and d15NO23 can

improve our understanding of paleo records as it can help to disentangle utilization and N-loss processes.

Introduction

The upwelling area off Peru is characterized by extremely

high primary productivity (Thiede and Suess, 1983; Berger

et al., 1989; Pennington et al., 2006) and one of the globally

largest Oxygen Minimum Zones (OMZs) with oxygen levels

below 5 lmol L21 mainly between 100 m and 500 m water

depth (Karstensen et al., 2008; Fuenzalida et al., 2009). The

extent and strength of the OMZ is a function of ventilation via

ocean circulation and degradation of organic matter depending

on primary productivity in the euphotic zone, which is driven

by upwelling, and exerts major influence on nutrient cycling.

The high productivity close to the shelf is mainly induced by

upwelling of subsurface waters with high phosphate (PO324 ),

silicic acid (Si(OH)4), and iron (Fe) concentrations (Bruland

et al., 2005). Besides strong surface and subsurface currents,

eddies are reoccurring hydrographic features in the area off

Peru (Chaigneau et al., 2008; Stramma et al., 2013), which

have a strong influence on the local biogeochemical cycles. A

model study of eastern boundary upwelling systems by Gruber

et al. (2011) suggested that high eddy activity is associated

with low levels of biological production, leading to reduced

export of organic matter. This is in contrast to other studies in

the open ocean, which came to the conclusion that eddies

lead to enhanced productivity due to intrusion of nutrients

into surface waters (e.g., McGillicuddy et al., 1998). In general,

cyclonic eddies and mode water eddies inject nutrients from

below into the euphotic zone, while anticyclonic eddies

decrease the nutrient content of the euphotic zone, which has

also implications on the phytoplankton communities (e.g.,

Thompson et al., 2007; Bibby and Moore et al., 2011; Stramma

et al., 2013). The dominant phytoplankton species in the

*Correspondence: [email protected]

Additional Supporting Information may be found in the online version of thisarticle.

1661

LIMNOLOGYand

OCEANOGRAPHY Limnol. Oceanogr. 61, 2016, 1661–1676VC 2016 Association for the Sciences of Limnology and Oceanography

doi: 10.1002/lno.10324

upwelling region are diatoms (Estrada and Blasco, 1985; Franz

et al., 2012), which require Si(OH)4 to form their biogenic silica

(bSiO2) shells (Lewin, 1961) and which contribute approxi-

mately 75% to the primary production in coastal and nutrient

rich zones (Nelson et al., 1995). In contrast, the offshore

regions in the Eastern Equatorial Pacific (EEP) are rather charac-

terized by high nutrient, low chlorophyll (HNLC) conditions

(Strickland et al., 1969; Thomas, 1979) and are dominated by

non-siliceous organisms, such as the cyanobacteria Synechococ-

cus and Prochlorococcus (Franz et al., 2012). Phytoplankton uses

both new and recycled nitrogen in the form of different N-

species including nitrate (NO23 ), nitrite (NO2

2 ), and ammonia

(NH14 ), whereby uptake of NH1

4 is associated with the lowest

energetic expenses. In general the Si and N cycle in upwelling

areas is tightly coupled. Diatoms normally incorporate NO23

and Si(OH)4 at a 1 : 1 ratio (Brzezinski 1985; Ragueneau et al.,

2000), but stress, such as Fe limitation can lead to an enhanced

uptake of Si(OH)4 relative to NO23 resulting in heavier silicified

frustules of the diatoms (Hutchins and Bruland, 1998; Franck

et al., 2000). Therefore, the deviation from the 1 : 1 NO23 to

Si(OH)4 ratio can serve as an indicator for the degree of utiliza-

tion of NO23 over Si(OH)4. A higher relative utilization of

Si(OH)4 is consequently reflected by higher NO23 /Si(OH)4 (N/Si)

ratios resulting in either less silicified diatoms or even

enhanced prevalence of non-siliceous organisms (Conley and

Malone 1992; Wilkerson and Dugdale, 1996).

Biological processes controlling present and past Si and N

cycling in the upwelling area off Peru are traceable by their

stable isotope distributions in the water column. They can

be used for example, as indicators for utilization processes

because the lighter isotopes are preferentially incorporated

into the organisms (e.g., Montoya and McCarthy, 1995; De

LaRocha et al., 1997). In general, the biogeochemical proc-

esses are accompanied by specific fractionation factors (e.g.,

Mariotti et al., 1981) and can be expressed as offset (D),

where the isotopic composition (IC) of the source (e.g., the

Si(OH)4 in seawater) is subtracted from the IC of the product

(e.g., a diatom) or as the fractionation factor a, where the IC

of the product is divided by the IC of the source.

D5dProduct2dSource (1)

a5dProduct

dSource(2)

For an easier handling, a is often expressed as the enrich-

ment factor (e):

e5 a21ð Þ � 1000 (3)

Literature on N isotope biogeochemistry commonly uses

inverse fractionation factors, resulting in a>1 and therefore

positive enrichment factors. In the following, we will use the

relationships (2) and (3), which are commonly used in Si iso-

tope literature.

The isotope composition of Si is fractionated during

incorporation into diatom shells with an enrichment factor

(30e) of 20.5& to 22.1& (De La Rocha et al., 1997; Milligan

et al. 2004; Sutton et al., 2012), which leaves the surround-

ing seawater enriched in the heavy isotopes. It is still under

discussion if there is also a fractionation during dissolution

of bSiO2 material. A laboratory study by Demarest et al.

(2009) indicated a fractionation with the release of lighter

isotopes into solution, whereas a more recent study by Wet-

zel et al. (2014) was not able to confirm fractionation during

diatom dissolution. Thus, the Si isotope distribution in oce-

anic waters is mainly controlled by utilization in the surface

waters, remineralization and water mass mixing (e.g., Reyn-

olds et al., 2006; Grasse et al., 2013).

Laboratory studies have shown that the utilization of

NO23 by phytoplankton is highly variable with enrichment

factors (15e) ranging from 21& to 220& with no clear rela-

tionship between different marine species (e.g., Montoya &

McCarthy, 1995; Needoba et al., 2003; Granger et al., 2004,

2010). In contrast, field studies generally obtained lower 15eof approximately 25 to 210&, with most estimates closed

to 25& (e.g., Wada, 1980; Altabet, 2001).

In OMZs, a number of additional processes occur that

influence the dissolved N isotope composition. Low oxygen

concentrations (2 to 10 lmol L21) induce N-loss processes,

such as denitrification (NO23!NO2

2!NO!N2O!N2) and/or

the more direct anammox (ANaerobic AMMonium OXida-

tion) process (NH14!NO2

2!N2; Codispodi, 2007; Lam et al.,

2009; Kalvelage et al., 2013). Another NO23 reducing process

is the dissimilatory reduction of NO23 to NH1

4 (DNRA), which

also occurs under anaerobic conditions. NO23 reduction is

known to result in both strong N as well as O isotopic frac-

tionation (e 15N5 220& to 230&; e.g., Granger et al., 2008;

Casciotti, 2009) leaving residual seawater NO23 enriched and

produce isotopically light 15N products (Casciotti and McIl-

vin, 2007). There are also processes that regenerate bioavail-

able N, like N2 fixation by cyanobacteria and in situ

regeneration of N via nitrification (NH14!NO2

2! NO23 ; e.g.,

Deutsch et al., 2007; Fern�andez et al., 2009).

The above processes can also influence the d15N signature

of the sedimentary record, given that supply of the heavy

d15NO23 signatures of subsurface waters leads to particulate

organic matter enriched in 15N, which is ultimately buried

in the sediments (e.g., Altabet and Francois, 1994; Altabet,

2006; Mollier-Vogel et al., 2012). Therefore, it is difficult to

disentangle the influence of utilization and the N-loss sig-

nals, which can cause difficulties in the interpretation of

paleo records (Mollier-Vogel et al., 2012). In contrast, Si iso-

topes are subject to a relatively simple cycling mainly influ-

enced by utilization and subsequent dissolution of diatoms.

An approach using a combination of both isotope systems

will therefore be helpful to understand and reconstruct the

marine biogeochemical cycles of nutrients in upwelling

areas. For this purpose, it is crucial to understand the factors

Grasse et al. Silicon and nitrogen cycling in the upwelling area off Peru

1662

controlling the Si(OH)4 and NO23 cycles and the supply of

these nutrients to the euphotic zone, as well as primary pro-

ductivity, remineralization processes, and water mass mixing.

Here, we present combined nutrient concentrations and

stable isotope compositions of dissolved Si(OH)4 and NO23 ,

as well as its oxygen isotope composition (d18O-NO23 ) and

d15NO22 in the water column along a 108S transect in the

EEP off Peru influenced by strong upwelling on the shelf and

the presence of an anticyclonic eddy. These data allow the

investigation of the influence of the hydrographic settings

on the Si and N cycles.

Material and methods

All samples were collected during cruise M77-3 with the

German RV Meteor between end of December 2008 and Jan-

uary 2009 in the frame of the Collaborative Research Center

(SFB) 754: Climate – Biogeochemistry Interactions in the

Tropical Ocean. Seawater samples were collected along a

108S transect perpendicular to the Peruvian Coast (Fig. 1,

Table S1). Seawater samples for nutrient and oxygen concen-

tration, as well as for Si and N isotope measurements were

collected using a Seabird CTD Rosette System equipped with

oxygen sensors. Oxygen concentrations were determined

with the O2-sensor of the CTD and were later calibrated with

bottle data obtained by Winkler titration (Winkler, 1888).

Samples for nutrient measurements were frozen (2208C) on

board immediately after sampling and were measured in the

laboratory of the Max Planck Institute (MPI) for Marine

Microbiology in Bremen with an autoanalyzer (TRAACS 800,

Bran & Lubbe, Hamburg, Germany). Nutrient concentrations

were measured following Grasshoff et al. (1999). Si(OH)4

concentrations of the frozen samples were compared to

selected filtered and acidified (non-frozen) samples. The

reproducibility ranged between 5 and 10% (see also Ehlert

et al., 2012). Concentrations of particulate organic nitrogen

(PON), and bSiO2 were adapted from Franz et al. (2012). Sea-

water samples for Si isotope measurements were immediately

filtered on board through nitrocellulose acetate filters

(0.45 lm pore size) and were then acidified with distilled

HCl to pH 2. At GEOMAR Si was separated from the samples

using a brucite-coprecipitation method (Reynolds et al.,

2006; following Karl and Tien, 1992). Only samples with

SeaWiFS chlorophyll a conc. [mg/m³]

0.6

0.7

1

2.5

10

30

0.5

0.4

0.3

0.2

0.1

0.08

85°W 80°W 75°W 70°W

EQ

5°S

10°S

15°S

20°S Oce

an D

ata

View

EQ

5°S

10°S

15°S

20°S

85°W 80°W 75°W 70°W

807

4 3 2 1812

810 809

5

E U C

PCUC

SSCC

PCoas t a

l C

PCCC

b)a)

Lima

12345812

810

807809

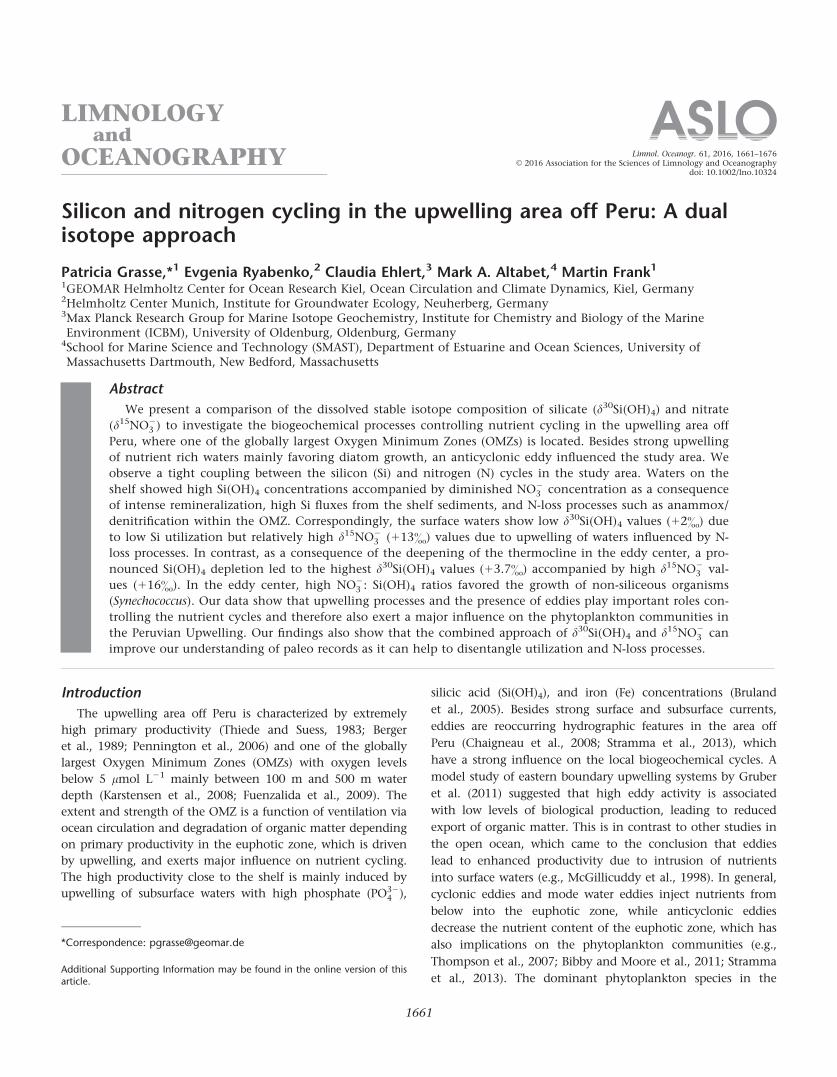
Fig. 1. (a) Sampling locations and Chlorophyll a concentrations (mg m23). Chlorophyll concentrations were obtained from the NASA Giovanni web-site (http://disc.sci.gsfc.nasa.gov/giovanni/overview/index.html ) for January and February 2009. For Sta. 1 and Sta. 3, no Si isotope measurements were

carried out. (b) Schematic subsurface currents (dashed gray lines) off Peru. (EUC: Equatorial Undercurrent, SSCC: Southern Subsurface Countercurrent,PCUC: Peru Chile Undercurent, PCCC: Peru-Chile Countercurrent, PCoastalC: Peru Coastal Current; according to Strub et al., 1998; Penven et al.,2005; Kessler, 2006; Ayon et al., 2008; Karstensen and Ulloa, 2008; and ADCP data according to Czeschel et al., 2011). [Color figure can be viewed

in the online issue, which is available at wileyonlinelibrary.com.]

Grasse et al. Silicon and nitrogen cycling in the upwelling area off Peru

1663

yields >97% were accepted for isotopic measurements given

that incomplete precipitation would lead to isotopic fractio-

nation of the Si in the samples. For Si isotope measurements,

samples were purified following the method by Georg et al.

(2006) and measured on a NuPlasma MC-ICPMS (Nu instru-

ments) at GEOMAR. For a detailed method description, see

Ehlert et al. (2012) and Grasse et al. (2013). Si data for Sta-

tion 807 were adapted from Ehlert et al. (2012).

Seawater samples for d15NO23 , d15NO2

2 and d18O-NO23

analysis were collected in 125 mL HDPE bottles and kept fro-

zen (2208C) until analysis. Samples that contained low to

negligible levels of nitrite (NO22 <0.1 lmol L21) were acidi-

fied and stored at room temperature after defrosting, whereas

samples with significant NO22 contents were kept frozen

prior to NO22 analysis. Aliquots of these samples were treated

in the laboratory with sufficient sulfanic acid to remove

NO22 prior to 15NO2

3 analysis. Acidified samples do not show

any storage effects given that repeat measurements of 15N

were constant over years (see also Ryabenko et al., 2012).

The stable isotope composition of dissolved NO23 was meas-

ured using Cd-reduction to NO22 followed by reaction with

azide to produce N2O. This method makes it not only possi-

ble to measure the d15N, but also the d18O of nitrate (McIlvin

and Altabet, 2005). NaCl was added to ensure consistent

quantitative yields (Ryabenko et al, 2009). Samples were ana-

lyzed at GEOMAR and the SMAST using a purge-trap isotope

ratio mass spectrometer (PT-IRMS) system.

Si and N isotope compositions are reported in the d nota-

tion representing the deviations of the measured isotope

ratios of the samples from that of a reference standard in

parts per thousand (&):

d30Si; d15N; d18O5Rsample

Rstd

� �21

� �� 1000 (4)

84˚W 82˚W 80˚W 78˚W

10˚S

6000 m5000 m4000 m3000 m2000 m1250 m750 m250 m50 m

23

3.5

2424.5 25

25.5

26

26.5

27

σ0

34 34.5 35 35.50

5

10

15

20

25

Salinity

Po

t. T

em

pe

ratu

re

θ [°

C]

SSMW

807807

1 812812

810810809809

3 25 4

OMZOMZ

(26.1 to 27 kg/m³) (26.1 to 27 kg/m³)

807807

810810

809809

812812

3

4

2

5

1

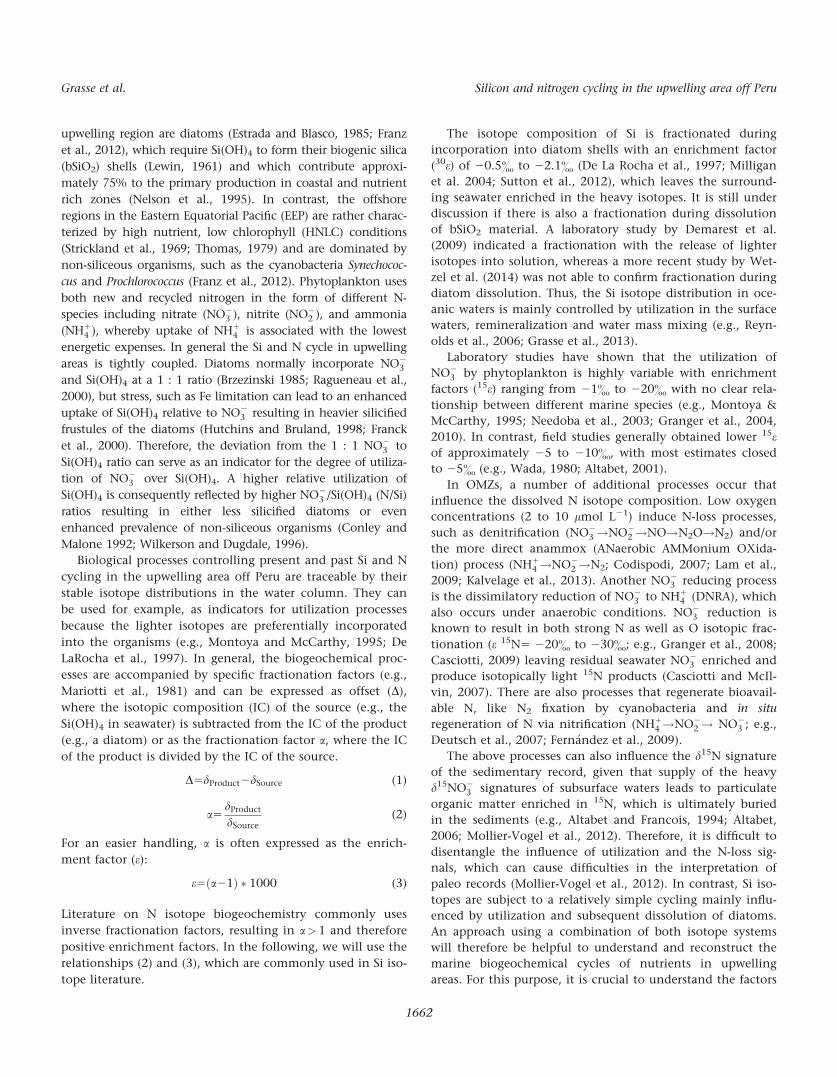
Fig. 2. Temperature-salinity (TS) plot for all stations with potential density isolines along the 108S transect. The “Shallow Salinity Minimum Water”(SSMW) is defined by a salinity of 34.2 and a pot. density of 26 kg m23 (red square; Reid 1973; Karstensen 2004). The extend of the OMZ is shown by

the dashed orange line (26.1 kg m23 and 27 kg m23). Deep water masses are not shown as only data in the upper 300m are discussed. For other watermasses in the study area, see also Grasse et al. (2012). [Color figure can be viewed in the online issue, which is available at wileyonlinelibrary.com.]

Grasse et al. Silicon and nitrogen cycling in the upwelling area off Peru

1664

Rsample represents the ratio of the measured 30Si/28Si,15N/14N, and 18O/16O ratios whereas Rstd denotes the isotope

ratio of the reference standard. For Si isotopes, the NBS28

standard is used, N isotopes are given relative to the N iso-

tope ratio of air, using international reference standards

USGS 34, USGS 35, and IAEA 3 for calibration. The reference

standard for oxygen isotopes is the Vienna Standard Mean

Ocean Water (V-SMOW. Repeated measurements of an inter-

nal seawater matrix standard gave a long-term reproducibil-

ity of 6 0.2& (2rsd, n 5 15) for Si isotope measurements

and 6 0.4& (2rsd, n 5 33) for N isotope measurements. d18O-

NO23 are generally reproducible within 1& (2sd).

Results

Hydrographic setting of the study area

The main subsurface currents influencing the Peruvian

upwelling (Fig. 1b) are the southward flowing Peru-Chile

Countercurrent (PCCC) and the Peru-Chile Undercurrent

(PCUC). The PCUC flows very close along the shelf between

50 m and 150 m water depth and represents the main

source for the coastal upwelling (Huyer et al., 1987; Kar-

stensen and Ulloa, 2008). The PCUC is partly fed by the

Equatorial Undercurrent (EUC) and the Southern Subsurface

Countercurrent (SSCC), which supply oxygen-rich waters to

the upwelling area (Brink et al., 1983; Toggweiler et al.,

1991; Fiedler and Talley, 2006). The sampling locations on

the shelf (Sta. 807, 809 and 810) were dominated by upw-

elled waters mainly derived from the southward flowing

PCUC, as reflected by low sea surface temperatures (Fig. 2).

The main northward flowing subsurface current influencing

the sampling location is the Peru Coastal Current (PCoast-

alC) at distances of approximately 100 km to 300 km from

the shore (Strub et al., 1998; Penven et al., 2005; Karstensen

and Ulloa, 2008). Unfortunately no ADCP data are available

for the 108S transect. However, the velocity distribution

along at 68S and 148S section were recorded in February

2009 during Meteor cruise M77-4 (Czeschel et al., 2011)

and show that at the PCoastalC, advected from the south

from approx. 778W, 148S to 828W, 68S. Flowing northward,

the surface current were subducted to 150 m to 300 m

water depth and mainly influenced nearshore Sta. 812. Sta.

1 and 5 show a salinity minimum at about 50 m to 100 m

(26 kg m23; Fig. 2), which is also characterized by a Si(OH)4

depletion resulting in an Si* of 230 (Si*5Si(OH)4-16*PO2

4 ,

Supporting Information Fig. A1). This salinity minimum is

ascribed to the admixture of “Shallow Salinity Mode Water”

(SSMW, also called Eastern South Pacific Intermediate

Water [ESPIW]), which originates from sinking of suban-

tarctic surface waters at about 458S off the Chileanen Coast

(Fig. 2; Reid, 1973; Karstensen, 2004).

In addition to the above currents, the complex hydro-

graphic system off Peru is influenced by mesoscale eddies,

which transport waters from the shelf offshore (Chaigneau

et al., 2008; Altabet et al., 2012). During the time of sampling

in January 2009, a large anticyclonic coastal eddy entraining

upwelled subsurface shelf waters was present in the study

area, clearly visible in the Sea Level Anomaly (SLA) data (Fig.

3). The eddy extended to a depth of approximately 700m

(Altabet et al., 2012) and showed high surface chlorophyll aconcentrations obtained from SeaWIFS satellite data at its

periphery (� 2.5 mg m23 to 20 mg m23) and low concentra-

tions in its center (� 0.3 mg m23 to 0.5 mg m23; Fig. 1). The

inner diameter of the eddy structure amounted to approxi-

mately 300 km and elevated chlorophyll concentrations of

the outer filament were detected up to a longitude of 828W to

858W corresponding to the location of Sta. 4 in the center of

the filament and Sta. 5 on its edge, whereas Sta. 2 was located

in the center of the East/West extent of the eddy, which is

characterized by low chlorophyll concentrations. In relation

to its North/South extent Sta. 2 was close the edge of the

northern eddy filament. In the following, we categorized the

different hydrographic areas along the 108S transect into

coastal stations (Sta. 807, 809, 810), nearshore stations (Sta.

812, 1), the Eddy center (Sta. 2), and the outer filament of the

eddy including the offshore stations (Sta. 3, 4, 5).

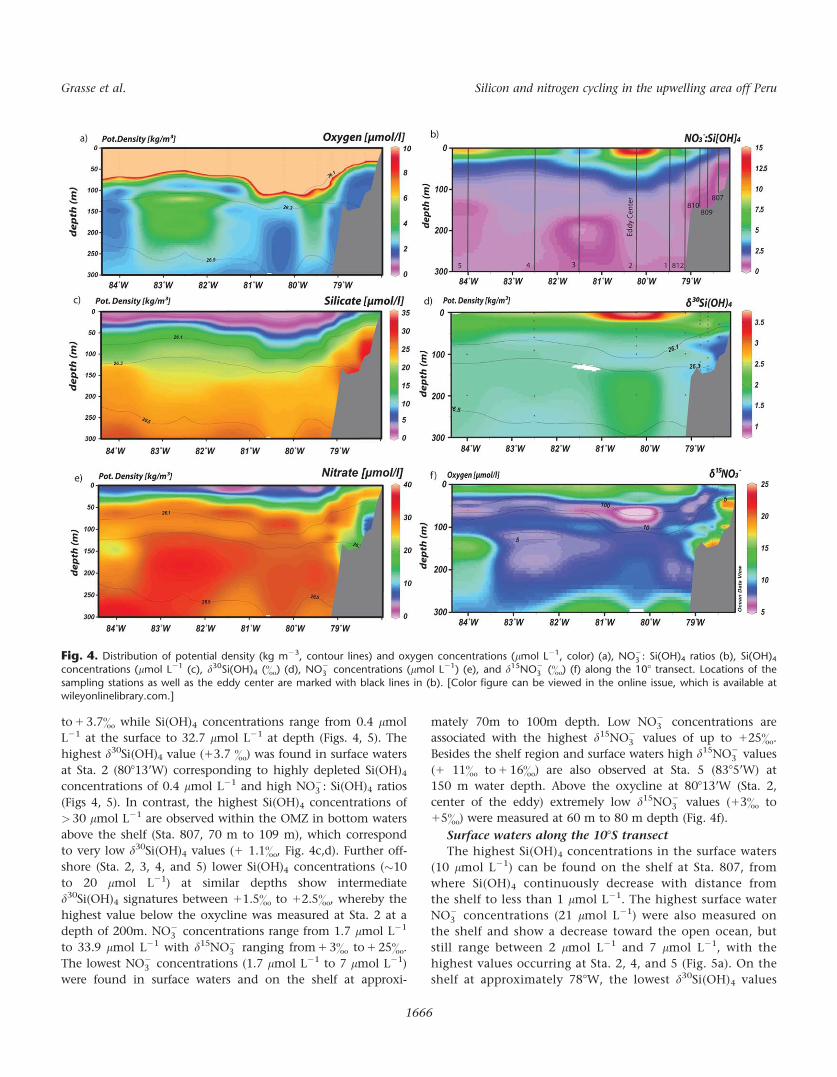
Distribution of stable isotope compositions, nutrients,

and oxygen concentrations along the 108S transect

The distribution of dissolved d30Si(OH)4 and d15NO23 , d18O-

NO23 , d15NO2

2 , as well as of the nutrients and oxygen were

analyzed for samples in the upper 300m of the water column

along the 108S transect (Figs. 4, Supporting Information Figs.

A1, A2, Table S1). The depth of the oxycline varies between

20 m and 90 m (closely following a potential density of

26.1 kg m23) and is shallowest at Sta. 807 on the shelf and

deepest at Sta. 2 in the center of the eddy. Below the oxycline,

oxygen concentrations are essentially below 10 lmol L2,

mostly at concentrations close to 0 lmol L21 (Fig. 4a). The

d30Si(OH)4 values in the water column range from 1 1.1&

24 1

807

35

810 809812

85°W

10°S

77.5°W80°W82.5°W

[cm]

8 0

2.4

1.5

5.4 0.82

-0.8

-1.5 -2 -8-4 -6

-12

-10

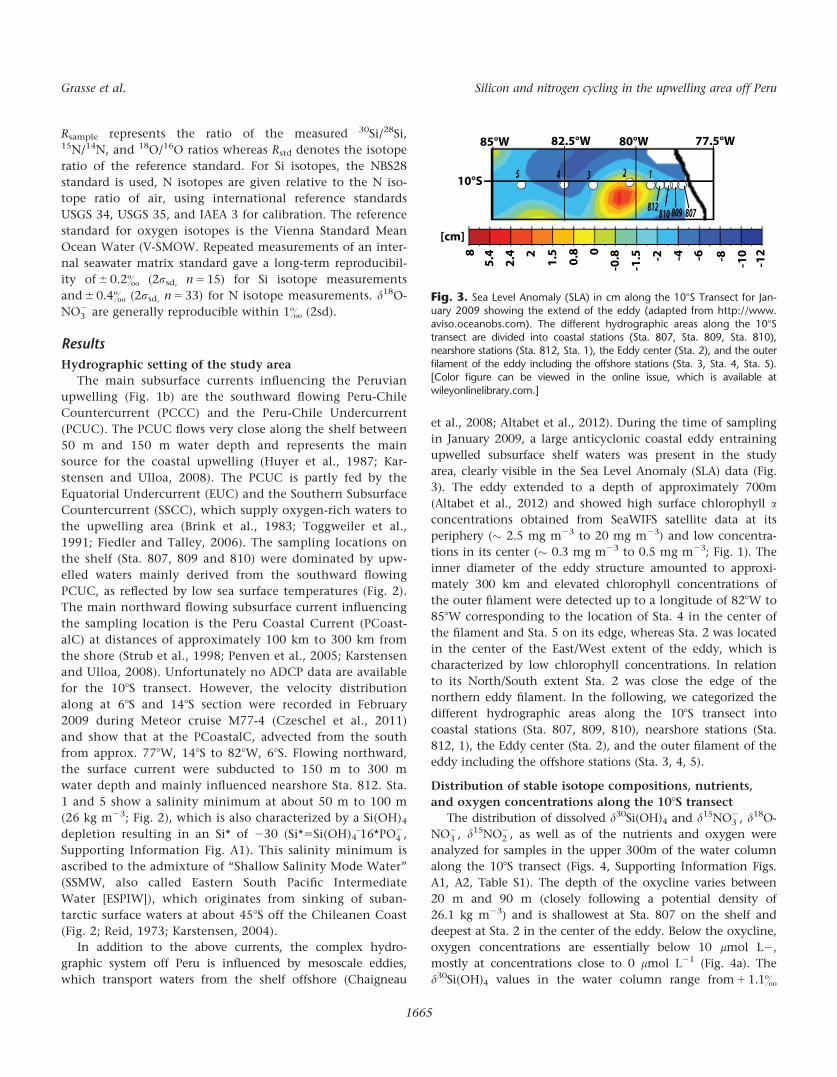
Fig. 3. Sea Level Anomaly (SLA) in cm along the 108S Transect for Jan-uary 2009 showing the extend of the eddy (adapted from http://www.

aviso.oceanobs.com). The different hydrographic areas along the 108Stransect are divided into coastal stations (Sta. 807, Sta. 809, Sta. 810),nearshore stations (Sta. 812, Sta. 1), the Eddy center (Sta. 2), and the outer

filament of the eddy including the offshore stations (Sta. 3, Sta. 4, Sta. 5).[Color figure can be viewed in the online issue, which is available at

wileyonlinelibrary.com.]

Grasse et al. Silicon and nitrogen cycling in the upwelling area off Peru

1665

to 1 3.7& while Si(OH)4 concentrations range from 0.4 lmol

L21 at the surface to 32.7 lmol L21 at depth (Figs. 4, 5). The

highest d30Si(OH)4 value (13.7 &) was found in surface waters

at Sta. 2 (80813’W) corresponding to highly depleted Si(OH)4concentrations of 0.4 lmol L21 and high NO2

3 : Si(OH)4 ratios

(Figs 4, 5). In contrast, the highest Si(OH)4 concentrations of

>30 lmol L21 are observed within the OMZ in bottom waters

above the shelf (Sta. 807, 70 m to 109 m), which correspond

to very low d30Si(OH)4 values (1 1.1&, Fig. 4c,d). Further off-

shore (Sta. 2, 3, 4, and 5) lower Si(OH)4 concentrations (�10

to 20 lmol L21) at similar depths show intermediate

d30Si(OH)4 signatures between 11.5& to 12.5&, whereby the

highest value below the oxycline was measured at Sta. 2 at a

depth of 200m. NO23 concentrations range from 1.7 lmol L21

to 33.9 lmol L21 with d15NO23 ranging from 1 3& to 1 25&.

The lowest NO23 concentrations (1.7 lmol L21 to 7 lmol L21)

were found in surface waters and on the shelf at approxi-

mately 70m to 100m depth. Low NO23 concentrations are

associated with the highest d15NO23 values of up to 125&.

Besides the shelf region and surface waters high d15NO23 values

(1 11& to 1 16&) are also observed at Sta. 5 (8385’W) at

150 m water depth. Above the oxycline at 80813’W (Sta. 2,

center of the eddy) extremely low d15NO23 values (13& to

15&) were measured at 60 m to 80 m depth (Fig. 4f).

Surface waters along the 108S transect

The highest Si(OH)4 concentrations in the surface waters

(10 lmol L21) can be found on the shelf at Sta. 807, from

where Si(OH)4 continuously decrease with distance from

the shelf to less than 1 lmol L21. The highest surface water

NO23 concentrations (21 lmol L21) were also measured on

the shelf and show a decrease toward the open ocean, but

still range between 2 lmol L21 and 7 lmol L21, with the

highest values occurring at Sta. 2, 4, and 5 (Fig. 5a). On the

shelf at approximately 788W, the lowest d30Si(OH)4 values

Fig. 4. Distribution of potential density (kg m23, contour lines) and oxygen concentrations (lmol L21, color) (a), NO23 : Si(OH)4 ratios (b), Si(OH)4

concentrations (lmol L21 (c), d30Si(OH)4 (&) (d), NO23 concentrations (lmol L21) (e), and d15NO2

3 (&) (f) along the 108 transect. Locations of the

sampling stations as well as the eddy center are marked with black lines in (b). [Color figure can be viewed in the online issue, which is available atwileyonlinelibrary.com.]

Grasse et al. Silicon and nitrogen cycling in the upwelling area off Peru

1666

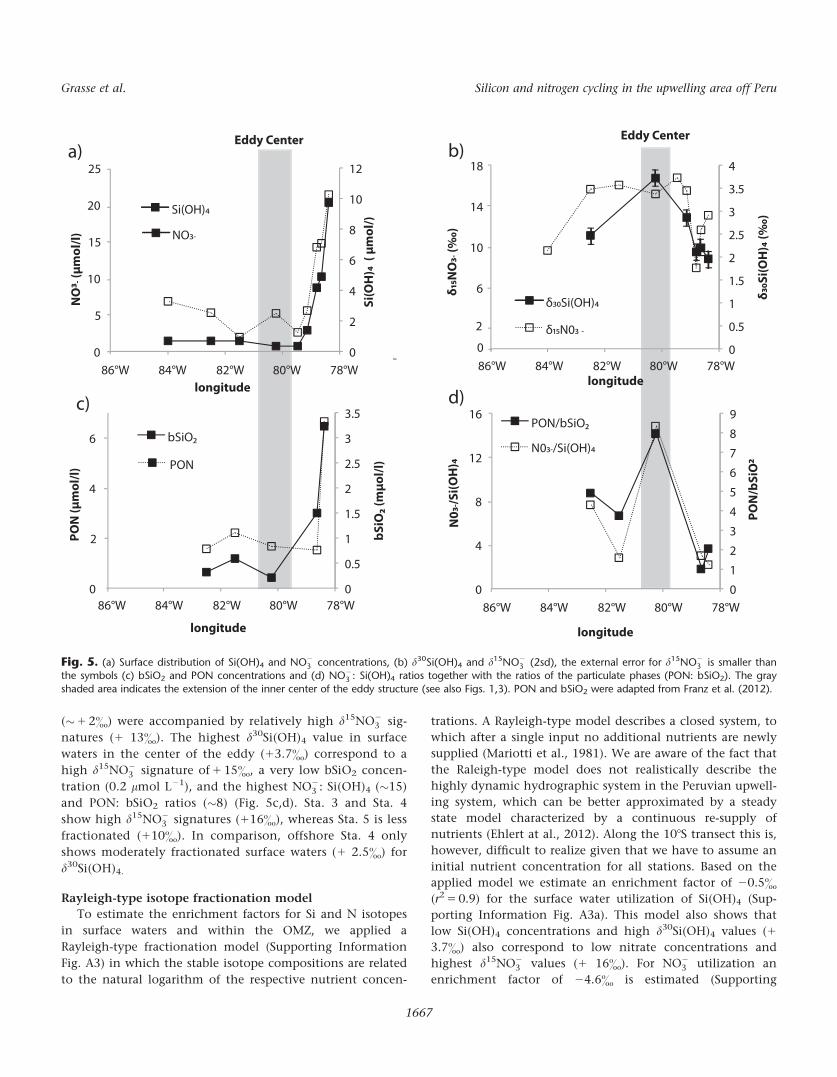
(�1 2&) were accompanied by relatively high d15NO23 sig-

natures (1 13&). The highest d30Si(OH)4 value in surface

waters in the center of the eddy (13.7&) correspond to a

high d15NO23 signature of 1 15&, a very low bSiO2 concen-

tration (0.2 lmol L21), and the highest NO23 : Si(OH)4 (�15)

and PON: bSiO2 ratios (�8) (Fig. 5c,d). Sta. 3 and Sta. 4

show high d15NO23 signatures (116&), whereas Sta. 5 is less

fractionated (110&). In comparison, offshore Sta. 4 only

shows moderately fractionated surface waters (1 2.5&) for

d30Si(OH)4.

Rayleigh-type isotope fractionation model

To estimate the enrichment factors for Si and N isotopes

in surface waters and within the OMZ, we applied a

Rayleigh-type fractionation model (Supporting Information

Fig. A3) in which the stable isotope compositions are related

to the natural logarithm of the respective nutrient concen-

trations. A Rayleigh-type model describes a closed system, to

which after a single input no additional nutrients are newly

supplied (Mariotti et al., 1981). We are aware of the fact that

the Raleigh-type model does not realistically describe the

highly dynamic hydrographic system in the Peruvian upwell-

ing system, which can be better approximated by a steady

state model characterized by a continuous re-supply of

nutrients (Ehlert at al., 2012). Along the 108S transect this is,

however, difficult to realize given that we have to assume an

initial nutrient concentration for all stations. Based on the

applied model we estimate an enrichment factor of 20.5&

(r2 5 0.9) for the surface water utilization of Si(OH)4 (Sup-

porting Information Fig. A3a). This model also shows that

low Si(OH)4 concentrations and high d30Si(OH)4 values (1

3.7&) also correspond to low nitrate concentrations and

highest d15NO23 values (1 16&). For NO2

3 utilization an

enrichment factor of 24.6& is estimated (Supporting

0

2

6

10

14

18

0

0.5

1

1.5

2

2.5

3

3.5

4

δ30

Si(

OH

)4 (

‰)

δ15

NO

3- (

‰)

longitude

δ30Si(OH)4

δ15N03 -

0

5

10

15

20

25

0

2

4

6

8

10

12

Si(

OH

)4 (

μm

ol/

)

NO

3- (

μm

ol/

l)

longitude

Si(OH)4

NO3-

0

2

4

6

0

0.5

1

1.5

2

2.5

3

3.5

bS

iO2

(mμ

ol/

l)

PO

N (

μm

ol/

l)

bSiO2

PON

0

4

8

12

16

0

1

2

3

4

5

6

7

8

9

PO

N/b

SiO

2

longitude

PON/bSiO2

N03-/Si(OH)4 N

03-

/Si(

OH

)4

longitude

86°W 84°W 82°W 80°W 78°W 86°W 84°W 82°W 80°W 78°W

86°W 84°W 82°W 80°W 78°W 86°W 84°W 82°W 80°W 78°W

Eddy CenterEddy Centera) b)

c) d)

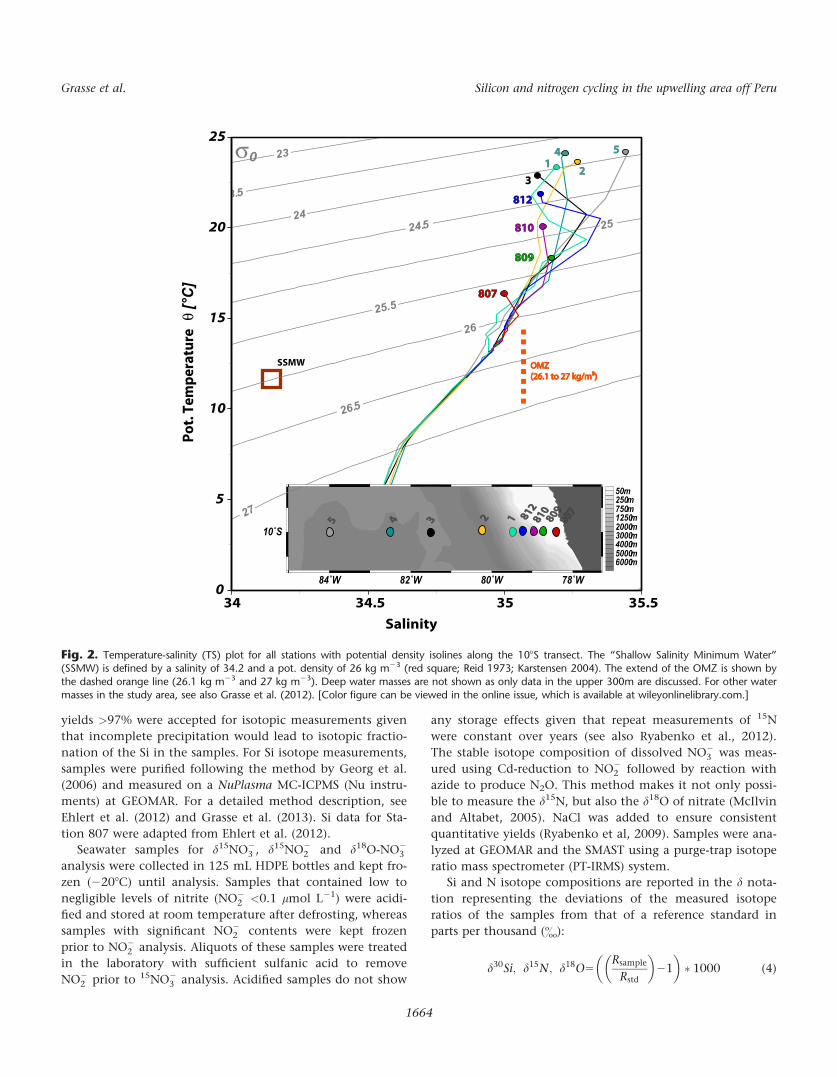
Fig. 5. (a) Surface distribution of Si(OH)4 and NO23 concentrations, (b) d30Si(OH)4 and d15NO2

3 (2sd), the external error for d15NO23 is smaller than

the symbols (c) bSiO2 and PON concentrations and (d) NO23 : Si(OH)4 ratios together with the ratios of the particulate phases (PON: bSiO2). The gray

shaded area indicates the extension of the inner center of the eddy structure (see also Figs. 1,3). PON and bSiO2 were adapted from Franz et al. (2012).

Grasse et al. Silicon and nitrogen cycling in the upwelling area off Peru

1667

Information Fig. A3b). The dissolved Si isotopes within the

subsurface OMZ show a significantly weaker correlation to

the nutrient concentrations (r2 5 0.5) than the d15NO23 signa-

tures (r2 5 0.8), for which the model estimates an enrich-

ment factor of 219.2& (Supporting Information Fig. A3c, d).

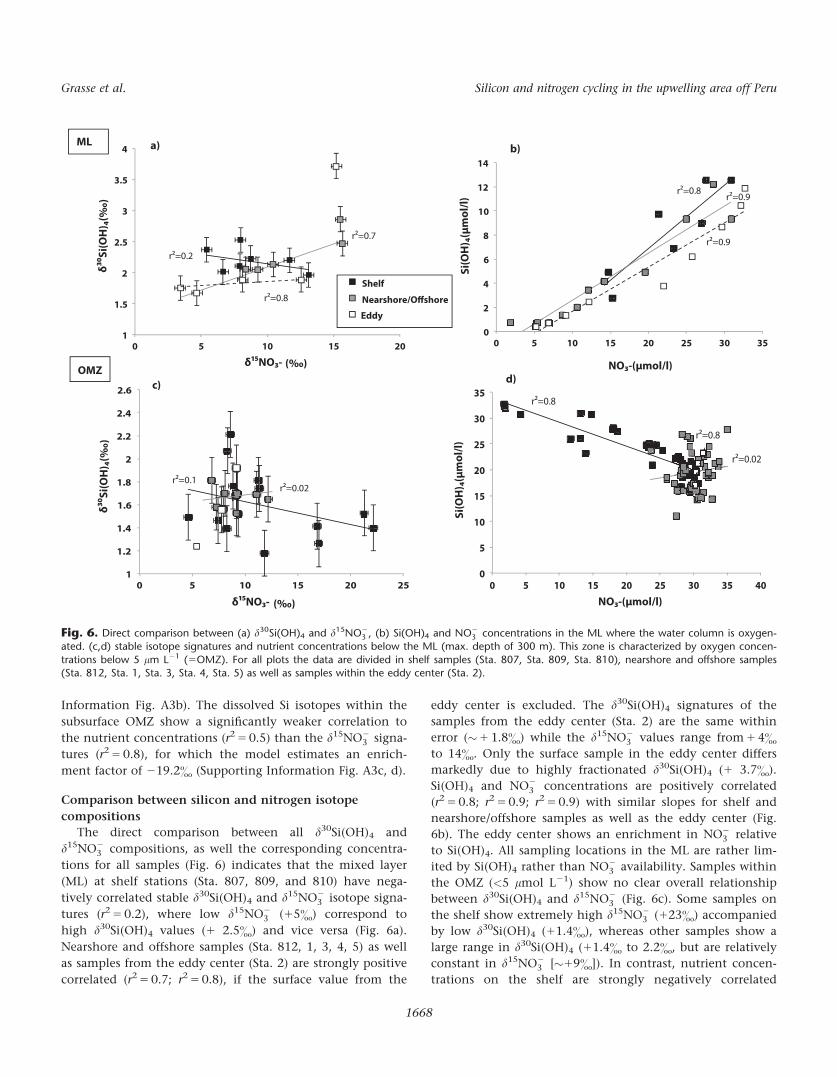
Comparison between silicon and nitrogen isotope

compositions

The direct comparison between all d30Si(OH)4 and

d15NO23 compositions, as well the corresponding concentra-

tions for all samples (Fig. 6) indicates that the mixed layer

(ML) at shelf stations (Sta. 807, 809, and 810) have nega-

tively correlated stable d30Si(OH)4 and d15NO23 isotope signa-

tures (r2 5 0.2), where low d15NO23 (15&) correspond to

high d30Si(OH)4 values (1 2.5&) and vice versa (Fig. 6a).

Nearshore and offshore samples (Sta. 812, 1, 3, 4, 5) as well

as samples from the eddy center (Sta. 2) are strongly positive

correlated (r2 5 0.7; r2 5 0.8), if the surface value from the

eddy center is excluded. The d30Si(OH)4 signatures of the

samples from the eddy center (Sta. 2) are the same within

error (�1 1.8&) while the d15NO23 values range from 1 4&

to 14&. Only the surface sample in the eddy center differs

markedly due to highly fractionated d30Si(OH)4 (1 3.7&).

Si(OH)4 and NO23 concentrations are positively correlated

(r2 5 0.8; r2 5 0.9; r2 5 0.9) with similar slopes for shelf and

nearshore/offshore samples as well as the eddy center (Fig.

6b). The eddy center shows an enrichment in NO23 relative

to Si(OH)4. All sampling locations in the ML are rather lim-

ited by Si(OH)4 rather than NO23 availability. Samples within

the OMZ (<5 lmol L21) show no clear overall relationship

between d30Si(OH)4 and d15NO23 (Fig. 6c). Some samples on

the shelf show extremely high d15NO23 (123&) accompanied

by low d30Si(OH)4 (11.4&), whereas other samples show a

large range in d30Si(OH)4 (11.4& to 2.2&, but are relatively

constant in d15NO23 [�19&]). In contrast, nutrient concen-

trations on the shelf are strongly negatively correlated

1

1.5

2

2.5

3

3.5

4

0 5 10 15 20

Shelf

Nearshore/Offshore

δ³0

Si(

OH

)4(‰

)

δ¹5NO3- (‰)

a)

0

2

4

6

8

10

12

14

0 5 10 15 20 25 30 35

Si(

OH

)4(μ

mo

l/l)

NO3-(μmol/l)

b)

1

1.2

1.4

1.6

1.8

2

2.2

2.4

2.6

0 5 10 15 20 25

ML

OMZ

δ³0

Si(

OH

)4(‰

)

δ¹5NO3- (‰)

0

5

10

15

20

25

30

35

0 5 10 15 20 25 30 35 40

Si(

OH

)4(μ

mo

l/l)

NO3-(μmol/l)

c)d)

r²=0.2

r²=0.7

r²=0.8

r²=0.8r²=0.9

r²=0.9

r²=0.8

r²=0.02

r²=0.8

r²=0.1r²=0.02

Eddy

Fig. 6. Direct comparison between (a) d30Si(OH)4 and d15NO23 , (b) Si(OH)4 and NO2

3 concentrations in the ML where the water column is oxygen-ated. (c,d) stable isotope signatures and nutrient concentrations below the ML (max. depth of 300 m). This zone is characterized by oxygen concen-

trations below 5 lm L21 (5OMZ). For all plots the data are divided in shelf samples (Sta. 807, Sta. 809, Sta. 810), nearshore and offshore samples(Sta. 812, Sta. 1, Sta. 3, Sta. 4, Sta. 5) as well as samples within the eddy center (Sta. 2).

Grasse et al. Silicon and nitrogen cycling in the upwelling area off Peru

1668

(r2 5 0.8) with the lowest NO23 concentrations (2 lmol L21)

corresponding to the highest Si(OH)4 concentrations (33

lmol L21).

Discussion

We determined the upper water column distribution of

d30Si(OH)4 and d15NO23 along a 108S transect off Peru in

order to better understand the processes controlling the

Si(OH)4 and NO23 cycling and the supply of these nutrients

to the euphotic zone. The Si(OH)4 and NO23 concentrations

in surface waters and within the OMZ show a large variabili-

ty, which is reflected differently by their stable isotope com-

positions as a function of water mass mixing and specific

fractionation processes in the N and Si systems. In the fol-

lowing, we attempt to disentangle these processes along the

108S transect and visualized them in a schematic diagram

(Fig. 7).

10°S Transect off Peru:

0

50

100

150

200

250

300

OMZ

ML

Shelf

DiatomsSynechococcusProchlorococcus

siliceousnon-siliceous

Eddy CenterOffshore

δ³0Si(OH)4

δ¹5NO3- +-

+ -++ -

+ -

Deepening

of the

thermocline

Upwelling

Offshore Transport

via eddy

Si depleted

Si depletedSi enriched

Water Mass Mixing

Si Cycle

N Cycle

ML

Si source

N sink

N enriched

N:Si

1:1

N:Si

15:1

N:Si

10:1

N:Si

2.5:1

N:Si

2.5:1

N:Si

1:1

N:Si

1:1

de

pth

(m

)

N:Si

0.5:1

N:Si

2:1

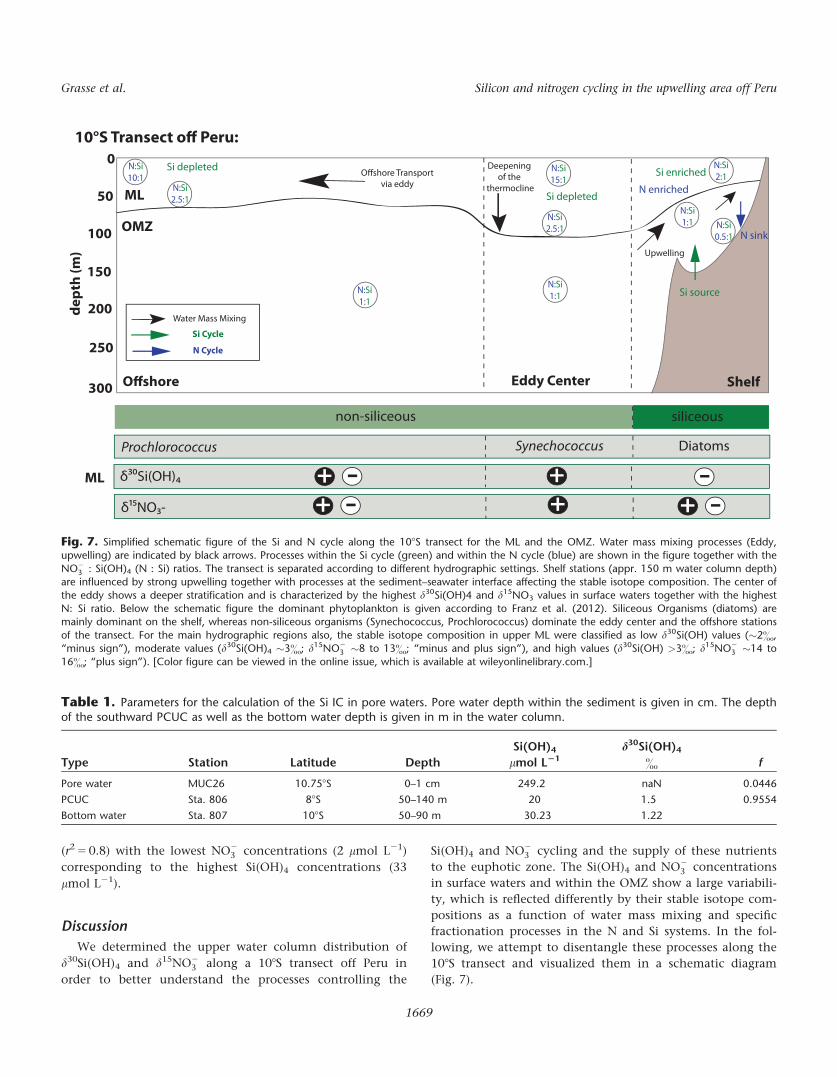
Fig. 7. Simplified schematic figure of the Si and N cycle along the 108S transect for the ML and the OMZ. Water mass mixing processes (Eddy,upwelling) are indicated by black arrows. Processes within the Si cycle (green) and within the N cycle (blue) are shown in the figure together with the

NO23 : Si(OH)4 (N : Si) ratios. The transect is separated according to different hydrographic settings. Shelf stations (appr. 150 m water column depth)

are influenced by strong upwelling together with processes at the sediment–seawater interface affecting the stable isotope composition. The center of

the eddy shows a deeper stratification and is characterized by the highest d30Si(OH)4 and d15NO3 values in surface waters together with the highestN: Si ratio. Below the schematic figure the dominant phytoplankton is given according to Franz et al. (2012). Siliceous Organisms (diatoms) aremainly dominant on the shelf, whereas non-siliceous organisms (Synechococcus, Prochlorococcus) dominate the eddy center and the offshore stations

of the transect. For the main hydrographic regions also, the stable isotope composition in upper ML were classified as low d30Si(OH) values (�2&,“minus sign”), moderate values (d30Si(OH)4 �3&; d15NO2

3 �8 to 13&; “minus and plus sign”), and high values (d30Si(OH) >3&; d15NO23 �14 to

16&; “plus sign”). [Color figure can be viewed in the online issue, which is available at wileyonlinelibrary.com.]

Table 1. Parameters for the calculation of the Si IC in pore waters. Pore water depth within the sediment is given in cm. The depthof the southward PCUC as well as the bottom water depth is given in m in the water column.

Type Station Latitude Depth

Si(OH)4

lmol L21

d30Si(OH)4

& f

Pore water MUC26 10.758S 0–1 cm 249.2 naN 0.0446

PCUC Sta. 806 88S 50–140 m 20 1.5 0.9554

Bottom water Sta. 807 108S 50–90 m 30.23 1.22

Grasse et al. Silicon and nitrogen cycling in the upwelling area off Peru

1669

Processes affecting the stable silicon and nitrogen isotope

composition on the shelf

Sedimentary influence on the silicon cycle

The shelf stations differ markedly from those further off-

shore in terms of nutrient concentrations and stable isotope

composition along the 108S transect. They are characterized by

the lowest d30Si(OH)4 values (1 1.1&) close to the bottom

(110 m, Sta. 807) corresponding to high Si(OH)4 concentra-

tions of 33 lmol L21 (Fig. 4). These elevated Si(OH)4 concentra-

tions are either a consequence of dissolution of bSiO2 in the

water column or of release from the sediments. In general, the

dissolution of bSiO2 in seawater is mainly controlled by physi-

cal parameters, such as temperature and pH (Lewin, 1961;

Natori et al., 2006), but bacterial activity can lead to higher dis-

solution rates because it destroys the protecting organic layer

of the diatom frustules (Bidle and Azam, 1999; Bidle et al.,

2002). Given that bacterial activity is enhanced in OMZs (Diaz

and Rosenberg, 2008; Ulloa et al., 2012), the dissolution of dia-

toms will be accelerated and may explain the pronounced

increase in Si(OH)4 and decrease in d30Si(OH)4 with depth. A

previous field study by Grasse et al. (2013) in the EEP did, how-

ever, not find a clear link between bSiO2 remineralization

within the OMZ and the dissolved d30Si(OH)4. In addition,

potential Si isotope fractionation during dissolution is still

under discussion and might either have a low or neglectable

effect (Demarest et al., 2009, Wetzel et al., 2014).

Elevated Si(OH)4 concentrations are also visible within

the southward flowing PCUC (Ehlert et al. 2012). From

northern to southern Peru, Si(OH)4 concentrations increase

from 15 lmol L21 to 40 lmol L21, which might be a combi-

nation of pore water inputs, dissolution of bSiO2 in the

water column and at the sediment-water interface. On the

Peruvian shelf significant Si fluxes from the sediments to the

overlying water column can be observed that are similar to

observations from other upwelling areas. A time series study

in Monterey Bay showed sedimentary Si fluxes between 3.06

mmol m22 d21 and 11.9 mmol m22 d21, which varied sea-

sonally and were tightly coupled to the rain rates of Corg and

bSiO2 (Berelson et al., 2003). This is in agreement with first

results from the Peruvian shelf, where Si fluxes of up to 10

mmol m22 d21 were measured in benthic lander deploy-

ments (Noffke and Sommer pers. comm.) and pore water

Si(OH)4 concentrations were at the same time approximately

10 times higher (�250 lmol L21) than those of the bottom

waters. To test the influence of pore water contributions, we

apply a simple mixing model, for which we assumed that

the water masses in 50 m to 90 m depth at Sta. 807 are only

supplied by advection within the PCUC carrying a character-

istic Si isotope signature of 11.5& 6 0.1& and a Si(OH)4

concentration of 20 lmol L21 obtained at stations north of

108S (from Ehlert et al., 2012). The pore water concentration

data (250 lmol L21) were taken from a set of multi corer

data obtained during Meteor cruise M77-2 at 10840S (Noffke,

2014) (Table 1). This leads to a mixing relationship (Eq. 5)

between the PCUC ( Si½ �PCUCÞ and the pore water ( Si½ �PWÞ end

members contributing to the Si(OH)4 concentration in

bottom waters ( Si½ �Bottom Water) (Table 1). The fractions (f) of

the PCUC and the PW that are needed to explain the bot-

tom water Si(OH)4 concentration are calculated as follows

Si½ �Bottom Water5 Si½ �PCUC � f� �

1 Si½ �PW � 12fð Þ� �

(5)

Due to high Si(OH)4 concentrations in pore waters their

contribution is estimated to be only 4% whereas the remain-

ing of 96% originate from the PCUC. Applying these calcu-

lated fractions to the water masses at Sta. 807 the Si isotope

composition of pore waters can be estimated according to a

two-endmember equation

d30SiBottom Water

5d30SiPCUC � Si½ �PCUC � f� �

1 d30SiPW � Si½ �PW � 12fð Þ� �

Si½ �PCUC � f� �

1 Si½ �PW � 12fð Þ� � (6)

Equation solved for d30SiPW

d30SiPW

5d30SiBW Si½ �PCUC � f

� �1 Si½ �PW � 12fð Þ� �

2 d30SiPCUC � Si½ �PCUC � f� �

Si½ �PW � 12fð Þ(7)

According to this calculation a d30SiPW signature of 10.7&

on the shelf would be necessary to explain the light Si iso-

tope signature in bottom waters (1 1.2&). This would imply

that marine sediments characterized by high levels of bSiO2

remineralization and high Si(OH)4 fluxes are an important

source for isotopically light Si. Unfortunately the Si fluxes

from sediments are as yet not well constrained and have to

be further investigated in order to arrive at better con-

strained estimates for the Peruvian shelf and for the marine

Si budget in general (Tr�eguer and De LaRocha, 2013).

Processes controlling the nitrogen cycle on the shelf

The N cycle on the shelf is prominently characterized by

diminished NO23 and elevated NO2

2 concentrations leading

to distinctly elevated d15NO23 and d15NO2

2 signatures. The

lowest NO23 concentrations (2 lmol L21) were found above

the shelf and correspond to the highest d15NO23 values of up

to 125& (Fig. 4e,f). d15NO23 is elevated within the OMZ due

to denitrification and anammox processes, which have

enrichment factors ranging from 220& to 230& (Brandes

et al., 1998; Voss et al., 2001; Brunner et al., 2013) leaving

the water column enriched in the heavy isotopes. On the

basis of our d15NO23 data, it is not clearly distinguishable if

the main N-loss processes are driven by anammox and/or

denitrification. While a study by Kalvelage et al. (2013)

found that anammox is the major process in the water col-

umn along the Peruvian shelf, the results of a study by Boh-

len et al. (2011) showed that at the sediment-seawater

Grasse et al. Silicon and nitrogen cycling in the upwelling area off Peru

1670

interface at 300 m to 1000 m water depth denitrification is

the most important process along the Peruvian slope.

During the first step of the denitrification process NO23 is

converted to NO22 associated with an increase of the d15N

signature of the residual NO23 and a decrease of d15N signa-

ture of the NO22 produced. This can explain the very high

NO22 concentrations of up to 11 mmol L21 at Sta. 807 and

supports denitrification to be the dominating process on the

shelf, in particular at the sediment-seawater interface, but

not the enriched d15NO22 values. Generally, the NO2

2 max-

ima found at deeper depths within the OMZ are associated

with more negative d15NO22 values between 210& and 0&,

with NO22 concentrations ranging from 4 to 10 lmol L21

(Casciotti et al., 2013). Interestingly, however, the d15NO22

shows the highest so far observed values (115&) at Sta. 807,

which can only be explained by very efficient denitrification

processes that transferred the highly positive d15N signal of

the NO23 into the NO2

2 produced.

The N cycling on the Peruvian shelf is highly variable on

short time scales and shows a tight coupling between differ-

ent N processes. Overall, the shelf stations were obviously

mainly influenced by sediment-seawater interactions, which

led to a major decrease in NO23 and an increase in NO2

2 con-

centrations within the OMZ. Despite that NO23 concentra-

tions are strongly depleted in the subsurface waters on the

shelf as also indicated by low NO23 : Si(OH)4 ratios (�0.5), the

surface waters are at the same time not depleted in NO23 ,

which is most likely caused by N recycling processes above

the oxycline (NO23 : Si(OH)4 �2.5) and admixture of other

water masses (Fig. 7). In the following chapter, we will discuss

the processes influencing the nutrients and the stable isotope

signatures in the ML as well as the supply of water masses.

Processes in the mixed layer influenced by upwelling and

the eddy circulation: silicon and nitrogen cycling

During utilization of Si(OH)4 and NO23 lighter isotopes are

preferentially incorporated into phytoplankton, resulting in

heavier d30Si(OH)4 and d15NO23 values of seawater. The lowest

d30Si(OH)4 values (1 2.0& to 1 2.2&) in surface waters are

observed on the shelf due to enhanced upwelling-derived sup-

ply of Si(OH)4 with low d30Si(OH)4 signatures and therefore

low utilization of the available Si(OH)4 pool (Ehlert et al.,

2012). These signatures correlate with elevated d15NO23 values

(1 8& to 13&). According to the Raleigh-type model the cal-

culated enrichment factors in surface waters are 20.5& for Si

utilization and 24.6& for N utilization. This is in agreement

with previous studies of the EEP, in which 30e/15e of 20.5&

and 24.8&, respectively, were estimated (Ehlert et al., 2012;

Mollier-Vogel et al., 2012). Accordingly the source waters of

these stations are expected to have d30Si(OH)4 signatures of

�1 1.5& and d15NO23 values of � 15&. Adopting an initial

d30Si(OH)4 value for upwelled water in the shelf regions

(mainly from the PCUC) of 11.5& (Ehlert et al., 2012), the

surface water d30Si(OH)4 compositions can be fully explained.

In contrast, d15NO23 signatures (�1 12&) in surface waters are

lower than in the subsurface source waters (d15NO23 �1 20&)

and therefore suggest additional processes influencing the N

isotope composition. One possible explanation is that the sur-

face waters carrying a high subsurface signature were mixed

with water masses carrying a lower d15NO23 signature of

�1 8& corresponding to waters with a potential density near

25.8 kg m23. This is in agreement with the d30Si(OH)4 signa-

ture of 12& at this density, which is essentially the same Si

isotope value as the Si isotope signature of the surface waters

(12&). In this case, the surface waters on the shelf are a mix-

ture of two upwelling sources with only slightly different Si

isotope signatures, where the constant resupply results in rela-

tively unfractionated surface waters (Fig. 7).

Another possible explanation for the moderately fractio-

nated d15NO23 signature in surface waters is intense reminerali-

zation of the high PON. This may also contribute to the

isotope signature given that PON as remineralization may have

lowered the d15N values by approx. 3& (Sigman et al., 2009,

M€obius, 2013). Generally PON is more efficiently recycled (up

to 70%) in the ML than bSiO2 (� 50%) (Dugdale and Wilker-

son, 1998; Demarest et al., 2011). The importance of remineral-

ization in the surface waters has previously been demonstrated

by a study of Fernand�ez et al. (2009) who suggested that the

surface waters off Peru are not only fuelled by “new” upwelled

NO23 from below but that also “regenerated” N within the first

meters of the water column plays an important role.

The availability of nutrients, influenced by water mass sup-

ply and remineralization also has a direct influence on the

phytoplankton communities. During the sampling period,

the dominating phytoplankton species in the eddy center

where the thermocline deepened, stratification was stronger

and surface waters were highly depleted in Si(OH)4 compared

to NO23 was Synechococcus, a picocyanobacterium (Franz et al.,

2012; Fig. 7). Recently, Baines et al. (2012) discovered that Syn-

echococcus can store high amounts of Si(OH)4 and therefore

can have a major influence on the marine Si cycle. So far, it is

not known if the incorporation of Si(OH)4 into Synechococcus

is accompanied by significant Si isotope fractionation, but if

so, the high abundance of Synechococcus could be the reason

for the observed Si depletion. The high NO23 : Si(OH)4 ratios

(up to 15) therefore clearly point to the growth of non-

siliceous organisms. Diatoms were most abundant in the ML

on the shelf where low NO23 : Si(OH)4 ratios (2.5) prevailed.

Further offshore (Sta. 3, 4, 5), diatom productivity is reduced,

as indicated by lower bSiO2 and PON concentrations (0.6

lmol L21, respectively 2.2 lmol L21). These stations were

characterized by moderately fractionated d30Si(OH)4 values

(12.5&) and high d15NO23 (116&) most likely reflect the iso-

tope composition of surface waters on the shelf, which are

transported toward the offshore region via the eddy flow path

and thereby are depleted in nutrients and heavier in their iso-

topic signals due to continuous utilization (a quasi-closed Ray-

leigh system; Figs. 1a, 5). NO23 : Si(OH)4 ratios have a clear

Grasse et al. Silicon and nitrogen cycling in the upwelling area off Peru

1671

influence on the phytoplankton communities, as already

shown by a study from Vaillancourt et al. (2003) in the North

Pacific that showed higher abundances of Synechococcus out-

side of a cyclonic eddy. Their cyclonic eddy was characterized

by low NO23 : Si(OH)4 ratios (�0.8) in its center and even lower

NO23 : Si(OH)4 ratios (�0.2) outside the eddy. In general,

cyclonic eddies and mode water eddies inject nutrients from

below into the euphotic zone while anticyclonic eddies

decrease the nutrient content of the euphotic zone, which has

also implications on the phytoplankton communities (e.g.,

Thompson et al., 2007; Bibby and Moore et al., 2011). There-

fore, both the eddy types as well as the nutrient characteristics

of the source waters clearly play an important role.

Stable isotope compositions and nutrient concentrations

within the OMZ: Si and N cycling

The OMZ in the study area is characterized by oxygen con-

centrations below 5 lmol L21. The oxycline along the 108S

transect varied between 20 m and 90 m water depth closely

following the 26.1 kg m23 density surface and was strongly

affected by the eddy, which caused a significant deepening of

the oxycline at Sta. 2 (Fig. 4). The influence of the eddy on

the nutrient distribution is therefore not only visible at the

surface but also at greater depth (e.g., Altabet et al. 2012;

Stramma et al., 2013). The variability of the distribution of

the Si(OH)4 concentrations closely correlates with density

and therefore also the oxygen distribution. This is, however,

not always directly mirrored by the Si isotope distribution. In

general, the d30Si(OH)4 signatures in OMZ waters range

between 11.5& and 12.3& (excluding Sta. 807) but do not

reveal any clear correlation with the Si concentration or

potential density. Therefore, we cannot clearly distinguish

between isotopic changes as a consequence of bSiO2 dissolu-

tion and water mass mixing. In contrast, the d15NO23 distri-

bution clearly correlates with the NO23 concentration due to

N-loss processes. NO23 reduction to NO2

2 is known to produce

N and O isotopic fractionation with a characteristic slope

near 1 (Granger et al., 2008). Deviations from this relation-

ship have been interpreted as evidence for co-occurrence of

other N transformation processes including NO22 oxidation

and contributions from N2 fixation (Sigman et al., 2005; Cas-

ciotti and McIlvin, 2007). For samples within the OMZ, the

relationship between d15NO23 and d18O-NO2

3 along the 108S

transect is indistinguishable from a slope of 1 : 1 implying

that is NO23 reduction is the main process. Applying a

Rayleigh-type model an enrichment factor for N-loss of

219.2& was estimated within the OMZ, which is in agree-

ment with published data from Casciotti (2009) and Rya-

benko et al. (2012). However, a clear distinction if anammox

or denitrification is the dominating process cannot be made.

Besides N-loss processes within the OMZ also nitrification

occurs which ultimately generates NO23 . Generally, nitrifica-

tion occurs in the aerobic waters, but a study by Ward et al.

(1989) suggested that nitrification also takes place within the

upper OMZ off Peru. Nitrification is associated with an inverse

fractionation effect (�113&) (Casciotti and McIlvin, 2007;

Casciotti, 2009) opposite in sign to the one expected for deni-

trification (� 225&) (Barford et al., 1999; Granger, 2006). A

close coupling between denitrification and nitrification, could

therefore result in the net elevated d15NO23 signatures given

that the fractionation factor for denitrification is nearly double

as high as the reverse one for nitrification (Casciotti, 2009).

Except for Sta. 5, which reveals elevated d15NO23 values

(116&) at 150 m depth, the d15NO23 values in the study area

are relatively homogenous at 18& to 110& and therefore

only moderately fractionated within the OMZ (Fig. 4f). The ele-

vated d15NO23 values at Sta. 5 may thus represent a signal that

originated on the shelf as also indicated by the data of Altabet

et al. (2012), which showed d15NO23 values up to 140& at the

end of the outermost offshore filament of the eddy. In general,

NO23 concentrations within the anticyclonic eddy are still rela-

tively high (�25 lmol L21) compared with another anticy-

clonic mode water eddy south of our study area (�168S), which

showed extremely high d15NO23 values (up to 170& in its cen-

ter) and highly depleted nitrate concentrations (Bourbonnais

et al., 2015). These authors therefore suggested that eddies are

“N-loss Hotspots.” At 168S NO23 concentrations are generally

lower, which is also indicated by very low N* values (Zamora

et al., 2012) compared to our study area. However, the anticy-

clonic eddy investigated in our study rather suggests that these

eddies are not generally “N-loss hotspots” and shows that their

influence on biogeochemical cycling of nutrients is highly

dependent on the history of their source waters.

Factors controlling the silicon and nitrogen cycle in the

Peruvian Upwelling: what can we learn from the

combination of silicon and nitrogen isotopes

In this study, the first direct comparison between the distri-

butions of dissolved d30Si(OH)4 and d15NO3 in the OMZ of the

Peruvian Upwelling area serves to better understand the fac-

tors controlling the biogeochemical cycling of both nutrients

(Fig. 7). Samples were taken along a 108S transect perpendicu-

lar to the Peruvian coast and therefore covered a large range of

different hydrographic settings including strong upwelling

and locations influenced by the eddy. Upwelling as well as the

eddy had a large influence on the Si(OH)4 and NO23 concentra-

tions, as well as on the corresponding isotopes. Along with

the Eddy nutrients were transported offshore and our data are

consistent with continuous utilization along the transport

pathway, which especially led to Si depleted waters offshore. In

contrast, even though N-loss processes within the OMZ dimin-

ished the NO23 concentrations, NO2

3 was never completely uti-

lized in surface waters. This was due to efficient recycling and

re-supply of NO23 within the upper water column (above the

OMZ), which is reflected by the stable isotopes confirming that

N is more efficiently recycled in the upper water column than

Si. The higher regeneration efficiency of N is also traceable by

the pronounced Si deficit (Si*) above the oxycline. Very low

Grasse et al. Silicon and nitrogen cycling in the upwelling area off Peru

1672

NO23 : Si(OH)4 (<1) was found in bottom waters on the shelf,

where the highest d15NO23 (125&) values were accompanied

by the lowest d30Si(OH)4. There we also found a strong negative

coupling between Si(OH)4 and NO23 concentrations, most

likely because the organic matter fueling the N-loss processes is

derived from sinking diatoms. Our study shows that in upwell-

ing regions, which are characterized by high productivity,

decomposition of organic matter and therefore a pronounced

OMZ, the Si and N cycles are strongly linked: surface waters on

the shelf influenced by strong upwelling show a negative cou-

pling between Si and N isotopes (low d30Si(OH)4, high

d15NO23 ), whereas stations further offshore are positively

coupled (high d30Si(OH)4, high d15NO23 ).

The information we gain from a combined approach using

d30Si(OH)4 and d15NO23 isotope data not only helps to under-

stand recent biogeochemical processes but also helps to recon-

struct biogeochemical cycling in the past. N-loss processes can

influence the d15N signature of sedimentary record, given that

supply of the heavy d15NO23 signatures from subsurface waters

leads to PON enriched in 15N, which is ultimately buried in the

sediments (e.g., Altabet et al., 1994; Altabet, 2006; Mollier-

Vogel et al., 2012). In general, the d15N obtained from sediment

cores in OMZs are usually interpreted to directly reflect changes

in the intensity of subsurface N-loss and the extent and

strength of oxygen depletion (e.g., De Pol-Holz et al. 2007;

Guit�ıerrez et al. 2009), whereas the effect of NO23 utilization is

often neglected. The combined approach shows that surface

waters influenced by strong upwelling are characterized by low

d30Si(OH)4 values (12&) due to low Si utilization but relatively

high d15NO23 (113&) values due to upwelling of waters influ-

enced by N-loss processes. In sedimentary records d15N would

rather result from a N-loss signal. In contrast, Si(OH)4 and NO23

concentrations and the corresponding stable isotope signatures

are strongly positively correlated within the surface ML at near-

shore and offshore stations including regions where siliceous

organisms are not dominating the phytoplankton community

(Fig. 7). A positive correlation between d30Si and d15N would

thus indicate that the signal preserved in sediments is derived

from utilization processes of both nutrients. A recent study by

Ehlert et al. (2015) already used the combined approach of

both stable isotope obtained from sediment cores and con-

cluded that during the past � 650 years d15N has to a large

extend been controlled by utilization of NO23 and not by N-loss

processes as previously suggested. In upwelling areas where the

Si and N cycles are closely linked, the dual isotope approach

using Si and N isotopes will therefore lead to a better under-

standing of present and past biogeochemical processes and

help to identify source waters.

References

Altabet, M. A. 2001. Nitrogen isotopic evidence for micronu-

trient control of fractional NO23 utilization in the equato-

rial Pacific. Limnol. Oceanogr. 46: 368–380.

Altabet, M. A. 2006. Isotopic tracers of the marine nitrogen

cycle, p. 251–293. In J. Volkman, [ed.], Marine organic

matter: Chemical and biological markers, 2. Springer-Ver-

lag, Berlin Heidelberg.

Altabet, M. A., and R. Francois, R. 1994. Sedimentary nitro-

gen isotopic ratio as a tracer for surface ocean nitrate utili-

zation. Global Biogeochem. Cycles 8: 103–116.

Altabet, M. A., E. Ryabenko, L. Stramma, D. W. R. Wallace,

M. Frank, P. Grasse, and G. Lavik. 2012. An eddy-

stimulated hotspot for fixed nitrogen-loss from the Peru

oxygen minimum zone. Biogeosciences 9: 4897–4908.

Ayon, P., M. I. Criales-Hernandez, R. Schwamborn, and H.

Hirche. 2008. Zooplankton research off Peru: A review.

Prog. Oceanogr. 79, 238–255.

Barford, C., J. P. Montoya, M. A., Altabet, and R. Mitchell.

1999. Steady-state nitrogen isotope effects of N2 and N2O

production in Paracoccus denitrificans. Appl. Environ.

Microbiol. 65: 9889–9994.

Baines, S. B., B. S. Twining, M. A. Brzezinski, J. W., Krause, S.

Vogt, D. Assael, and H. McDaniel. 2012. Significant sili-

con accumulation by marine picocyanobacteria. Nat. Geo-

sci. 5: 886–891

Berelson, W., and others. 2003. A time series of benthic flux

measurements from Monterey Bay, CA. Cont. Shelf Res.

23: 457–481.

Berger, W. H., V. S. Smetacek, and G. Wefer. 1989. Produc-

tivity of the ocean: Present and past, p. 471. Wiley.

Bibby, T. S., and C. M. Moore. 2011. Silicate:nitrate ratios of

upwelled waters control the phytoplankton community

sustained by mesoscale eddies in sub-tropical North Atlan-

tic and Pacific. Biogeosciences 8: 657–666.

Bidle, K. D., and F. Azam. 1999. Accelerated dissolution of

diatom silica by marine bacterial assemblages. Nature

397: 508–512.

Bidle, K. D., M. Manganelli, and F. Azam. 2002. Regulation

of oceanic silicon and carbon preservation by temperature

control on bacteria. Science 298: 1980–1983.

Bourbonnais, A., M. A. Altabet, C. N. Charoenpong,

J. Larkum, H. Hu, H. W. Bange, and L. Stramma. 2015. N-

loss isotope effects in the Peru oxygen minimum zone

studied using a mesoscale eddy as a natural tracer experi-

ment. Global Biogeochem. Cycles 29: 793–811.

Brandes, J. A., A. H. Devol, T. Yoshinari, D. A. Jayakumar, and

W. A. Naqvi. 1998. Isotopic composition of nitrate in the

central Arabian Sea and eastern tropical North Pacific: A

tracer for mixing and nitrogen cycles. Limnol. Oceanogr.

43: 1680–1689.

Brink, K., D. Halpern, A. Huyer, and R. L. Smith. 1983. The

physical environment of the Peruvian upwelling system.

Prog. Oceanogr. 12: 285–305.

Bruland, K., E. Rue, G. Smith, and G. Ditullio. 2005. Iron,

macronutrients and diatom blooms in the Peru upwelling

regime: Brown and blue waters of Peru. Mar. Chem. 93:

81–103.

Grasse et al. Silicon and nitrogen cycling in the upwelling area off Peru

1673

Brunner, B., and others. 2013. Nitrogen isotope effects

induced by anammox bacteria. Proc. Natl. Acad. Sci. USA

110: 18994–18999.

Brzezinski, M. A. 1985. The Si:C:N ratio of marine diatom-

s_interspecific variability and the effect of some environ-

mental variables. J. Phycol. 21: 347–357.

Bohlen, L., and others. 2011. Benthic nitrogen cycling tra-

versing the Peruvian oxygen minimum zone. Geochim.

Cosmochim. Acta 75: 6094–6111.

Casciotti, K. L. 2009. Inverse fractionation during bacterial

nitrite oxidation. Geochim. Cosmochim. Acta 73: 2061–2076

Casciotti, K. L., and M. R. Mcllvin. 2007. Isotopic analyses of

nitrate and nitrite from references mixtures and applica-

tion to Eastern Tropical North Pacific waters. Mar. Chem.

107: 184–201.

Casciotti, K. L., C. Buchwald, and M. McIlvin. 2013. Implica-

tions of nitrate and nitrite isotopic measurements for the

mechanisms of nitrogen cycling in the Peru oxygen defi-

cient zone. Deep-Sea Res. Part I 80: 78–93

Chaigneau, A., A. Gizolme, and C. Grados. 2008. Mesoscale

eddies off Peru in altimeter records: Identification algo-

rithms and eddy spatio-temporal patterns. Prog. Ocean-

ogr. 79: 106–119.

Codispoti, L. A. 2007. An oceanic fixed nitrogen sink exceed-

ing 400 Tg N a21 vs. the concept of homeostasis in the

fixed-nitrogen inventory. Biogeosciences 4: 233–253.

Conley, D. J., and T. C. Malone. 1992. Annual cycle of dis-

solved silicate in Chesapeake Bay: Implications for the

production and fate of phytoplankton biomass. Mar. Ecol.

Prog. Ser. 81: 121–128.

Czeschel, R., L. Stramma, F. U. Schwarzkopf, B. S. Giese, A.

Funk, and J. Karstensen. 2011. Mid-depth circulation of

the eastern tropical South Pacific and its link to the oxy-

gen minimum zone. J. Geophys. Res. 116: C01015. doi:

10.1029/2010JC006565

De LaRocha, C., M. A. Brzezinski, and M. DeNiro. 1997. Frac-

tionation of silicon isotopes by marine diatoms during

biogenic silica formation. Geochim. Cosmochim. Acta 61:

5051–5056.

Demarest, M. S., M. A. Brzezinski, and C. P. Beucher. 2009.

Fractionation of silicon isotopes during biogenic silica dis-

solution. Geochim. Cosmochim. Acta 73: 5572–5583.

Demarest, M. S., M. A. Brzezinski, D. M. Nelson, J. W.

Krause, J. L. Jones, and C. P. Beucher. 2011. Net biogenic

silica production and nitrate regeneration determine the

strength of the silica pump in the Eastern Equatorial

Pacific. Deep-Sea Res. Part II 58: 462–476.

De Pol-Holz, R., O. Ulloa, F. Lamy, L. Dezileau, P. Sabatier, and

D. Hebbeln. 2007. Late Quaternary variability of sedimen-

tary nitrogen isotopes in the eastern South Pacific Ocean.

Paleoceanography 22: PA2207. doi:10.1029/2006PA001308

Deutsch, C., J. L. Sarmiento, D. M. Sigman, N. Gruber, and J.

P. Dunne. 2007. Spatial coupling of nitrogen inputs and

losses in the ocean. Nature 445: 164–167.

Diaz, R. J. R., and R. R. Rosenberg. 2008. Spreading dead

zones and consequences for marine ecosystems. Science

321: 926–929.

Dugdale, R. C., and F. P. Wilkerson. 1998. Silicate regulation

of new production in the equatorial Pacific upwelling.

Nature 391: 270–273.

Ehlert, C., and others. 2012. Factors controlling the silicon

isotope distribution in waters and surface sediments of

the Peruvian coastal upwelling. Geochim. Cosmochim.

Acta 99: 128–145

Ehlert, C., P. Grasse, D. Guiti�errez, R. Salvatteci, and M.

Frank. 2015. Nutrient utilisation and weathering inputs in

the Peruvian upwelling region since the Little Ice Age.

Clim. Past 11: 1–16.

Estrada, M., and D. Blasco. 1985. Phytoplankton assemblages

in coastal upwelling areas, p. 379–402. In C. Bas, R. Mar-

galef, and P. Rubies [eds.], Simposio Internacional Sobre

Las Areas de Afloramiento Mas Importantes del Oeste Afri-

cano (Cabo Blanco y Benguela). Instituto de Investiga-

ciones Pesqueras.

Fern�andez, C., L. Far�ıas, and M. E. Alcaman. 2009. Primary

production and nitrogen regeneration processes in surface

waters of the Peruvian upwelling system. Prog. Oceanogr.

83: 159–168.

Fiedler, P., and L. Talley. 2006. Hydrography of the eastern

tropical Pacific: A review. Prog. Oceanogr. 69: 143–180.

Franck, V. M., M. A. Brzezinski, K. H. Coale, and D. M.

Nelson. 2000. Iron and silicic acid concentrations regulate

Si uptake north and south of the Polar Frontal Zone in

the Pacific Sector of the Southern Ocean. Deep-Sea Res.

Part II 47: 3315–3558

Franz, J., G. Krahmann, G. Lavik, P. Grasse, P. Dittmar, and

U. Riebesell. 2012. Dynamics and stoichiometry of

nutrients and phytoplankton in waters influenced by the

oxygen minimum zone in the eastern tropical Pacific.

Deep-Sea Res. Part I 62: 20–31

Fuenzalida, R., W. Schneider, J. Garc�es-Vargas, L. Bravo, and

C. Lange, C. 2009. Vertical and horizontal extension of

the oxygen minimum zone in the eastern South Pacific

Ocean. Deep Sea Res. Part II 56: 992–1003.

Georg, R. B., B. Reynolds, M. Frank, and A, Halliday. 2006.

New sample preparation techniques for the determination

of Si isotopic compositions using MC-ICPMS. Chem.

Geol. 235: 95–104.

Granger, J., D. M. Sigman, J. A. Needoba, and P. J. Harrison.

2004. Coupled nitrogen and oxygen isotope fractionation

of nitrate during assimilation by cultures of marine phy-

toplankton. Limnol. Oceanogr. 49: 1763–1773.

Granger, J., D. M. Sigman, M. F. Lehmann, and P. D. Tortell.

2008. Nitrogen and oxygen isotope fractionation during

dissimilatory nitrate reduction by denitrifying bacteria.

Limnol. Oceanogr. 53: 2533.

Granger, J., D. Sigman, and M. Rohde. 2010. N and O iso-

tope effects during nitrate assimilation by unicellular

Grasse et al. Silicon and nitrogen cycling in the upwelling area off Peru

1674

prokaryotic and eukaryotic plankton cultures. Geochim.

Cosmochim. Acta 74: 1030–1040.

Grasse, P., T. Stichel, R. Stumpf, L. Stramma, and M. Frank,

M. 2012. The distribution of neodymium isotopes and

concentrations in the Eastern Equatorial Pacific Water

mass advection versus particle exchange. Earth Planet.

Sci. Lett. 353–354: 198–207.

Grasse, P., C. Ehlert, and M. Frank. 2013. The influence of

water mass mixing on the dissolved Si isotope composi-

tion in the Eastern Equatorial Pacific. Earth Planet. Sci.

Lett. 380: 60–71.

Grasshoff, K., K. Kremlin, and M. Erhardt. 1999. Methods for

seawater analysis – third completely revised and extended

version, p. 600. Wiley VHC.

Gruber, N., Z. Lachkar, H. Frenzel, P. Marchesiello, M.

M€unnich, J. C. McWilliams, T. Nagai, and G.-K. Plattner.

2011. Eddy-induced reduction of biological production in

eastern boundary upwelling systems. Nat Geosci. 4: 787–

792.

Guti�errez, D., and others. (2009). Rapid reorganization in

ocean biogeo- chemistry off Peru towards the end of the

Little Ice Age. Biogeosciences 6: 835–848. doi:10.5194/bg-

6-835-2009

Hutchins, D. A., and K. W. Bruland. 1998. Iron-limitated dia-

tom growth and Si:N uptake ratios in a coastal upwelling

regime. Nature 393: 561–563

Huyer, A., R. L. Smith, and T. Paluszkiewicz. 1987. Coastal

Upwelling off Peru During Normal and El Ni~no Times,

1981–1984. J Geophys. Res. 92: 14.297–14.307. doi:

10.1029/JC092iC13p14297

Kalvelage, T., and others. 2013. Nitrogen cycling driven by

organic matter export in the South Pacific oxygen mini-

mum zone. Nat. Geosci. 6: 228–234.

Karl, D. M., and G. Tien. 1992. MAGIC: A sensitive and pre-

cise method for measuring dissolved phosphorus in

aquatic environments. Limnol. Oceanogr. 37: 105–116.

Karstensen, J. 2004. Formation of the South Pacific Shallow

Salinity Minimum: A Southern Ocean Pathway to the

Tropical Pacific. J. Phys. Oceanogr. 34: 2398. doi:10.1175/

JPO2634.1

Karstensen, J., and O. Ulloa. 2008. The Peru-Chile Current Sys-

tem. Encyclopedia of Ocean Sciences 2nd edition online.

Karstensen, J., L. Stramma, and M. Visbeck. 2008. Oxygen

minimum zones in the eastern tropical Atlantic and

Pacific oceans. Prog. Oceanogr. 77: 331–350.

Kessler, W. 2006. The circulation of the eastern tropical

Pacific: A review. Prog. Oceanogr. 69: 181–217.

Lam, P., and others. 2009. Revising the nitrogen cycle in the

Peruvian oxygen minimum zone. Proc. Natl. Acad. Sci.

USA 106: 4752–4757.

Lewin, J. 1961. The dissolution of silica from diatom walls.

Geochim. Cosmochim. Acta 21: 182–198.

Mariotti, A., J. Germon, P. Hubert, P. Kaiser, R. Letolle, A.

Tardieux, and P. Tardieux. 1981. Experimental-Determina-

tion of nitrogen kinetic isotope fractionation – some prin-

ciples – illustration for the denitrification and nitrification

processes. Plant Soil 62: 413–430.

McGillicuddy, D., A. Robinson, and D. Siegel. 1998. Influ-

ence of mesoscale eddies on new production in the Sar-

gasso Sea. Nature 394: 263–266.

McIlvin, M. R. and M. A. Altabet. 2005. Chemical conversion

of nitrate and nitrite to nitrous oxide for nitrogen and

oxygen isotopic analysis in freshwater and seawater. Anal.

Chem. 77: 5589–5595.

Milligan, A. J., D. E. Varela, M. A., Brzezinski, and F. M. M.

Morel. 2004. Dynamics of silicon metabolism and silicon

isotopic discrimination in a marine diatom as a function

of pCO2. Limnol. Oceanogr. 49: 322–329.

M€obius, J. 2013. Isotope fractionation during nitrogen remi-

neralization (ammonification): Implications for nitrogen

isotope biogeochemistry. Geochim. Cosmochim. Acta

105: 422–432.

Mollier-Vogel, E., E. Ryabenko, P. Martinez, D. Wallace, M.

A. Altabet, and R. Schneider. 2012. Nitrogen isotope gra-

dients off Peru and Ecuador related to upwelling, produc-

tivity, nutrient uptake and oxygen deficiency. Deep-Sea

Res. Part I 70: 14–25.

Montoya, J. P. and J. J. McCarthy. 1995. Isotopic fractiona-

tion during nitrate uptake by phytoplankton grown in

continuous culture. J Plankton Res. 17: 439–464.

Natori, Y., A. Haneda, and Y. Suzuki. 2006. Vertical and sea-

sonal differences in biogenic silica dissolution in natual

seawater in Surunga Bay, Japan: Effects of temperature

and organic matter. Mar. Chem. 102: 230–241.

Needoba, J. A., N. A. Waser, P. J., Harrison, and S. E. Calvert.

2003. Nitrogen isotope fractionation in 12 species of

marine phytoplankton during growth on nitrate. Mar.

Ecol. Prog. Ser. 255: 81–91.

Nelson, D., P. Tr�eguer, M. A. Brzezinski, A. Leynaert, and B.

Queguiner. 1995. Production and dissolution of biogenic

silica in the ocean: Revised global estimates, comparison

with regional data and relationship to biogenic sedimen-

tation. Global Biogeochem. Cycles 9: 359–372.

Noffke, A. 2014. Phosphorus Cycling in anoxic sediments.

Ph. D. thesis. Christian-Albrecht University Kiel.

Pennington, J. T., K. Mahoney, V. Kuwahara, D. Kolber, R.

Calienes, and F. P. Chavez. 2006. Primary production in

the eastern tropical Pacific: A review. Prog. Oceanogr. 69:

285–317.

Penven, P., V. Echevin, J. Pasapera, F. Colas, and J. Tam.

2005. Average circulation, seasonal cycle, and mesoscale

dynamics of the Peru Current System: A modeling

approach. J. Geophys. Res. 110: C1002. doi: 10.1029/

2005JC002945

Ragueneau, O., and others. 2000. A review of the Si cycle in

the modern ocean: Recent progress and missing gaps in

the application of biogenic opal as a paleoproductivity

proxy. Global Planet. Change 26: 317–365.

Grasse et al. Silicon and nitrogen cycling in the upwelling area off Peru

1675

Reid, J. 1973. The shallow salinity minima of the Pacific

Ocean. Deep-Sea Res. 20: 51–68.

Reynolds, B., M. Frank, and A. Halliday. 2006. Silicon iso-

tope fractionation during nutrient utilization in the

North Pacific. Earth Planet. Sci. Lett. 244: 431–443.

Ryabenko, E., M. A. Altabet, and D. W. R. Wallace. 2009.

Effect of chloride on the chemical conversion of nitrate

to nitrous oxide for d15N analysis. Limnol. Oceanogr.:

Methods 7: 545–552.

Ryabenko, E., A. Kock, H. W. Bange, M. A. Altabet, and D.

W. R. Wallace. 2012. Contrasting biogeochemistry of

nitrogen in the Atlantic and Pacific oxygen minimum

zones. Biogeosciences 9: 203–212

Sigman, D. M., J. Granger, P. J., DiFiore, M. M. Lehmann, R.

Ho, G. Cane, and A. van Geen, A. 2005. Coupled nitrogen

and oxygen isotope measurements of nitrate along the

eastern North Pacific margin. Global Biogeochem. Cycles

19: GB4022.

Sigman, D. M., K. L. Karsh, and K. L. Casciotti. 2009. Ocean

process tracers: Nitrogen isotopes in the ocean. Encyclo-

pedia of ocean science, 2nd edn. Elsevier.

Stramma, L., H. W. Bange, R. Czeschel, A. Lorenzo, and M.

Frank. 2013. On the role of mesoscale eddies for the bio-

logical productivity and biogeochemistry in the eastern

tropical Pacific Ocean off Peru. Biogeosciences 10: 7293–

7306.

Strickland, J. D. H., O. Holm-Hansen, R. W. Eppley, and R. J.

Linn. 1969. The use of a Deep Tank in Plankton Ecology.

I. Studies of the growth and composition of Phytoplank-

ton Crops at Low Nutrient Levels. Limnol. Oceanogr. 14:

23–34.

Strub, P. T., J. M. Mes�ıas, V. Montecino, and J. Rutllant.

1998. Coastal Ocean Circulation off Western South Amer-

ica. Sea 11: 273–313.

Sutton, J., D. E. Varela, A. Brzezinski, and C. P. Beucher.

2012. Species-dependent silicon isotope fractionation by

marine diatoms. Geochim. Cosmochim. Acta 104: 300–309.

Thiede, J., and E. Suess. 1983. Coastal upwelling: Its sedi-

ment record, p. 610. Plenum Publishing Corporation.

Thomas, W. H. 1979. Anomalous nutrient-chlorophyll inter-

relationships in the offshore eastern tropical Pacific

Ocean. J. Mar. Res. 37: 327–335.

Thompson, P. A., S. Pesant, and A. W. Waite. 2007. Con-

trasting the vertical differences in the phytoplankton biol-

ogy of a dipole pair of eddies in the south-eastern Indian

Ocean. Deep-Sea Res. Part II 54: 1003–1028.

Toggweiler, J. R., K. Dixon, and W. S. Broecker. 1991. The

Peru Upwelling and the Ventilation of the South Pacific

Thermocline. J. Geophys. Res. 96: 467–497. doi:10.1029/

91JC02063

Tr�eguer, P. J., and C. L. De LaRocha. 2013. The World Ocean

Silica Cycle. Annu. Rev. Mar. Sci. 5: 477–501.

Ulloa, O., D. E. Canfield, E. F. DeLong, R. M. Letelier, and F.

J. Stewart. 2012. Microbial oceanography of anoxic oxy-

gen minimum zones. Proc Natl Acad Sci USA 109: 15996–

16003.

Vaillancourt, R. D., J. Marra, M. P. Seki, M. L. Parsons, and

R. R. Bidigare. 2003. Impact of a cyclonic eddy on phyto-

plankton community structure and photosynthetic com-

petency in the subtropical North Pacific Ocean. Deep-Sea

Res. Part I 50: 829–847.

Voss, M., J. W. Dippner, and J. P. Montoya. 2001. Nitrogen

isotope patterns in the oxygen-deficient waters of the

Eastern Tropical North Pacific Ocean. Deep-Sea Res. Part I

48: 1905–1921.

Wada, E. 1980. Nitrogen isotope fractionation and its signifi-

cance in biogeochemical processes occurring in marine

environments, p. 375–398. In E. Goldberg, Y. Horibe, and

K. Saru- hashi [eds.], Isotope Marine Chemistry. Uchida

Rokakuho.

Ward B. B., Glover, H. E., & Lipschultz, F. 1989. Chemoauto-

trophic activity and nitrification in the oxygen minimum

zone off Peru. Deep Sea Research Part A. Oceanographic

Research Papers, 36(7), 1031–1051.

Wetzel, F., G. F. de Souza, and B. C. Reynolds. 2014. What

controls silicon isotope fractionation during dissolution of

diatom opal? Geochim. Cosmochim. Acta 131: 128–137.

Wilkerson, F. P., and R. C. Dugdale. 1996. Silicate versus

nitrate limitation in the equatorial Pacific estimated from

satellite-derived sea-surface temperatures. Adv. Space Res.

18: 81–89.

Winkler, L. W. 1888. Die Bestimmung des im Wasser gel€os-

ten Sauerstoffs. Ber. Dtsch Chem. Ges. 21: 2843–2855.

Zamora, L. M., A. Oschlies, H. W. Bange, K. B. Huebert, J. D.

Craig, A. Kock, and C. R. L€oscher. 2012. Nitrous oxide

dynamics in low oxygen regions of the Pacific: Insights from

the MEMENTO database. Biogeosciences 9: 5007–5022.

Acknowledgments

Special thanks go to the crew of the R/V Meteor for their support dur-ing cruise M77/3. We also like to thank the editors of Limnology andOceanography Anya Waite and Robert Howarth and two anonymous

reviewers for their constructive comments, which helped to improve themanuscript. This work is a contribution of the Sonderforschungsbereich

754 “Climate–Biogeochemistry Interactions in the Tropical Ocean”(www.sfb754.de) funded by the Deutsche Forschungsgemeinschaft.

Submitted 3 February 2015

Revised 31 July 2015; 23 Nov 2015; 7 Feb 2016

Accepted 11 April 2016

Associate editor: Anya Waite

Grasse et al. Silicon and nitrogen cycling in the upwelling area off Peru

1676


Recommended