37
Similarity Search on Time Series Data Presented by Zhe Wang

Similarity Search on Time Series Data
Presented by Zhe Wang
Motivations
Fast searching for time-series of real numbers. (“data mining”)
Scientific database: weather, geological, astrophysics, etc.“find past days in which solar wind showed similar
pattern to today’s”Financial, marketing time series:“Find past sales patterns that resemble last month”

Real motivation?

Difficulties for time-series data
Can’t use exact match like fast string match:Need to use distance function to compare two time series (next slide)
Can’t easily index the time-series data directly.
Need faster algorithm than linear scan (whole talk)

Distance functions
L-p distance functionD(x,y) = ( ∑|xi – yi|p )1/p
L-2 distance function (Most popular)D(x,y) = ( ∑(xi - yi)2 )1/2
Finding similar signals to query signal q means finding all x such that:D(q,x) = ( ∑(qi - xi)2 )1/2 <= ε

Why prefer L2 distance
Important feature:L2 distance is preserved under “orthonormal
transforms” (For L-p norm, only p=2 satisfy this property)
Orthonormal transforms: K-L transform, DFT, DWT Optimal distance measure for estimation
If signals are corrupted by Gaussian, additive noise
Widely used

How to index time-series data
Can not direct index the dataVery big dimensionality (Even if query is just 512 points)
Need to extract fewer important representative features to build index upon.Try to use first few parameters of DFT (Discrete Fourier Transform) to build index.
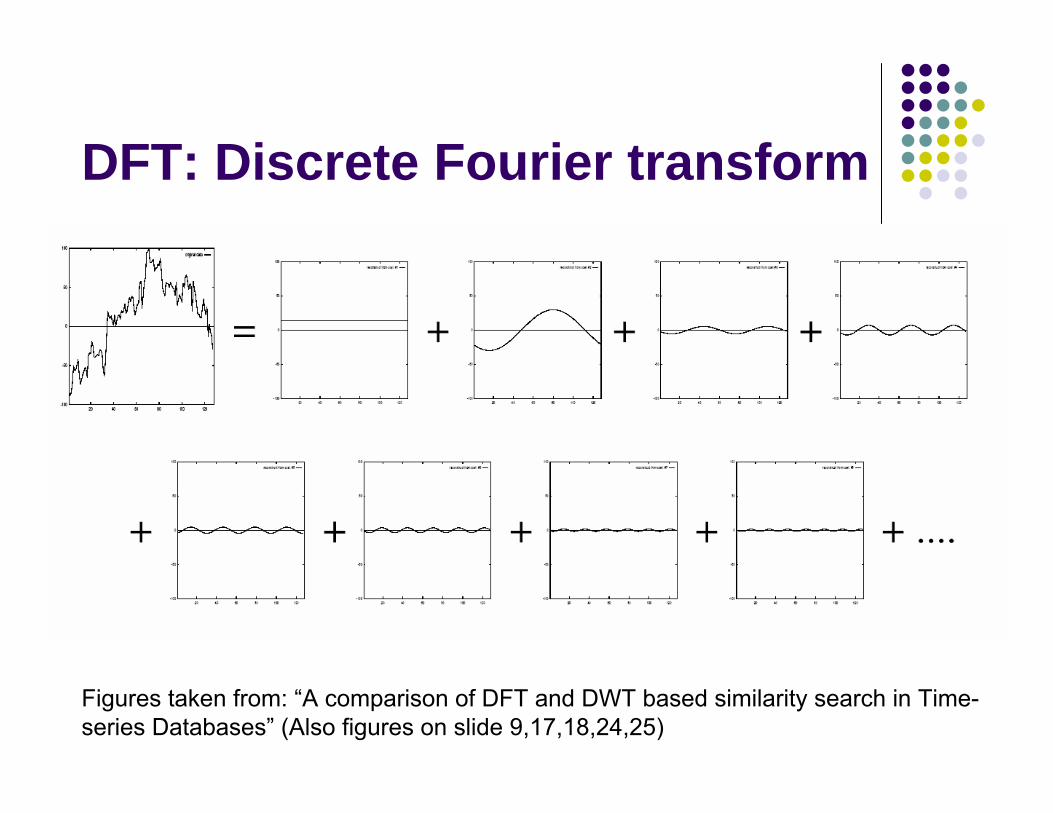
DFT: Discrete Fourier transform
Figures taken from: “A comparison of DFT and DWT based similarity search in Time-series Databases” (Also figures on slide 9,17,18,24,25)


DFT definition
n-point DFT:(Xf is frequency domain, xt is time domain)Xf = (1/n1/2) * ∑t=0 to n-1 xt exp(-j2πft/n)2 f = 0,1,…, n-1Inverse DFT:xt = (1/n1/2) * ∑f=0 to n-1 Xf exp(j2πft/n)2 t = 0,1,…, n-1Energy E(x):E(x) = ||x||2 = ∑ |xt|2
FFT can be done in O(nlogn) time

Parseval’s theorem
Let X be the DFT of sequence x:∑ |xt|2 = ∑ |Xf|2
Since DFT is a linear transformation:… => || xt – yt ||2 = || Xf – Yf ||2L2 distance of two signal in time domain is same as
their L2 distance in frequency domainNo false dismissal if we just use first few parameters.But also do not want too many false hits
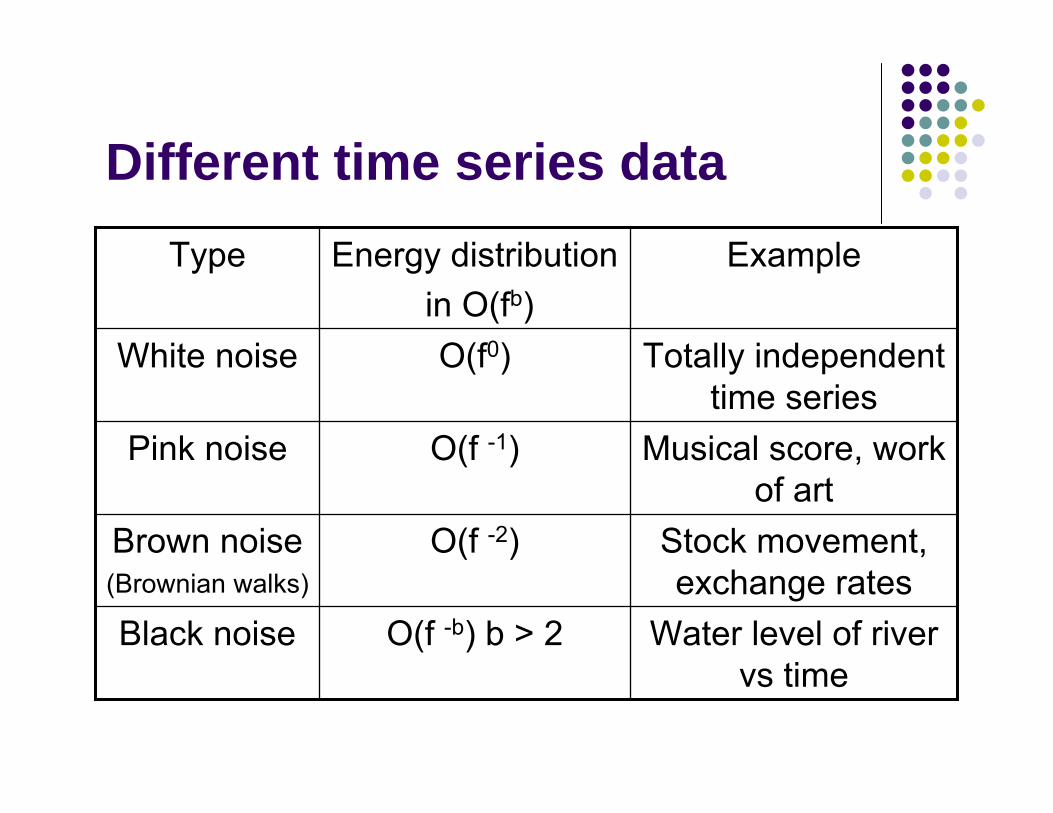
Different time series data
Water level of river vs time
O(f -b) b > 2Black noise
Stock movement, exchange rates
O(f -2)Brown noise(Brownian walks)
Musical score, work of art
O(f -1)Pink noise
Totally independent time series
O(f0)White noise
ExampleEnergy distributionin O(fb)
Type

Building Index
When the signal is not white noise, we can use first few DFT parameter to capture most of the “energy” of the signalLet Q to be the query time-series data:∑first_few_freq (qf - xf )2
<= ∑ all_freq (qf - xf |)2
= ∑(qt - xt)2
<= ε2

Building index (cont)
Use the first few (4-6) DFT parameters, use R*-tree as index (called “F-index”)Given a query Q and ε, use the index to filter out all nodes where:∑first_few_freq (qf - xf )2 > ε2
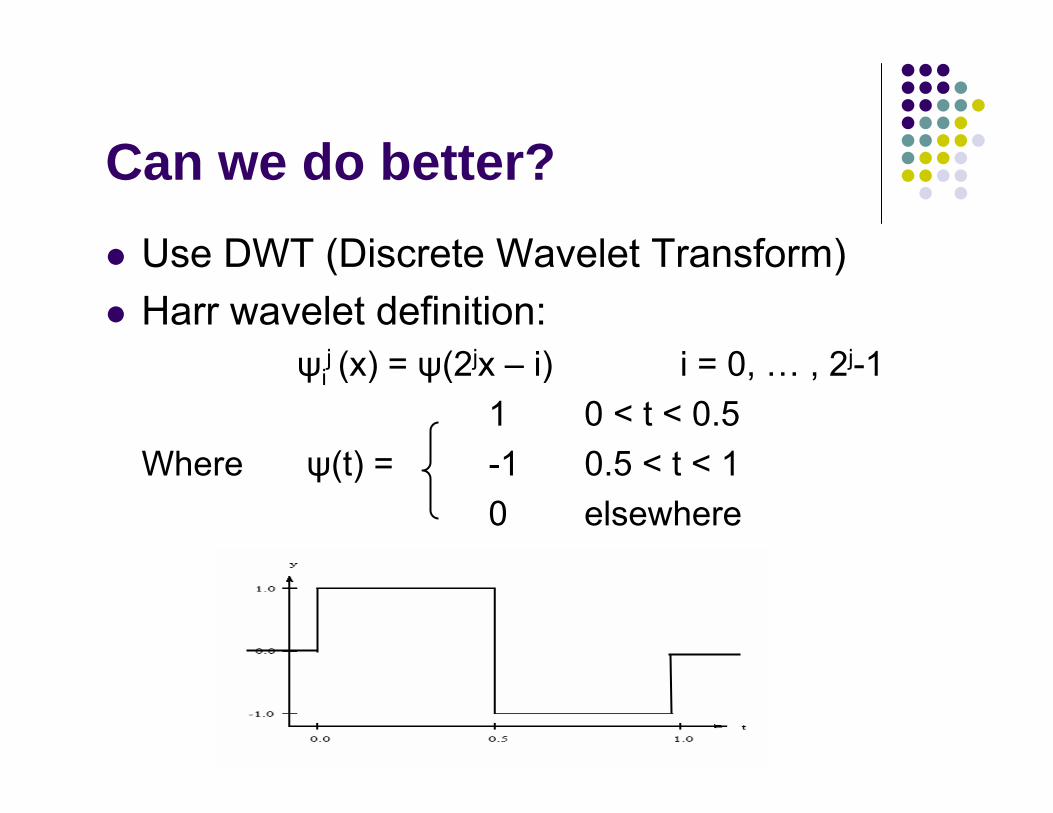
Can we do better?Use DWT (Discrete Wavelet Transform)Harr wavelet definition:
ψij (x) = ψ(2jx – i) i = 0, … , 2j-1
1 0 < t < 0.5Where ψ(t) = -1 0.5 < t < 1
0 elsewhere

Harr transform exampleTime series data: f(t) = (9 7 3 5)
(2)(6)1
(1 -1)(8 4)2
(9 7 3 5)4
CoefficientsAverageResolution
Harr transform result: (6 2 1 -1)If we take only first two coefficients (6 2) and transform back, we get: (8 8 4 4)

Use Harr wavelet with real data


Harr wavelet vs DFT
Low frequencyLow resolutionEnergy concentration for first few params
O(nlogn)O(n)Computation time
Only global feature
Can capture localized feature
Feature
YesYesPreserve L2 distance
DFTHarr wavelet

Performance comparison
10k feature vectors from HK stock market using sliding window size ω=512Precision = Stime / Stransform
Stime: # of sequences qualified in time domainStransform: # of sequences qualified in transformed domain
Compare precision using different amount of coefficients with different method

Performance (HK stock)

DFT fights back
Use last few DFT coefficient to improve quality (Davood Rafiei)The DFT coefficients of a real valued sequence of
duration n satisfy:Xn-f = Xf* (f = 1, … , n-1)Note: if X = a+bi, X* = a-bi

Energy distribution: DFT vs DWT
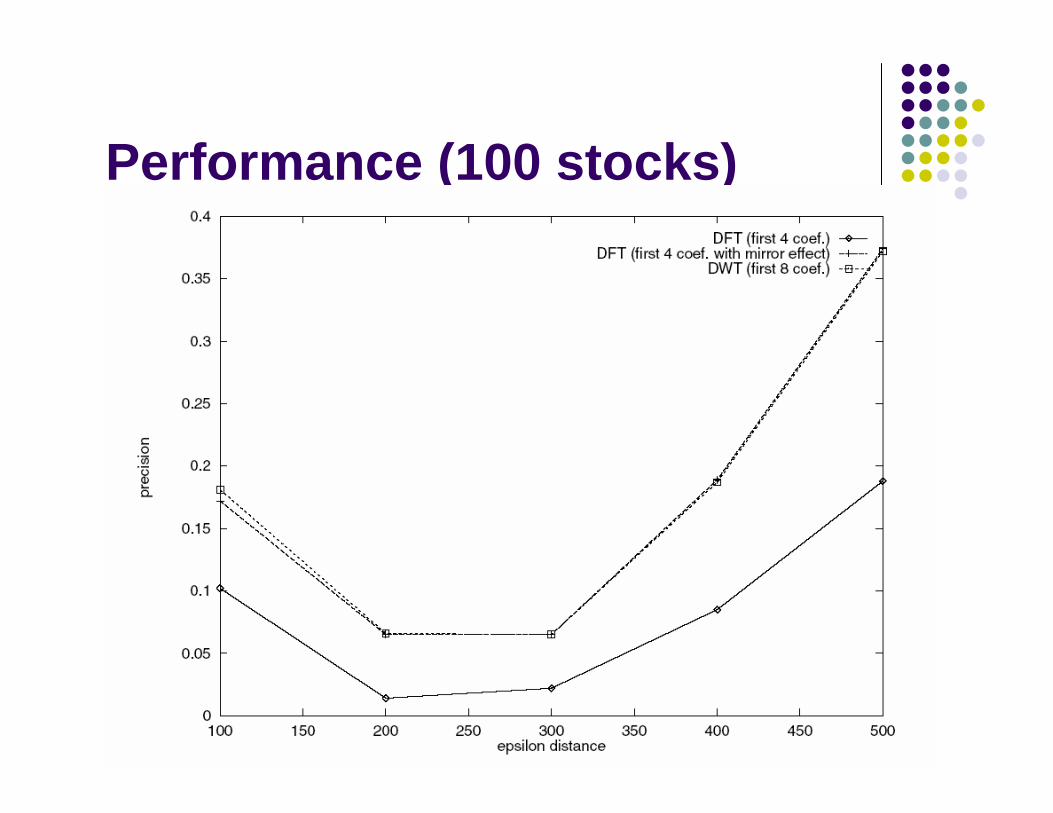
Performance (100 stocks)
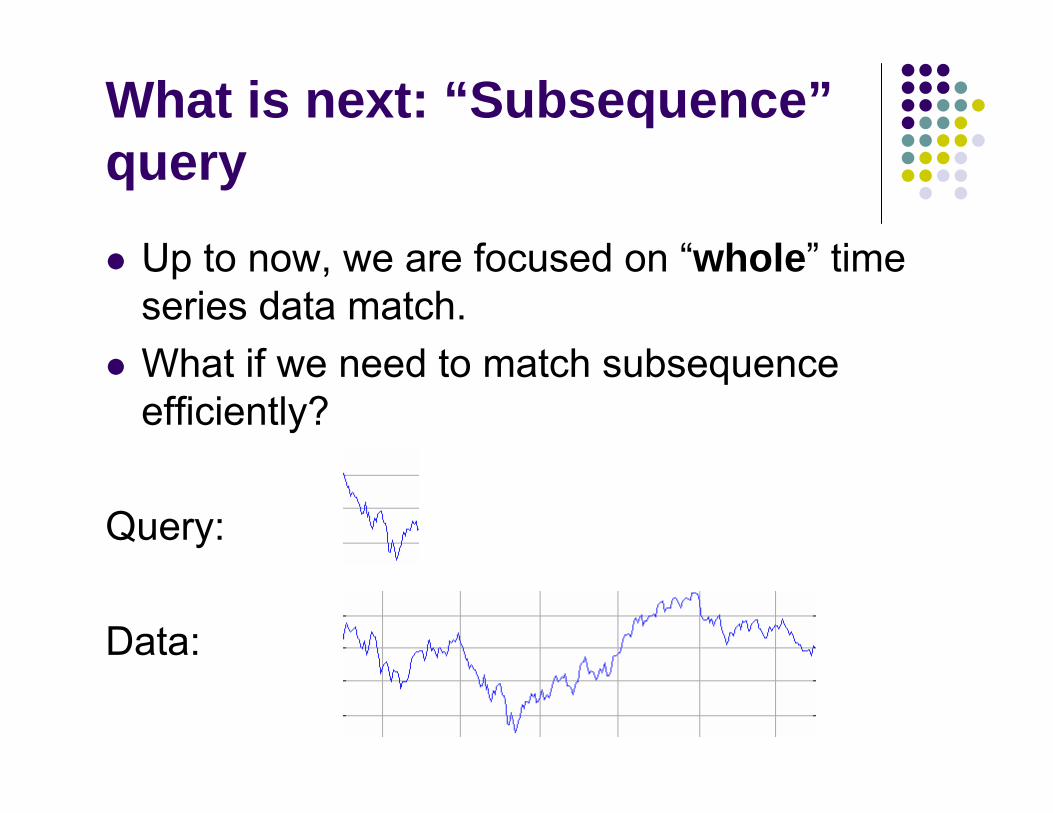
What is next: “Subsequence”query
Up to now, we are focused on “whole” time series data match.What if we need to match subsequence efficiently?
Query:
Data:
Naïve method
Assume query length fixed at ωUsing a sliding window with length ω, slide through the data.Insert all possible data points into the index (using F-index)Could be twice as slow as “sequential scan”

ST-index
Observation: Successive sliding window tend to generate similar coefficientsMBR: Minimum Bounding (hyper) Rectangle
How about “arbitrary” length time series query?
Two basic methods: (Assume dataset is indexed with window length ω)
Prefix searchSimply use the first ω of the query to do the searchMultipiece searchIf |q| >= kω, split q into k pieces, and search DB with ε/(k1/2), join the results.

Multi-resolution index
Base-2 MR index structureTake ω as base unit, build index for each window size of 2iω.Basic algorithm: Longest Prefix Search (LPS)Eg: if query length = 19ω
use 16ω as the prefix to do search.
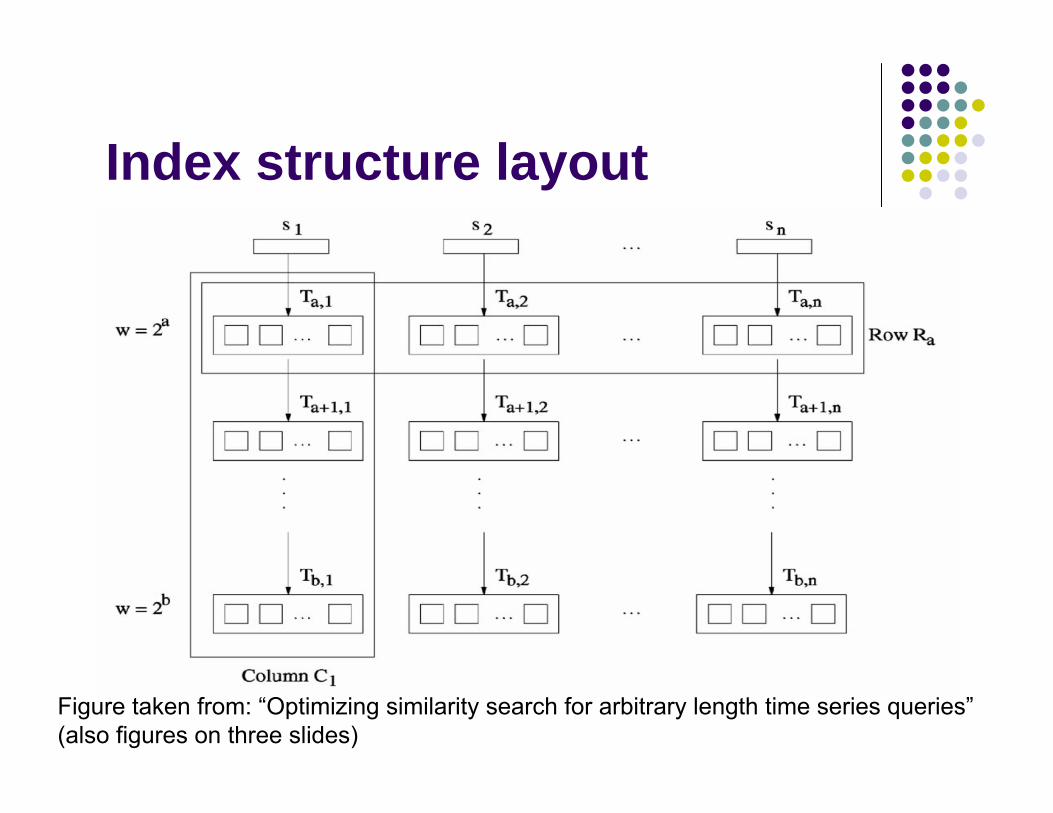
Index structure layout
Figure taken from: “Optimizing similarity search for arbitrary length time series queries”(also figures on three slides)

Improved algorithm
Split q into q1q2…qt, where |qi|= 2Ci
Eg: Given |q| = 208 = 16 + 32 + 128
q1 q2 q3
16 32 128
Given ε = 0.6, query example shown in the next slide


Performance on 556 stocks (again)

Summary
Harr DWT and DFT performs similar in feature extraction for stock data.Start monitor stock now! (All of these papers use stock data + synthetic data)Time series data is hard to optimize for similarity search. All these paper are focused on “no false dismissal”, approximation might help. (Some research done.)
Related papersTamer Kahveci and Ambuj K. Singh. Optimizing Similarity Search for Arbitrary Length Time Series QueriesR. Agrawal, C. Faloutsos, and A. Swami, Efficient Similarity Search in Sequence Databases. K.-P. Chan and A.W.-C. Fu, Efficient Time Series Matching by Wavelets.C Faloutsos, M Ranganathan, Y Manolopoulos, Fast subsequence matching in time-series databasesD. Rafiei and A. Mendelzon, Efficient Retrieval of Similar Time Sequences using DFTYL Wu, D Agrawal, A Abbadi A comparison of DFT and DWT based similarity search in Time-series Databases

Orthonormal transform
Matrix Ο is known as orthonormal if it satisfy the orthonormality property:
From: http://www.math.iitb.ac.in/~suneel/final_report/node15.html


