Page 1
Simple Noninvasive Systems Predict long-term Outcome
of Patients With NAFLDAngulo P, Bugianesi E, Bjornsson ES, Charatcharoenwitthaya
P, Mills PR, Barrera F, Haflidadottir S, Day CP, George J
Page 2
NAFLD
• Prevalence 20-30% in Europe• 2nd - 4th most common
indication for transplantation in the US
Page 3
Predictive value of scoring systemsfor NAFLD
<1% progression to cirrhosis 7-11% progression to cirrhosis
Page 4
Scoring systems for fibrosis in NAFLD
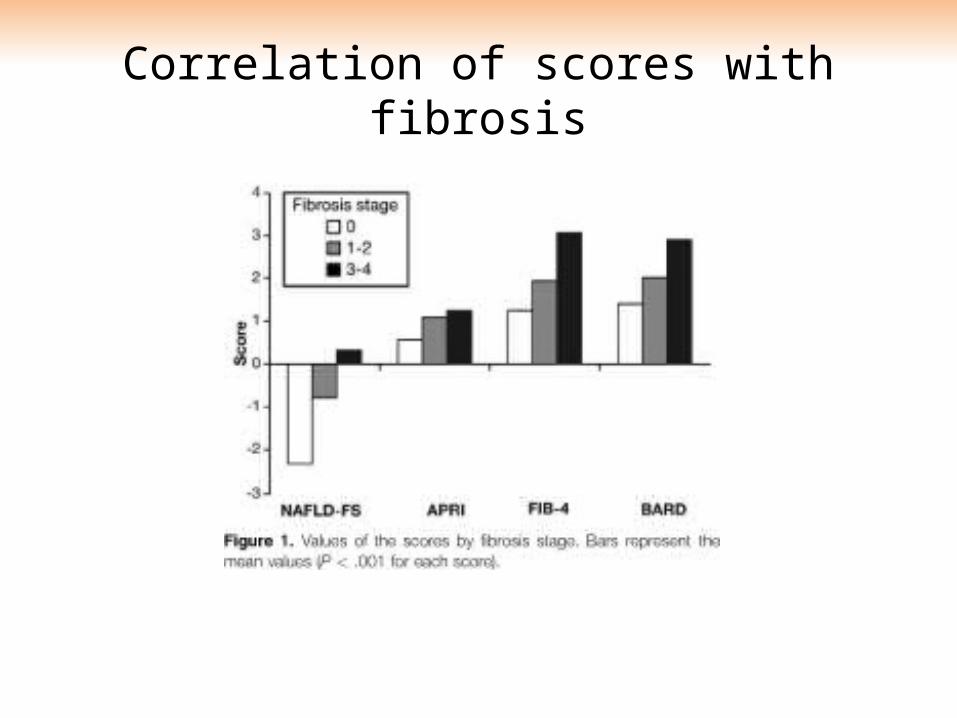
• NAFLD fibrosis score• APRI-Score• FIB-4 Score• BARD Score
Page 5
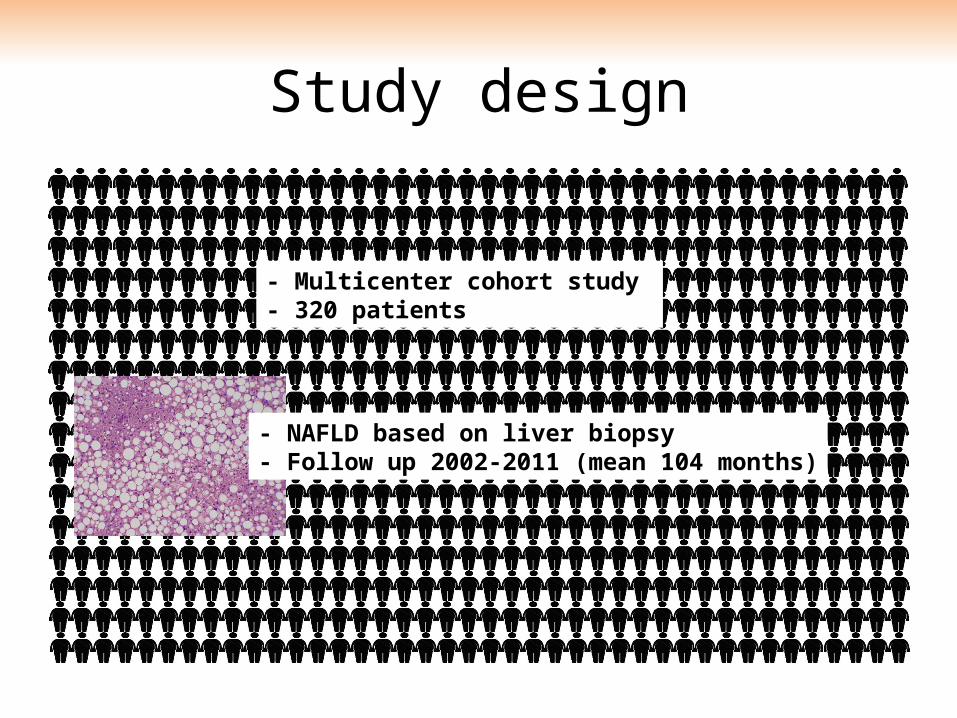
Study design
- NAFLD based on liver biopsy - Follow up 2002-2011 (mean 104 months)
- Multicenter cohort study - 320 patients
Page 6
Correlation of scores with fibrosis
Page 7
Liver-related events
Outcome
Death/Tx
Cardiovasc.; 13
Cirrhosis; 10Transplant.; 5
Non-liver cancer; 11
Other; 2
Ascites; 17
Varices; 20
Portosys. En-zephalopathy; 15
SBP; 2
HCC; 4Hepatopulm syndrome; 1 Hepatorenal syndrome; 1
Page 8
Assignment of patients to risk groups
• NAFLD fibrosis score– age, BMI, diabetes, AST/ALT, platelets, albumin
• APRI– AST, platelets
• FIB-4– age, AST, ALT, platelets
• BARD– BMI, AST/ALT, diabetes
Low intermediate high
According to pre-described cut-off values
Page 9
Correlation outcome- risk groups
Liver-related events
Low intermediate high
1,6% (2/125) 10,4% (12/115) 42% (29/69) NAFLD fibrosis score
BARD-Score 1,7% (2/119) 19,3% (23/119) 25,4% (18/71)
APRI-Score 1,1% (1/90) 13% (21/162) 36,8% (21/57)
FIB-4 Score 2,7% (3/111) 3,6% (4/112) 41,9% (36/86)
Page 10
Death/Tx
Correlation outcome- risk groupsLow intermediate high
4% (5/125) 16,7% (20/120) 21,3% (16/75) NAFLD fibrosis score
BARD-Score 4,2% 16,9% 19,5%
APRI-Score 9,7% 10% 25%
FIB-4 Score 5,4% 12% 22,8%
Page 11
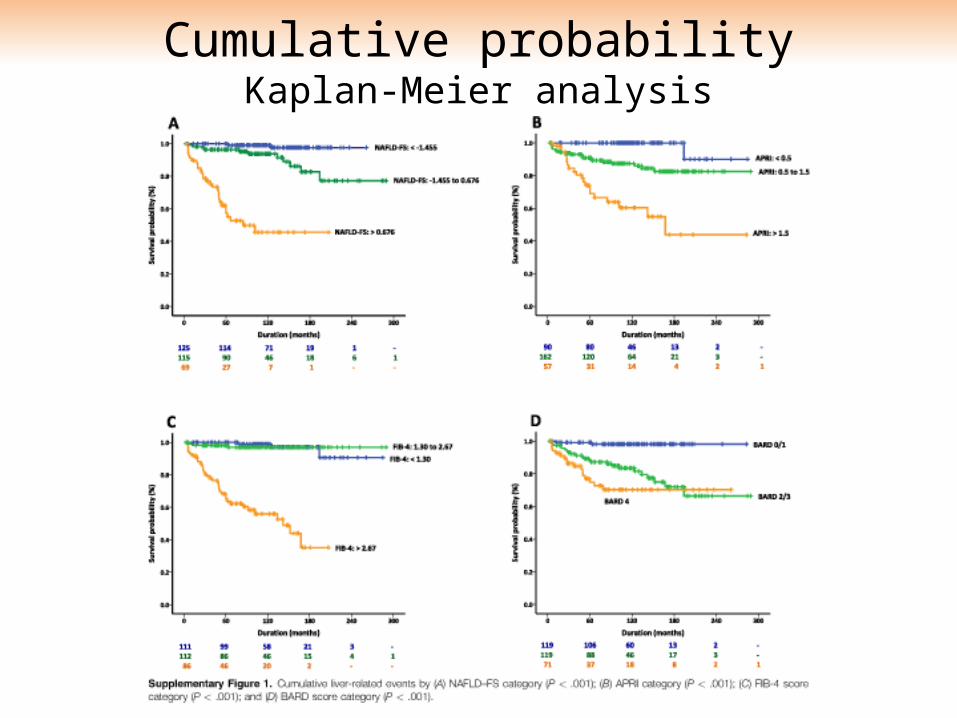
Cumulative probabilityKaplan-Meier analysis
Page 12
Cumulative probabilityKaplan-Meier analysis
Page 13
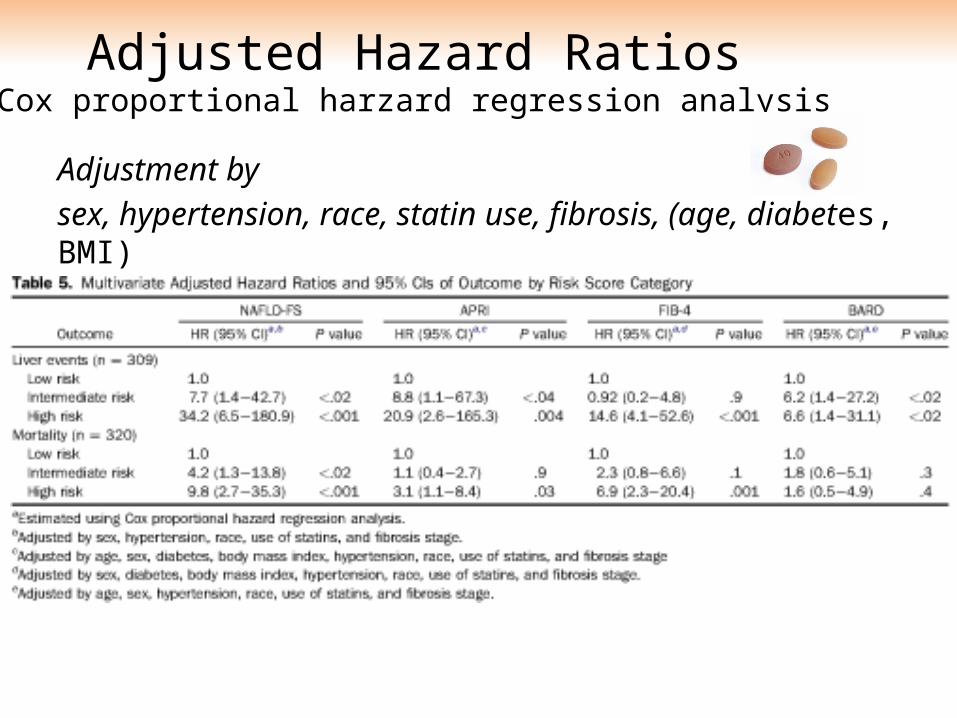
Adjusted Hazard RatiosCox proportional harzard regression analysis
Adjustment by sex, hypertension, race, statin use, fibrosis, (age, diabetes, BMI)
Page 14
Adjusted Hazard Ratios
Risk for Liver-
events
NAFLD FS 17,734,2
Low intermediate high
BARD16,26,6
APRI18,820,9
FIB-410,9214,6
Risk for Death/
Tx
14,29,8
1 1,81,6
1 1,13,2
1 2,36,9
- Confidence intervals not shown
Page 15
Study design evaluation
• Large population• Long follow up• Diagnosis by
biopsy• Adjustment of
other risk factors
• Selection bias• No standardized
monitoring• No standardized
treatment• Large CI• Likeliness of
developping cirrhosis?