Quantification of structural seismic performance based on collapse capacity under extreme eventsprovides a rational and powerful framework for evaluating existing buildings and designing new ones.Recently, the Applied Technology Council, under the direction of the Federal Emergency ManagementAgency (FEMA), published the FEMA P695 document [1], which describes a rational methodology forquantifying seismic design parameters based on predetermined structural collapse safety undermaximum considered earthquake (MCE) loading. The FEMA P695 methodology requires numerous,and computationally demanding, nonlinear time history dynamic analyses of several archetype buildingmodels, up to their collapse limit under an ensemble of 44 far-field ground motions initially scaled tomaximum considered earthquake (MCE) level. Many recent studies have focused on exploringsimplified procedures to predict seismic collapse capacity of structures. A series of studies focused onthe assessment of the dynamic instability of single-degree-of-freedom (SDOF) systems due to thecombined action of second order (P�Δ) effects and degrading components [2–5]. Miranda and Akkar[6] studied lateral strengths required to avoid dynamic instability of bilinear SDOF systems withnegative post-yield stiffness. The results showed that the lateral strength required to avoid collapseincreases as the post-yield descending branch of the force–deformation relationship is steeper. Adamet al. [7] proposed a procedure that considers P�Δ effects in non-degrading multi-degrees-of-freedom(MDOF) structures through an equivalent SDOF system with properties defined on the basis of theresults from a pushover analysis. Recently, De Luca et al. [8] investigated an array of combinations ofdifferent yielding plateau levels and elastic secant values in search of the optimal bilinear fit to 12
*Correspondence to: Andre Filiatrault, Department of Civil, Structural, and Environmental Engineering, University atBuffalo, Buffalo, NY 14260, USA.†E-mail: [email protected]
generalized highly nonlinear force-displacement backbone curves for the purpose of seismic responseprediction. The initial stiffness was set at 10% or 60% of the nominal yield strength combined with twoyield plateau levels set at 80% (L) or 100% (H) of the peak shear strength, respectively (Figure 1). Theresults showed that the bilinear fit with the same elastic stiffness and peak shear strength of the originalforce-displacement backbone curve (10%H) can be an unbiased and robust alternative to the originalcurve, at least up to the point where the structure loses approximately 20% of its maximum strength.
In addition, several studies have aimed at predicting the collapse capacity of buildings from nonlinearstatic (pushover) analysis. Vamvatsikos and Cornell [9] developed the SPO2IDA software that convertsa first-mode dominated static pushover curve into 16th-percentile, 50th-percentile, and 84th-percentileincremental dynamic analysis (IDA) curves. The tool is based on equating the elastic segment of thenormalized pushover curve with the elastic fractile IDA region. The curve is then characterized bythe post-yield hardening ratio, the end-of-hardening ductility, the slope of the post-capping branch, theresidual strength, and the ultimate ductility branch. The tool then uses the nonlinear time historydynamic analysis results of numerous SDOF oscillators with various quadri-linear backbone curves andpinching hysteretic behavior, all subjected to the same 30-ground motion records. Han et al. [10] used atrilinear fit of a modal pushover analysis to estimate the collapse fragility curve based on the empiricalequations of collapse strength ratio for strength-limited bilinear SDOF systems. Shafei et al. [11] alsointroduced a pushover-based approach, which uses generic MDOF systems and best-fitted first-orderregression models to predict the collapse capacity of buildings. The proposed procedure is differentfrom the aforementioned studies in which an equivalent SDOF system was utilized to estimate thecollapse capacity. Adam and Jäger [12] assessed the earthquake induced sidesway collapse of inelasticnondeteriorating moment-resisting frame structures vulnerable to the destabilizing effect of gravityloads due to P�Δ effect during a seismic event. The proposed collapse capacity spectrum methodologyrequires double nonlinear static pushover analyses with and without gravity loads to obtain globalhardening and post-yielding stiffness ratios. Recently, Peruš et al. [13] introduced an expandableWeb-based methodology for the prediction of approximate IDA curves of RC structures, whichrequires seven parameters, where five of them describe the idealized pushover curve.
In this paper, a simplified procedure is developed to predict the sidesway collapse margin ratios (CMR),as defined by the FEMA P695 methodology. The procedure is simpler than the approaches describedpreviously because only the median sidesway collapse capacity is required by the FEMA P695methodology as opposed to the entire collapse fragility curve. The proposed procedure requires onlythe application of a standard pushover analysis of the building under evaluation without the need ofspecialized software, thereby making the application of the FEMA P695 methodology lesscomputationally demanding and more user friendly. The proposed procedure is based on replacing aMDOF structural system by a fictitious nonlinear SDOF system characterized by a bilinear relationshipbetween lateral force and roof displacement obtained from pushover analysis. The collapse levelspectral acceleration associated with the resulting nonlinear SDOF system is then quantified by utilizingthe developed parameters through a large database of SDOF responses obtained from nonlinear timehistory dynamic analyses. The procedure is outlined with simple steps, and its effectiveness isdemonstrated by several application examples.
0 0.1 0.2 0.3 0.4 0.5 0.6 0.70
0.2
0.4
0.6
0.8
1.0
Displacement (m)
Nor
mal
ized
For
ce
Exact10%H10%L60%H60%L
Figure 1. Generalized elastic-hardening-negative capacity curve and its corresponding fits (after [8]).
Simplified methods of analysis, for which equivalent SDOF systems are used as a proxy for estimatingpeak displacements of nonlinear fixed base and base isolated structural systems, have been widely usedin seismic design. For example, such procedures were adopted by the American Society of CivilEngineers 7 (ASCE7) standard [14] and the National Earthquake Hazards Reduction Program [15]and American Association of State Highway and Transportation Officials [16] provisions. Theprocedure proposed in this paper is built upon the same concept to estimate the sidesway collapsecapacity of nonlinear building structures.
2.1. Nonlinear response database of single-degree-of-freedom (SDOF) oscillators
Nonlinear time history dynamic analyses are first performed on a wide range of SDOF oscillators witha bilinear force-displacement relationship characterized by a linear segment with initial stiffness (Kel),followed by a post-yield perfectly plastic segment with constant yield force (Fy) without hardening orcyclic deterioration. Figure 2 illustrates the force-displacement relationship of the analyzed systemsand identifies the pertinent key parameters. The dynamic response of each SDOF system is obtainedin terms of its elastic period of vibration (Tel), and its yield reduction factor (Ry), determined as follows:
Tel ¼ 2πffiffiffiffiffiffiffim
Kel
r(1)
Ry ¼ SMT
Ay(2)
where m is the mass of the oscillator (normalized herein to1kg), SMT is the MCE level elastic spectralacceleration at a period Tel, and critical damping ratio of 5% and Ay represents the yield pseudo-acceleration, defined as:
Ay ¼ Fy
m(3)
Elastic periods (Tel) ranging from 0.1 to 4.0 s at 0.1 s increments were selected for the analyses,thereby, encompassing the fundamental periods of vibration of a wide range of building structures.Furthermore, a range of Ry values between 1 and 10 with an increment of 0.5 was considered. Allthe nonlinear SDOF systems considered in this study were assumed to have an inherent equivalentviscous damping ratio of 5% of critical to be consistent with common seismic design assumptions.
All SDOF systems described previously were subjected to the set of 44 far-field ground motionsadopted by the FEMA P695 methodology at various intensities. The selection of the historical
0 1 2 30
0.5
1
Δ/Δy
F/F
y
Kel
Figure 2. Force-displacement characteristics of bilinear SDOF system with target ductility of 3.
SIMPLIFIED SEISMIC SIDESWAY COLLAPSE ANALYSIS OF FRAME BUILDINGS
records for the FEMA P695 far-field ensemble was based on a number of criteria related to sourcemagnitude, source type, site condition, site-source, amplitudes, number of records per event, andstrong-motion instrument capability. The set of ground motions used in this study was firstnormalized and scaled to the MCE level spectral acceleration at a period Tel (SMT) consistent witha seismic design category (SDC) Dmax per ASCE7 and according to the FEMA P695methodology. Normalization by peak ground velocity is a simple way to remove unwarrantedvariability between records due to inherent differences in event magnitude, distance to source,source type, and site conditions, while still maintaining the inherent variability (i.e., record-to-record) [1]. The amplitudes of the ground motions were then expressed for each SDOF system byan intensity factor (I) defined as
I ¼ SaSMT
(4)
where Sa is the 5% damped median elastic spectral acceleration at a period Tel. Nonlinear time historydynamic analyses of each SDOF system were performed for intensity factors ranging from 0.1 to 12at increments of 0.1. The intensity factor of 1.0 represents the scaled records at the MCE level ofSDC Dmax. Thus, a total of 40(Tel) × 19(Ry) × 120(I) × 44(records) = 4 million analyses wereperformed using clusters taking advantage of high performance computing concept to generate arobust database of peak displacement seismic responses of nonlinear SDOF systems for various seismicintensities. Although SDC Dmax is used to define the MCE spectral accelerations, the results of thisstudy can be extended to other seismic design categories by appropriately scaling the denominator ofEquation 4.
For each considered SDOF system with known Tel and Ry, a family of fragility curves, giving theprobability of exceeding a certain target peak displacement (ΔT), can be constructed. Accordingly,the probability of exceeding a given intensity factor is obtained by counting the number of recordsthat cause the system to exceed ΔT and dividing this number by the total number of records (44).The target peak displacement can also be expressed in terms of a target ductility ratio (μT) as follows:
μT ¼ ΔT
Δy(5)
where Δy is the yield displacement. For each SDOF oscillator under consideration, the intensity atwhich half of the records cause the system to exceed the considered target ductility ratio is definedas the median exceedance intensity (Imed). As shown in Figure 3, significant scatter is observed for
01
23
4
24
68
100
2
4
6
8
10
12
Tel (s)Ry
I med
μT
= 3
μT
= 7
μT
= 11
μT
= 15
μT
= 19
Figure 3. Median exceedance intensity (Imed) for selected studied systems.
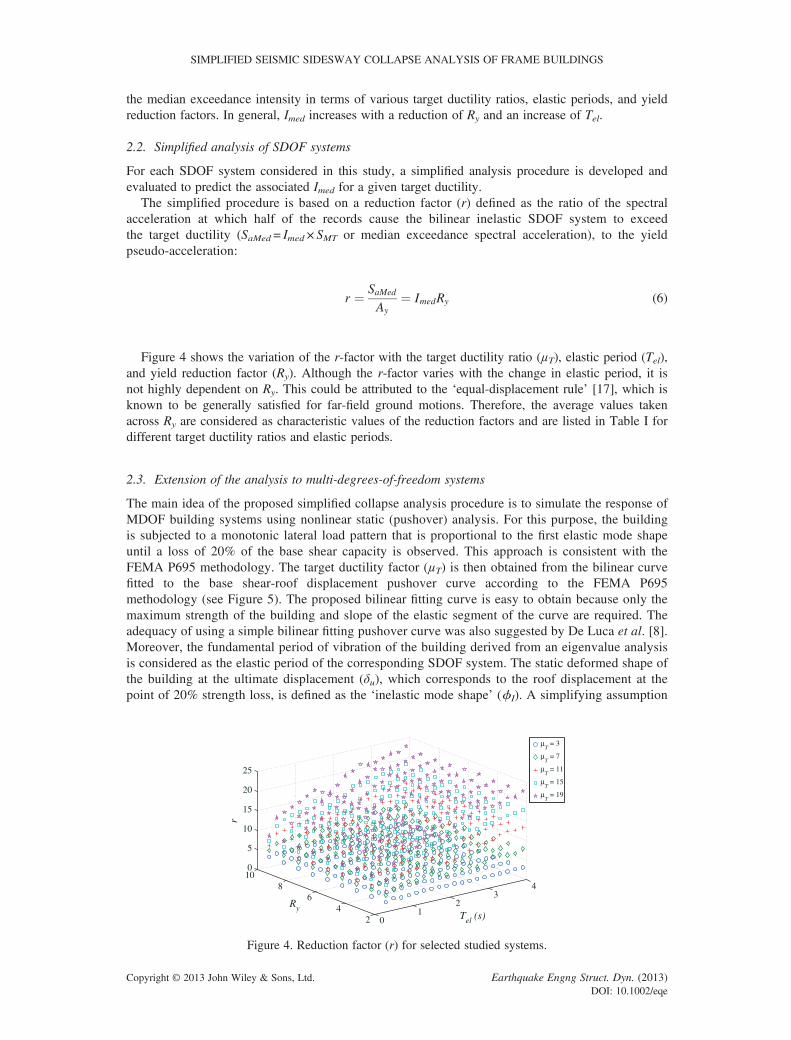
the median exceedance intensity in terms of various target ductility ratios, elastic periods, and yieldreduction factors. In general, Imed increases with a reduction of Ry and an increase of Tel.
2.2. Simplified analysis of SDOF systems
For each SDOF system considered in this study, a simplified analysis procedure is developed andevaluated to predict the associated Imed for a given target ductility.
The simplified procedure is based on a reduction factor (r) defined as the ratio of the spectralacceleration at which half of the records cause the bilinear inelastic SDOF system to exceedthe target ductility (SaMed = Imed × SMT or median exceedance spectral acceleration), to the yieldpseudo-acceleration:
r ¼ SaMed
Ay¼ ImedRy (6)
Figure 4 shows the variation of the r-factor with the target ductility ratio (μT), elastic period (Tel),and yield reduction factor (Ry). Although the r-factor varies with the change in elastic period, it isnot highly dependent on Ry. This could be attributed to the ‘equal-displacement rule’ [17], which isknown to be generally satisfied for far-field ground motions. Therefore, the average values takenacross Ry are considered as characteristic values of the reduction factors and are listed in Table I fordifferent target ductility ratios and elastic periods.
2.3. Extension of the analysis to multi-degrees-of-freedom systems
The main idea of the proposed simplified collapse analysis procedure is to simulate the response ofMDOF building systems using nonlinear static (pushover) analysis. For this purpose, the buildingis subjected to a monotonic lateral load pattern that is proportional to the first elastic mode shapeuntil a loss of 20% of the base shear capacity is observed. This approach is consistent with theFEMA P695 methodology. The target ductility factor (μT) is then obtained from the bilinear curvefitted to the base shear-roof displacement pushover curve according to the FEMA P695methodology (see Figure 5). The proposed bilinear fitting curve is easy to obtain because only themaximum strength of the building and slope of the elastic segment of the curve are required. Theadequacy of using a simple bilinear fitting pushover curve was also suggested by De Luca et al. [8].Moreover, the fundamental period of vibration of the building derived from an eigenvalue analysisis considered as the elastic period of the corresponding SDOF system. The static deformed shape ofthe building at the ultimate displacement (δu), which corresponds to the roof displacement at thepoint of 20% strength loss, is defined as the ‘inelastic mode shape’ (ϕI). A simplifying assumption
01
23
4
24
68
100
5
10
15
20
25
Tel (s)Ry
r
μT
= 3
μT
= 7
μT
= 11
μT
= 15
μT
= 19
Figure 4. Reduction factor (r) for selected studied systems.
SIMPLIFIED SEISMIC SIDESWAY COLLAPSE ANALYSIS OF FRAME BUILDINGS
is made herein by considering the structure near collapse to vibrate according to its inelastic modeshape pattern. Therefore, an inelastic mode participation factor (ΓI) can be defined as
ΓI ¼ ϕITM 1f g
ϕITMϕI
(7)
where {1} is the unity vector and M is the mass matrix. The yield pseudo-acceleration for MDOFsystem can be obtained as follows:
Ay ¼ 4π2δyTel
2Γ IϕI;r¼ 4π2δu
μTTel2ΓIϕI;r
(8)
where ϕI,r is the roof component of the inelastic mode shape, and δu is the ultimate roof displacement,as defined in Figure 5.
The reduction factor (r) can be obtained from Table I and is defined for MDOF systems as the ratioof the median value of the 5%-damped spectral acceleration at the fundamental period (Tel) of thebuilding causing the roof of the building to reach δu to the yield pseudo-acceleration (Ay). Thus, thereduction factor is defined as,
r ¼ SCTAy
(9)
The FEMA P695 methodology also defines SCT as the product of the CMR and the MCE level,5%-damped, spectral acceleration at the fundamental period of the building (Tel), for the assumedSDC (SMT):
SCT ¼ CMR� SMT (10)
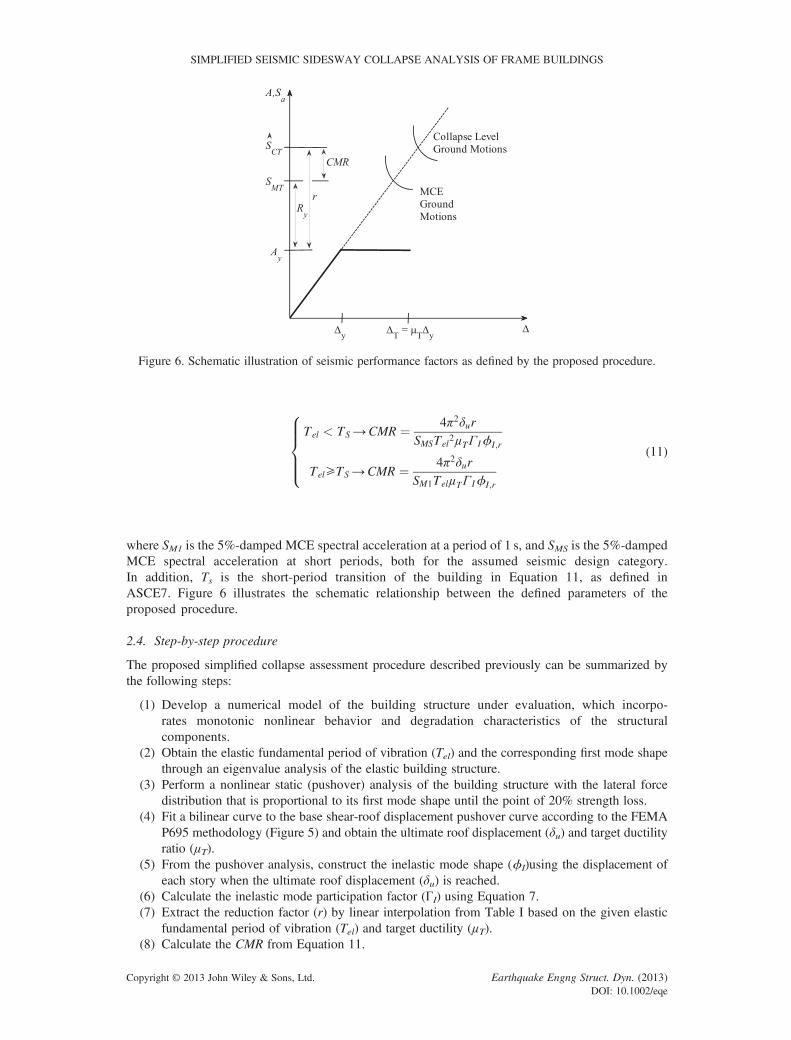
Using the MCE spectral shape of ASCE7 and substituting Equations 8 and 9 into Equation 10, theCMR can be expressed as
where SM1 is the 5%-damped MCE spectral acceleration at a period of 1 s, and SMS is the 5%-dampedMCE spectral acceleration at short periods, both for the assumed seismic design category.In addition, Ts is the short-period transition of the building in Equation 11, as defined inASCE7. Figure 6 illustrates the schematic relationship between the defined parameters of theproposed procedure.
2.4. Step-by-step procedure
The proposed simplified collapse assessment procedure described previously can be summarized bythe following steps:
(1) Develop a numerical model of the building structure under evaluation, which incorpo-rates monotonic nonlinear behavior and degradation characteristics of the structuralcomponents.
(2) Obtain the elastic fundamental period of vibration (Tel) and the corresponding first mode shapethrough an eigenvalue analysis of the elastic building structure.
(3) Perform a nonlinear static (pushover) analysis of the building structure with the lateral forcedistribution that is proportional to its first mode shape until the point of 20% strength loss.
(4) Fit a bilinear curve to the base shear-roof displacement pushover curve according to the FEMAP695 methodology (Figure 5) and obtain the ultimate roof displacement (δu) and target ductilityratio (μT).
(5) From the pushover analysis, construct the inelastic mode shape (ϕI)using the displacement ofeach story when the ultimate roof displacement (δu) is reached.
(6) Calculate the inelastic mode participation factor (ΓI) using Equation 7.(7) Extract the reduction factor (r) by linear interpolation from Table I based on the given elastic
fundamental period of vibration (Tel) and target ductility (μT).(8) Calculate the CMR from Equation 11.
Figure 6. Schematic illustration of seismic performance factors as defined by the proposed procedure.
SIMPLIFIED SEISMIC SIDESWAY COLLAPSE ANALYSIS OF FRAME BUILDINGS
To assess the validity and robustness of the proposed procedure, the collapse capacities of threebuilding models (three-story, six-story, and nine-story) that were designed for the SAC SteelProject [18] are evaluated. The buildings are idealized as two dimensional structures. Thestructural sections of the building models meet post-Northridge seismic design requirements forLos Angeles, California. These buildings were chosen because they also served as benchmarkstructures for the SAC studies and, thus, provide a direct means for comparing the findings of theproposed procedure with those available in the literature. Detailed information about theconsidered buildings can be found in [19–21].
The Open Systems for Earthquake Engineering Simulation [22] software was used to carry outthe structural analyses. To simulate P�Δ effects, a leaning column, made of axially rigid beamspinned at both ends, was placed parallel to the frame. This leaning column was loaded with avertical gravity load at each floor level and was constrained to the floor translationaldisplacements. Rigid-end offsets were specified at the end of the frame members to account forthe actual size of the members at the beam-column joints. The panel zones of the beam-columnconnections were assumed to be stiff and strong enough to avoid any panel shear deformationand yielding under seismic loading. This assumption represents the most critical condition forthe inelastic curvature demand on the welded beam-to-column joints, as all the hysteretic energymust be dissipated only through plastic hinging in the beams and the columns. InherentRayleigh damping of 5% of critical was assigned on the basis of the first and third elasticmodes of vibration of the structure.
Inelastic materials response was modeled by concentrated plasticity through nonlinear fiberhinges at both ends of the framing members. The hysteretic behavior of the fiber hingeswas governed by a modified version of the Ibarra–Krawinkler (IK) deterioration model [23].The phenomenological IK model (Figure 7) is based on a backbone curve that defines aboundary for the behavior of a structural component and establishes strength anddeformation bounds, as well as a set of rules that define the basic characteristics of thehysteretic behavior between these bounds. Cyclic deterioration is quantified using adeterioration parameter that is based on a reference energy dissipation capacity of thecomponent. Parameters of this model were determined by multivariate regression analysis ofexperimental results from over 300 steel specimens. The IK deterioration model does notaccount for the effect of a variable axial force on the bending deterioration parameters. Theuse of fiber elements, however, results in reductions of the bending strength of the frameelements due to the variable axial-moment interactions. This approach results in smooth backbonecurves for flexural members, similar to that observed in experiments, but it increases also thecomputational overhead.
Figure 7. Modified Ibarra–Krawinkler deterioration model (from Lignos et al. [30]).
Force-based beam with hinges elements [22] incorporating the modified Gauss–Radau plastichinge integration method developed by Scott and Fenves [24] were used. The implementationdivides the element into two hinges at the ends with one integration point per hinge and alinear-elastic region in the middle with two integration points. There are advantages to thisformulation over the standard force-based beam-column elements as addressed by Scott and Fenves[24] and Scott and Ryan [25]. This formulation ensures a unique relationship between the resultingmoment-rotation hardening ratio and the parameters defining the plastic hinge length and themoment-curvature hardening ratio [25]. The fiber hinge sections were composed of the Bilinmaterial [22] that simulates the modified IK deterioration model [23]. Plastic hinge lengths wereset equal to the depth of the sections as suggested by Section C8.7 of American Institute of SteelConstruction 358–10 [26]. The hinges were then calibrated individually with the multi-lineardeteriorating concentrated hysteresis model.
To assess the performance of the proposed procedure for a wide range of fundamentalperiods of the benchmark buildings, the first story height (h1) was incrementally variedwhile all the other stories height (htyp) remained unchanged. A ratio of h1/htyp from 1 to2.4 at increments of 0.1 was considered and led to a total of 45 different buildingstructures to be evaluated with elastic periods ranging from 0.94 to 2.96 s. Note that h1/htypis approximately 1.4 for the original six-story and nine-story buildings and 1.0 for thethree-story building. To assess the performance of the proposed procedure for short periodbuildings, the floor masses of the original three-story building were reduced from 10% to90% of their original values by increment of 10%. The elastic periods of these ninesupplemental buildings varied ranging from 0.30 to 0.89 s. To avoid a bias of the resultstoward first floor sidesway collapse, the heights of the three-story building were alsoincreased uniformly by a factor (hunif /htyp) ranging from 0.5 to 2.0 of their initial height atincrements of 0.1. This led to a total of 16 more building models with elastic periodsranging from 0.41 to 2.29 s.
The computation of the collapse capacity for each considered building is based on the set of 44records of the P695 far-field ground motions as required by the FEMA P695 methodology.Accordingly, as defined in FEMA P695, the CMR is the ratio of the median 5%-damped collapsespectral acceleration across the ground motion ensemble ( SCT ) to the corresponding 5%-dampedMCE spectral acceleration (SMT), both values taken at the fundamental period of the building. Inthis study, it is assumed that the collapse level ground motion, SCT , occurs when the structureexperiences maximum interstory drift ratios for 22 out of the 44 records exceeding the largerinterstory drift ratio associated with the ultimate roof displacement (δu) calculated from thepushover analysis.
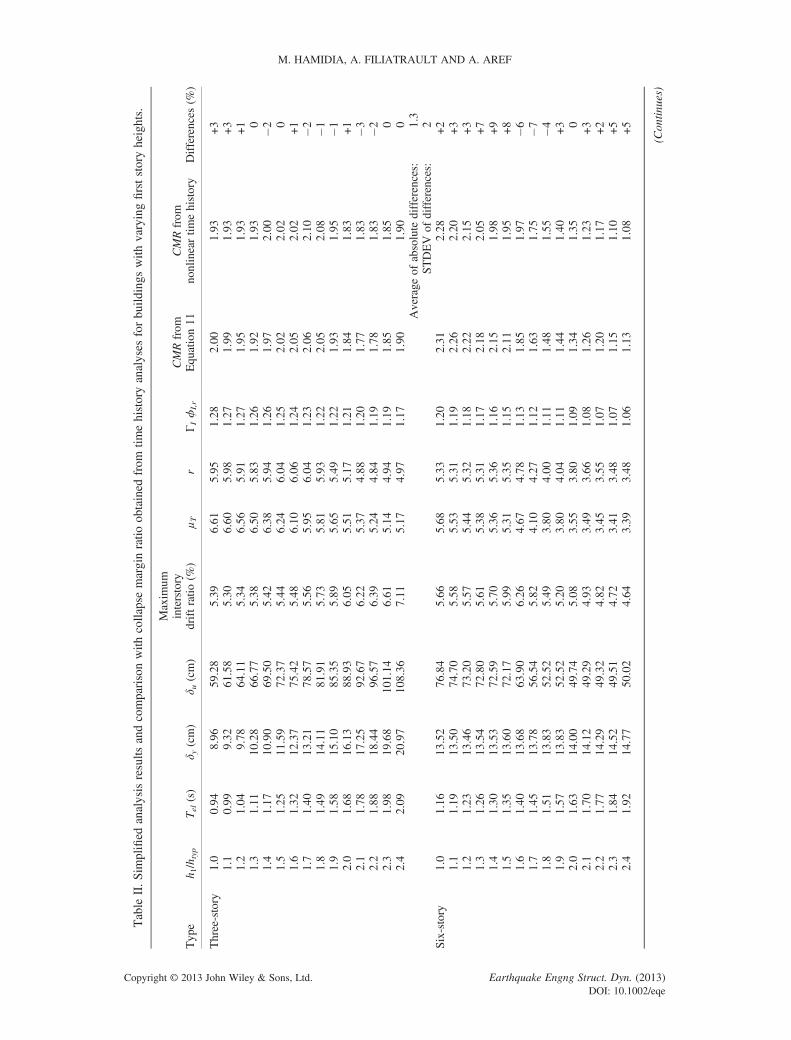
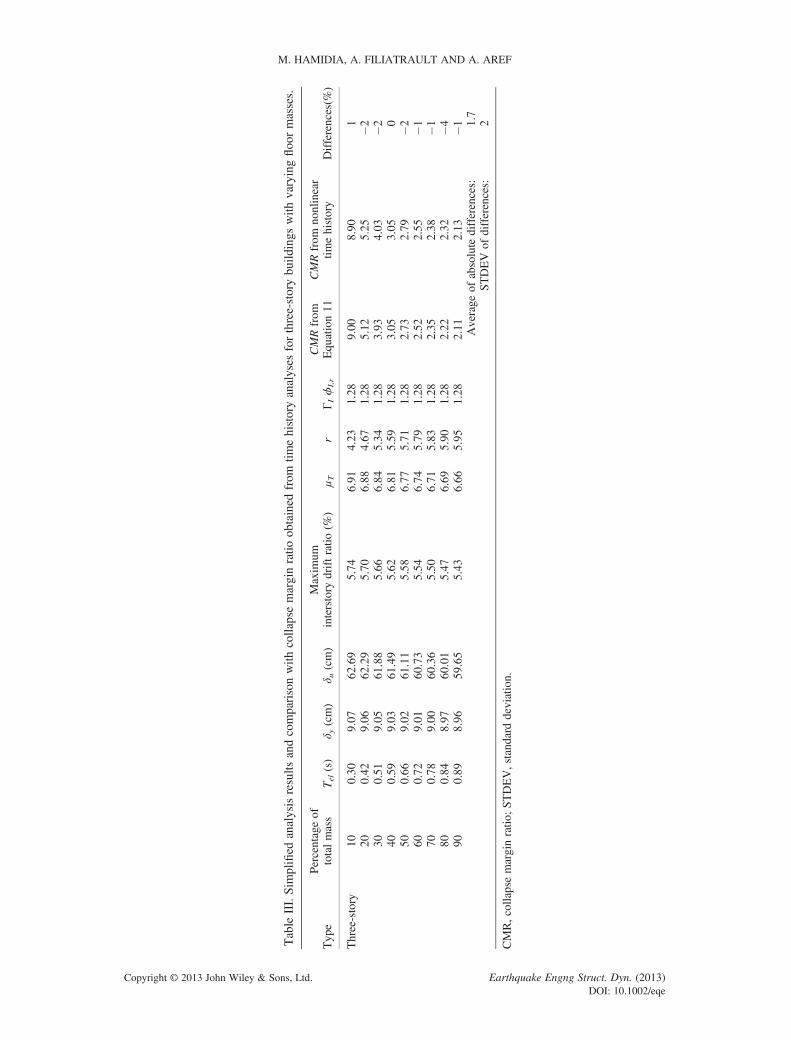
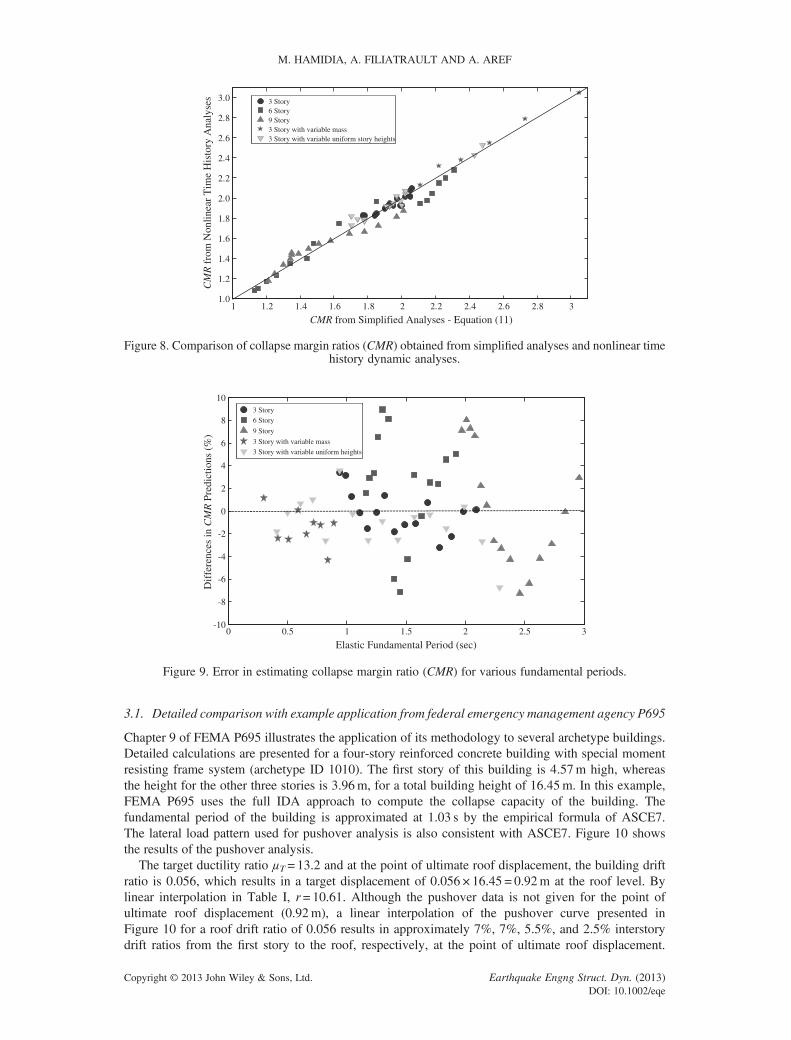
The results of the application of the proposed simplified collapse evaluation procedure to theensemble of frame building structures considered previously are summarized in Tables II, III,and IV for the buildings with varying first story heights, floor masses, and uniform storyheights, respectively. Figure 8 compares the CMR values derived from the proposed simplifiedprocedure with those obtained from nonlinear time history dynamic analyses. The predictedCMR values based on the proposed simplified procedure are in very good agreement with thoseobtained from nonlinear time history dynamic analyses but with much reduced computationaldemand. The maximum average absolute difference in CMR values between the two approaches isonly 4.5%, with a maximum standard deviation of 5% for the buildings with varying first storyheight (Table II). The corresponding values for the buildings with varying floor masses (Table III)are 1.7% and 2.0%, respectively, and for the building with varying uniform story heights(Table IV) both values are 2.0%. These results are acceptable considering that the proposedsimplified procedure alleviates the need for nonlinear time history dynamic analyses. Figure 9compares the differences in CMR values predicted by the proposed simplified procedure withthose obtained from nonlinear time history dynamic analyses as a function of the elastic period ofthe 72 building structures considered. Clearly, for the entire period range considered (0.30 to2.96 s), there is no discernible divergence in trend, which is indicative of the robustness of theproposed procedure.
SIMPLIFIED SEISMIC SIDESWAY COLLAPSE ANALYSIS OF FRAME BUILDINGS
3.1. Detailed comparison with example application from federal emergency management agency P695
Chapter 9 of FEMA P695 illustrates the application of its methodology to several archetype buildings.Detailed calculations are presented for a four-story reinforced concrete building with special momentresisting frame system (archetype ID 1010). The first story of this building is 4.57m high, whereasthe height for the other three stories is 3.96m, for a total building height of 16.45m. In this example,FEMA P695 uses the full IDA approach to compute the collapse capacity of the building. Thefundamental period of the building is approximated at 1.03 s by the empirical formula of ASCE7.The lateral load pattern used for pushover analysis is also consistent with ASCE7. Figure 10 showsthe results of the pushover analysis.
The target ductility ratio μT = 13.2 and at the point of ultimate roof displacement, the building driftratio is 0.056, which results in a target displacement of 0.056 × 16.45 = 0.92m at the roof level. Bylinear interpolation in Table I, r = 10.61. Although the pushover data is not given for the point ofultimate roof displacement (0.92m), a linear interpolation of the pushover curve presented inFigure 10 for a roof drift ratio of 0.056 results in approximately 7%, 7%, 5.5%, and 2.5% interstorydrift ratios from the first story to the roof, respectively, at the point of ultimate roof displacement.
0 0.5 1 1.5 2 2.5 3-10
-8
-6
-4
-2
0
2
4
6
8
10
Elastic Fundamental Period (sec)
Dif
fere
nces
in C
MR
Pre
dict
ions
(%
)
3 Story
6 Story
9 Story
3 Story with variable mass
3 Story with variable uniform heights
Figure 9. Error in estimating collapse margin ratio (CMR) for various fundamental periods.
1 1.2 1.4 1.6 1.8 2 2.2 2.4 2.6 2.8 31.0
1.2
1.4
1.6
1.8
2.0
2.2
2.4
2.6
2.8
3.0
CMR from Simplified Analyses - Equation (11)
CM
R f
rom
Non
linea
r T
ime
His
tory
Ana
lyse
s 3 Story6 Story9 Story3 Story with variable mass3 Story with variable uniform story heights
Figure 8. Comparison of collapse margin ratios (CMR) obtained from simplified analyses and nonlinear timehistory dynamic analyses.
Therefore, the inelastic mode shape can be approximated as
ϕI ¼
3:02
2:68
1:96
1:05
8>>><>>>:
9>>>=>>>;
(12)
From Equation 7 and considering a uniform distribution of the seismic mass along the buildingheight, ΓIφI,r= 1.23. Given the spectral acceleration at a period of 1.0 s (SM1 = 0.9 g for SDC Dmax),the CMR predicted by the proposed simplified seismic collapse analysis procedure is then obtainedfrom Equation 11 as
CMR ¼ 4π2δurSM1TelμTΓIϕI;r
¼ 4π2 � 0:92� 10:610:9� 9:81� 1:03� 13:2� 1:23
¼ 2:61 (13)
The CMR obtained from nonlinear time history analysis is 2.48 as given in FEMA P695, and thisrepresents a difference of 5% with that predicted by Equation 11, which is quite acceptable.
The median intensity measured for the roof displacement capacity of δu=0.92m is estimated at 2.60 bythe SPO2IDA software [9], as shown in Figure 11. This value correlates well with theCMR obtained fromEquation 13. The ultimate collapse capacity is also 2.87 as appeared on the flatline of the 50%-fractileIDA, close to the CMR obtained by FEMA P695.
3.2. Detailed comparison with example application from National Institute of Standard andTechnology steel frame
The National Institute of Standard and Technology (NIST) report on the evaluation of the FEMA P695methodology [27] also presents detailed calculation for a 20-story special steel moment resisting frame(archetype ID: 6RSA). Figure 12 shows the pushover results for various roof drift ratios. The targetductility ratio μT= 1.9, and the fundamental period is approximated at 3.37 s. The ultimate roof driftratio at 20% strength loss is 1.4%, which results in a target displacement of 1.13m at the roof level.Again, by linear interpolation in Table I, r= 2.16. Considering, the interpolation of the data providedin Figure 12 for roof drift ratios equal to 1.25% and 1.5%, the corresponding inelastic mode shapeΓIϕI,r= 1.3 from Equation 7. The CMR is obtained from Equation 11 as
CMR ¼ 4π2δurSM1TelμTΓIϕI;r
¼ 4π2 � 1:13� 2:160:9� 9:81� 3:37� 1:9� 1:3
¼ 1:31 (14)
The collapse margin ratio from nonlinear time history dynamic analysis is reported as 1.21 [27],which represents an 8% deviation from the predictions by Equation 11, which is quite acceptableconsidering the simplicity of the proposed procedure.
4. ADVANTAGES AND LIMITATIONS OF THE PROPOSED PROCEDURE
The proposed procedure is in accordance with the FEMA P695 requirements and requires only a smallerfraction of the computational overhead to compute CMR of archetype buildings governed by sideswayinelastic response. The procedure can be used by design professionals without the need for ancillarysoftware. The simplified procedure requires parameters only from an easy bilinear fit of a pushovercurve. Thus, it is not sensitive to post-elastic parameters that depend on the way pushover curve isidealized. The procedure is in accordance with the physics of the problem and avoids complicatedregression analysis. The derivation uses a reduction factor of the spectral acceleration that isindependent of the yield reduction factor, Ry, and is only based on the target ductility and fundamentalelastic period of the building. The inelastic mode shape introduced in the proposed procedure is a novelconcept to create a bridge between SDOF and MDOF systems with degrading components andsubjected to P�Δ effects. On the basis of the sidesway collapse assessment of 72 different buildingmodels, the proposed procedure predicts CMR with acceptable accuracies considering its simplicity.
The estimation of the seismic response parameters through a SDOF model in combination withnonlinear static (pushover) analysis has some inherent limitations [28, 29]. For example, the effect ofcyclic deterioration in strength and stiffness of structural components is not considered. The proposed
Figure 12. Pushover results for example steel building (from [27]).
procedure is aimed at estimating the CMR due to sidesway seismic collapse of frame buildingsdominated by a single mode of deformation and is unable to predict collapse modes dominated byforces and overturning moments along the height of a frame building. Prediction of complete sideswaycollapse fragility curves is also out of the scope of the proposed procedure. Furthermore, the proposedprocedure is strictly valid for the P695 far-field ground motions ensemble adopted in this study. All theprevious issues leave room for further investigation on the improvement of the proposed procedure.
5. CONCLUSIONS
The simplified procedure to evaluate the seismic collapse capacity of building structures presented in thispaper is based on the development of a robust database of nonlinear seismic responses of single-degree-of-freedom systems for various seismic intensities and uses nonlinear static (pushover) analysis without theneed for nonlinear time history dynamic analyses. The procedure was assessed using a total of 72 differentframe building structures with a wide range of fundamental periods (0.30 to 3.37 s). The collapse marginratios (CMR) predicted by the proposed simplified procedure are in very good agreement with thoseobtained by nonlinear time history dynamic analyses. The average absolute difference in CMRprediction between the two approaches was only 4.5%, with a maximum standard deviation of 5% forlong period buildings (elastic periods between 0.90 to 2.96 s). The corresponding values for short periodbuildings (elastic periods between 0.3 to 0.89 s) were 1.7% and 2.0%, respectively, while both values forbuildings with varying uniform heights were 2%. Given its inherent simplicity combined with itsconsistency with current methodologies used in seismic design practice, the proposed procedurerepresents a useful tool for practicing engineers and researchers interested in evaluating the safety ofstructures against sidesway collapse with minimal computational overhead. Noteworthy to mention hereis that the proposed procedure represents only an approximate approach for a quick yet accurateestimation of the collapse capacity of frame buildings and it cannot replace more rigorous nonlinear timehistory dynamic analyses.
ACKNOWLEDGEMENTS
The research described in this paper was supported by the Multidisciplinary Center for EarthquakeEngineering Research (MCEER). Support from the Center for Computational Research (CCR) staff mem-bers at the University at Buffalo is also gratefully acknowledged. The authors would like to thank the tworeviewers of the original manuscript for their valuable comments. The opinions, findings, conclusions, orrecommendations expressed in this paper are those of the authors.
REFERENCES
1. Federal Emergency Management Agency (FEMA). Quantification of building seismic performance factors, FEMAP695. Washington, D.C., 2009.
2. Takizawa H, Jennings PC. Collapse of a model for ductile reinforced concrete frames under extreme earthquakemotions. Earthquake Engineering and Structural Dynamics 1980; 8(2):117–144.
3. Bernal D. Amplification factors for inelastic P-Δ effects in earthquake analysis. Earthquake Engineering and StructuralDynamics 1987; 15(5):635–651.
4. MacRae GA. P-Δ effects on single-degree-of-freedom structures in earthquakes. Earthquake Spectra 1994;10(3):539–568.
5. Williamson EB. Evaluation of damage and P-Δ effects for systems under earthquake excitation. Journal of StructuralEngineering 2003; 129(8):1036–1046.
6. Miranda E, Akkar D. Dynamic instability of simple structural systems. Journal of Structural Engineering 2003;129(12):1722–1726.
7. Adam C, Ibarra LF, Krawinkler H. Evaluation of P-delta effects in non-deteriorating MDOF structures fromequivalent SDOF systems. Proceedings, 13th World Conf. on Earthquake Engineering, Vancouver, B.C., Canada,Paper No. 3407, 2004.
8. De Luca F, Vamvatsikos D, Iervolino I. Near-optimal piecewise linear fits of static pushover capacity curves forequivalent SDOF analysis. Earthquake Engineering and Structural Dynamics 2013; 42(4):523–543.
9. Vamvatsikos D, Cornell CA. Direct estimation of the seismic demand and capacity of oscillators with multi-linearstatic pushovers through IDA. Earthquake Engineering and Structural Dynamics 2006; 35(9):1097–1117.
10. Han SW, Moon K-H, Chopra AK. Application of MPA to estimate probability of collapse of structures. EarthquakeEngineering and Structural Dynamics 2010; 39(11):1259–1278.
SIMPLIFIED SEISMIC SIDESWAY COLLAPSE ANALYSIS OF FRAME BUILDINGS
11. Shafei B, Zareian F, Lignos DG. A simplified method for collapse capacity assessment of moment-resisting frameand shear wall structural systems. Engineering Structures 2011; 33:1107–1116.
12. Adam C, Jäger C. Simplified collapse capacity assessment of earthquake excited regular frame structures vulnerableto P-delta. Engineering Structures 2012; 44:159–173.
13. Peruš I, Klinc R, Dolenc M, Dolšek M. A web-based methodology for the prediction of approximate IDA curves.Earthquake Engineering and Structural Dynamics 2013; 42(1):43–60.
14. American Society of Civil Engineers (ASCE). Minimum design loads of buildings and other structures, ASCE/SEI7–10, Reston, VA, 2010.
15. National Earthquake Hazard Reduction Program (NEHRP). NEHRP recommended provisions for seismic regula-tions for new buildings and other structures (FEMA 450). Building Seismic Safety Council, Washington, D.C., 2003.
16. American Association of State Highway and Transportation Officials (AASHTO). Guide specification for seismicisolation design, Washington, D.C., 2010.
18. Applied Technology Council (ATC). Proceedings of the invitational workshop on Steel Seismic Issues, Los Angeles,September, Redwood City, CA, 1994.
19. Hall JF. Parameter study of the response of moment-resisting steel frame buildings to near-source ground motions.Technical Report SAC95-05, Sacramento, CA, 1995.
20. Gupta A, Krawinkler H. Seismic demands for performance evaluation of steel moment resisting frame structures(SAC Task 5.4.3). Report no. 132. John A. Blume Earthquake Engineering Center, Stanford University: Palo Alto(CA), 1999.
21. Federal Emergency Management Agency (FEMA). Improvement of nonlinear static seismic analysis procedures,FEMA 440, Washington, D.C., 2005.
22. OpenSees. Open system for earthquake engineering simulation. Pacific Earthquake Engineering Research Center,University of California at Berkeley, Berkeley, CA, 2013.
23. Lignos DG, Krawinkler H. Deterioration modeling of steel components in support of collapse prediction of steelmoment frames under earthquake loading. Journal of Structural Engineering 2011; 137(11):1291–1302.
24. Scott MH, Fenves GL. Plastic hinge integration methods for force-based beam-column elements. Journal ofStructural Engineering 2006; 132(2):244–252.
25. Scott MH, Ryan KL. Moment-rotation behavior of force-based plastic hinge elements. Earthquake Spectra 2013;29(2):597–607.
26. American Institute of Steel Construction (AISC). Prequalified connections for special and intermediate steel momentframes for seismic applications, ANSI/AISC 358–10, Chicago, IL, 2010.
27. National Institute of Standards and Technology (NIST). Evaluation of the FEMA P-695 methodology for quantificationof building seismic performance factors (NIST GCR 10-917-8), Gaithersburg, MD, 2010.
28. Krawinkler H, Seneviratna GDPK. Pros and cons of a pushover analysis of seismic performance evaluation.Engineering Structures 1998; 20(4–6):452–464.
29. Fajfar P. A nonlinear analysis method for performance-based seismic design. Earthquake Spectra 2000; 16(3):573–592.30. Lignos DG, Krawinkler H, Whittaker A. Prediction and validation of sidesway collapse of two scale models of a
4-story steel moment frame. Earthquake Engineering and Structural Dynamics 2011; 40(7):807–825.


![Sidesway Web Buckling of Steel Beams[1]](https://static.documents.pub/doc/80x56/55cf92b2550346f57b98d6e6/sidesway-web-buckling-of-steel-beams1.jpg)


![Seismic collapse performance of special moment steel 2017]Han et al-Seismic... · Seismic collapse…](https://static.documents.pub/doc/80x56/5b8364d47f8b9adc698cfc15/seismic-collapse-performance-of-special-moment-steel-2017han-et-al-seismic.jpg)


