Proceedings of ASME Turbo Expo 2004 Power for Land, Sea, and Air
June 14-17, 2004, Vienna, Austria
GT2004-53324
ABSTRACT This report presents a validation of the design and operation of an accelerated testing facility for the study of foreign deposit layers typical to the operation of land-based gas turbines. This facility was designed to produce turbine deposits in a 4-hour test that would simulate 10,000 hours of turbine operation. This is accomplished by matching the net foreign particulate throughput of an actual gas turbine. Flow Mach number, temperature and particulate impingement angle are also matched. Validation tests were conducted to model the ingestion of foreign particulate typically found in the urban environment. The majority of this particulate is ceramic in nature and smaller than 10 microns in size, but varies up to 80 microns. Deposits were formed for flow Mach number and temperature of 0.4 and 1150degC respectively, using air plasma sprayed (APS) TBC material coupons donated from industry. Investigations over a range of impingement angles yielded samples with deposit thicknesses from 20 to 100 microns in 4-hour, accelerated-service simulations. Above a threshold temperature, deposit thickness was dependent on impingement angle and particle concentration. Test validation was achieved using direct comparison with deposits from service hardware. Deposit characteristics affecting blade heat transfer via convection and conduction were assessed. Surface topography analysis indicated that the surface structure of the generated deposits were similar to those found on actual turbine blades. Scanning electron microscope (SEM) and x-ray spectroscopy analyses indicated that the deposit microstructures and chemical compositions were comparable to turbine blade deposit samples obtained from industry.
1
INTRODUCTION Despite the greatest of precautions and most stringent filtering techniques, it is nearly impossible to economically provide completely clean air streams in gas turbine (GT) engines. Sand, pollutants, and moisture may all be introduced into the flow and degrade exposed surfaces in the engine. Internal sources of particulate such as dirty fuels, eroded components, and secondary chemical reactions also contribute to the flow of solid and semi-molten matter passing through the GT engine. These particles may either pass through the engine with no effect or attack the surfaces of the engine through erosion, corrosion, or deposition. The adverse effects of these three degradation mechanisms are well documented in the literature. Erosion can cause significant reductions in engine performance by opening up tip clearances and altering blade contours. For example, Ghenaiet et al. [1] reported a 6-10% loss in adiabatic efficiency for 6 hours of sand ingestion in an axial fan. Deposition poses the opposite problem by clogging critical bleeds and reducing blade flow passages. Wenglarz [2] proposed a model for estimating the critical loss in turbine power that occurs when the choked mass flow limit is reduced due to deposit buildup at the nozzle guide vane passage throat. Kim et al. [3] documented the disastrous results of film cooling holes being plugged by massive ingestion from simulated volcanic ash. Both erosion and deposition are also known to increase levels of surface roughness which produces corresponding increases in heat transfer (up to 50%) and skin friction (up to 300%) (Bons [4]). Finally, all three degradation mechanisms (including corrosion) reduce part life and increase the risk of run-time failure.
For the case of deposition in particular, a better understanding of the characteristics of the materials deposited on turbine surfaces would allow a more accurate estimate of their impact on the efficiency and survivability of turbine blades. As GT engine technology has evolved from F-class to G-class and now to H-class, the increase in turbine inlet temperature (TIT) from 1300°C to 1500°C has increased thermal efficiency from 55% to near 60% for H-class turbines [5]. As the US Department of Energy (DOE) contemplates the large-scale introduction of dirty fuels such as coal and biomass in H-type, high temperature turbine engines, the need to understand deposition mechanisms and their effects on efficiency at high temperatures will increase dramatically. The capability of research facilities to study turbine deposition characteristics for high temperature service is presently limited by the time required to develop significant deposits in typical operating engines. Depending on the operation schedule and environment of a land-based GT, the formation of deposits may require as much as 25000 hours of operation. To reproduce this in a laboratory study would require months or years of preparation time for a single sample. Thus the obvious need to explore the possibility of accelerated testing procedures. Without this, any comprehensive investigation of new service conditions that may affect the characteristics of deposit growth would clearly be impractical. This study investigates the suitability of such an accelerated deposition facility to specifically study the deposition of ingested particulate on the first stage turbine blades in land based GT engines. Sample turbine blade materials with thermal barrier coatings (TBCs) representative of common GT engine construction have been obtained from various gas turbine manufacturers. Deposits have been generated on these materials in a new accelerated testing facility. At the same time, actual turbine blades at various points in their service life have been obtained from the gas turbine community. These serviced components have been characterized to determine the structure of surface deposits including an examination of surface roughness, morphology, internal structure including porosity, and chemical composition. A comparison of these findings to the results of similar examinations of accelerated deposits is used to validate this testing procedure.
BACKGROUND Particulate flow in GT engines (either from ingestion, dirty fuel combustion, or internal erosion) results in three adverse phenomena: corrosion, erosion, and deposition. Corrosion in the HP turbine is primarily due to attack of the surface, particularly the coating, by hot gases and particles. A model has been presented by Chan et al. [6] to characterize the life of coatings when considering oxidation, fracture and spallation in the coating, inward diffusion of Al from the coating to the substrate, and the critical level of Al required at the surface to form a protective oxide layer. Critical temperature thresholds for Type I and Type II (Hot Corrosion) are 850-1000°C and 700°C respectively [7]. While these temperature regimes are well below the inlet gas temperature for most modern turbines, they become relevant in regions of film cooling (where the metal temperature is lower than the gas temperature) and in subsequent turbine stages. Deposition rate
2
can have an effect on the rate of hot corrosion by influencing the rate of mass flux of sulfur to the wall [7]. Thus, an understanding of depositional mechanisms and particularly their interaction with sulfur compounds would aid in the understanding of Type I and II corrosion attacks in GT engines. An equally destructive deposition mechanism that has corrosive elements is evidenced during CMAS (Calcium, Magnesium, Aluminum, Silicon) attack where molten CMAS infiltrates microcracks in the TBC and creates thermal stresses leading to spallation. Since 1979, the University of Cincinnati has operated a facility capable of accelerated erosion studies on aircraft turbine blade samples at various impingement angles and temperatures up to 1093°C [8]. Using this facility, it has been shown that impingement angle has a strong influence on the erosion rate of different surfaces [9]. Walsh et al. [10] reported that erosion rates are also a function of erodent character, temperature, and impact velocity. A study by Zaita et al. [11] of the contribution of erosion to tip clearance growth in aircraft engines indicated that erosion effects were a large contributor to efficiency loss over time and a critical parameter in determining engine efficiency degradation. It is likely that a critical threshold temperature exists between regimes where erosion is the dominant degradation mechanism and where deposition becomes critical. Once particulates exceed the temperature where they become molten, agglomeration rates increase [12] with an attendant decrease in blade erosion rates. Deposition research in aircraft engines has indicated that this threshold for the deposition mechanism in aircraft turbine engines is between 980 and 1150°C [12, 13, 14]. Kim et al. [3] looked at deposition in aircraft engines arising from ingestion of volcanic materials. Their facility consisted of engine components simulating both can-type and annular-type combustors and HP turbines. They found that deposition did not occur below 1121°C. They also reported that deposition rates increased with time as the surfaces became better captors of material and was roughly proportional to concentration given constant temperature and exposure time. However, the conditions of land-based GT engines make the investigations by Kim et al. only marginally useful, particularly since most GT inlet filters will block the majority of particles ingested by the aircraft engines examined in their volcanic ash experiments. This temperature threshold range is still well below the TIT of H-class GT engines. It also falls below the temperature threshold (nominally 1100°C) observed by Wenglarz [2, 12], where larger fractions of the particulate are molten and therefore stick to the turbine surfaces more easily. This temperature threshold dictates that a viable accelerated deposition facility must be capable of studying flow regimes at temperatures significantly above and below 1100°C. Previous research indicates that the need for an accelerated testing facility exists, and this need will only increase as turbine inlet temperatures increase with the introduction of new materials technology. Without a good understanding of the depositional mechanisms involved at these higher temperatures, accurate estimates of turbine efficiency during extended service may prove elusive.
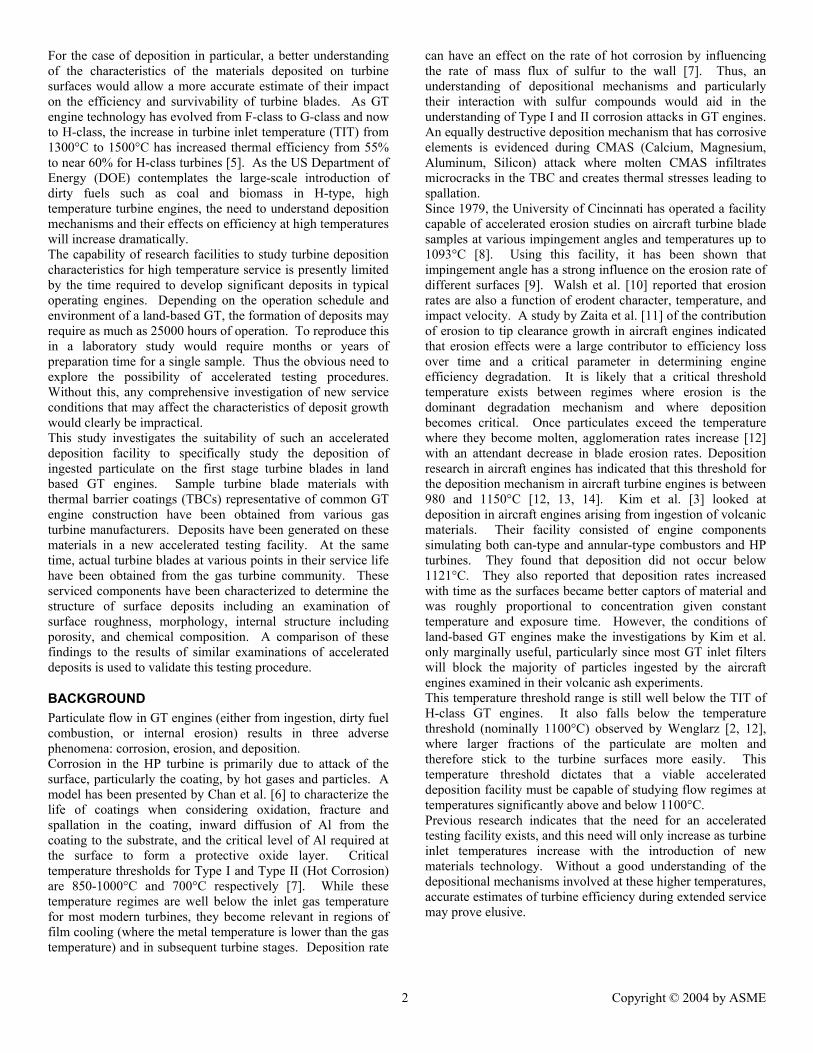
ACCELERATED DEPOSITION FACILITY In order to study the structure and thermal properties of deposits forming on first stage high pressure (HP) turbine vanes and blades, an experimental facility was constructed to duplicate conditions in the blade leading edge zone where deposition tends to be the heaviest [15]. This facility attempts to replicate the chemistry and structure of deposits occurring on turbine blades after 10,000 hours service in 4-hour accelerated tests. The facility is capable of matching the Mach number and flow temperature in the first stage of the turbine while also providing a means of varying the impingement angle of the flow on the sample and the particulate concentration in the flow. A photograph of the facility is shown in Figure 1. To properly simulate deposition mechanisms in the HPT, the gas turbine combustor exit flow conditions must be duplicated in the laboratory. The critical variables for an accurate simulation include: flow temperature, Mach number, and impingement angle, as well as particle size, chemistry, and loading. Gas (and particulate) temperature is important since it influences the state and thus susceptibility for deposition of molten particulates in the flow [12]. For particle sizes in excess of 1 to 2 microns, the primary means of deposition is inertial impaction, making impingement angle and particle velocity (flow Mach number) critical parameters governing the force of impact and the momentum transfer during a collision with the blade surface. Below one micron, other processes including turbulent eddy diffusion, thermophoresis, and Brownian diffusion dominate the deposition mechanism [12]. One flow parameter that is not simulated in this test facility is static pressure (the deposition occurs at pressures less than 15kPa above atmospheric pressure). This is consistent with other deposition test facilities that operate at significantly lower pressures than those found in a GT [9, 16] The consensus from these and other studies [3, 17] is that particle temperature, concentration, and residence time are the necessary parameters for proper simulation, not static pressure. As for matching the particulate loading in the gas stream (parts per million weight or ppmw), Wenglarz [12] describes various experiments where particulate concentration and service time seemed to tradeoff between each other. Turbines exhibited large deposits or could even be driven to failure either by high particle loading at low service time or low particle loading for long periods [12]. This suggests that a throughput mass factor may be the key parameter and the time to produce a surface deposit could be reduced by increasing freestream concentration of particulate. The validation of this hypothesis is the subject of this study. Deposition can occur from a variety of mechanisms, both internal to the GT (e.g. dirty fuels or eroded components) and from the environment (airborne sand, salts, etc…). The focus of this study is the simulation of airborne particulates ingested into a natural gas burning engine. In the laboratory, this is done by seeding a natural gas combustor with high concentrations of airborne particulates. A description of this facility follows. The primary air stream is injected into the steel base of the natural gas combustor where it is first dispersed by passing through a volume of marbles and then straightened through a 5cm tall honeycomb section. At this point, natural gas is injected into the flow via four stainless steel fuel injectors. The
3
detailed chemical composition of this fuel is given by Murray [18], but it primarily consists of CH4. The combusting flow then enters a 20° cone axisymmetric nozzle with a 370:1 inlet to exit area ratio. The elevated Mach number at the nozzle exit is maintained through a 0.9m long pipe leading to the test coupon where entrained particles are brought up to 95% of flow
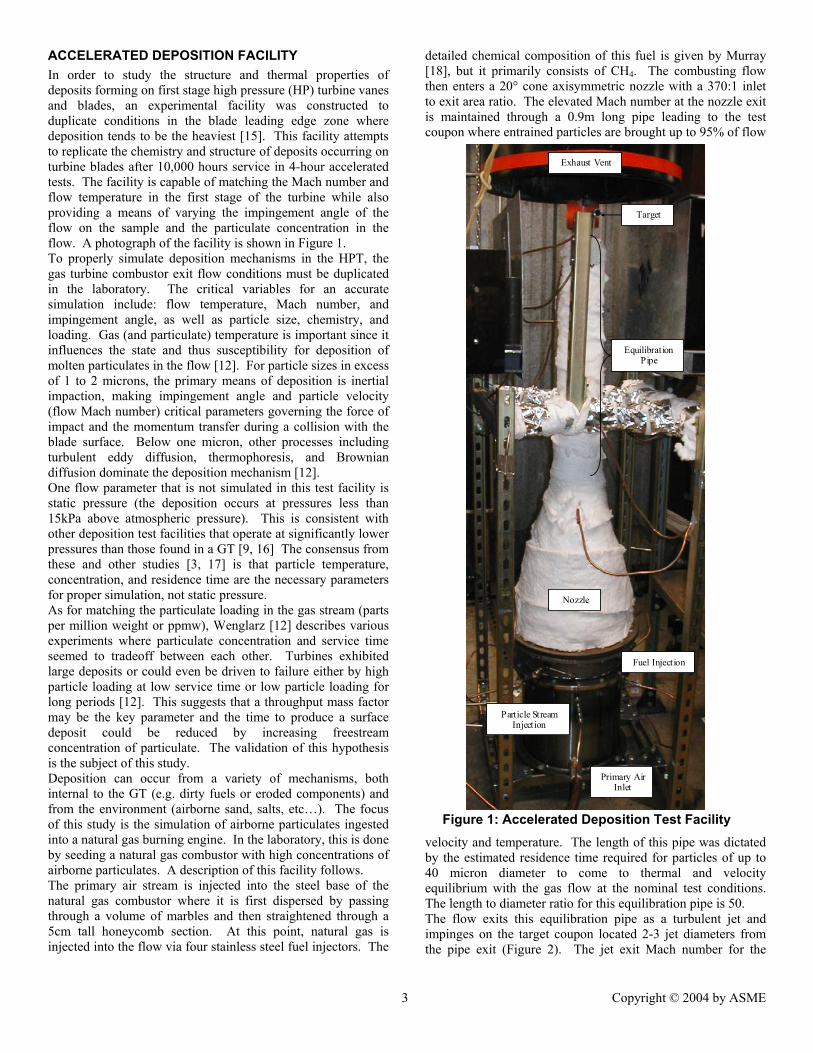
velocity and temperature. The length of this pipe was dictated by the estimated residence time required for particles of up to 40 micron diameter to come to thermal and velocity equilibrium with the gas flow at the nominal test conditions. The length to diameter ratio for this equilibration pipe is 50. The flow exits this equilibration pipe as a turbulent jet and impinges on the target coupon located 2-3 jet diameters from the pipe exit (Figure 2). The jet exit Mach number for the
experiments reported in this study has been set to match the typical inlet Mach number range (0.2-0.4) for a first-stage turbine blade row, though the capability exists to operate at Mach numbers twice this high. The fixture holding the coupon can be oriented at a 30, 45, 60, or 90° angle to the flow path, allowing the simulation of various impingement angles found in a turbine flowpath as the flow stagnates against the leading edge and then sweeps around the airfoil.
In order to match the high temperatures characteristic of the HP turbine, the combustion section and all other downstream components are constructed of Inconel 600 and 601 alloys for maintenance of a high temperature flow without necessitating a cooling jacket. Inconel 600 and 601 have a high lower melt temperature (1350°C) which allows experiments to operate up to a mean temperature of 1150°C with maximum temperatures of 1200°C. Provisions have been made for increasing this maximum operating temperature to 1350C with a steam cooling jacket around the equilibration pipe. For now, system temperatures are maintained using ceramic insulation around the entire combustion facility. Simulation of a particulate-laden flow is achieved by seeding particles into the air stream by means of a secondary air flow system. Though the primary use of this facility to date has been to model the ingestion of foreign particles at the GT inlet, this facility could also be used to examine the impact of burning “dirty fuels” or excessive internal erosion in GT engines. By seeding the air flow with the proper mixture of ash, chemical impurities, GT engine material, or other elements, this facility could be used to simulate the burning of biomass, coal, heavy fuel oils, or any other of a variety of alternative fuels as well as internal erosion by ingested particles or the break-up of particles deposited upstream of the turbine. In order to examine the case of airborne particle ingestion from the atmosphere, an understanding of the typical particulate content of the atmosphere was needed. The particulate content of a typical urban atmosphere consists of a bimodal distribution centered at 0.5 and 10 microns [19, 20]. The finer of these two
Air stream impacts coupon
θ
TC 1 TC 2
Figure 2: Cut-away of target area (TC1 and TC2 show flow thermocouple placement).
4
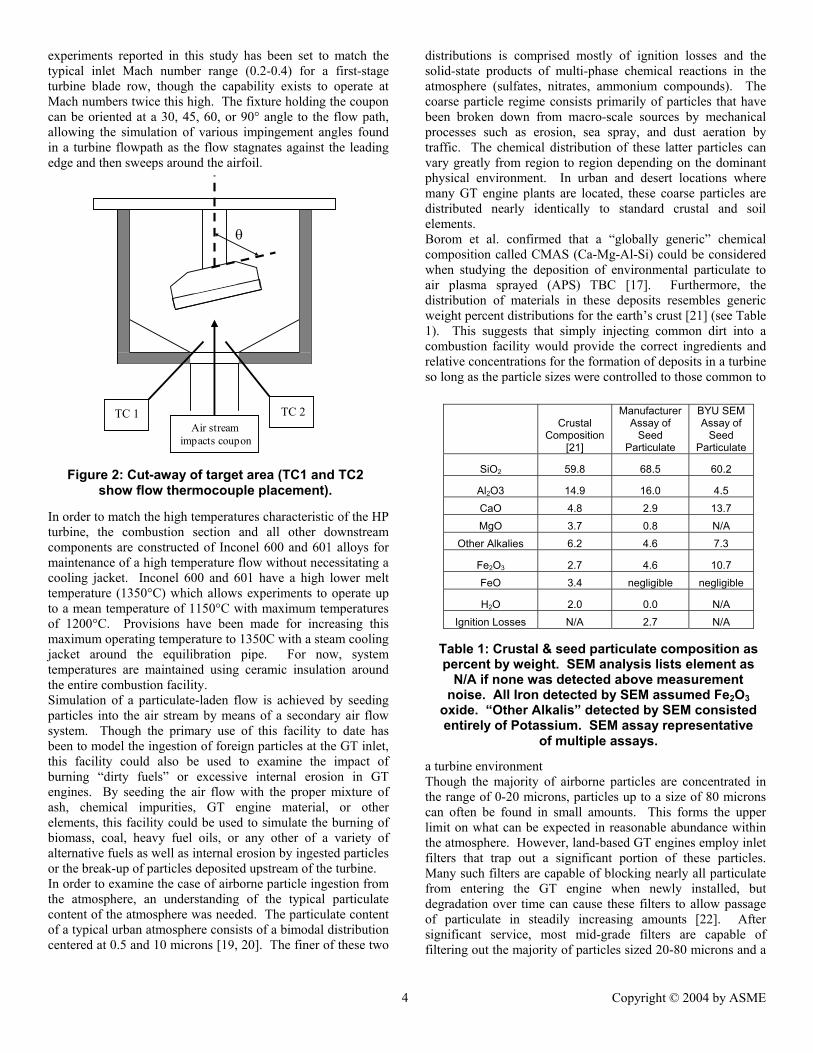
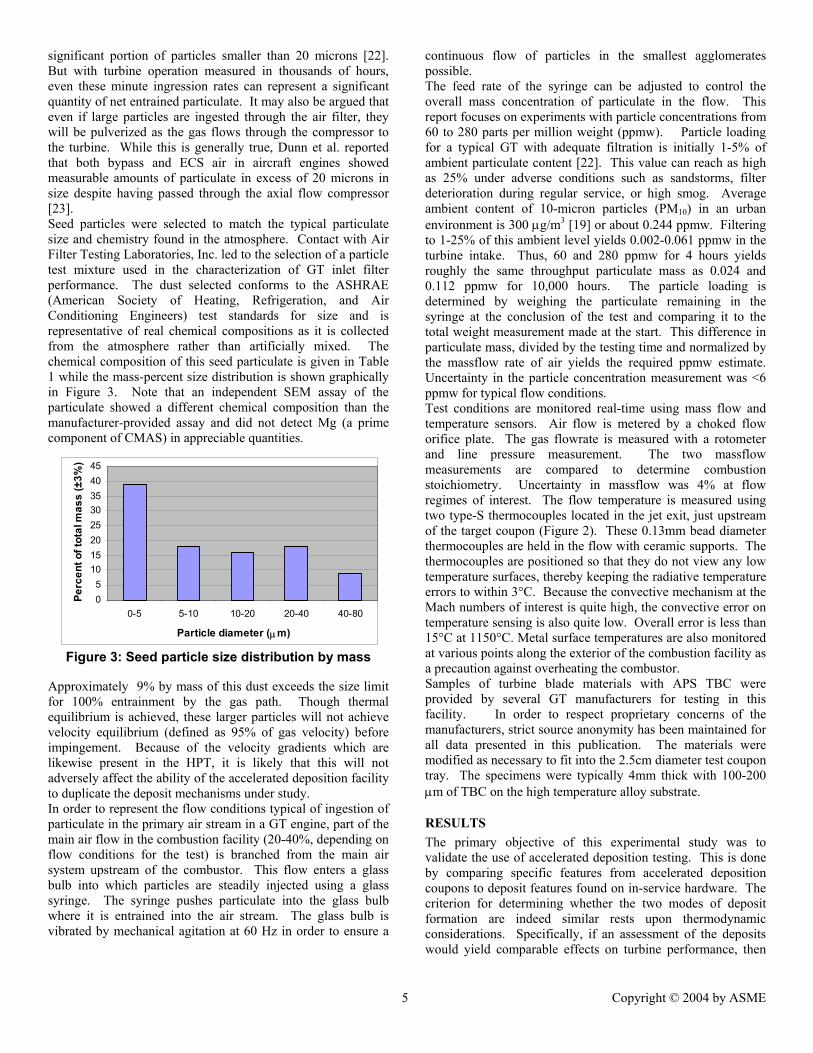
distributions is comprised mostly of ignition losses and the solid-state products of multi-phase chemical reactions in the atmosphere (sulfates, nitrates, ammonium compounds). The coarse particle regime consists primarily of particles that have been broken down from macro-scale sources by mechanical processes such as erosion, sea spray, and dust aeration by traffic. The chemical distribution of these latter particles can vary greatly from region to region depending on the dominant physical environment. In urban and desert locations where many GT engine plants are located, these coarse particles are distributed nearly identically to standard crustal and soil elements. Borom et al. confirmed that a “globally generic” chemical composition called CMAS (Ca-Mg-Al-Si) could be considered when studying the deposition of environmental particulate to air plasma sprayed (APS) TBC [17]. Furthermore, the distribution of materials in these deposits resembles generic weight percent distributions for the earth’s crust [21] (see Table 1). This suggests that simply injecting common dirt into a combustion facility would provide the correct ingredients and relative concentrations for the formation of deposits in a turbine so long as the particle sizes were controlled to those common to
a turbine environment Though the majority of airborne particles are concentrated in the range of 0-20 microns, particles up to a size of 80 microns can often be found in small amounts. This forms the upper limit on what can be expected in reasonable abundance within the atmosphere. However, land-based GT engines employ inlet filters that trap out a significant portion of these particles. Many such filters are capable of blocking nearly all particulate from entering the GT engine when newly installed, but degradation over time can cause these filters to allow passage of particulate in steadily increasing amounts [22]. After significant service, most mid-grade filters are capable of filtering out the majority of particles sized 20-80 microns and a
significant portion of particles smaller than 20 microns [22]. But with turbine operation measured in thousands of hours, even these minute ingression rates can represent a significant quantity of net entrained particulate. It may also be argued that even if large particles are ingested through the air filter, they will be pulverized as the gas flows through the compressor to the turbine. While this is generally true, Dunn et al. reported that both bypass and ECS air in aircraft engines showed measurable amounts of particulate in excess of 20 microns in size despite having passed through the axial flow compressor [23]. Seed particles were selected to match the typical particulate size and chemistry found in the atmosphere. Contact with Air Filter Testing Laboratories, Inc. led to the selection of a particle test mixture used in the characterization of GT inlet filter performance. The dust selected conforms to the ASHRAE (American Society of Heating, Refrigeration, and Air Conditioning Engineers) test standards for size and is representative of real chemical compositions as it is collected from the atmosphere rather than artificially mixed. The chemical composition of this seed particulate is given in Table 1 while the mass-percent size distribution is shown graphically in Figure 3. Note that an independent SEM assay of the particulate showed a different chemical composition than the manufacturer-provided assay and did not detect Mg (a prime component of CMAS) in appreciable quantities.
Approximately 9% by mass of this dust exceeds the size limit for 100% entrainment by the gas path. Though thermal equilibrium is achieved, these larger particles will not achieve velocity equilibrium (defined as 95% of gas velocity) before impingement. Because of the velocity gradients which are likewise present in the HPT, it is likely that this will not adversely affect the ability of the accelerated deposition facility to duplicate the deposit mechanisms under study. In order to represent the flow conditions typical of ingestion of particulate in the primary air stream in a GT engine, part of the main air flow in the combustion facility (20-40%, depending on flow conditions for the test) is branched from the main air system upstream of the combustor. This flow enters a glass bulb into which particles are steadily injected using a glass syringe. The syringe pushes particulate into the glass bulb where it is entrained into the air stream. The glass bulb is vibrated by mechanical agitation at 60 Hz in order to ensure a
05
1015202530354045
0-5 5-10 10-20 20-40 40-80
Particle diameter (µm)
Perc
ent o
f tot
al m
ass
(±3%
)
Figure 3: Seed particle size distribution by mass
5
continuous flow of particles in the smallest agglomerates possible. The feed rate of the syringe can be adjusted to control the overall mass concentration of particulate in the flow. This report focuses on experiments with particle concentrations from 60 to 280 parts per million weight (ppmw). Particle loading for a typical GT with adequate filtration is initially 1-5% of ambient particulate content [22]. This value can reach as high as 25% under adverse conditions such as sandstorms, filter deterioration during regular service, or high smog. Average ambient content of 10-micron particles (PM10) in an urban environment is 300 µg/m3 [19] or about 0.244 ppmw. Filtering to 1-25% of this ambient level yields 0.002-0.061 ppmw in the turbine intake. Thus, 60 and 280 ppmw for 4 hours yields roughly the same throughput particulate mass as 0.024 and 0.112 ppmw for 10,000 hours. The particle loading is determined by weighing the particulate remaining in the syringe at the conclusion of the test and comparing it to the total weight measurement made at the start. This difference in particulate mass, divided by the testing time and normalized by the massflow rate of air yields the required ppmw estimate. Uncertainty in the particle concentration measurement was <6 ppmw for typical flow conditions. Test conditions are monitored real-time using mass flow and temperature sensors. Air flow is metered by a choked flow orifice plate. The gas flowrate is measured with a rotometer and line pressure measurement. The two massflow measurements are compared to determine combustion stoichiometry. Uncertainty in massflow was 4% at flow regimes of interest. The flow temperature is measured using two type-S thermocouples located in the jet exit, just upstream of the target coupon (Figure 2). These 0.13mm bead diameter thermocouples are held in the flow with ceramic supports. The thermocouples are positioned so that they do not view any low temperature surfaces, thereby keeping the radiative temperature errors to within 3°C. Because the convective mechanism at the Mach numbers of interest is quite high, the convective error on temperature sensing is also quite low. Overall error is less than 15°C at 1150°C. Metal surface temperatures are also monitored at various points along the exterior of the combustion facility as a precaution against overheating the combustor. Samples of turbine blade materials with APS TBC were provided by several GT manufacturers for testing in this facility. In order to respect proprietary concerns of the manufacturers, strict source anonymity has been maintained for all data presented in this publication. The materials were modified as necessary to fit into the 2.5cm diameter test coupon tray. The specimens were typically 4mm thick with 100-200 µm of TBC on the high temperature alloy substrate.
RESULTS The primary objective of this experimental study was to validate the use of accelerated deposition testing. This is done by comparing specific features from accelerated deposition coupons to deposit features found on in-service hardware. The criterion for determining whether the two modes of deposit formation are indeed similar rests upon thermodynamic considerations. Specifically, if an assessment of the deposits would yield comparable effects on turbine performance, then
the deposits are considered to be “similar”. Deposits alter the blade thermodynamics through two primary mechanisms: convection and conduction. Convection is influenced by changes in surface roughness. Bons [4] tested scaled models of actual turbine deposit roughness and found 20-40% increases in convective heat transfer. Several roughness statistics were suggested as possible correlating parameters for the observed increase in heat transfer. Thus, if the deposits generated in this accelerated deposition facility have a statistically similar character to those found on actual in-service hardware, they would be considered “similar”. Accordingly, surface topology measurements were made to allow statistical comparisons of roughness. Deposits also form an insulating layer over the TBC, thus reducing heat flow to the metal substrate. This conduction mechanism is governed by the deposit thickness, chemistry, and structure. As such, measurements were made of the deposit internal structure and chemical composition using SEM and X-ray spectroscopy. The results of these two studies are presented below. Following this, some remarks are made regarding observed variations in deposit characteristics with impingement angle, particulate concentration, and gas temperature.
TOPOGRAPHY Surface roughness in turbines is governed by an imposing list of parameters including: service hours, cycles, operating temperature, and environment. Bons et al [15] reported significant variations with blade location and surface degradation mechanism (spallation, deposition, or erosion) as well. Traditionally, roughness is characterized by its statistics (e.g. Ra, Rt). These statistics can then be used with empirical
correlations to estimate changes in skin friction or convective heat transfer [24, 25]. With such a rich parameter space, it would be unproductive to try to match a specific surface
Surface Type Ra [µm]
Rt [µm]
αrms [deg] Sw/S Λs
Accelerated (4hr test)
60ppmw, at coupon edge (Fig 4b) 28 257 29 1.43 13
280ppmw, 90deg impingement 32 260 16.5 1.12 82
280ppmw, 45deg impingement 10 107 13.7 1.06 180
280ppmw, at coupon edge 38 249 18 1.11 87
Serviced Hardware
25000hr blade (Fig 4a) 32 240 27 1.36 22
22500hr blade 41 296 24 1.24 36
<1000hr blade 19 394 18 1.11 77
24000hr vane 17 220 15.8 1.09 134
Table 2: Roughness statistics for accelerated and serviced deposits.
6
topology from a serviced turbine to that obtained in the accelerated deposition test facility. Instead, statistical comparisons can be used to show that surface formations have similar character and thus would influence performance (e.g. convective heat transfer) in a similar way. A Hommel Inc. T8000 surface measurement system was used to make 3D surface topology maps of a variety of surfaces. The Hommel uses a 1.5µm radius diamond-tipped conical stylus to follow the surface features for a given part. The instrument can measure a total vertical range of 1.6mm with a precision of 75nm. 3D surfaces are constructed from data taken every 5 to 10 µm on a rectilinear grid (typically 4mm square).
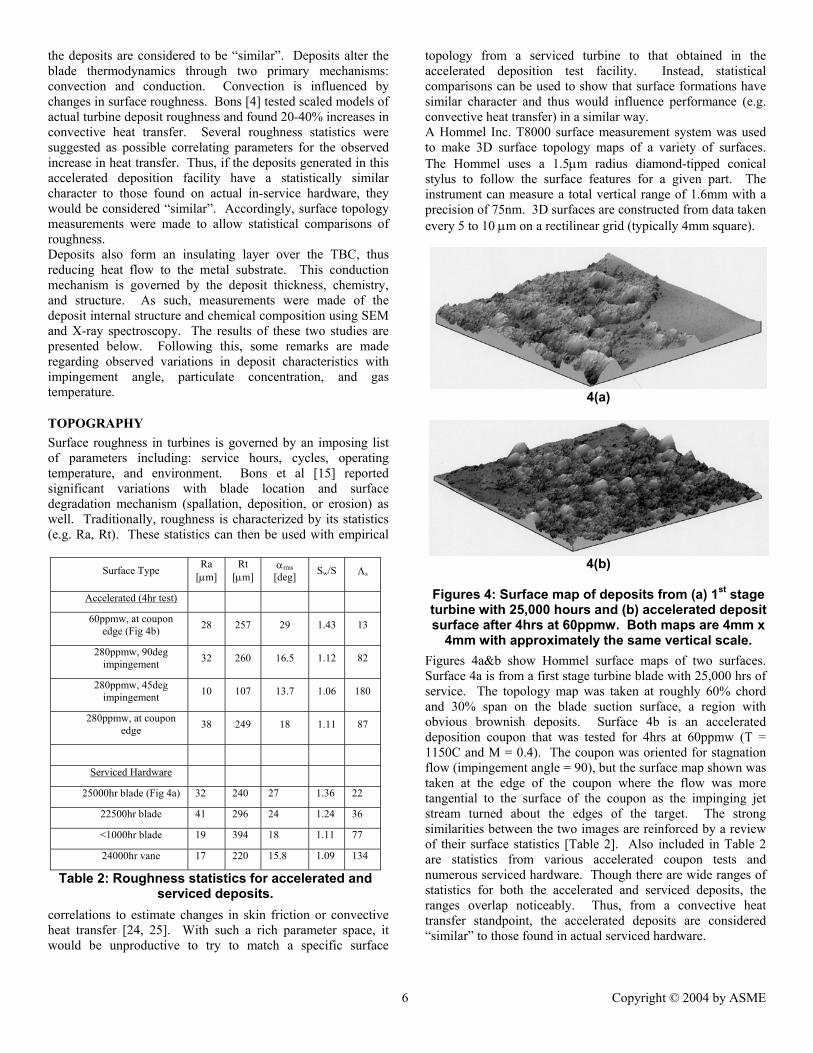
Figures 4a&b show Hommel surface maps of two surfaces. Surface 4a is from a first stage turbine blade with 25,000 hrs of service. The topology map was taken at roughly 60% chord and 30% span on the blade suction surface, a region with obvious brownish deposits. Surface 4b is an accelerated deposition coupon that was tested for 4hrs at 60ppmw (T = 1150C and M = 0.4). The coupon was oriented for stagnation flow (impingement angle = 90), but the surface map shown was taken at the edge of the coupon where the flow was more tangential to the surface of the coupon as the impinging jet stream turned about the edges of the target. The strong similarities between the two images are reinforced by a review of their surface statistics [Table 2]. Also included in Table 2 are statistics from various accelerated coupon tests and numerous serviced hardware. Though there are wide ranges of statistics for both the accelerated and serviced deposits, the ranges overlap noticeably. Thus, from a convective heat transfer standpoint, the accelerated deposits are considered “similar” to those found in actual serviced hardware.
4(a)
4(b)
Figures 4: Surface map of deposits from (a) 1st stage turbine with 25,000 hours and (b) accelerated deposit surface after 4hrs at 60ppmw. Both maps are 4mm x
The typical thickness of deposits in the accelerated test facility can be seen in Figure 5 which shows the average of 800 profilometer traces across the test coupon. The ends of the trace are unexposed TBC, so the average deposit thickness can be measured relative to this reference height. The deposits in this coupon appear to be roughly 45µm thick, though the actual amount of deposit may be greater since the underlying TBC experiences some degradation during testing. A weight measurement of this test coupon before and after accelerated
deposition showed an increase due to deposition corresponding to 0.04grams per square mm of exposed coupon surface.
INTERNAL STRUCTURE & CHEMICAL COMPOSITION When decreasing the length of exposure by three orders of magnitude, it is natural to question whether the deposition process has fundamentally changed. Though the external surface structure of accelerated deposits may bear resemblance to deposits found on turbine blades with over 10,000hrs service time, in terms of internal heat conduction it is critical to determine whether the internal structure and chemical composition of the deposit is similar as well. To this end, scanning electron microscopy (SEM) was used with both the deposits formed in this accelerated facility and samples obtained from Standard Aero Inc., a third party turbine servicing corporation. Since the turbine hardware available for cross-section did not have thermal barrier coating (TBC), comparison was also made with limited TBC-coated SEM data available in the literature. To prepare the specimens for SEM analysis, each test coupon (or blade) was first potted in epoxy resin to prevent dislocation of the deposit during sectioning. Sections were then made and polished to 10 microns. Figure 6 shows side by side SEM comparisons of these microstructures. Figure 6a is from a non-TBC coated blade with 16,000hrs service while 6b is from a 4-hour accelerated deposit on a TBC-coated coupon at T = 1150°C , θ = 90°, and M = 0.33. In both figures, the deposit is sandwiched between the epoxy (on top) and the turbine surface (on bottom). Elongated structures running parallel to the blade surface are evident in both SEM pictures. Another set of comparisons is shown in figures 7a
-10
0
10
20
30
40
50
60
70
80
90
100
-1 1 3 5 7 9 11 13 15 17 19 21 23X-distance [mm]
Mea
n H
eigh
t [m
icro
ns]
UnexposedCoupon - No Deposit
Exposed Coupon - Accelerated Deposit
Figure 5: 23mm long average surface trace across
accelerated deposit test coupon. Vertical scale (units are microns) exaggerated for clarity. 1mm on either
end of trace is unexposed TBC surface with no
7
(non-TBC coated turbine blade with 25,000hrs) and 7b (4-hour accelerated deposit on a TBC coupon at T = 1150°C , θ = 45°, and M = 0.33). Note that the 100-micron thick sample shown in Figure 6(b) and the 50-micron thick sample shown in Figure 7(b) are of the same order magnitude in size as actual turbine blade deposits shown in Figures 6(a) and 7(a). Other microstructures including pitting and grain sintering were
also observed in both turbine blade and accelerated specimen cross-sections. Since the serviced hardware used in this comparison did not have TBC, comparison was also made with the SEM analysis in Borom et al. [17]. Their study of serviced venturi and turbine shrouds with TBC showed significant mixing between the coating and the deposit. Figure 7b shows a region (circled and labeled) where TBC constituents were found to penetrate into the deposit and vice-versa using x-ray spectroscopy. With the specimen cross-sections in the polished state, they were also suitable for x-ray spectroscopy measurements. X-ray spectroscopy was used to determine the materials most likely to
6(a)
(b)
Figure 6: SEM cross-section of (a) a 16000-hour service blade with 50-µm metering bar at top left and
(b) an accelerated deposit specimen with 100-µm metering bar at top left
Common Elements percent weight accelerated sample point CaO MgO Al2O3 SiO2 Fe2O3 TiO Cr2O3 ZnO Na2O
1 16.2% N/A 8.4% 59.6% 9.9% 5.8% 0.0% N/A N/A
2 27.4% N/A 3.7% 37.4% 16.6% 9.3% 5.6% N/A N/A
3 7.6% N/A 8.4% 32.2% 20.2% 10.9% 20.7% N/A N/A
4 26.7% N/A N/A 56.3% 10.9% 6.1% 0.0% N/A N/A
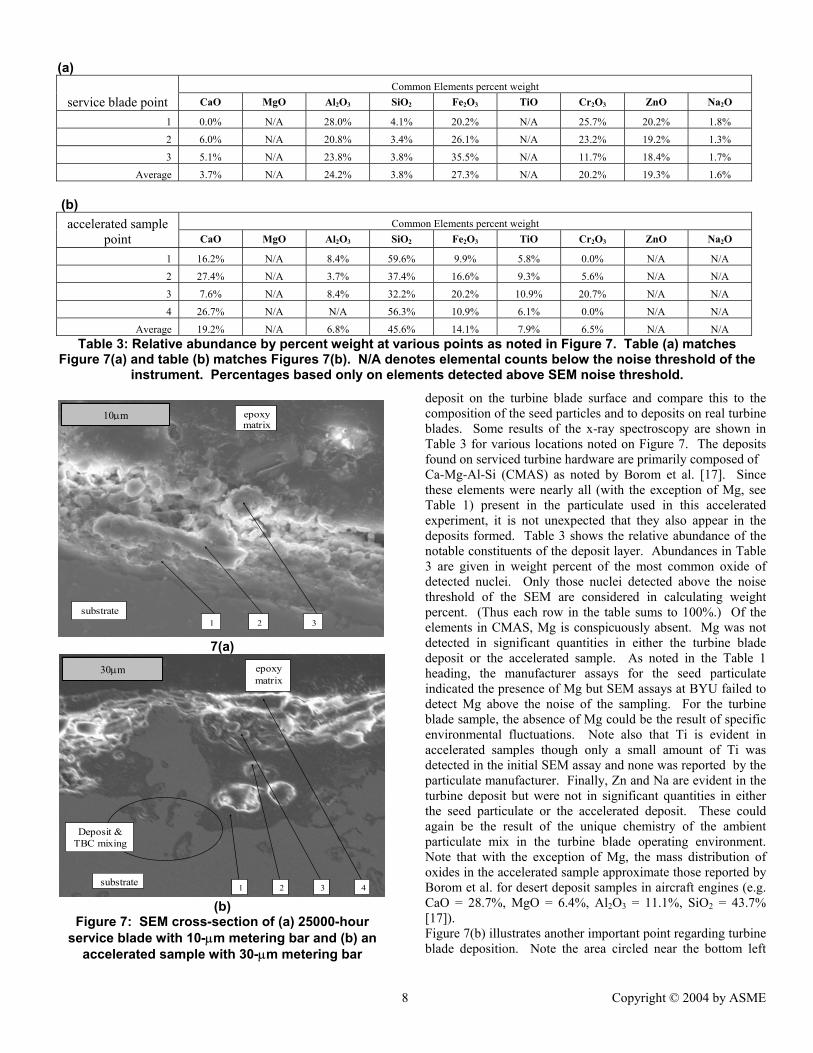
Average 19.2% N/A 6.8% 45.6% 14.1% 7.9% 6.5% N/A N/A Table 3: Relative abundance by percent weight at various points as noted in Figure 7. Table (a) matches
Figure 7(a) and table (b) matches Figures 7(b). N/A denotes elemental counts below the noise threshold of the instrument. Percentages based only on elements detected above SEM noise threshold.
epoxy matrix
1 substrate
2 3
7(a)
substrate
epoxy matrix
1 2 3 4
Deposit & TBC mixing
(b) Figure 7: SEM cross-section of (a) 25000-hour
service blade with 10-µm metering bar and (b) an accelerated sample with 30-µm metering bar
30µm
10µm
8
deposit on the turbine blade surface and compare this to the composition of the seed particles and to deposits on real turbine blades. Some results of the x-ray spectroscopy are shown in Table 3 for various locations noted on Figure 7. The deposits found on serviced turbine hardware are primarily composed of Ca-Mg-Al-Si (CMAS) as noted by Borom et al. [17]. Since these elements were nearly all (with the exception of Mg, see Table 1) present in the particulate used in this accelerated experiment, it is not unexpected that they also appear in the deposits formed. Table 3 shows the relative abundance of the notable constituents of the deposit layer. Abundances in Table 3 are given in weight percent of the most common oxide of detected nuclei. Only those nuclei detected above the noise threshold of the SEM are considered in calculating weight percent. (Thus each row in the table sums to 100%.) Of the elements in CMAS, Mg is conspicuously absent. Mg was not detected in significant quantities in either the turbine blade deposit or the accelerated sample. As noted in the Table 1 heading, the manufacturer assays for the seed particulate indicated the presence of Mg but SEM assays at BYU failed to detect Mg above the noise of the sampling. For the turbine blade sample, the absence of Mg could be the result of specific environmental fluctuations. Note also that Ti is evident in accelerated samples though only a small amount of Ti was detected in the initial SEM assay and none was reported by the particulate manufacturer. Finally, Zn and Na are evident in the turbine deposit but were not in significant quantities in either the seed particulate or the accelerated deposit. These could again be the result of the unique chemistry of the ambient particulate mix in the turbine blade operating environment. Note that with the exception of Mg, the mass distribution of oxides in the accelerated sample approximate those reported by Borom et al. for desert deposit samples in aircraft engines (e.g. CaO = 28.7%, MgO = 6.4%, Al2O3 = 11.1%, SiO2 = 43.7% [17]). Figure 7(b) illustrates another important point regarding turbine blade deposition. Note the area circled near the bottom left
corner of the SEM scan. The different colored regions represent different chemical compositions and in this case are identified as TBC material and deposit-laden material. This area shows that even in these accelerated tests, solid-state diffusion occurs as the TBC ceramic materials mix with the ceramic compounds in ingested particulate similar to the corrosion processes that can attack TBC during prolonged operation [7]. It is important to note that though SiO2 is the primary component of the earth’s crust and the seed particulate (roughly 60% by weight), the mass fraction of less abundant elements such as Ca and Fe are more conspicuous within the deposit. Each of these minor elements is less than 10% as abundant as Si in the earth’s crust and the seed particulate, yet each is present in quantities of 30-80% of the most abundant element (Al or Si) in the deposit for the points at which x-ray spectra were taken. This trend held true for both accelerated deposits and service turbine blades. Additionally, the turbine blade samples exhibited little constituent stratification in the deposit layer. This is similar to the results given by Borom et al. [17] in which the chemical composition of the deposits seemed relatively homogeneous (i.e. roughly constant through the thickness). From the data in Table 3 it is clear that elements such as Fe, Cr, and Ca exhibit relatively constant abundance within the deposit layer. This indicates that accelerated deposition results in a homogeneous deposit layer similar to those observed in real service hardware. Thus, all indications suggest that accelerated deposition occurs by the same processes and is hence similar to deposits formed on in-service turbine hardware.
0
0.05
0.1
0.15
0.2
0.25
0.3
0 10 20 30 40 50 60 70 80 90
Impingement Angle [degrees]
Dep
osit
thic
knes
s no
rmal
ized
by
net
part
icul
ate
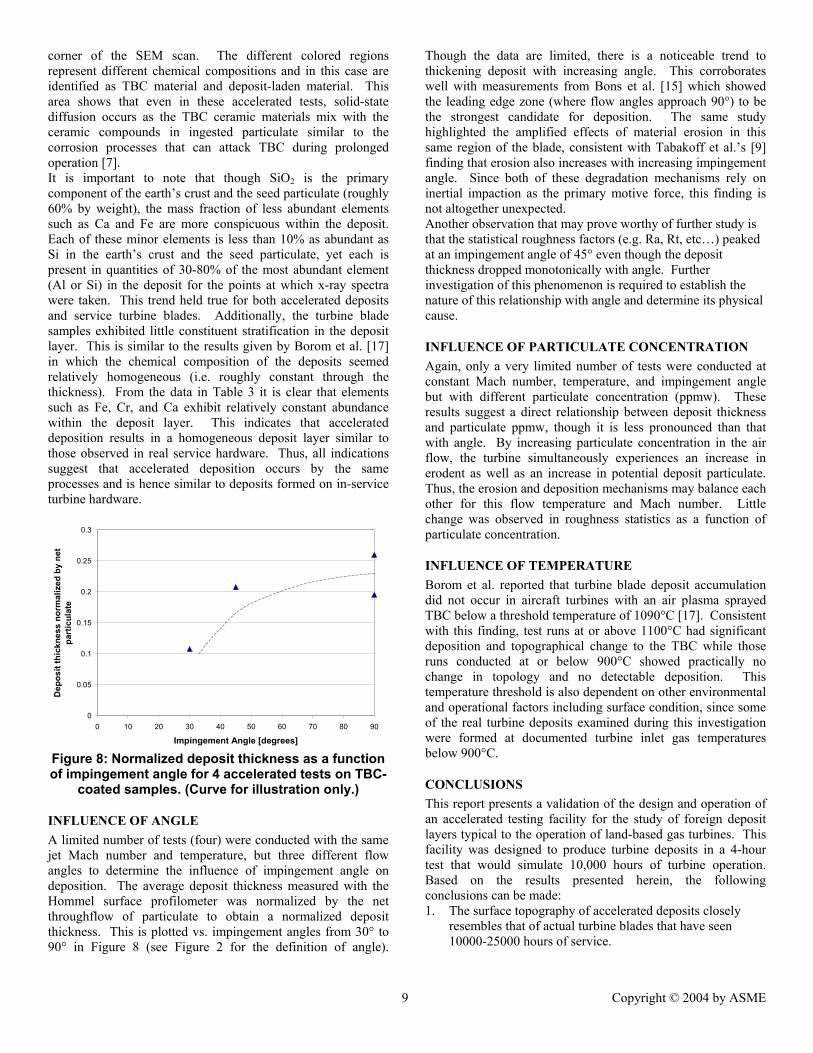
Figure 8: Normalized deposit thickness as a function of impingement angle for 4 accelerated tests on TBC-
coated samples. (Curve for illustration only.)
INFLUENCE OF ANGLE A limited number of tests (four) were conducted with the same jet Mach number and temperature, but three different flow angles to determine the influence of impingement angle on deposition. The average deposit thickness measured with the Hommel surface profilometer was normalized by the net throughflow of particulate to obtain a normalized deposit thickness. This is plotted vs. impingement angles from 30° to 90° in Figure 8 (see Figure 2 for the definition of angle).
9
Though the data are limited, there is a noticeable trend to thickening deposit with increasing angle. This corroborates well with measurements from Bons et al. [15] which showed the leading edge zone (where flow angles approach 90°) to be the strongest candidate for deposition. The same study highlighted the amplified effects of material erosion in this same region of the blade, consistent with Tabakoff et al.’s [9] finding that erosion also increases with increasing impingement angle. Since both of these degradation mechanisms rely on inertial impaction as the primary motive force, this finding is not altogether unexpected. Another observation that may prove worthy of further study is that the statistical roughness factors (e.g. Ra, Rt, etc…) peaked at an impingement angle of 45° even though the deposit thickness dropped monotonically with angle. Further investigation of this phenomenon is required to establish the nature of this relationship with angle and determine its physical cause.
INFLUENCE OF PARTICULATE CONCENTRATION Again, only a very limited number of tests were conducted at constant Mach number, temperature, and impingement angle but with different particulate concentration (ppmw). These results suggest a direct relationship between deposit thickness and particulate ppmw, though it is less pronounced than that with angle. By increasing particulate concentration in the air flow, the turbine simultaneously experiences an increase in erodent as well as an increase in potential deposit particulate. Thus, the erosion and deposition mechanisms may balance each other for this flow temperature and Mach number. Little change was observed in roughness statistics as a function of particulate concentration.
INFLUENCE OF TEMPERATURE Borom et al. reported that turbine blade deposit accumulation did not occur in aircraft turbines with an air plasma sprayed TBC below a threshold temperature of 1090°C [17]. Consistent with this finding, test runs at or above 1100°C had significant deposition and topographical change to the TBC while those runs conducted at or below 900°C showed practically no change in topology and no detectable deposition. This temperature threshold is also dependent on other environmental and operational factors including surface condition, since some of the real turbine deposits examined during this investigation were formed at documented turbine inlet gas temperatures below 900°C.
CONCLUSIONS This report presents a validation of the design and operation of an accelerated testing facility for the study of foreign deposit layers typical to the operation of land-based gas turbines. This facility was designed to produce turbine deposits in a 4-hour test that would simulate 10,000 hours of turbine operation. Based on the results presented herein, the following conclusions can be made: 1. The surface topography of accelerated deposits closely
resembles that of actual turbine blades that have seen 10000-25000 hours of service.
2. The microstructure and chemical composition of accelerated deposits resembles that of actual turbine blades. The deposits are relatively homogeneous in chemical composition and appear to have low porosity.
3. A temperature threshold for accelerated deposition exists between 900°C and 1100°C for the test conditions presented herein.
4. Deposit thickness of samples developed in the accelerated testing facility generally increases as impingement angle increases to 90° (stagnation) and as particulate concentration in the flow increases at constant flow temperature and Mach number.
5. Since deposit structure, surface topography, and thickness all have direct influence on heat transfer, deposits generated in this accelerated facility are suitable for assessing the impact of deposition on turbine heat transfer.
ACKNOWLEDGEMENTS Various individuals provided invaluable support to this research effort. The authors would particularly like to thank the assistance provided by Dr. Ron Bunker at General Electric Research Center, Mr. Ihor Diakunchak at Siemens-Westinghouse, Dr. Hee-Koo Moon at Solar Turbines, Mr. Alan Pauch at Standard Aero Inc., and Mr. John Fintland at Advanced Filtration Concepts, Inc who each provided invaluable insight as well as hardware. This research would not have been possible without the support of BYU students James Wammack, John Pettitt, Dave Olson, and Dan Reimann who each worked long hours monitoring experiments and assisting with the build-up of the facility. The authors also thank BYU chemical engineering doctoral candidate Shrinivas Lokare for sharing his invaluable expertise in combustion experimentation and deposit processing. Lastly, the authors thank the gifted machinists of the BYU Precision Machining Lab and Ken Forster whose skills helped produce the accelerated deposit facility. This work was partially sponsored by the US Department of Energy – National Energy Technology Laboratory through a cooperative agreement with the South Carolina Institute for Energy Studies at Clemson University. The views expressed in this article are those of the authors and do not reflect the official policy or position of the Department of Energy or U.S. Government.
NOMENCLATURE M – flow Mach number Ra – centerline average roughness Rt – maximum peak to valley roughness Sw /S– total wetted surface area to planform area ratio T – flow temperature αrms - rms deviation of surface slope angles
REFERENCES [1] Ghenaiet, A., Elder, R. L., and Tan, S. C., “Particles and
Trajectories through an Axial Fan and Performance Degradation due to Sand Ingestion,” ASME Paper No. 2001-GT-497.
10
[2] Wenglarz, R. A., “An Approach for Evaluation of Gas Turbine Deposition”, ASME Journal of Engineering for Gas Turbines and Power, vol. 114, April, 1992.
[3] Kim, J., Dunn, M.G., and Baran, A.J. et al, 1993, “Deposition of Volcanic Materials in the Hot Sections of Two Gas Turbine Engines,” J. Engr. Gas Turbines & Power vol. 115, Jul 1993, pp 641-651.
[4] Bons, J. P., 2002, “St and Cf Augmentation for Real Turbine Roughness with Elevated Freestream Turbulence,” Transactions of the ASME, vol. 124, OCT 2002, pgs 632-644.
[5] Suao, Aoki, 2000, “Trend and Key Technologies for Gas Turbine Combined Cycle Power Generation in a Globally Competitive Market and Environmental Regulations,” Proceedings of the 2000 IJPG conference.
[6] Chan, K.S., Cheruvu, N.S., and Leverant, G.R., 1999, “Coating Life Prediction for Combustion Turbine Blades,” Transactions of the ASME, vol. 121, JUL 1999, pp. 484-488.
[7] Krishnan, Vaidyanathan, Kapat, J.S., Sohn, Y.H., and Desai, V.H., 2003, “Effect of Film Cooling on Low Temperature Hot Corrosion in a Coal Fired Gas Turbine,” presented at ASME Turbo Expo, Atlanta, GA, JUN 16-19, GT2003-38593.
[8] Tabakoff, W., and Wakeman, T., 1979, “Test Facility for Material Erosion at High Temperature,” ASTM Special Publication 664, pp. 123-135.
[9] Tabakoff, W., Metwally, M., and Hamed, A., 1995, “High-Temperature Coatings for Protection Against Turbine Deterioration,” Transactions of the ASME, vol. 117, JAN 1995, pgs 146-151.
[10] Walsh, P.N., Quest, J.M., Tucker, R.C. jr., 1995, “Coating for the Protection of Turbine Blades From Erosion,” Transactions of the ASME, vol. 117, JAN 1995, pp. 152-155.
[11] Zaita, A.V., Buley, G., Karlsons, G., 1998, “Performance Deterioration Modeling in Aircraft Gas Turbine Engines,” Transactions of the ASME, vl. 120, APR 1998, pp. 344-349.
[12] Wenglarz, R.A., and Wright, I.G., “Alternate Fuels for Land-Based Turbines,” published in proceedings of the "Workshop on Materials and Practices to Improve Resistance to Fuel Derived Environmental Damage in Land-and Sea-Based Turbines", October 22-24, 2002, Colorado School of Mines, Golden, Colorado.
[13] Toriz, F.C., Thakker, A.B., and Gupta, S.K., J. ASME, “Thermal Barrier Coatings for Jet Engines” 88-GT-279, (1988), (presented at the Gas Turbine and Aeroengine Congress Amsterdam, The Netherlands, June 6-9, 1988).
[14] Smialek, J.L., Archer, F.A., and Garlick, R.G. in F.H. Froes et al. (eds.), The Chemistry of Saudi Arabian Sand: A Deposition Problem on Helicopter Turbine Airfoils, Advances in Synthesis and Processes, SAMPE, 3, 1992, M92-M101.
[15] Bons, J.P., Taylor, R., McClain, S., and Rivir, R.B., “The Many Faces of Turbine Surface Roughness,” Journal of Turbomachinery, Vol. 123, No. 4, October 2001, pp. 739-748.
[16] Wenglarz, R.A., and Fox, R.G. Jr., 1990, “Physical Aspects of Deposition From Coal-Water Fuels Under Gas Turbine Conditions”, Journal of Engineering for Gas Turbines and Power, Jan 1990, pp. 9-14.
[17] Borom, Marcus P., Johnson, Curtis A., and Peluso, Louis A., 1996, “Role of environmental deposits and operating surface temperature in spallation of air plasma sprayed thermal barrier coatings,” Surface and Coatings Technology 86-87, pp116-126.
[18] Murray, Robert L., 1998, “Laser Doppler Anemometry Measurements in a Turbulent, Pre-mixed, Natural Gas/Air Combustor,” M.S. Thesis, BYU, p17.
[19] Seinfeld, John H., and Pandis, Spyros N. Atmospheric Chemistry and Physics. John Wiley & Sons, New York: 1998.
[20] Finlayson-Pitts, Barbara J., and Pitts, James N., jr. Chemistry of the Upper and Lower Atmosphere: Theory, Experiments, and Applications. Academic Press, San Diego: 1999.
[21] Ford, W.E., (revision), Dana’s Textbook of Mineralogy (after E.S. Dana) 4th edn., 16th printing, John Wiley & Sons, NY 1954, p379.
[22] Fintland, John, Advanced Filtration Concepts, Inc., CA, personal correspondence with Jared Jensen, 2003.
[23] Dunn, M. G., Padova, C., and Adams, R. E., 1987a, “Operation of Gas Turbine Engines in Dust-Laden Environments,” AGARD-Advanced Technology Aero Engine Components, Paris, France.
[24] Blair, M. F., 1994, “An Experimental Study of Heat Transfer in a Large-Scale Turbine Rotor Passage,” ASME J. Turbomch., 116(1), pp. 1-13.
[25] Boynton, J. L., Tabibzadeh, R., and Hudson, S. T., 1993, “Investigation of Rotor Blade Roughness Effects on Turbine Performance,” ASME J. Turbomach., 115, pp. 614-620.
[26] Sigal, A. and Danberg, J., 1990, “New Correlation of Roughness Density Effect on the Turbulent Boundary Layer,” AIAA Journal, Vol. 28, No. 3, March 1990, pp. 554-556.