1 SCIENTIFIC REPORTS | 6:23535 | DOI: 10.1038/srep23535 www.nature.com/scientificreports Simulated Raman correlation spectroscopy for quantifying nucleic acid-silver composites Lindsay M. Freeman, Alexei Smolyaninov, Lin Pang & Yeshaiahu Fainman Plasmonic devices are of great interest due to their ability to confine light to the nanoscale level and dramatically increase the intensity of the electromagnetic field, functioning as high performance platforms for Raman signal enhancement. While Raman spectroscopy has been proposed as a tool to identify the preferential binding sites and adsorption configurations of molecules to nanoparticles, the results have been limited by the assumption that a single binding site is responsible for molecular adsorption. Here, we develop the simulated Raman correlation spectroscopy (SRCS) process to determine which binding sites of a molecule preferentially bind to a plasmonic material and in what capacity. We apply the method to the case of nucleic acids binding to silver, discovering that multiple atoms are responsible for adsorption kinetics. This method can be applied to future systems, such as to study the molecular orientation of adsorbates to films or protein conformation upon adsorption. Silver nanoparticles functionalized with nucleic acids are unique platforms offering beneficial optical proper- ties that can be exploited for bioimaging and sensing applications, including generation of fluorescence 1–5 and enhancement of Raman signals 6–9 . e electron transfer between silver and nucleic acids creates electronic tran- sitions that induce a chemical resonance enhancement for surface-enhanced Raman spectroscopy (SERS) 10–13 , a valuable tool for molecular analysis that detects vibrational fingerprints 14–16 . e specific atoms of the nucleic acids (e.g. nitrogen atom N1 or N3 of adenine) that bind to the silver nanoparticles significantly affect the gener- ated chemical resonance enhancement as the charge-transfer between the nucleic acids and silver modulates the electronic transitions and the molecular configuration induces a change in the polarizability. erefore, deter- mining the preferential binding of atoms and molecular orientation of nucleic acids interacting with the silver surface assists with characterizing the optical system properties and enables a better understanding of the physical phenomena of enhanced fluorescence and Raman signals via DNA coated silver particles. Previously, researchers have attempted to identify the atomic binding sites via x-ray absorption 17 , surface-enhanced Infrared spectros- copy (SEIRS) 18 , scanning tunneling microscopy (STM) 19 , and SERS 20,21 . However, these methods primarily rely on qualitative analysis rather than quantitative correlation calculations and also assume that only one binding atom is responsible for the chemical bonding. Here, we quantitatively determine the preferential binding sites of each nucleic acid to silver by developing a simulated Raman correlation spectroscopy (SRCS) method, demon- strating experimentally that multiple atoms are responsible for molecular bonding and calculating the composi- tion of the binding sites to quantify these effects. e unique Raman signatures of the various potential binding sites are calculated using a time-dependent density functional theory (TD-DFT) method 22 and the simulated results are statistically analyzed and compared to experimental measurements in order to deduce the probabilities of the binding sites. e correlation coefficient between simulated and experimental Raman spectra is optimized to be greater than 0.8 by varying the composition of binding atoms to the silver surface until a maximum is found, revealing that nucleic acids have a mixture of preferential binding atoms to silver. e SRCS process for binding site determination can be applied to other research areas of interest, including quantitative analysis of tip-enhanced Raman scattering (TERS) to distinguish the orientation of molecules with respect to a surface 23 and SERS detection of protein conformation to metal films 24 . By attaching nucleic acids to silver nanoparticles or other plasmonic structures, the optical properties of such systems can be tuned in order to modify the function of these systems. us, certain characteristics can be either attenuated or amplified by understanding and controlling the way in which nucleic acids bind to the surface, as Department of Electrical and Computer Engineering, University of California San Diego, 9500 Gilman Drive, La Jolla, California 92093-0407, USA. Correspondence and requests for materials should be addressed to Y.P. (email: [email protected]) Received: 07 January 2016 Accepted: 08 March 2016 Published: 24 March 2016 OPEN
Simulated Raman correlation spectroscopy for quantifying nucleic acid-silver compositesLindsay M. Freeman, Alexei Smolyaninov, Lin Pang & Yeshaiahu Fainman
Plasmonic devices are of great interest due to their ability to confine light to the nanoscale level and dramatically increase the intensity of the electromagnetic field, functioning as high performance platforms for Raman signal enhancement. While Raman spectroscopy has been proposed as a tool to identify the preferential binding sites and adsorption configurations of molecules to nanoparticles, the results have been limited by the assumption that a single binding site is responsible for molecular adsorption. Here, we develop the simulated Raman correlation spectroscopy (SRCS) process to determine which binding sites of a molecule preferentially bind to a plasmonic material and in what capacity. We apply the method to the case of nucleic acids binding to silver, discovering that multiple atoms are responsible for adsorption kinetics. This method can be applied to future systems, such as to study the molecular orientation of adsorbates to films or protein conformation upon adsorption.
Silver nanoparticles functionalized with nucleic acids are unique platforms offering beneficial optical proper-ties that can be exploited for bioimaging and sensing applications, including generation of fluorescence1–5 and enhancement of Raman signals6–9. The electron transfer between silver and nucleic acids creates electronic tran-sitions that induce a chemical resonance enhancement for surface-enhanced Raman spectroscopy (SERS)10–13, a valuable tool for molecular analysis that detects vibrational fingerprints14–16. The specific atoms of the nucleic acids (e.g. nitrogen atom N1 or N3 of adenine) that bind to the silver nanoparticles significantly affect the gener-ated chemical resonance enhancement as the charge-transfer between the nucleic acids and silver modulates the electronic transitions and the molecular configuration induces a change in the polarizability. Therefore, deter-mining the preferential binding of atoms and molecular orientation of nucleic acids interacting with the silver surface assists with characterizing the optical system properties and enables a better understanding of the physical phenomena of enhanced fluorescence and Raman signals via DNA coated silver particles. Previously, researchers have attempted to identify the atomic binding sites via x-ray absorption17, surface-enhanced Infrared spectros-copy (SEIRS)18, scanning tunneling microscopy (STM)19, and SERS20,21. However, these methods primarily rely on qualitative analysis rather than quantitative correlation calculations and also assume that only one binding atom is responsible for the chemical bonding. Here, we quantitatively determine the preferential binding sites of each nucleic acid to silver by developing a simulated Raman correlation spectroscopy (SRCS) method, demon-strating experimentally that multiple atoms are responsible for molecular bonding and calculating the composi-tion of the binding sites to quantify these effects. The unique Raman signatures of the various potential binding sites are calculated using a time-dependent density functional theory (TD-DFT) method22 and the simulated results are statistically analyzed and compared to experimental measurements in order to deduce the probabilities of the binding sites. The correlation coefficient between simulated and experimental Raman spectra is optimized to be greater than 0.8 by varying the composition of binding atoms to the silver surface until a maximum is found, revealing that nucleic acids have a mixture of preferential binding atoms to silver. The SRCS process for binding site determination can be applied to other research areas of interest, including quantitative analysis of tip-enhanced Raman scattering (TERS) to distinguish the orientation of molecules with respect to a surface23 and SERS detection of protein conformation to metal films24.
By attaching nucleic acids to silver nanoparticles or other plasmonic structures, the optical properties of such systems can be tuned in order to modify the function of these systems. Thus, certain characteristics can be either attenuated or amplified by understanding and controlling the way in which nucleic acids bind to the surface, as
Department of Electrical and Computer Engineering, University of California San Diego, 9500 Gilman Drive, La Jolla, California 92093-0407, USA. Correspondence and requests for materials should be addressed to Y.P. (email: [email protected])
experienced when detecting the chirality of DNA strands grown on silver nanocrystals5 and controlling the plas-monic properties of silver nanoparticles incubated with nucleic acids9. While there have been reports of finding the preferred binding sites of nucleic acids to silver, such as adenine binding to silver via the amino group25, N120, N326, or N727 atoms, the reports are often inconclusive, contradictory, and limited to qualitative analysis. There exists a need to quantitatively analyze the multiple potential binding sites of nucleic acids to silver, while also exploring the favorable optical properties that such systems provide. The Raman signal, which is determined by the molecular structure of the nucleic acid and by slight changes to bond lengths and angles, can yield informa-tion regarding the stress and strain the system undergoes when certain atoms bind to the metal. When nucleic acids bind to silver, the orientation of the molecule with respect to the metal surface determines the polarizability of the system, leading to either enhanced or reduced Raman signal frequency modes depending on the molecular orientation with respect to the silver surface28. Therefore, by analyzing the calculated Raman signals of various atoms of nucleic acids binding to silver and comparing to experimental measurements, the preferred binding composition can be found and the nucleic acid silver system can be characterized quantitatively. Here, we develop the SRCS method to quantitatively compare simulated Raman spectra with experimental measurements, demon-strating the ability to discover and quantify the composition of binding sites of nucleic acid-silver composites. We calculate the composition of binding sites for each nucleic acid-silver composite and measure the correlation of the superimposed simulated Raman spectra to the experimental Raman spectrum. Thus, we have proven that multiple binding sites are responsible for adsorption within nucleic-acid silver composites and implemented a statistical based method to characterize such systems.
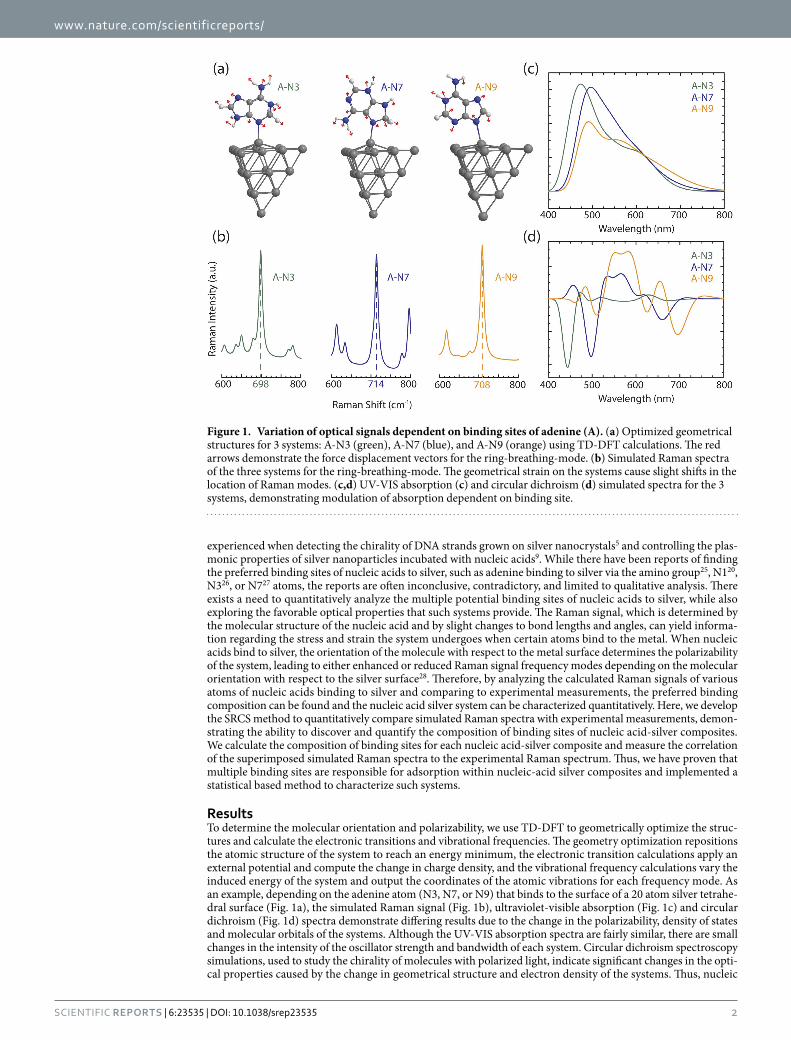
ResultsTo determine the molecular orientation and polarizability, we use TD-DFT to geometrically optimize the struc-tures and calculate the electronic transitions and vibrational frequencies. The geometry optimization repositions the atomic structure of the system to reach an energy minimum, the electronic transition calculations apply an external potential and compute the change in charge density, and the vibrational frequency calculations vary the induced energy of the system and output the coordinates of the atomic vibrations for each frequency mode. As an example, depending on the adenine atom (N3, N7, or N9) that binds to the surface of a 20 atom silver tetrahe-dral surface (Fig. 1a), the simulated Raman signal (Fig. 1b), ultraviolet-visible absorption (Fig. 1c) and circular dichroism (Fig. 1d) spectra demonstrate differing results due to the change in the polarizability, density of states and molecular orbitals of the systems. Although the UV-VIS absorption spectra are fairly similar, there are small changes in the intensity of the oscillator strength and bandwidth of each system. Circular dichroism spectroscopy simulations, used to study the chirality of molecules with polarized light, indicate significant changes in the opti-cal properties caused by the change in geometrical structure and electron density of the systems. Thus, nucleic
Figure 1. Variation of optical signals dependent on binding sites of adenine (A). (a) Optimized geometrical structures for 3 systems: A-N3 (green), A-N7 (blue), and A-N9 (orange) using TD-DFT calculations. The red arrows demonstrate the force displacement vectors for the ring-breathing-mode. (b) Simulated Raman spectra of the three systems for the ring-breathing-mode. The geometrical strain on the systems cause slight shifts in the location of Raman modes. (c,d) UV-VIS absorption (c) and circular dichroism (d) simulated spectra for the 3 systems, demonstrating modulation of absorption dependent on binding site.
acids functionalized to silver induce distinct and notable transformations to the optical characteristics compared to isolated nucleic acids or silver nanoparticles.
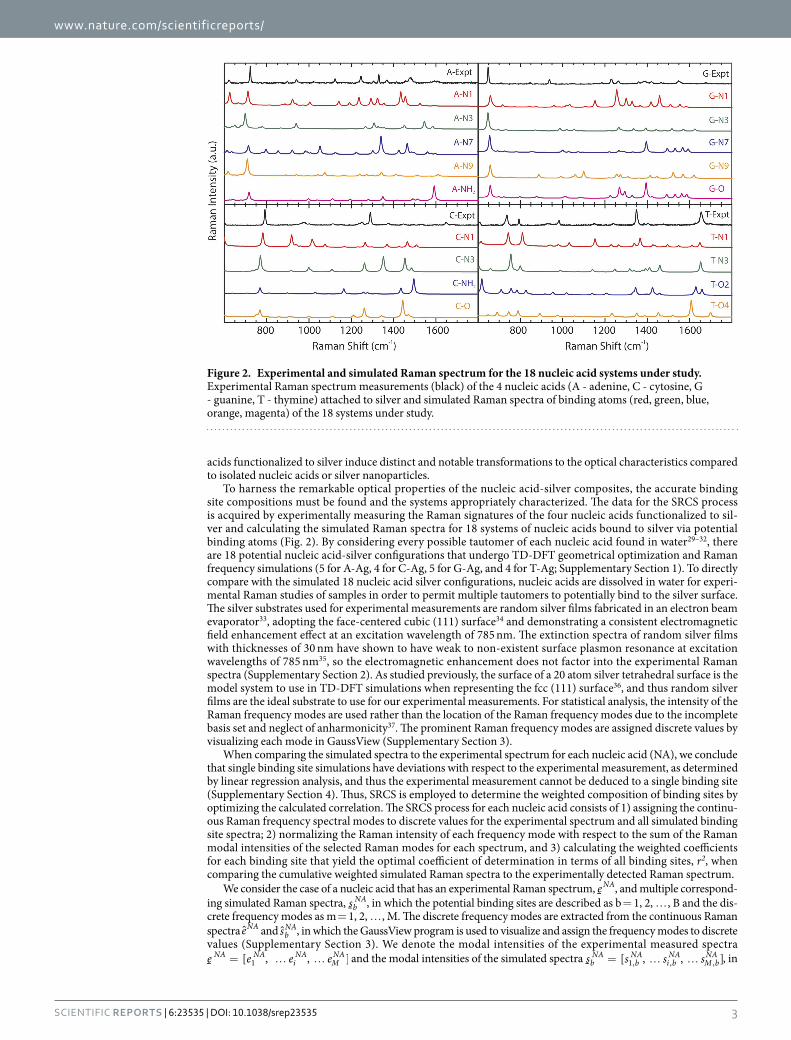
To harness the remarkable optical properties of the nucleic acid-silver composites, the accurate binding site compositions must be found and the systems appropriately characterized. The data for the SRCS process is acquired by experimentally measuring the Raman signatures of the four nucleic acids functionalized to sil-ver and calculating the simulated Raman spectra for 18 systems of nucleic acids bound to silver via potential binding atoms (Fig. 2). By considering every possible tautomer of each nucleic acid found in water29–32, there are 18 potential nucleic acid-silver configurations that undergo TD-DFT geometrical optimization and Raman frequency simulations (5 for A-Ag, 4 for C-Ag, 5 for G-Ag, and 4 for T-Ag; Supplementary Section 1). To directly compare with the simulated 18 nucleic acid silver configurations, nucleic acids are dissolved in water for experi-mental Raman studies of samples in order to permit multiple tautomers to potentially bind to the silver surface. The silver substrates used for experimental measurements are random silver films fabricated in an electron beam evaporator33, adopting the face-centered cubic (111) surface34 and demonstrating a consistent electromagnetic field enhancement effect at an excitation wavelength of 785 nm. The extinction spectra of random silver films with thicknesses of 30 nm have shown to have weak to non-existent surface plasmon resonance at excitation wavelengths of 785 nm35, so the electromagnetic enhancement does not factor into the experimental Raman spectra (Supplementary Section 2). As studied previously, the surface of a 20 atom silver tetrahedral surface is the model system to use in TD-DFT simulations when representing the fcc (111) surface36, and thus random silver films are the ideal substrate to use for our experimental measurements. For statistical analysis, the intensity of the Raman frequency modes are used rather than the location of the Raman frequency modes due to the incomplete basis set and neglect of anharmonicity37. The prominent Raman frequency modes are assigned discrete values by visualizing each mode in GaussView (Supplementary Section 3).
When comparing the simulated spectra to the experimental spectrum for each nucleic acid (NA), we conclude that single binding site simulations have deviations with respect to the experimental measurement, as determined by linear regression analysis, and thus the experimental measurement cannot be deduced to a single binding site (Supplementary Section 4). Thus, SRCS is employed to determine the weighted composition of binding sites by optimizing the calculated correlation. The SRCS process for each nucleic acid consists of 1) assigning the continu-ous Raman frequency spectral modes to discrete values for the experimental spectrum and all simulated binding site spectra; 2) normalizing the Raman intensity of each frequency mode with respect to the sum of the Raman modal intensities of the selected Raman modes for each spectrum, and 3) calculating the weighted coefficients for each binding site that yield the optimal coefficient of determination in terms of all binding sites, r2, when comparing the cumulative weighted simulated Raman spectra to the experimentally detected Raman spectrum.
We consider the case of a nucleic acid that has an experimental Raman spectrum, eNA, and multiple correspond-ing simulated Raman spectra, sb
NA, in which the potential binding sites are described as b = 1, 2, … , B and the dis-crete frequency modes as m = 1, 2, … , M. The discrete frequency modes are extracted from the continuous Raman spectra eNA and sb
NA, in which the GaussView program is used to visualize and assign the frequency modes to discrete values (Supplementary Section 3). We denote the modal intensities of the experimental measured spectra = … …e e e e[ , , ]NA NA
iNA
MNA
1 and the modal intensities of the simulated spectra = … …s s s s[ , , ]bNA
bNA
i bNA
M bNA
1, , , , in
Figure 2. Experimental and simulated Raman spectrum for the 18 nucleic acid systems under study. Experimental Raman spectrum measurements (black) of the 4 nucleic acids (A - adenine, C - cytosine, G - guanine, T - thymine) attached to silver and simulated Raman spectra of binding atoms (red, green, blue, orange, magenta) of the 18 systems under study.
which b designates the binding site (e.g., N1, N3). Then, the experimental Raman intensity of the frequency mode i is normalized to Ei
NA with the following equation:
=∑ =
E ee (1)
iNA i
NA
mM
mNA
1
in which eiNA is the experimental Raman intensity at a specific frequency mode i, ∑ = em
MmNA
1 is the sum of the experimental Raman intensities of frequency modes from 1 through M, and Ei
NA is the normalized experimental Raman intensity for mode i. The normalized modal intensities for the experimental Raman measurement can be designated as:
= … …E E E E[ , , , ] (2)NA NAiNA
MNA
1
For the case of the simulated Raman intensities, assuming the simulated spectrum is for a nucleic acid bound to silver via the binding site b, the normalized Raman intensity for mode i is represented by the following equation:
=∑ =
Ss
s (3)i bNA i b
NA
mM
m bNA,
,
1 ,
in which si bNA, is the simulated Raman intensity of a nucleic acid bound via binding site b at a specific frequency
mode i, ∑ = smM
m bNA
1 , is the sum of the simulated Raman intensities of a nucleic acid bound via binding site b from modes 1 to M and Si b
NA, is the normalized simulated Raman intensity mode of a nucleic acid bound via binding site
b for mode i. Thus, the normalized modal intensities for a simulated Raman measurement can be designated as:
= … …S S S S[ , , , , ] (4)bNA
bNA
i bNA
M bNA
1, , ,
Now, given the experimental discrete Raman mode intensities ENA, we assume that there is a set of corre-sponding weighted constants that maximize the correlation of ENA with respect to a linear superposition of a set of weighted spectra Sb
NA, where b = 1,2,… B. We define the weighted superimposed simulated spectra StotNA as:
∑==
S k S(5)tot
NA
b
B
bNA
bNA
1
where each value of kbNA represents the weighted constants for the corresponding simulated spectrum based on
binding site b. The weighted constants are normalized as:
∑ ==
k 1(6)b
B
bNA
1
Then, we vary the values of kbNA in equation 5 in order to optimize the correlation between the weighted spec-
tral modes Sm totNA
, of the simulated data StotNA and the measured spectral modes Em
NA of the experimental data ENA by using the following equation for the coefficient of determination:
=
∑ − ∑ ∑
∑ − ∑ ∑ − ∑
= = =
= = = =
rE S E S
E E S S ( ) ( ) ( ) ( ) (7)
mM
mNA
m totNA
mM
mNA
mM
m totNA
mM
mNA
mM
mNA
mM
m totNA
mM
m totNA
2 1 , 1 1 ,
12
12
1 ,2
1 ,2
2
The first two steps of the SRCS method are shown in Fig. 3a, in which the continuous Raman spectrum sbNA is
assigned discrete modes = … …s s s s[ , , ]bNA
bNA
i bNA
M bNA
1, , , and then normalized to generate SbNA. The value of r2 is
optimized for the case of adenine by varying the weighted constants of kbNA in equation 5 and calculating the value
of StotNA (Fig. 3b). The coefficient of determination given by r2 measures the linear correlation between an experi-
mental spectrum ENA and weighted calculated spectrum StotNA, with r2 = 1 corresponding to perfect correlation.
By applying signal processing techniques38, the weighted constants kbNA which produce an Stot
NA that maximizes r2 are calculated and represent the best possible compositional analysis of experimental binding sites within the limits and numerical accuracy of the simulated binding sites and determine how well the chosen weighted spectra works as a least squares estimator for the experimental spectrum.
The SRCS process is applied to all four nucleic acids, in which approximately 175,000 iterations of varying kbNA
to calculate StotNA and optimize r2 is conducted per nucleic acid (Fig. 4a), determining the optimized binding site
compositions for each nucleic acid (Fig. 4b, Table 1). To qualitatively compare the effectiveness of the SRCS pro-cess, the individual weighted binding site Raman spectra k Sb
NAbNA, the superimposed cumulative simulated
Raman spectrum StotNA, and the experimental Raman spectrum ENA are plotted (Fig. 4c). When comparing the
superimposed simulated Raman correlation spectrum to the experimental measurement, qualitative analysis clearly shows that the weighted composition calculated spectrum (gray) for each nucleic acid is in good agree-ment with the experimental Raman signature (black).
The high coefficients of determination and corresponding superimposed spectra demonstrate the efficiency of the SRCS process as a method to discover the preferential binding sites of each nucleic acid to silver. The
Figure 3. Discrete mode analysis and schematic diagram of SRCS. (a) The normalization procedure for each spectrum, in which the continuous spectrum sb
NA (top) is assigned discrete modal values m = [1,2,… ,M] and aligned with the corresponding experimental discrete modes eNA, described as a vector sb
NA (middle). The Raman intensity of each mode is then normalized using equation 3 to generate Sb
NA (bottom). (b) Flow diagram describing the SRCS process, in which the values of kb
NA are varied while calculating r2 using EmNA and Sm tot
NA,
given by equation 2 and equation 5, respectively.
Figure 4. Optimizing the coefficient of determinations with weighted correlation method. (a) The increase in the coefficient of determination (r2) as the number of iterations increases, resulting in r2 near 1, for the nucleic acids adenine (black), cytosine (red), guanine (green), and thymine (blue). (b) The optimized percent composition of each binding site to silver at the maximum coefficient of determination for each nucleic acid. Adenine shows the majority of binding comes from N3, N7, and N9. Cytosine is primarily bound to silver via the N3 atom. Guanine’s strongest binding atoms are N1 and N3. Thymine is strongly bound via the N1 and O4 atoms. (c) The weighted simulated Raman spectra k Sb
NAbNA for each binding site (top in A, C, G and T;
multicolored), the superimposed simulated Raman spectra StotNA for all the binding sites (middle in A, C, G and
T; gray), and the experimental measured Raman spectra ENA for each nucleic acid (bottom in A, C, G and T; black).
preferential binding sites of adenine to silver are N3, N7, and N9, with limited binding from NH2 and none from N1. For cytosine, the preferred binding site is N3 with moderate binding from NH2 and limited binding from N1 and O. The results of guanine demonstrate that there is no binding via the O atom, with moderate bonding from N1 and N3 and limited binding from N7 and N9. Finally, the N1 atom of thymine demonstrates the strongest binding to silver with roughly half of the molecules binding via the N1 site, with moderate bonding from O4 and limited bonding from N3 and O2. To explain the preference of specific binding sites to nucleic acids, we examine the physical existence of nucleic acid tautomers in water. Because nucleic acids exist as several tautom-ers upon interaction with water, there are a significant number of potential binding atoms available to bind to silver depending on the location of the hydrogen atom for each tautomer. The tautomers determine the available binding sites, such as when the N9H adenine tautomer enables the doubly bonded ring nitrogens to act as the preferential binding sites and electron donors, while prohibiting the N9 atom from binding to the silver surface. Thus, the composition of the preferential binding atoms is dependent on the prevalence of specific tautomers of the nucleic acids in water. For example, in the case of cytosine, it can be deduced that the N3H tautomer is present in a limited form in water because of the dominance of the N3 and NH2 as binding sites. This agrees well with a previous study, which determined that upon cytosine hydration, the N1H tautomer formed much more frequently than the N3H tautomer, enabling the doubly bonded ring nitrogen group on N3 to bind, while pro-hibiting the N1H site to bind to silver30. Therefore, in addition to determining the composition of binding sites of nucleic acids to silver, the SRCS method can yield insight into the population of specific tautomers in water. Additional factors that can determine preferential binding sites are the electron densities of the molecules and the geometrical constraints caused by steric effects and will be addressed in future work.
In this paper, we have developed and applied an SRCS statistical analysis method for determining the com-position of binding atoms of nucleic acids to silver using a quantitative statistical analysis process that compares calculated Raman spectra to experimental measurements. We have demonstrated that the SRCS method can deduce the relative composition of binding sites and quantitatively determine that certain sites (e.g. N1 in ade-nine, O in cytosine) do not play a significant role in binding to silver, while others (e.g. N3 in adenine, N3 in cytosine), are the primary binding sites with additional, less active binding sites (e.g. N7 and N9 in adenine, N1 in cytosine). Using a weighted simulated Raman correlation spectroscopy method, we have developed a process to optimize the coefficient of determination for comparing simulated Raman data to experimental measurements by adjusting the composition of binding sites. By optimizing the composition of the potential binding sites, we show that a mixture of orientations and configurations occur during experimental measurements and provide a method to use for binding analysis. Additionally, we demonstrate the efficiency of our method by comparing the experimental measurements to the superimposed simulated Raman spectra, showing excellent agreement and a high coefficient of determination. Finally, we compare the composition of binding atoms to previously published results, justifying that this method can be used to estimate the molecular dynamics of nucleic acids. This method lays the foundation for using computational simulations to study the assembly and surface chemistry of molecules on the nanoscale level and can be applied to many fields of study, including near-field characterization of mole-cule alignment and configuration of molecules with respect to metal surfaces.
MethodsTime-dependent density functional calculations of nucleic acid-silver complexes. TD-DFT is per-formed using the Gaussian 09 package22 for each potential binding site of the four nucleic acids to a 20 atom silver tetrahedral structure (Ag20), resulting in 18 unique systems for our study. The complete list of systems and their cor-responding atomic labels can be found in supplementary section 1. The nucleic acids bind to the surface (S), the ver-tex (V), or the edge (E) of the Ag20 face-centered cubic (fcc) lattice structure. The preferred binding site of the Ag20, as previously reported39, is the flat surface and the majority of the nucleic acid orientations prefer that site. However, there are some nucleic acid silver (NA-Ag) systems which are more stable when binding to the edge of the structure.
Binding Site r2 of Adenine r2 of Cytosine r2 of Guanine r2 of Thymine
N1 0.20 0.06 0.21 0.52
N3 0.73 0.71 0.78 0.44
N7 0.14 0.57
N9 0.62 0.55
NH2 0.02 0.16
O2 0.11 0.28 0.45
O4 0.41
Weighted Mixture 0.85 0.81 0.91 0.84
Optimized Compositions
37% N3 9% N1 32% N1 49% N1
31% N7 63% N3 40% N3 13% N3
30% N9 26% NH2 12% N7 9% O2
2% NH2 2% O 16% N9 29% O4
Table 1. Coefficients of determination for 18 single atom binding systems and the 4 optimized weighted composition binding site systems. The coefficient of determinations for single binding sites can be found in Supplementary Section 4. The coefficient of determination increases when accounting for a mixture binding sites for each nucleic acid, such as thymine which went from a r2 value of 0.52 (T-N1) to a value of 0.84 (48% T-N1, 14% T-N3, 9% T-O2, 29% T-O4).
The TD-DFT calculations were performed using Gaussian 0922 software on the Gordon supercomputer at the University of California, San Diego40. All 18 structures are geometrically optimized using the B3LYP method41 and LANL2DZ42 basis set. B3LYP is chosen as the density functional theory method as it uses both generalized gradient approximations and the local-density approximation and has been shown to be an accurate model for molecules attached to the Ag20 structure. LANL2DZ is used to account for the silver atoms. A very tight conver-gence criterion was used and a super fine grid of 150,974 and 225,974 was required for the nucleic acid atoms and silver atoms, respectively. Once optimized, each structure is confirmed to have no negative frequency, showing successful convergence.
The electronic transitions and Raman frequencies are calculated via Gaussian 09, using the same basis set and method as the geometric optimization. TD-DFT calculates Raman optical activities for each mode, which are converted to Raman intensities using the following relationship43:
σ
Ωπ ν ν
π ν
α γ
∂
∂=
−
−
=
+
ν−
e
hc
S
S ddQ
ddQ
245
( )
18
45 7
j j
jj
jj j
4 40
4
2
2 2
hc jkT
where σ is the Raman cross-section, Ω is the depolarization ratio, ν 0 is the frequency of the incident light, ν j is the frequency of the vibrational mode, Sj is the Raman scattering factor, α is the polarizability, γ is the anisotropic polarizability, and Qj is the normal coordinate. An incident wavelength of 785 nm and a temperature of 293 K are used to match experimental conditions. The simulated Raman spectra is plotted by applying a Lorentzian fit for each Raman intensity mode, using a total of 3000 points between 400 cm−1 and 4000 cm−1 with a full-width half maximum of 10 cm−1. Because TD-DFT overestimates the location of the frequency mode due to the neglect of electron correlation and anharmonicity44, a scaling factor of 0.9891 for 600 cm−1 to 1000 cm−1 and of 0.9568 for 1000 cm−1 to 1800 cm−1 is used, as determined for the B3LYP method and LANL2DZ basis set45. Simulated Raman spectra are obtained for each of the 18 systems.
Experimental Raman measurements of nucleic acids. For the experimental nucleic acid Raman data, silver films are fabricated by depositing 300 Å of silver using an e-beam evaporator (Temescal BJD, UCSD Nano3 Cleanroom) on a silicon wafer. The scanning electron beam (SEM) image of the surface films can be found in sup-plementary section 2. Nucleic acids are deposited at a concentration of 1 mM and are incubated on the silver films overnight. Before measuring the Raman spectra, the samples are rinsed with H2O to remove any large particles. The Raman measurements are acquired using a Renishaw Raman spectrometer at a wavelength of 785 nm. The sample is imaged using a 40x objective and the spectra are recorded with the hyperSpec program. A 60 s acquisi-tion time is used with a Raman spectral range of 550–2000 cm−1. Baseline subtraction is performed to ensure all spectra are aligned with the x-axis.
References1. Díez, I. & Ras, R. H. A. Fluorescent silver nanoclusters. Nanoscale 3, 1963–70 (2011).2. Han, B. & Wang, E. DNA-templated fluorescent silver nanoclusters. Anal. Bioanal. Chem. 402, 129–38 (2012).3. Vosch, T. et al. Strongly emissive individual DNA-encapsulated Ag nanoclusters as single-molecule fluorophores. Proc. Natl. Acad.
Sci. USA 104, 12616–21 (2007).4. Soto-Verdugo, V., Metiu, H. & Gwinn, E. The properties of small Ag clusters bound to DNA bases. J. Chem. Phys. 132, 195102
(2010).5. Shemer, G. et al. Chirality of silver nanoparticles synthesized on DNA. J. Am. Chem. Soc. 128, 11006–7 (2006).6. Barhoumi, A., Zhang, D., Tam, F. & Halas, N. J. Surface-enhanced Raman spectroscopy of DNA. J. Am. Chem. Soc. 130, 5523–9
(2008).7. Green, M., Liu, F.-M., Cohen, L., Kollensperger, P. & Cass, T. SERS platforms for high density DNA arrays. Faraday Discuss. 132, 269
(2006).8. Freeman, L. M., Pang, L. & Fainman, Y. Maximizing the electromagnetic and chemical resonances of surface-enhanced Raman
scattering for nucleic acids. ACS Nano 8, 8383–91 (2014).9. Basu, S., Jana, S., Pande, S. & Pal, T. Interaction of DNA bases with silver nanoparticles: assembly quantified through SPRS and
SERS. J. Colloid Interface Sci. 321, 288–93 (2008).10. King, F. W., Van Duyne, R. P. & Schatz, G. C. Theory of Raman scattering by molecules adsorbed on electrode surfaces. J. Chem.
Phys. 69, 4472 (1978).11. Otto, A., Timper, J., Billmann, J. & Pockrand, I. Enhanced Inelastic Light Scattering from Metal Electrodes Caused by Adatoms.
Phys. Rev. Lett. 45, 46–49 (1980).12. Albrecht, M. G. & Creighton, J. A. Anomalously intense Raman spectra of pyridine at a silver electrode. J. Am. Chem. Soc. 99,
5215–5217 (1977).13. Graham, D., Thompson, D. G., Smith, W. E. & Faulds, K. Control of enhanced Raman scattering using a DNA-based assembly
process of dye-coded nanoparticles. Nat. Nanotechnol. 3, 548–51 (2008).14. Kneipp, K., Kneipp, H., Itzkan, I., Dasari, R. R. & Feld, M. S. Surface-enhanced Raman scattering and biophysics. J. Phys. Condens.
Matter 14, R597–R624 (2002).15. Fan, M., Andrade, G. F. S. & Brolo, A. G. A review on the fabrication of substrates for surface enhanced Raman spectroscopy and
their applications in analytical chemistry. Anal. Chim. Acta 693, 7–25 (2011).16. Le Ru, E. C. & Etchegoin, P. G. Single-molecule surface-enhanced Raman spectroscopy. Annu. Rev. Phys. Chem. 63, 65–87 (2012).17. Feyer, V. et al. Bonding at the organic/metal interface: Adenine to Cu(110). Phys. Rev. B 79, 155432 (2009).18. Rodes, A. et al. Adenine Adsorption at Single Crystal and Thin-Film Gold Electrodes: An In Situ Infrared Spectroscopy Study.
J. Phys. Chem. C 113, 18784–18794 (2009).19. Kelly, R. E. A. et al. An investigation into the interactions between self-assembled adenine molecules and a Au(111) surface. Small
20. Kim, S. K., Joo, T. H., Suh, S. W. & Kim, M. S. Surface-enhanced Raman scattering (SERS) of nucleic acid components in silver sol: Adenine series. J. Raman Spectrosc. 17, 381–386 (1986).
21. Muniz-Miranda, M. et al. SERS and Computational Studies on MicroRNA Chains Adsorbed on Silver Surfaces. J. Phys. Chem. C 114, 13730–13735 (2010).
22. Frisch, M. J. et al. Gaussian 09 Revision D.01. (2009).23. Jiang, S. et al. Distinguishing adjacent molecules on a surface using plasmon-enhanced Raman scattering. Nat. Nanotechnol. 10,
865–869 (2015).24. Yang, W. & Hu, Y. Conformations of 2-thiouracil in the aqueous solution and its adsorption behavior on the gold substrates explored
by DFT calculations and experimental methods. Spectrochim. Acta. A. Mol. Biomol. Spectrosc. 134, 399–405 (2015).25. Suh, J. S. & Moskovits, M. Surface-enhanced Raman spectroscopy of amino acids and nucleotide bases adsorbed on silver. J. Am.
Chem. Soc. 108, 4711–4718 (1986).26. Kundu, J. et al. Adenine− and Adenosine Monophosphate (AMP)− Gold Binding Interactions Studied by Surface-Enhanced Raman
and Infrared Spectroscopies. J. Phys. Chem. C 113, 14390–14397 (2009).27. Koglin, E., Séquaris, J.-M., Fritz, J.-C. & Valenta, P. Surface enhanced raman scattering (SERS) of nucleic acid bases adsorbed on
silver colloids. J. Mol. Struct. 114, 219–223 (1984).28. Valley, N., Greeneltch, N., Van Duyne, R. P. & Schatz, G. C. A Look at the Origin and Magnitude of the Chemical Contribution to
the Enhancement Mechanism of Surface-Enhanced Raman Spectroscopy (SERS): Theory and Experiment. J. Phys. Chem. Lett. 4, 2599–2604 (2013).
29. Kim, H.-S., Ahn, D.-S., Chung, S.-Y., Kim, S. K. & Lee, S. Tautomerization of adenine facilitated by water: computational study of microsolvation. J. Phys. Chem. A 111, 8007–12 (2007).
30. Shukla, M. K. & Leszczynski, J. Interaction of Water Molecules with Cytosine Tautomers: An Excited-State Quantum Chemical Investigation. J. Phys. Chem. A 106, 11338–11346 (2002).
31. Shishkin, O. V., Sukhanov, O. S., Gorb, L. & Leszczynski, J. The interaction of the most stable guanine tautomers with water. Phys. Chem. Chem. Phys. 4, 5359–5364 (2002).
32. Chandra, A. K., Nguyen, M. T. & Zeegers-Huyskens, T. Theoretical Study of the Interaction between Thymine and Water. Protonation and Deprotonation Enthalpies and Comparison with Uracil. J. Phys. Chem. A 102, 6010–6016 (1998).
33. Perumal, J., Kong, K. V., Dinish, U. S., Bakker, R. M. & Olivo, M. Design and fabrication of random silver films as substrate for SERS based nano-stress sensing of proteins. RSC Adv. 4, 12995 (2014).
34. Fournée, V., Rossa, A. R., Lograsso, T. A. & Thiel, P. A. Orientation relationship between metallic thin films and quasicrystalline substrates. MRS Proc. 805, LL8.3 (2003).
35. Gupta, R., Dyer, M. J. & Weimer, W. A. Preparation and characterization of surface plasmon resonance tunable gold and silver films. J. Appl. Phys. 92, 5264 (2002).
36. Zhao, L., Jensen, L. & Schatz, G. C. Pyridine-Ag20 cluster: a model system for studying surface-enhanced Raman scattering. J. Am. Chem. Soc. 128, 2911–9 (2006).
37. Tantirungrotechai, Y. et al. Scaling factors for vibrational frequencies and zero-point vibrational energies of some recently developed exchange-correlation functionals. J. Mol. Struct. THEOCHEM 760, 189–192 (2006).
38. Papoulis, A. The Fourier Integral and its Applications (Mcgraw-Hill College, 1962).39. Sun, M., Liu, S., Chen, M. & Xu, H. Direct visual evidence for the chemical mechanism of surface-enhanced resonance Raman
scattering via charge transfer. J. Raman Spectrosc. 40, 137–143 (2009).40. Towns, J. et al. XSEDE: Accelerating Scientific Discovery. Comput. Sci. Eng. 16, 62–74 (2014).41. Becke, A. D. A new mixing of Hartree–Fock and local density-functional theories. J. Chem. Phys. 98, 1372 (1993).42. Hay, P. J. & Wadt, W. R. Ab initio effective core potentials for molecular calculations. Potentials for the transition metal atoms Sc to
Hg. J. Chem. Phys. 82, 270 (1985).43. Polavarapu, P. L. Ab initio vibrational Raman and Raman optical activity spectra. J. Phys. Chem. 94, 8106–8112 (1990).44. Alecu, I. M., Zheng, J., Zhao, Y. & Truhlar, D. G. Computational Thermochemistry: Scale Factor Databases and Scale Factors for
Vibrational Frequencies Obtained from Electronic Model Chemistries. J. Chem. Theory Comput. 6, 2872–2887 (2010).45. Kesharwani, M. K., Brauer, B. & Martin, J. M. L. Frequency and zero-point vibrational energy scale factors for double-hybrid density
functionals (and other selected methods): can anharmonic force fields be avoided? J. Phys. Chem. A 119, 1701–14 (2015).
AcknowledgementsThis work was supported by the National Science Foundation (NSF), the NSF Center for Integrated Access Networks, the Office of Naval Research Multi-Disciplinary Research Initiative, the Defense Advanced Research Projects Agency (DARPA), and the Cymer Corporation. The views, opinions and/or findings expressed are those of the author and should not be interpreted as representing the official views or policies of the Department of Defense or the U.S. Government. The authors thank Prof. Michael J. Sailor of the UCSD Department of Chemistry and Biochemistry for the use of his Renishaw Raman spectrometer. This work used the Extreme Science and Engineering Discovery Environment (XSEDE), which is supported by National Science Foundation grant number ACI-1053575. In addition, the authors would like to thank the creators of GaussSum and Avogadro.
Author ContributionsL.M.F. performed the simulations and acquired the experimental data. A.S. developed the SRCS algorithm. L.M.F., L.P. and Y.F. contributed to data interpretation and co-wrote the manuscript. All authors discussed the results and commented on the manuscript.
Additional InformationSupplementary information accompanies this paper at http://www.nature.com/srepCompeting financial interests: The authors declare no competing financial interests.How to cite this article: Freeman, L. M. et al. Simulated Raman correlation spectroscopy for quantifying nucleic acid-silver composites. Sci. Rep. 6, 23535; doi: 10.1038/srep23535 (2016).
This work is licensed under a Creative Commons Attribution 4.0 International License. The images or other third party material in this article are included in the article’s Creative Commons license,
unless indicated otherwise in the credit line; if the material is not included under the Creative Commons license, users will need to obtain permission from the license holder to reproduce the material. To view a copy of this license, visit http://creativecommons.org/licenses/by/4.0/