Agronomy Journa l • Volume 105 , I s sue 1 • 2013 37
Biometry, Modeling & Statistics
Simulating Dryland Water Availability and Spring Wheat Production in the Northern Great Plains
Zhiming Qi,* Patricia N. S. Bartling, Jalal D. Jabro, Andrew W. Lenssen, William M. Iversen, Lajpat R. Ahuja, Liwang Ma, Brett L. Allen, and Robert G. Evans
Spring wheat (Triticum aestivum L., excluding durum wheat) was harvested on 5.35 million ha of croplands in the
United States in 2011, with 89.1% occurring in the northern Great Plains (NGP) states including North Dakota, Montana, Minnesota, and South Dakota. Montana had the highest percentage of spring wheat acreage (31.3%) among all spring wheat production states (National Agricultural Statistics Service, 2011a). Th e 2007 Census of Agriculture showed that about half of the spring wheat acreage in Montana was under a continuous spring wheat production system, while the other half was in a 2-yr spring wheat–fallow system. Most of this spring wheat area (95.4%) was rainfed (National Agricultural Statistics Service, 2007).
Th e lack of available water for crop growth is the primary factor aff ecting dryland spring wheat production in the NGP. A spring wheat yield trial conducted at Sidney, MT, with >70 cultivars during 2005 to 2009 showed that the yield of dryland wheat was about 30% less than that of the irrigated crop (J. Eckoff , personal communication, 2010). Brown et al. (1981) reported that spring wheat yield increased 135 kg ha–1 with every centimeter increase
in plant water use in Montana and North Dakota. A similar relationship between spring wheat yield and plant-available water was also found in the inland Pacifi c Northwest (Schillinger et al., 2008). Winter wheat yields in the central Great Plains increased by 141 kg ha–1 for every centimeter increase in plant-available water in the soil at planting (Nielsen et al., 2002) and by 125 kg ha–1 for every centimeter of water uptake aft er 13 cm of water use (Nielsen et al., 2011).
Various management strategies have been proposed and applied to cope with soil water shortage for dryland spring wheat production in the NGP, including no-till and reduced tillage with residue mulching and crop rotations. Fenster (1973) reported that the soil water storage effi ciency increased from 16 to 31% in Montana by adding surface residue cover during summer fallow. Nielsen and Vigil (2010) reported that precipitation storage effi ciency during the fallow period of a winter wheat–fallow system increased from 20% with conventional tillage fallow management to 35% for no-till management in Colorado. In general, a higher percentage of residue cover would lead to higher soil water storage (Tanaka and Aase, 1987). Lenssen et al. (2007) documented that zero tillage oft en provided higher soil water content at planting; however, Deibert et al. (1986) found that a diff erence in water storage between no-till and tilled fi eld in North Dakota was not evident
ABSTRACTAgricultural system models are useful tools to synthesize fi eld experimental data and to extrapolate results to longer periods of weather and to other cropping systems. Th e objectives of this study were: (i) to quantify the eff ects of crop management practices and tillage on soil water and spring wheat (Triticum aestivum L.) production in a continuous spring wheat system using the RZWQM2 model (coupled with CERES-Wheat) under a dryland condition, and (ii) to extend the RZWQM2 model results to longer term weather conditions and propose alternate cropping systems and management practices. Measured soil water content, yield, and total aboveground biomass under diff erent tillage and plant management practices were used to calibrate and evaluate the RZWQM2 model. Th e model showed no impacts of tillage but late planting greatly reduced grain yield and biomass, in agreement with observed diff erences among treatments. Th e hydrologic analysis under long-term climate variability showed a large water defi cit (32.3 cm) for spring wheat. Fallowing the cropland every other year conserved 4.2 cm of water for the following wheat year, of which only 1.7 cm water was taken up by wheat, resulting in a yield increase of 249 kg ha–1 (13.7%); however, the annualized mean yield decreased 782 kg ha–1 (43.1%) due to 1 yr of fallow. Other long-term simulations showed that optimal planting dates ranged from 1 March to 10 April and the seeding rates with optimum economic return were 3.71 and 3.95 × 10⁶ seeds ha–1 for conventional and ecological management treatments, respectively.
Z. Qi, P.N.S. Bartling, L.R. Ahuja, L. Ma, USDA-ARS Agricultural Systems Research Unit, Fort Collins, CO 80526; Z. Qi currently at Dep. of Bioresource Engineering, Macdonald Campus, McGill Univ., Ste-Anne-de-Bellevue, QC H9X 3V9, Canada; J.D. Jabro, W.M. Iversen, B.L. Allen, R.G. Evans, USDA-ARS Northern Plains Agricultural Research Lab., Sidney, MT 59270; and A.W. Lenssen, Dep. of Agronomy, Iowa State Univ., Ames, IA 50011. Received 4 June 2012. *Corresponding author ([email protected]). Abbreviations: CERES, Crop Estimation through Resource and Environment
Synthesis; CTC, conventional tillage, conventional management; CTE, conventional tillage, ecological management; DAP, days aft er planting; DSSAT, Decision Support System for Agrotechnology Transfer; ET, evapotranspiration; NGP, northern Great Plains; NSE, Nash–Sutcliff e model effi ciency; NTC, no-till, conventional management; NTE, no-till, ecological management; PBIAS, percent bias; RMSD, root mean squared deviation; RSpR, root mean squared deviation/pooled sample variance ratio; RZWQM2, Root Zone Water Quality Model 2.
38 Agronomy Journa l • Volume 105, Issue 1 • 2013
and neither was a diff erence in evapotranspiration between continuous spring wheat and spring wheat–fallow treatments.
For better weed control, a delay in planting from mid-April to mid-May for spring wheat has been proposed to allow mechanical weed control before planting (Sainju et al., 2011). Th is delay, however, reduces the length of the growth period, which could reduce biomass accumulation. Furthermore, the associated changes in phenology might alter the timing of water stress relative to plant development, possibly reducing dryland crop yield. To compensate for a short growing season and less biomass accumulation, and to suppress weed competition, a higher seeding rate is used when the spring wheat is planted in mid-May. Th e late planting date along with a high seeding rate is called ecological management, as opposed to the conventional management with a customary planting date and seeding rate.
Agricultural system models, which include the interactions among the various processes and factors in the system, are useful tools to evaluate various agronomic management practices aft er careful calibration. Th e Root Zone Water Quality Model 2 (RZWQM2) including Decision Support System for Agrotechnology Transfer (DSSAT) version 4.0 cropping system models has been successfully used to simulate water availability and crop production under long-term weather conditions and various management practices. Th orp et al. (2007) and Qi et al. (2011) documented that the RZWQM2 model adequately simulated hydrology, crop yield, and N dynamics during the evaluation period. Th e model was then used to predict crop production and water balance during 40 to 45 yr. Using the successfully validated RZWQM2 model, Ma et al. (2007) and Malone et al. (2007) simulated crop yield and water quality under additional fertilization, drainage, and crop management practices. In the semiarid Great Plains, Saseendran et al. (2005) reported that both RZWQM2 and Crop Estimation through Resource and Environment Synthesis (CERES)-Maize models accurately predicted the observed decline in corn (Zea mays L.) yield with delayed planting dates. Th e RZWQM2 model adequately simulated the yield and biomass for dryland winter wheat, corn, and proso millet (Panicum miliaceum L. ssp. miliaceum) in semiarid eastern Colorado, and the model was subsequently used to simulate crop yield under potential crop rotations (Saseendran et al., 2010).
Limited information is available on the simulation of spring wheat water use and yield in the semiarid NGP. Chipanshi et al. (1997) reported a successful simulation study for spring wheat production using CERES-Wheat version 3.5 at three sites in central and southern Saskatchewan, Canada, and the ratio of simulated to observed total aboveground biomass at various growth stages ranged from 0.64 to 1.62 across the three locations. An earlier modeling study conducted in Saskatchewan suggested, however, that both CERES and Erosion/Productivity Impact Calculator (EPIC) simulated the annual spring wheat yield poorly, even though the predicted long-term mean yield was reasonable (Moulin and Beckie, 1993). Th e purpose of this study was to simulate water availability and spring wheat production under conventional and ecological management practices in the NGP under both tilled and no-till treatments using RZWQM2 with DSSAT
version 4.0, CERES-Wheat model included. Th e specifi c objectives of this modeling study were to: (i) quantify the eff ect of planting date, seeding rate, and tillage on dryland spring wheat production in terms of soil water, yield, and biomass; and (ii) extend the results to longer term weather conditions and propose alternate cropping system and management practices.
MATERIALS AND METHODSRoot Zone Water Quality Model 2
Th e RZWQM2 (version 2.40) is a one-dimensional agricultural system model including hydrology, nutrient and pesticide transport and transformation, plant growth, and management practice components (Ahuja et al., 2000). Infi ltration from rainfall, irrigation, and snowmelt is computed using the Green–Ampt equation. Water redistribution in the soil profi le, considering plant uptake as a sink, is simulated by the Richards equation. When the incoming water fl ux exceeds the soil infi ltration capacity, the diff erence will be diverted into macropore fl ow if there are macropores; otherwise this excessive water becomes off -site runoff . Th e nutrient chemistry processes model incorporated in RZWQM2 is OMNI (Shaff er et al., 2000). Th e DSSAT family (version 4.0) of cropping system models (CROPGRO and CERES) was incorporated into RZWQM2 (Ma et al., 2005, 2006), and the CERES-Wheat model (Jones et al., 2003; Ritchie et al., 1998) was used in this study.
Field Experiment and Measurements
Th e fi eld experiment was conducted from 2004 to 2010 on the Rasmussen dryland farm site, located 11 km west of Sidney (47°46′ N, 104°16′ W) in eastern Montana. Th e soil was mapped as a Williams loam (a fi ne-loamy, mixed, superactive, frigid Typic Argiustoll) formed in calcareous glacial till parent material with 0 to 4% slope. Wheat yield, aboveground biomass, and soil water content in continuous spring wheat treatments were compared under various management practices including tillage, planting date, seeding rate, and stubble height. Th e treatment factors were tillage (conventional tillage and no-till) and plant management (conventional and ecological management). In the ecological management, spring wheat was planted later but with a higher seeding rate compared with conventional management. Th is 2 × 2 factorial experiment design resulted in four treatments: conventional tillage, conventional management (CTC), conventional tillage, ecological management (CTE), no-till, conventional management (NTC), and no-till, ecological management (NTE). Th e treatments were arranged in three randomized complete blocks using a split-plot design with tillage practice as the main plots. Th ere were three replications for each treatment, and each individual plot measured 12 by 12 m.
Conventional tillage before planting was one-pass fi eld cultivation to a depth of 7 to 8 cm with C-shank sweeps at 45-cm spacing and 60-cm-length coil-tooth spring harrows. Th e conventional management treatment had customary planting dates (mid- to late April), with a customary seeding rate (2.22 × 10⁶ seeds ha–1), while the ecological management treatment included later planting dates (about 3–4 wk later than conventional management) with a higher seeding rate (2.97 × 10⁶ seeds ha–1). Urea fertilizer was broadcast before
Agronomy Journa l • Volume 105, Issue 1 • 2013 39
planting for the conventionally managed spring wheat, while urea for the ecological management treatments was banded at planting 5 cm beneath and to the side of seed. Nitrogen fertilizer was applied at a rate of 107 kg N ha–1 in 2004 to 2008 and at approximately 50 kg N ha–1 in 2009 and 2010 based on a soil NO3 test and target yield. Phosphate (as monoammonium phosphate at 11–52–0 [N–P2O5–K2O]) and potash (as KCl at 0–0–60 [N–P2O5–K2O]) were also banded at planting at 56 and 45 kg ha–1, respectively.
Th e climate data needed to run the RZWQM2 model were collected from an automated weather station starting in 2000 and are available at the Northern Plains Agricultural Research Laboratory weather network (http://216.228.51.248/awn/). Soil particle size distribution and bulk density were measured in 2010. Soil cores were used to measure the bulk density and water content from oven-dried undisturbed soil cores as the mass of oven-dried soil per volume of core. Th e particle size distribution was determined using the hydrometer method (Bouyoucos, 1962).
Th e soil water content was measured by lowering a neutron probe to fi ve depths of 23, 46, 61, 91, and 122 cm. Th ese measured soil moisture at these depths were used to represent the soil water content in soil layers of 0 to 34, 34 to 53, 53 to 76, 76 to 107, and 107 to 120 cm. Th e depth increment was shorter for the 0- to 76-cm depth to get a better resolution of measured soil moisture. Th e neutron probe was calibrated in the laboratory using a barrel method with soil obtained from the fi eld site packed to the original bulk density (Chanasyk and Naeth, 1996). Total aboveground biomass was measured at harvest by clipping all the wheat plants within two randomly located 0.5-m2 quadrats in each plot. For each quadrat, harvest tillers were counted and wheat grain was sampled to measure the kernel weight. A small-plot combine was used to harvest seven rows of wheat in the center of each plot to measure the grain yield.
Model Inputs and Calibration
Field management parameters for the model simulation, such as sowing and harvest dates, seeding rates, fertilization, stubble height, as well as tillage, were obtained through fi eld observation and management records. Th e weather data, including hourly precipitation, daily maximum and minimum air temperatures, solar radiation, wind speed, and relative humidity, were examined for outliers before being input into the model. Soil bulk density and soil texture were measured
from fi eld samples obtained from the experimental site, while the hydraulic parameters in Brooks and Corey (1964) were determined from the observed soil water data. Crop growth and development parameters were calibrated against the observed yield and biomass data.
Th e calibration was conducted following the protocol provided by Ma et al. (2011, 2012). Th e protocol suggested two options for a model calibration strategy: select one treatment in one or multiple years or use multiple treatments in 1 yr. In this study, we chose to use the data from one treatment for all the years (2004–2010), which included wet (2010), average (2005), and dry (2008) years. Th e CTC treatment was selected as the calibration treatment. We fi rst calibrated the model for soil moisture, then biomass, and fi nally yield. Th is parameterization sequence was then iterated three to four times. Besides comparing the simulated yield, biomass, and soil water with the measured values, we also checked model outputs for unmeasured variables such as anthesis and maturity dates to ensure that they were close to reported dates in the literature.
Soil Hydraulic Parameters
Soil hydraulic parameters, which were mainly calibrated against soil water content data, as well as measured bulk density and soil texture, are listed in Table 1. Th e saturated hydraulic conductivity and residual soil water content were computed using the pedotransfer function package Rosetta using bulk density and soil texture (Schaap et al., 1998). Th e bubbling pressure (also known as the air-entry pressure, hb) and pore size distribution index (λ) of the Brooks–Corey equation were initially taken from default values in Ma et al. (2011) and subsequently calibrated with the measured soil water content of each soil layer. In our case, the default hb and λ, in general, led to an overestimation of soil moisture for all layers. Th e Brooks and Corey parameters for all soil layers were adjusted manually layer by layer from top to bottom. Our experience showed that λ was more sensitive than hb in soil water simulation. Th e λ value was increased to reduce the overall simulated soil water content, and the hb value was further reduced to get a better fi t of low soil moisture during the summer.
Crop Parameters
Crop parameters were manually adjusted to fi t the measured biomass and yield components. Because phenology was not recorded in this study, parameters that aff ect the growing
Table 1. Measured soil bulk density (BD) and texture and calibrated hydraulic properties of bubbling pressure (hb), pore size dis-tribution index (λ), saturated hydraulic conductivity (Ksat), residual (θr) and saturated (θs) water contents, and water contents at 10 (θ10), 33 (θ33) and 1500 (θ1500) kPa for Williams loam soil near Sidney, MT.
season length were estimated from the literature. Th e DSSAT 4.0 version of CERES-Wheat for spring wheat has not been tested in the NGP but an earlier version 3.5 was calibrated for southern Saskatchewan and Alberta, Canada (Chipanshi et al., 1997; Toure et al., 1995). Th e parameters in those studies with CERES version 3.5 were converted to equivalents for CERES version 4.0.
Th e parameter P1V (vernalization days) was set equal to zero because it is generally accepted that spring wheat does not need to be vernalized; in the literature, assigned model values of P1V ranged from 0 to 30 d (Toure et al., 1995; Chipanshi et al., 1997; McMaster et al., 2008). Although Sherman et al. (2010) stated that Reeder spring wheat was insensitive to photoperiod, the parameter P1D (development reduction) was adjusted to a value of 21%, suggesting a low sensitivity to photoperiod, rather than zero, which would lead to a shorter simulated growing season length. Th is value is higher than 12% reported by Th orp et al. (2010). It is comparable to the 20% of Toure et al. (1995) for a long-term simulation in southern Alberta but much lower than the 60% suggested for spring wheat in the NGP (Godwin et al., 1990) and the calibrated value of 40% for spring wheat in Saskatchewan, Canada (Chipanshi et al., 1997). Because the anthesis or maturity dates were not recorded, we fi rst used estimated phenology dates from the North Dakota Agricultural Weather Network (NDAWN) for spring wheat planted at Sidney, MT, during 2004 to 2010 and subsequently adjusted the thermal units (P1–P4) required in the vegetative stages, along with the grain-fi lling duration (P5), to get an average growing season length of 106 d aft er planting (DAP), which was reported by Talbert et al. (2001). Selecting the default ecotype of DS3585 in the CERES-Wheat ecotype database in general produced simulated phenology dates close to those estimated by NDAWN. Th e values for P1, P2, P3, P4, and P5 were fi nally set as 400, 350, 160, 300, and 400°C d, respectively, with some values comparable to results for winter wheat in Th orp et al. (2010). Th e thermal unit for the interval between successive leaf tip appearances (PHINT) was set as 100 to simulate seven or eight leaves at maturity.
Aft er calibration of the crop development parameters, eff orts were made to adjust other crop growth and yield parameters. Th e conversion rates of photosynthetically active radiation to dry matter at the vegetative and reproductive stages, PARUV and PARUR, respectively, were adjusted manually to obtain a good fi t with the measured biomass and average measured harvest index of 0.36. Both parameters were set at 2.2 g MJ–1 aft er several iterations with grain yield calibration because the biomass accumulated during vegetative growth and grain yield at maturity were interactively infl uenced by each other. Th e CERES-Wheat model predicts kernel number per head based on the stem weight at anthesis. In the crop yield component, the parameter G3, which controls the mortality or abortion rate of tillers experiencing water stress and heat stress, was set to 1.5 to better fi t the observed average number of harvest tillers. Th e G1 and G2 parameters directly aff ect grain yield in the CERES-Wheat model: G1 controls the kernel number per unit canopy weight at anthesis and G2 is the standard kernel size under optimum conditions. Kernel weight at harvest was measured in this study, with values ranging from 12.7 mg kernel–1 in a NTC plot in 2008 to 40.2 mg kernel–1
in another NTC plot in 2009. Th eoretically, G2 should be set greater than the observed maximum value of 40.2 mg kernel–1. Attempts were made to simulate yield with an optimum kernel size value >40.2 mg kernel–1, but the kernel size was consistently overestimated for all years. To get a reasonable simulation in yield with a large kernel size, the kernel number (G1) had to be set equal to an extremely low value, which was out of the lower range of 15 to 30 kernels per unit gram weight of canopy in Ma et al. (2011). Th erefore, in this study, we used the measured average kernel size of 30 mg kernel–1 to get a reasonable simulation in kernel number and yield at harvest. Th e value of G1 was thereaft er set at 15.8 kernels per unit of canopy weight for better grain yield simulation.
Statistical Analysis
A number of statistical methods were used to quantify the goodness-of-fi t of simulated data with observed information. In this study, we used percent bias (PBIAS), Nash–Sutcliff e model effi ciency (NSE; Nash and Sutcliff e, 1970), root mean squared deviation (RMSD, also known as root mean squared error), and RMSD/pooled sample variance ratio (RSpR). Equations for these statistical approaches can be found in Ma et al. (2012).
Because one of the objectives of this study was to simulate the diff erences under various treatments, the model performance was considered acceptable when the simulation results refl ected the measured treatment diff erences, as stated in Ma et al. (2011). For specifi c components of the simulation, such as yield, biomass, and soil water content, the criteria to justify the goodness-of-fi t were set in accordance with the literature. In this study, model performance was defi ned “acceptable” when PBIAS was within ±15% (Ritchie et al., 1998; Hanson et al., 1999; Ahuja et al., 2000), NSE was >0.5 (Moriasi et al., 2007), and RSpR was ≤1.5. Th e RSpR limit indicates that the simulated error is less than 1.5 times the experiment error when RSpR is ≤1.5.
Model Application to an Extended Climate
A 50-yr weather data set (1961–2010) for Sidney, MT, was used to assess the long-term impacts of current management practices (CTC, CTE, NTC, and NTE) on spring wheat yield production. Th e 50-yr weather data were collected from various sources. For the years from 2000 to 2010, all the weather information needed to drive RZWQM2 was site-specifi cally measured and downloaded from the Northern Plains Agricultural Research Laboratory website. For the years of 1961 to 1999, precipitation, air temperature, and solar radiation for Sidney, MT, were downloaded from the National Climate Data Center (NCDC; global and U.S. daily surface data, www.ncdc.noaa.gov) and the National Solar Radiation Database (NSRDB, http://rredc.nrel.gov/solar/old_data/nsrdb/). Precipitation during 2000 to 2010 was recorded at 15-min intervals and aggregated to hourly precipitation, while during 1961 to 1999, precipitation was only available on a daily basis and was evenly distributed across 6 h in each day in which precipitation occurred. Th e wind speed and relative humidity for Sidney, MT, during 1961 to 1999 were obtained from the closest neighboring site at Williston, ND, which is 60 km from Sidney, MT, also available at the NCDC Climate Data
Agronomy Journa l • Volume 105, Issue 1 • 2013 41
Online website. Th e relative humidity was calculated from dew point temperature and daily maximum and minimum air temperature according to Allen et al. (1998). Solar radiation data for Sidney, MT, was available only from 1991 on; for the years 1961 to 1990, the solar radiation at a neighboring site at Glasgow, MT, was used. Glasgow was the closest site that had the best quality of data (a Class I site as listed at the NSRDB website). We compared the solar radiation data for those two sites of Glasgow and Sidney. Th e 15-yr (1991–2005) average daily solar radiation was 13.76 MJ m–2 d–1 for Sidney and 13.78 MJ m–2 d–1 for Glasgow. For the spring wheat growing season (April–August), the average daily solar radiation was 20.95 and 21.37 MJ m–2 d–1 for Sidney and Glasgow, respectively. Before being input into the model, quality control was done for all the data by plotting them vs. date to examine outliers and by calculating annual averages or sums to identify unusual trends.
We ran the calibrated model continuously with the long-term weather data to compare crop yield under continuous wheat–wheat and wheat–fallow cropping systems. For wheat–fallow, we simulated both wheat–fallow and fallow–wheat rotations and present the results as averages of the two rotations to eliminate weather diff erences between odd and even years. Th e calibrated model was also used to determine the optimal planting dates and an optimal seeding rate for spring wheat in Sidney, MT, by running the calibrated model for 50 yr (1961–2010) with planting dates varying from 20 February to 20 May each year with an interval of 10 or 11 d and a seeding rate ranging from 1.73 × 10⁶ to 1.48 × 10⁷ seeds ha–1. Net return was calculated by subtracting seed cost from grain yield income for use in calculating the optimum seeding rate. We assumed a wheat grain price of US$0.28 kg–1 (US$7.70 bu–1) and a price for hard red spring wheat seed of US$0.51 kg–1 (US$14.0 bu–1) based on the local prices reported for March 2011 (National Agricultural Statistics Service, 2011b).
Fig. 1. Observed (OBS) and simulated (SIM) soil water content and soil water storage under spring wheat at Sidney, MT, for the calibration conventional tillage, conventional management treatment. Simulations were done with RZWQM2 with CERES-Wheat.
42 Agronomy Journa l • Volume 105, Issue 1 • 2013
RESULTS AND DISCUSSIONModel Calibration (2004–2010)
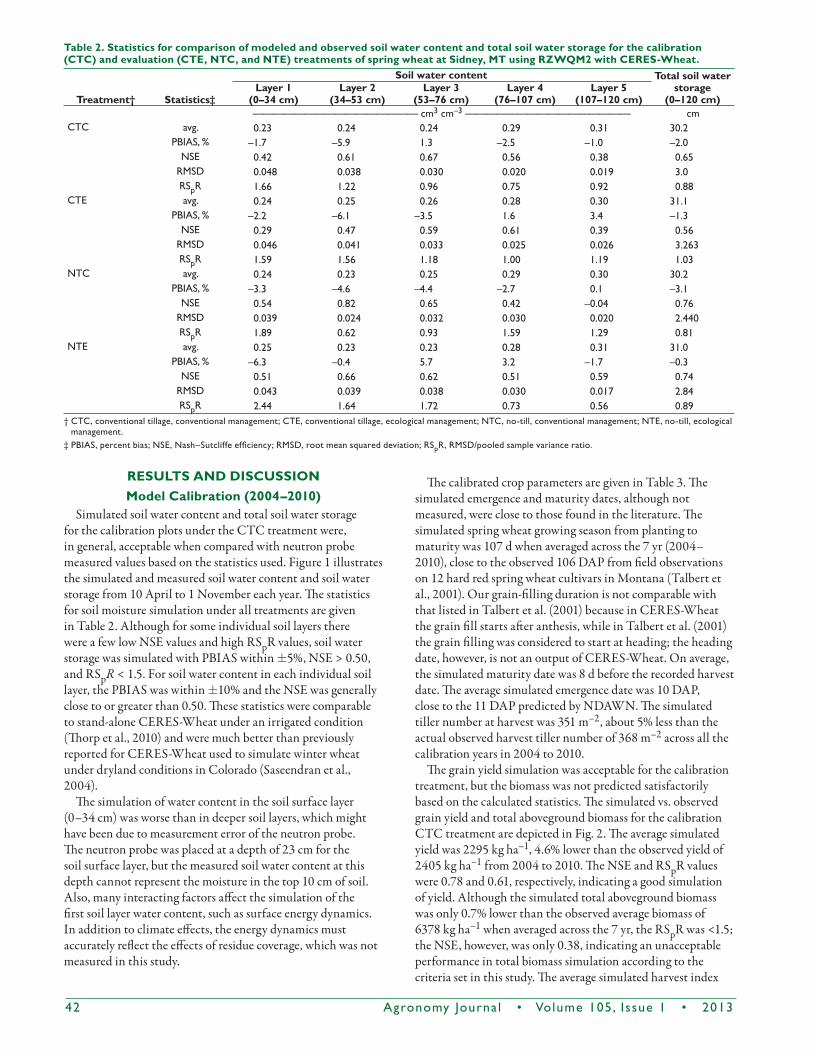
Simulated soil water content and total soil water storage for the calibration plots under the CTC treatment were, in general, acceptable when compared with neutron probe measured values based on the statistics used. Figure 1 illustrates the simulated and measured soil water content and soil water storage from 10 April to 1 November each year. Th e statistics for soil moisture simulation under all treatments are given in Table 2. Although for some individual soil layers there were a few low NSE values and high RSpR values, soil water storage was simulated with PBIAS within ±5%, NSE > 0.50, and RSpR < 1.5. For soil water content in each individual soil layer, the PBIAS was within ±10% and the NSE was generally close to or greater than 0.50. Th ese statistics were comparable to stand-alone CERES-Wheat under an irrigated condition (Th orp et al., 2010) and were much better than previously reported for CERES-Wheat used to simulate winter wheat under dryland conditions in Colorado (Saseendran et al., 2004).
Th e simulation of water content in the soil surface layer (0–34 cm) was worse than in deeper soil layers, which might have been due to measurement error of the neutron probe. Th e neutron probe was placed at a depth of 23 cm for the soil surface layer, but the measured soil water content at this depth cannot represent the moisture in the top 10 cm of soil. Also, many interacting factors aff ect the simulation of the fi rst soil layer water content, such as surface energy dynamics. In addition to climate eff ects, the energy dynamics must accurately refl ect the eff ects of residue coverage, which was not measured in this study.
Th e calibrated crop parameters are given in Table 3. Th e simulated emergence and maturity dates, although not measured, were close to those found in the literature. Th e simulated spring wheat growing season from planting to maturity was 107 d when averaged across the 7 yr (2004–2010), close to the observed 106 DAP from fi eld observations on 12 hard red spring wheat cultivars in Montana (Talbert et al., 2001). Our grain-fi lling duration is not comparable with that listed in Talbert et al. (2001) because in CERES-Wheat the grain fi ll starts aft er anthesis, while in Talbert et al. (2001) the grain fi lling was considered to start at heading; the heading date, however, is not an output of CERES-Wheat. On average, the simulated maturity date was 8 d before the recorded harvest date. Th e average simulated emergence date was 10 DAP, close to the 11 DAP predicted by NDAWN. Th e simulated tiller number at harvest was 351 m–2, about 5% less than the actual observed harvest tiller number of 368 m–2 across all the calibration years in 2004 to 2010.
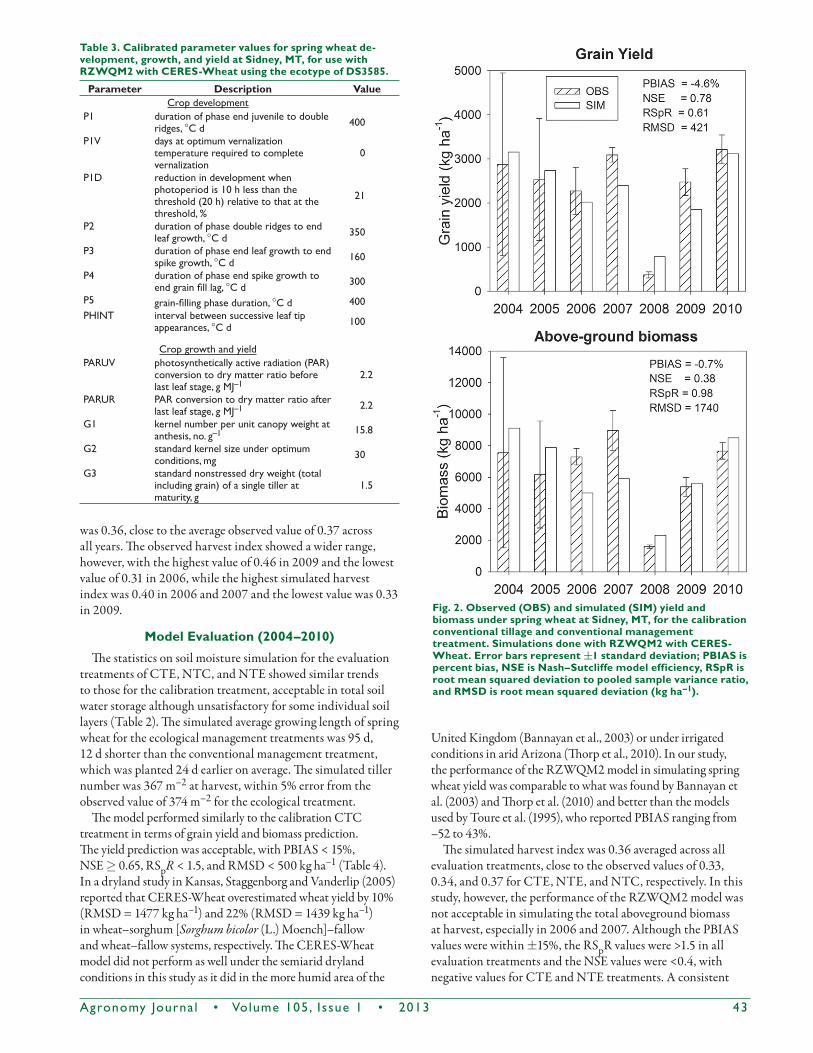
Th e grain yield simulation was acceptable for the calibration treatment, but the biomass was not predicted satisfactorily based on the calculated statistics. Th e simulated vs. observed grain yield and total aboveground biomass for the calibration CTC treatment are depicted in Fig. 2. Th e average simulated yield was 2295 kg ha–1, 4.6% lower than the observed yield of 2405 kg ha–1 from 2004 to 2010. Th e NSE and RSpR values were 0.78 and 0.61, respectively, indicating a good simulation of yield. Although the simulated total aboveground biomass was only 0.7% lower than the observed average biomass of 6378 kg ha–1 when averaged across the 7 yr, the RSpR was <1.5; the NSE, however, was only 0.38, indicating an unacceptable performance in total biomass simulation according to the criteria set in this study. Th e average simulated harvest index
Table 2. Statistics for comparison of modeled and observed soil water content and total soil water storage for the calibration (CTC) and evaluation (CTE, NTC, and NTE) treatments of spring wheat at Sidney, MT using RZWQM2 with CERES-Wheat.
Treatment† Statistics‡
Soil water content Total soil water storage
(0–120 cm)Layer 1
(0–34 cm)Layer 2
(34–53 cm)Layer 3
(53–76 cm)Layer 4
(76–107 cm)Layer 5
(107–120 cm)———————————————— cm3 cm–3 ———————————————— cm
was 0.36, close to the average observed value of 0.37 across all years. Th e observed harvest index showed a wider range, however, with the highest value of 0.46 in 2009 and the lowest value of 0.31 in 2006, while the highest simulated harvest index was 0.40 in 2006 and 2007 and the lowest value was 0.33 in 2009.
Model Evaluation (2004–2010)
Th e statistics on soil moisture simulation for the evaluation treatments of CTE, NTC, and NTE showed similar trends to those for the calibration treatment, acceptable in total soil water storage although unsatisfactory for some individual soil layers (Table 2). Th e simulated average growing length of spring wheat for the ecological management treatments was 95 d, 12 d shorter than the conventional management treatment, which was planted 24 d earlier on average. Th e simulated tiller number was 367 m–2 at harvest, within 5% error from the observed value of 374 m–2 for the ecological treatment.
Th e model performed similarly to the calibration CTC treatment in terms of grain yield and biomass prediction. Th e yield prediction was acceptable, with PBIAS < 15%, NSE ≥ 0.65, RSpR < 1.5, and RMSD < 500 kg ha–1 (Table 4). In a dryland study in Kansas, Staggenborg and Vanderlip (2005) reported that CERES-Wheat overestimated wheat yield by 10% (RMSD = 1477 kg ha–1) and 22% (RMSD = 1439 kg ha–1) in wheat–sorghum [Sorghum bicolor (L.) Moench]–fallow and wheat–fallow systems, respectively. Th e CERES-Wheat model did not perform as well under the semiarid dryland conditions in this study as it did in the more humid area of the
United Kingdom (Bannayan et al., 2003) or under irrigated conditions in arid Arizona (Th orp et al., 2010). In our study, the performance of the RZWQM2 model in simulating spring wheat yield was comparable to what was found by Bannayan et al. (2003) and Th orp et al. (2010) and better than the models used by Toure et al. (1995), who reported PBIAS ranging from –52 to 43%.
Th e simulated harvest index was 0.36 averaged across all evaluation treatments, close to the observed values of 0.33, 0.34, and 0.37 for CTE, NTE, and NTC, respectively. In this study, however, the performance of the RZWQM2 model was not acceptable in simulating the total aboveground biomass at harvest, especially in 2006 and 2007. Although the PBIAS values were within ±15%, the RSpR values were >1.5 in all evaluation treatments and the NSE values were <0.4, with negative values for CTE and NTE treatments. A consistent
Table 3. Calibrated parameter values for spring wheat de-velopment, growth, and yield at Sidney, MT, for use with RZWQM2 with CERES-Wheat using the ecotype of DS3585.
Parameter Description ValueCrop development
P1 duration of phase end juvenile to double ridges, °C d 400
P1V days at optimum vernalization temperature required to complete vernalization
0
P1D reduction in development when photoperiod is 10 h less than the threshold (20 h) relative to that at the threshold, %
21
P2 duration of phase double ridges to end leaf growth, °C d 350
P3 duration of phase end leaf growth to end spike growth, °C d 160
P4 duration of phase end spike growth to end grain fi ll lag, °C d 300
P5 grain-fi lling phase duration, °C d 400PHINT interval between successive leaf tip
appearances, °C d 100
Crop growth and yieldPARUV photosynthetically active radiation (PAR)
conversion to dry matter ratio before last leaf stage, g MJ–1
2.2
PARUR PAR conversion to dry matter ratio after last leaf stage, g MJ–1 2.2
G1 kernel number per unit canopy weight at anthesis, no. g–1 15.8
G2 standard kernel size under optimum conditions, mg 30
G3 standard nonstressed dry weight (total including grain) of a single tiller at maturity, g
1.5
Fig. 2. Observed (OBS) and simulated (SIM) yield and biomass under spring wheat at Sidney, MT, for the calibration conventional tillage and conventional management treatment. Simulations done with RZWQM2 with CERES-Wheat. Error bars represent ±1 standard deviation; PBIAS is percent bias, NSE is Nash–Sutcliffe model efficiency, RSpR is root mean squared deviation to pooled sample variance ratio, and RMSD is root mean squared deviation (kg ha–1).
44 Agronomy Journa l • Volume 105, Issue 1 • 2013
underestimation of biomass was found in 2006 and 2007 for all treatments, from –18 to –52%. One reason for this underestimation might be the high sampling error due to the limited number (two) of small quadrats in each plot sampling in all years. For example, the total aboveground biomass in the three replicate plots for the CTE were 7547, 2324, and 1328 kg ha–1 in 2004, leading to a coeffi cient of variance (ratio of standard deviation to mean) of 89%.
Ma et al. (2011) stated that the performance of a model may be considered acceptable when it responds correctly to the diff erences among treatments. Although the aboveground biomass simulation was not acceptable according to the statistical analyses used in this study, both simulated yield and biomass responded correctly to the treatment diff erences. Field data analysis showed that no impact of tillage on yield and biomass was evident, while they were greatly infl uenced by management, with a 23 and 16% reductions in yield and biomass, respectively, in the ecological management treatments. Average grain yields in the conventional and ecological management systems were 2438 vs. 1870 kg ha–1 for the fi eld observation and 2280 vs. 1890 kg ha–1 for the simulation. For grain yield, the simulated reduction due to the ecological treatments was 17.1% compared with the conventional treatments, which was close to the observed reduction of 23.3%. For biomass, the simulated and observed reductions due to ecological treatments were 16.7 and 16.0%, respectively, when compared with the conventional management treatment. Th e model captured the low yield and biomass in the dry year, which is essential for model application under dryland conditions. Although the low yields were consistently overestimated, the simulated yield and biomass in the dry year of 2008 were much less than those simulated in other years, thus matching the observed trends.
Water and Temperature Effects (2004–2010)
A useful application of the agricultural system model is to aid in identifying and analyzing cause-and-eff ect relationships. In this study, plant-available soil water rather
than soil N was found to be a major factor aff ecting yield. Both fi eld observations and simulations showed high yield in wet years (i.e., 2010) and low yield in dry years (i.e., 2008). Th e simulation showed no N stress for all years, which was supported by fi eld observations. In 2009 and 2010 when the N application was about 50 kg ha–1, approximately 50% of N applied in other years, the observed data indicated that yields at the low N rate in 2009 and 2010 were comparable to the high N rate with a similar rainfall pattern in 2004 and 2005.
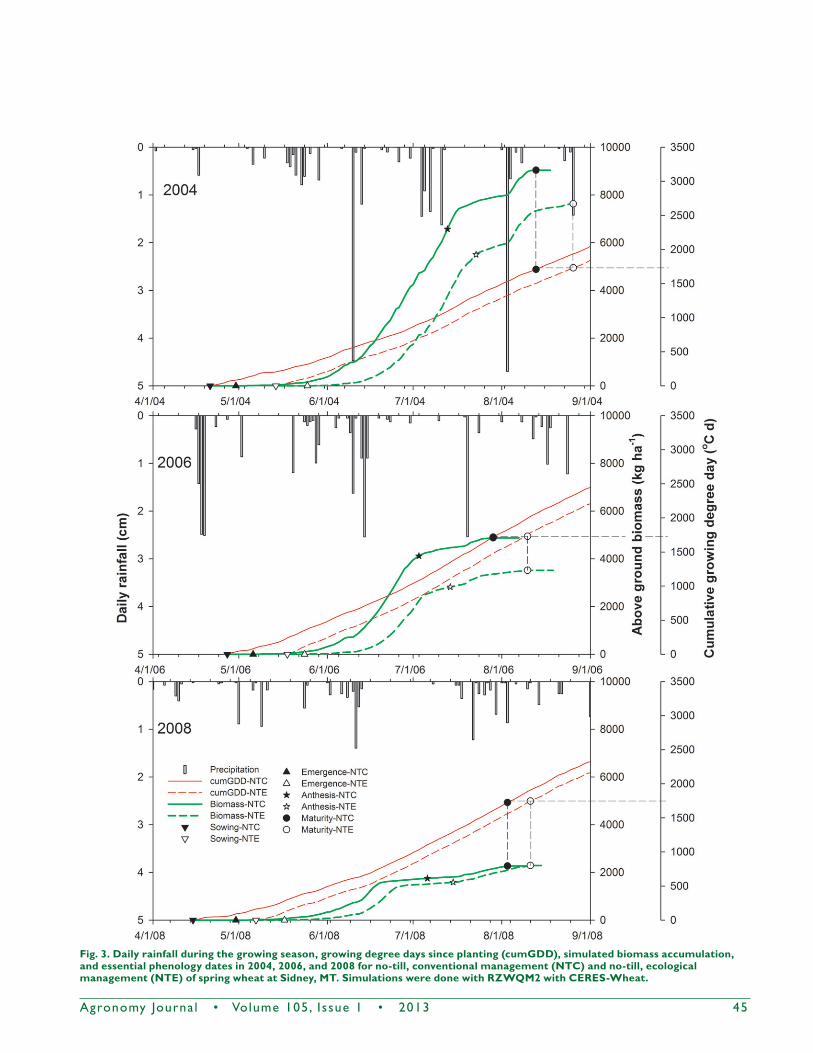
Th e model can also help understand the impact of rainfall and temperature on crop production. Figure 3 depicts the daily rainfall from April to August, cumulative growing degree days since planting, and simulated values of biomass accumulation and phenology in 2004, 2006, and 2008 for the NTC and NTE treatments under no-till as an example. In 2008, the total rainfall during the growing season from April to August was 12.4 cm, about 50% of the long-term average. Th e extremely low rainfall in 2008 translated to an extremely low biomass accumulation. Th e rainfall distribution pattern or timing also aff ected crop growth. During the growing season in 2006, the total rainfall was 24.8 cm, similar to that in 2004. Simulated total aboveground biomass at harvest in 2006 was 54% of that in 2004 for NTC and 46% for NTE, however, due to a long dry period from mid-June to early August in 2006.
Figure 3 also shows temperature eff ects on the duration of crop growth. Th e slope of the cumulative growing degree days was steeper in 2006 than in 2004. For example, for the NTC treatment, the cumulative growing degree days on 31 Aug. 2006 was 2434°C d since planting, while in 2004 it was 2024°C d, which was 16.8% lower than in 2006, although the planting date in 2006 was later than in 2004. Th is indicates a warmer temperature during the growing season in 2006. Th e average temperature during April through August in 2004 was 14.1°C, while it was 17.5°C in 2006. Th e 3.4°C increase in temperature in 2006 resulted in a signifi cantly shorter growing period in 2006. For the NTC treatment, the simulated maturity date in 2004 was 114 DAP, while it was 93 DAP in 2006.
Table 4. Observed and simulated wheat grain yield for all evaluation treatments (CTE, conventional tillage, ecological manage-ment; NTC, no-till, conventional management; NTE, no-till, ecological management) at Sidney, MT. Simulations were done with RZWQM2 with CERES-Wheat.
YearCTE NTC NTE
Observed Simulated Observed Simulated Observed Simulated———————————————————————— kg ha–1 ————————————————————————
† Standard deviations in parentheses.‡ PBIAS, percent bias; NSE, Nash–Sutcliffe effi ciency; RMSD, root mean squared deviation; RSpR, RMSD/pooled sample variance ratio.
Agronomy Journa l • Volume 105, Issue 1 • 2013 45
Fig. 3. Daily rainfall during the growing season, growing degree days since planting (cumGDD), simulated biomass accumulation, and essential phenology dates in 2004, 2006, and 2008 for no-till, conventional management (NTC) and no-till, ecological management (NTE) of spring wheat at Sidney, MT. Simulations were done with RZWQM2 with CERES-Wheat.
46 Agronomy Journa l • Volume 105, Issue 1 • 2013
Model Application (1961–2010)
Long-Term YieldWeather data analysis indicated that the spring growing
season in the recent 10 yr was relatively dry and cool at Sidney, MT. April to August precipitation in 2001 to 2010 averaged 21.4 cm, about 2 cm less than the 50-yr average. Th e average maximum temperature in that decade was 15.7°C, slightly lower than the long-term average (Sainju et al., 2011). In general, compared with long-term averages (1961–2010), the weather was wet and cool in 1961 to 1970, wet and warm in 1991 to 2000, and dry and warm in 1981 to 1990.
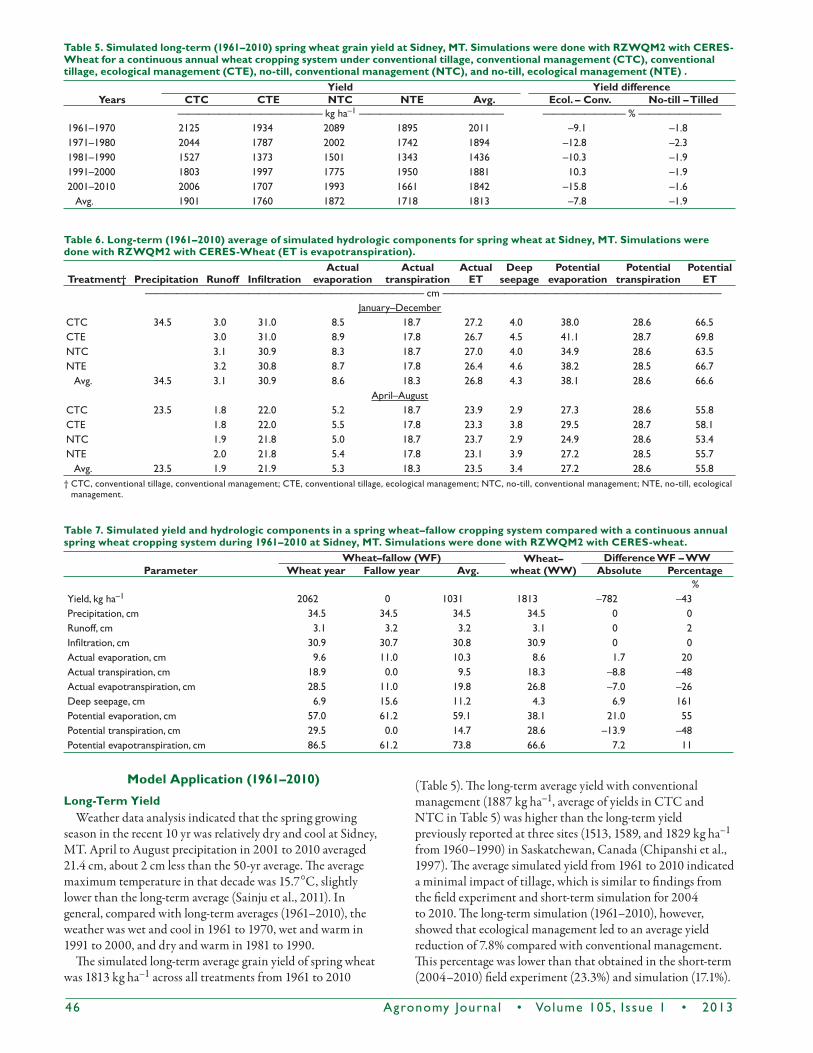
Th e simulated long-term average grain yield of spring wheat was 1813 kg ha–1 across all treatments from 1961 to 2010
(Table 5). Th e long-term average yield with conventional management (1887 kg ha–1, average of yields in CTC and NTC in Table 5) was higher than the long-term yield previously reported at three sites (1513, 1589, and 1829 kg ha–1 from 1960–1990) in Saskatchewan, Canada (Chipanshi et al., 1997). Th e average simulated yield from 1961 to 2010 indicated a minimal impact of tillage, which is similar to fi ndings from the fi eld experiment and short-term simulation for 2004 to 2010. Th e long-term simulation (1961–2010), however, showed that ecological management led to an average yield reduction of 7.8% compared with conventional management. Th is percentage was lower than that obtained in the short-term (2004–2010) fi eld experiment (23.3%) and simulation (17.1%).
Table 5. Simulated long-term (1961–2010) spring wheat grain yield at Sidney, MT. Simulations were done with RZWQM2 with CERES-Wheat for a continuous annual wheat cropping system under conventional tillage, conventional management (CTC), conventional tillage, ecological management (CTE), no-till, conventional management (NTC), and no-till, ecological management (NTE) .
Table 6. Long-term (1961–2010) average of simulated hydrologic components for spring wheat at Sidney, MT. Simulations were done with RZWQM2 with CERES-Wheat (ET is evapotranspiration).
Table 7. Simulated yield and hydrologic components in a spring wheat–fallow cropping system compared with a continuous annual spring wheat cropping system during 1961–2010 at Sidney, MT. Simulations were done with RZWQM2 with CERES-wheat.
ParameterWheat–fallow (WF) Wheat–
wheat (WW)Difference WF – WW
Wheat year Fallow year Avg. Absolute Percentage%
Yield, kg ha–1 2062 0 1031 1813 –782 –43Precipitation, cm 34.5 34.5 34.5 34.5 0 0Runoff, cm 3.1 3.2 3.2 3.1 0 2Infi ltration, cm 30.9 30.7 30.8 30.9 0 0Actual evaporation, cm 9.6 11.0 10.3 8.6 1.7 20Actual transpiration, cm 18.9 0.0 9.5 18.3 –8.8 –48Actual evapotranspiration, cm 28.5 11.0 19.8 26.8 –7.0 –26Deep seepage, cm 6.9 15.6 11.2 4.3 6.9 161Potential evaporation, cm 57.0 61.2 59.1 38.1 21.0 55Potential transpiration, cm 29.5 0.0 14.7 28.6 –13.9 –48Potential evapotranspiration, cm 86.5 61.2 73.8 66.6 7.2 11
Agronomy Journa l • Volume 105, Issue 1 • 2013 47
Th e yield diff erence in management treatments in 2001 to 2010 was close to the short-term simulation, while in other years the yield reduction due to ecological management was less pronounced. A 10.3% yield increase in ecological management treatments during 1991 to 2000 due to high growing-season precipitation was also simulated. Th e simulated yield was lowest in the driest and warmest years (1981–1990) and highest in the wettest and coolest years (1961–1970).
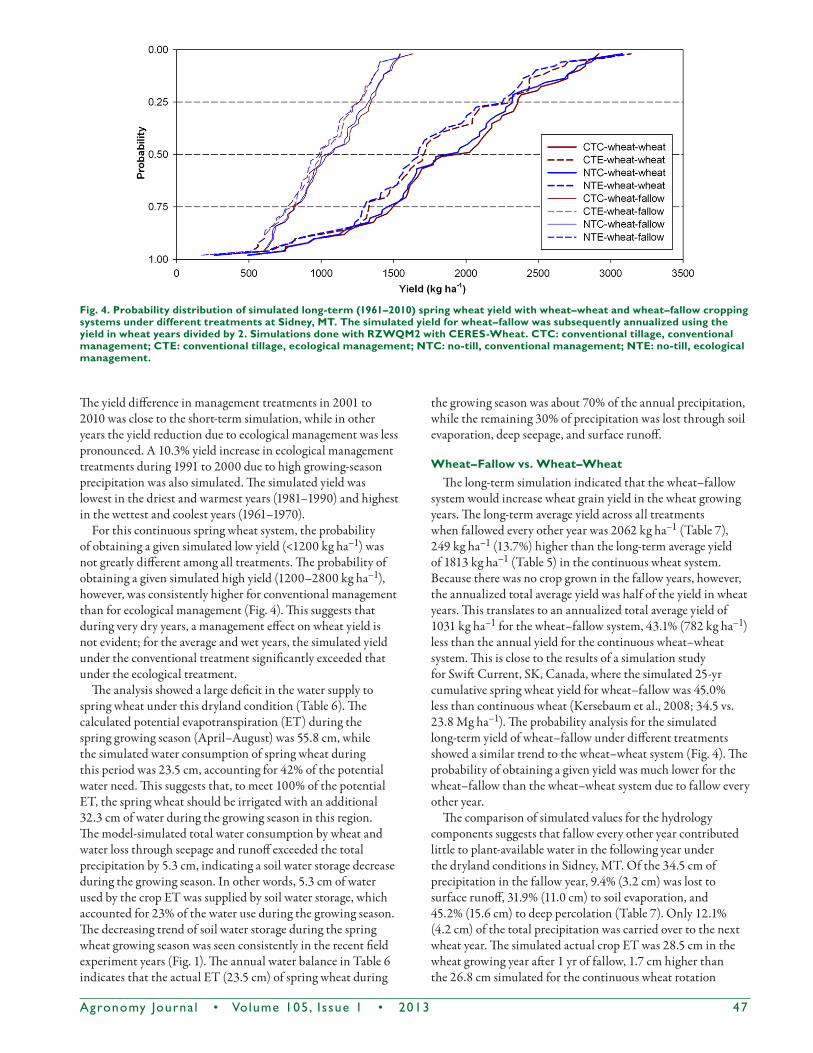
For this continuous spring wheat system, the probability of obtaining a given simulated low yield (<1200 kg ha–1) was not greatly diff erent among all treatments. Th e probability of obtaining a given simulated high yield (1200–2800 kg ha–1), however, was consistently higher for conventional management than for ecological management (Fig. 4). Th is suggests that during very dry years, a management eff ect on wheat yield is not evident; for the average and wet years, the simulated yield under the conventional treatment signifi cantly exceeded that under the ecological treatment.
Th e analysis showed a large defi cit in the water supply to spring wheat under this dryland condition (Table 6). Th e calculated potential evapotranspiration (ET) during the spring growing season (April–August) was 55.8 cm, while the simulated water consumption of spring wheat during this period was 23.5 cm, accounting for 42% of the potential water need. Th is suggests that, to meet 100% of the potential ET, the spring wheat should be irrigated with an additional 32.3 cm of water during the growing season in this region. Th e model-simulated total water consumption by wheat and water loss through seepage and runoff exceeded the total precipitation by 5.3 cm, indicating a soil water storage decrease during the growing season. In other words, 5.3 cm of water used by the crop ET was supplied by soil water storage, which accounted for 23% of the water use during the growing season. Th e decreasing trend of soil water storage during the spring wheat growing season was seen consistently in the recent fi eld experiment years (Fig. 1). Th e annual water balance in Table 6 indicates that the actual ET (23.5 cm) of spring wheat during
the growing season was about 70% of the annual precipitation, while the remaining 30% of precipitation was lost through soil evaporation, deep seepage, and surface runoff .
Wheat–Fallow vs. Wheat–WheatTh e long-term simulation indicated that the wheat–fallow
system would increase wheat grain yield in the wheat growing years. Th e long-term average yield across all treatments when fallowed every other year was 2062 kg ha–1 (Table 7), 249 kg ha–1 (13.7%) higher than the long-term average yield of 1813 kg ha–1 (Table 5) in the continuous wheat system. Because there was no crop grown in the fallow years, however, the annualized total average yield was half of the yield in wheat years. Th is translates to an annualized total average yield of 1031 kg ha–1 for the wheat–fallow system, 43.1% (782 kg ha–1) less than the annual yield for the continuous wheat–wheat system. Th is is close to the results of a simulation study for Swift Current, SK, Canada, where the simulated 25-yr cumulative spring wheat yield for wheat–fallow was 45.0% less than continuous wheat (Kersebaum et al., 2008; 34.5 vs. 23.8 Mg ha–1). Th e probability analysis for the simulated long-term yield of wheat–fallow under diff erent treatments showed a similar trend to the wheat–wheat system (Fig. 4). Th e probability of obtaining a given yield was much lower for the wheat–fallow than the wheat–wheat system due to fallow every other year.
Th e comparison of simulated values for the hydrology components suggests that fallow every other year contributed little to plant-available water in the following year under the dryland conditions in Sidney, MT. Of the 34.5 cm of precipitation in the fallow year, 9.4% (3.2 cm) was lost to surface runoff , 31.9% (11.0 cm) to soil evaporation, and 45.2% (15.6 cm) to deep percolation (Table 7). Only 12.1% (4.2 cm) of the total precipitation was carried over to the next wheat year. Th e simulated actual crop ET was 28.5 cm in the wheat growing year aft er 1 yr of fallow, 1.7 cm higher than the 26.8 cm simulated for the continuous wheat rotation
Fig. 4. Probability distribution of simulated long-term (1961–2010) spring wheat yield with wheat–wheat and wheat–fallow cropping systems under different treatments at Sidney, MT. The simulated yield for wheat–fallow was subsequently annualized using the yield in wheat years divided by 2. Simulations done with RZWQM2 with CERES-Wheat. CTC: conventional tillage, conventional management; CTE: conventional tillage, ecological management; NTC: no-till, conventional management; NTE: no-till, ecological management.
48 Agronomy Journa l • Volume 105, Issue 1 • 2013
(Table 6). Th erefore, of the 4.2 cm of water carried over from the fallow year, only 1.7 cm was actually used by the crop. Th is analysis indicates that a 1-cm increase in water consumption by spring wheat increased the yield by 146 kg ha–1 (2062 vs. 1813 kg ha–1). Th is relationship is close to the fi ndings in fi eld experiments conducted by Brown et al. (1981; 135 kg ha–1 cm–1) and Nielsen et al. (2002; 140 kg ha–1 cm–1) in the northern and central Great Plains. Th e rest of the
carryover water (2.5 cm) from the fallow years was lost through deep seepage in the wheat growth year. Th is, in combination with lower annualized yields, makes the wheat–fallow system less effi cient from a productivity standpoint.
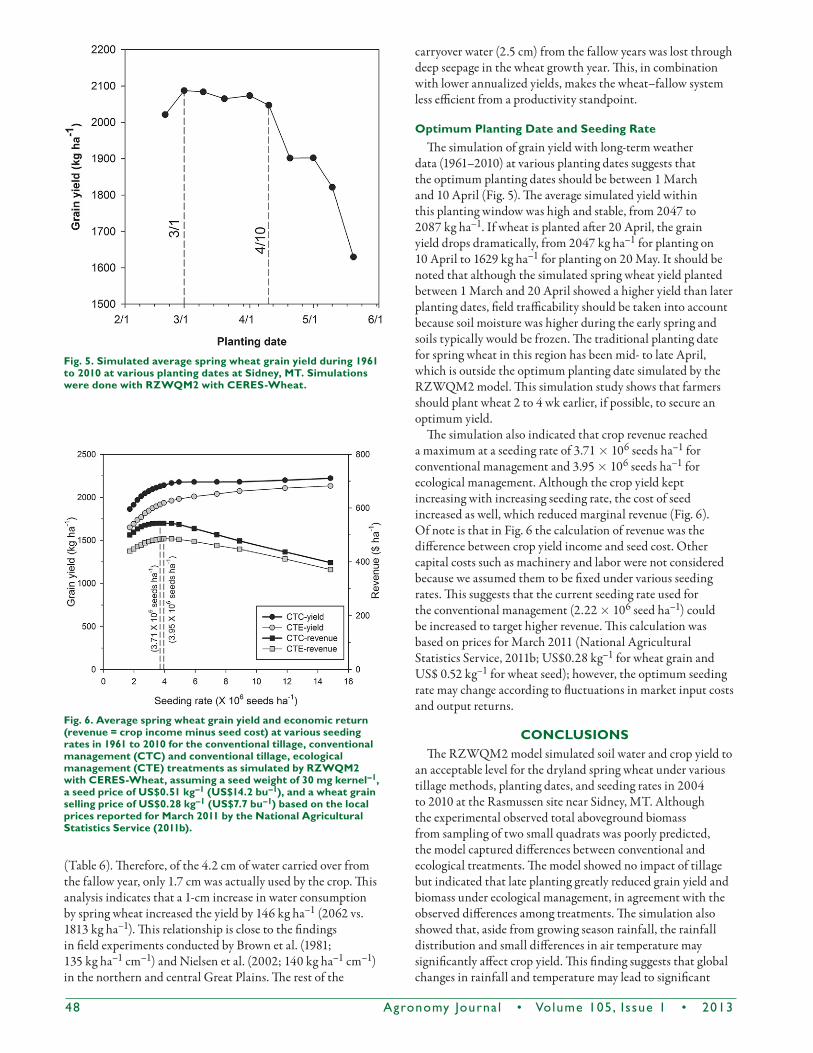
Optimum Planting Date and Seeding RateTh e simulation of grain yield with long-term weather
data (1961–2010) at various planting dates suggests that the optimum planting dates should be between 1 March and 10 April (Fig. 5). Th e average simulated yield within this planting window was high and stable, from 2047 to 2087 kg ha–1. If wheat is planted aft er 20 April, the grain yield drops dramatically, from 2047 kg ha–1 for planting on 10 April to 1629 kg ha–1 for planting on 20 May. It should be noted that although the simulated spring wheat yield planted between 1 March and 20 April showed a higher yield than later planting dates, fi eld traffi cability should be taken into account because soil moisture was higher during the early spring and soils typically would be frozen. Th e traditional planting date for spring wheat in this region has been mid- to late April, which is outside the optimum planting date simulated by the RZWQM2 model. Th is simulation study shows that farmers should plant wheat 2 to 4 wk earlier, if possible, to secure an optimum yield.
Th e simulation also indicated that crop revenue reached a maximum at a seeding rate of 3.71 × 10⁶ seeds ha–1 for conventional management and 3.95 × 10⁶ seeds ha–1 for ecological management. Although the crop yield kept increasing with increasing seeding rate, the cost of seed increased as well, which reduced marginal revenue (Fig. 6). Of note is that in Fig. 6 the calculation of revenue was the diff erence between crop yield income and seed cost. Other capital costs such as machinery and labor were not considered because we assumed them to be fi xed under various seeding rates. Th is suggests that the current seeding rate used for the conventional management (2.22 × 10⁶ seed ha–1) could be increased to target higher revenue. Th is calculation was based on prices for March 2011 (National Agricultural Statistics Service, 2011b; US$0.28 kg–1 for wheat grain and US$ 0.52 kg–1 for wheat seed); however, the optimum seeding rate may change according to fl uctuations in market input costs and output returns.
CONCLUSIONSTh e RZWQM2 model simulated soil water and crop yield to
an acceptable level for the dryland spring wheat under various tillage methods, planting dates, and seeding rates in 2004 to 2010 at the Rasmussen site near Sidney, MT. Although the experimental observed total aboveground biomass from sampling of two small quadrats was poorly predicted, the model captured diff erences between conventional and ecological treatments. Th e model showed no impact of tillage but indicated that late planting greatly reduced grain yield and biomass under ecological management, in agreement with the observed diff erences among treatments. Th e simulation also showed that, aside from growing season rainfall, the rainfall distribution and small diff erences in air temperature may signifi cantly aff ect crop yield. Th is fi nding suggests that global changes in rainfall and temperature may lead to signifi cant
Fig. 5. Simulated average spring wheat grain yield during 1961 to 2010 at various planting dates at Sidney, MT. Simulations were done with RZWQM2 with CERES-Wheat.
Fig. 6. Average spring wheat grain yield and economic return (revenue = crop income minus seed cost) at various seeding rates in 1961 to 2010 for the conventional tillage, conventional management (CTC) and conventional tillage, ecological management (CTE) treatments as simulated by RZWQM2 with CERES-Wheat, assuming a seed weight of 30 mg kernel–1, a seed price of US$0.51 kg–1 (US$14.2 bu–1), and a wheat grain selling price of US$0.28 kg–1 (US$7.7 bu–1) based on the local prices reported for March 2011 by the National Agricultural Statistics Service (2011b).
Agronomy Journa l • Volume 105, Issue 1 • 2013 49
yield losses in the future. Th e simulated long-term yield loss in the ecological treatments compared with conventional management, which may be mainly due to late planting, was much less than the short-term observed and simulated yield losses. It confi rms the signifi cance of using models and long-term weather data to extend the results of limited years of fi eld experimentation. Such an extension requires that the model be calibrated and validated on the original fi eld experiment. Th e spring wheat–fallow system was simulated to be less productive than continuous spring wheat because the contribution of rainfall in the fallow year to the following wheat year was very small. Continuous cropping systems, however, are prone to weed infestation and require mechanical tillage or chemical weed control to maintain productivity. Finally, the model also provided long-term optimal planting dates and seeding rates for this area.
ACKNOWLEDGMENTS
We would like to express our appreciation to Dr. Gregory McMaster at the USDA-ARS Agricultural Systems Research Unit in Fort Collins, CO, and Dr. Jeffery White at the USDA-ARS Arid Land Agricultural Research Center in Maricopa, AZ, for their help in understanding wheat physiology and the CERES-Wheat model. We are thankful to Dr. David Archer at the USDA-ARS Northern Great Plains Research Lab. for providing information for the economic analysis. Dr. Jeffery White, Dr. David Archer, and Dr. David Nielsen are acknowledged for performing the ARS internal review.
REFERENCES
Ahuja, L.R., K.W. Rojas, J.D. Hanson, M.J. Shaff er, and L. Ma, editors. 2000. Root Zone Water Quality Model: Modeling management eff ects on water quality and crop production. Water Resour. Publ., Highlands Ranch, CO.
Allen, R.G., L.S. Pereira, D. Raes, and M. Smith. 1998. Crop evapotranspi-ration: Guidelines for computing crop water requirements. Irrig. Drain. Pap. 56. FAO, Rome.
Bannayan, M., N.M.J. Crout, and G. Hoogenboom. 2003. Application of the CERES-Wheat model for within-season prediction of winter wheat yield in the United Kingdom. Agron. J. 95:114–125. doi:10.2134/agronj2003.0114
Bouyoucos, G.J. 1962. Hydrometer method improved for making particle size analyses for soils. Agron. J. 54:464–465. doi:10.2134/agronj1962.00021962005400050028x
Brooks, R.J., and A.T. Corey. 1964. Hydraulic properties of porous media. Hydrol. Pap. 3. Colorado State Univ., Fort Collins.
Brown, P.L., A.L. Black, C.M. Smith, J.W. Enz, and J.M. Caprio. 1981. Soil water guidelines and precipitation probabilities for barley and spring wheat in fl exible cropping systems in Montana and North Dakota. Mon-tana Coop. Ext. Bull. 356. Montana State Univ., Bozeman.
Chipanshi, A.C., E.A. Ripley, and R.G. Lawford. 1997. Early prediction of spring wheat yields in Saskatchewan from current and historical weather data using the CERES-Wheat model. Agric. For. Meteorol. 84:223–232. doi:10.1016/S0168-1923(96)02363-5
Chanasyk, D.S., and M.A. Naeth. 1996. Field measurement of soil mois-ture using neutron probes. Can. J. Soil Sci. 76:317–323. doi:10.4141/cjss96-038
Deibert, E.J., E. French, and B. Hoag. 1986. Water storage and use by spring wheat under conventional tillage and no-till in continuous and alternate crop–fallow systems in the northern Great Plains. J. Soil Water Conserv. 41(1):53–58.
Fenster, C.R. 1973. Stubble mulching. In: Conservation tillage: A handbook for farmers. Soil Conserv. Soc. Am., Ankeny, IA. p. 29–34.
Godwin, D., J. Ritchie, U. Singh, and L. Hunt. 1990. A user’s guide to CERES Wheat, V2.10. 2nd ed. Int. Fert. Dev. Ctr., Muscle Shoals, AL.
Hanson, J.D., K.W. Rojas, and M.J. Shaff er. 1999. Calibrating the Root Zone Water Quality Model. Agron. J. 91:171–177. doi:10.2134/agronj1999.00021962009100020002x
Jones, J.W., G. Hoogenboom, C.H. Porter, K.J. Boote, W.D. Batchelor, L.A. Hunt, et al. 2003. Th e DSSAT cropping system model. Eur. J. Agron. 18:235–265. doi:10.1016/S1161-0301(02)00107-7
Kersebaum, K.C., A. Wurbs, R. de Jong, C.A. Campbell, J. Yang, and R.P. Zentner. 2008. Long-term simulation of soil–crop interactions in semiarid southwestern Saskatchewan, Canada. Eur. J. Agron. 29:1–12. doi:10.1016/j.eja.2008.01.011
Lenssen, A.W., G.D. Johnson, and G.R. Carlson. 2007. Cropping sequence and tillage system infl uences annual crop production and water use in semiarid Montana, USA. Field Crops Res. 100:32–43. doi:10.1016/j.fcr.2006.05.004
Ma, L., L.R. Ahuja, B.T. Nolan, R.W. Malone, T.J. Trout, and Z. Qi. 2012. Root Zone Water Quality Model (RZWQM2): Model use, calibration, and validation. Trans. ASABE 55:1425–1446.
Ma, L., L.R. Ahuja, S.A. Sassendran, R.W. Malone, T.R. Green, B.T. Nolan, et al. 2011. A protocol for parameterization and calibration of RZWQM2 in fi eld research. In: L.R. Ahuja and L. Ma, editors, Methods of introduc-ing system models into agricultural research. Adv. Agric. Syst. Model. 2. ASA, CSSA, and SSSA, Madison, WI. p. 1–64.
Ma, L., G. Hoogenboom, L.R. Ahuja, J.C. Ascough II, and S.A. Saseen-dran. 2006. Evaluation of the RZWQM–CERES-Maize hybrid model for maize production. Agric. Syst. 87:274–295. doi:10.1016/j.agsy.2005.02.001
Ma, L., G. Hoogenboom, L.R. Ahuja, D.C. Nielsen, and J.C. Ascough II. 2005. Development and evaluation of the RZWQM–CROPGRO hybrid model for soybean production. Agron. J. 97:1172–1182. doi:10.2134/agronj2003.0314
Ma, L., R.W. Malone, P. Heilman, D.B. Jaynes, L.R. Ahuja, S.A. Saseendran, et al. 2007. RZWQM simulated eff ects of crop rotation, tillage, and con-trolled drainage on crop yield and nitrate-N loss in drain fl ow. Geoderma 140:260–271. doi:10.1016/j.geoderma.2007.04.010
Malone, R.W., L. Ma, P. Heilman, D.L. Karlen, R.S. Kanwar, and J.L. Hatfi eld. 2007. Simulated N management eff ects on corn yield and tile-drainage nitrate loss. Geoderma 140:272–283. doi:10.1016/j.geoderma.2007.04.011
McMaster, G.S., J.F. White, L.A. Hunt, P.D. Jamieson, S.S. Dhillon, and J.I. Ortiz-Monasterio. 2008. Simulating the infl uence of vernalization, pho-toperiod, and optimum temperature on wheat developmental rates. Ann. Bot. 102:561–569. doi:10.1093/aob/mcn115
Moriasi, D.N., J.G. Arnold, M.W. Van Liew, R.L. Binger, R.D. Harmel, and T.L. Veith. 2007. Model evaluation guidelines for systematic qualifi ca-tion of accuracy in watershed simulations. Trans. ASABE 50:885–900.
Moulin, A.P., and H.J. Beckie. 1993. Evaluation of the CERES and EPIC mod-els for predicting spring wheat grain yield over time. Can. J. Plant Sci. 73:713–719. doi:10.4141/cjps93-093
Nash, J.E., and J.V. Sutcliff e. 1970. River fl ow forecasting through concep-tual models: I. A discussion of principles. J. Hydrol. 10:282–290. doi:10.1016/0022-1694(70)90255-6
National Agricultural Statistics Service. 2007. Th e census of agriculture. NASS, Washington, DC. http://www.agcensus.usda.gov/Publica-tions/2007/Full_Report/ (accessed 27 Jan. 2012).
National Agricultural Statistics Service. 2011a. Acreage. Released 30 June 2011. NASS, Washington, DC. http://usda.mannlib.cornell.edu/usda/nass/Acre/2010s/2011/Acre-06-30-2011.pdf.
National Agricultural Statistics Service. 2011b. Agricultural prices. Released 29 Apr. 2011. NASS, Washington, DC. http://usda01.library.cornell.edu/usda/nass/AgriPric//2010s/2011/AgriPric-04-29-2011.pdf
Nielsen, D.C., and M.F. Vigil. 2010. Precipitation storage effi ciency during fallow in wheat–fallow systems. Agron. J. 102:537–543. doi:10.2134/agronj2009.0348
Nielsen, D.C., M.F. Vigil, R.L. Anderson, R.L. Bowman, J.G. Benjamin, and A.D. Halvorson. 2002. Cropping system infl uence on planting water content and yield of winter wheat. Agron. J. 94:962–967. doi:10.2134/agronj2002.0962
Nielsen, D.C., M.F. Vigil, and J.G. Benjamin. 2011. Evaluating decision rules for dryland rotation crop selection. Field Crops Res. 120:254–261. doi:10.1016/j.fcr.2010.10.011
50 Agronomy Journa l • Volume 105, Issue 1 • 2013
Qi, Z., M.J. Helmers, R.W. Malone, and K.R. Th orp. 2011. Simulating long-term impacts of winter rye cover crop on hydrologic cycling and nitrogen dynamics for a corn–soybean crop system. Trans. ASABE 54:1575–1588.
Ritchie, J.T., U. Singh, D.C. Godwin, and W.T. Bowen. 1998. Cereal growth, development and yield. In: G.Y. Tsuji et al., editors, Understanding options for agricultural production. Kluwer Acad. Publ., Dordrecht, the Netherlands. p. 79–98.
Sainju, U.M., A.W. Lenssen, T. Caesar-TonTh at, J.D. Jabro, R.T. Lartey, R.G. Evans, and B.L. Allen. 2011. Dryland residue and soil organic matter as infl uenced by tillage, crop rotation, and cultural practices. Plant Soil 338:27–41. doi:10.1007/s11104-010-0403-5
Saseendran, S.A., L. Ma, D.C. Nielsen, M.F. Vigil, and L.R. Ahuja. 2005. Simulating planting date eff ects on corn production using RZWQM and CERES-Maize models. Agron. J. 97:58–71. doi:10.2134/agronj2005.0058
Saseendran, S.A., D.C. Nielsen, L. Ma, L.R. Ahuja, and A.D. Halvorson. 2004. Modeling nitrogen management eff ects on winter wheat pro-duction using RZWQM and CERES-Wheat. Agron. J. 96:615–630. doi:10.2134/agronj2004.0615
Saseendran, S.A., D.C. Nielsen, L. Ma, L.R. Ahuja, and M.F. Vigil. 2010. Simulating alternative dryland rotational cropping systems in the central Great Plains with RZWQM2. Agron. J. 102:1521–1534. doi:10.2134/agronj2010.0141
Schaap, M.G., F.J. Leij, and M.Th . van Genuchten. 1998. Neural network analysis for hierarchical prediction of soil water retention and saturated hydraulic conductivity. Soil Sci. Soc. Am. J. 62:847–855. doi:10.2136/sssaj1998.03615995006200040001x
Schillinger, W.F., S.E. Schofstoll, and J.R. Alldredge. 2008. Available water and wheat grain yield relations in a Mediterranean climate. Field Crops Res. 109:45–49. doi:10.1016/j.fcr.2008.06.008
Shaff er, M.J., K.W. Rojas, D.G. Decoursey, and C.S. Hebson. 2000. Nutrient chemistry processes—OMNI. In: L.R. Ahuja et al., editors, Root Zone Water Quality Model: Modeling management eff ects on water quality and crop production. Water Resour. Publ., Highlands Ranch, CO. p. 119–144.
Sherman, J.D., D.K. Weaver, M.L. Hofl and, S.E. Sing, M. Buteler, S.P. Lan-ning, et al. 2010. Identifi cation of novel QTL for sawfl y resistance in wheat. Crop Sci. 50:73–86. doi:10.2135/cropsci2009.03.0145
Staggenborg, S.A., and R.L. Vanderlip. 2005. Crop simulation models can be used as dryland cropping systems research tools. Agron. J. 97:378–384. doi:10.2134/agronj2005.0378
Talbert, L.E., S.P. Lanning, R.L. Murphy, and J.M. Martin. 2001. Grain fi ll duration in twelve hard red spring wheat crosses: Genetic variation and association with other agronomic traits. Crop Sci. 41:1390–1395. doi:10.2135/cropsci2001.4151390x
Tanaka, D.L., and J.K. Aase. 1987. Fallow method infl uences on soil water and precipitation storage effi ciency. Soil Tillage Res. 9:307–316. doi:10.1016/0167-1987(87)90056-0
Th orp, K.R., D.J. Hunsaker, A.N. French, J.W. White, T.R. Clarke, and P.J. Pinter, Jr. 2010. Evaluation of the CSM-CROPSIM-CERES-Wheat model as a tool for crop water management. Trans. ASABE 53:87–102.
Th orp, K.R., R.W. Malone, and D.B. Jaynes. 2007. Simulating long-term eff ects of nitrogen fertilizer application rates on corn yield and nitrogen dynamics. Trans. ASABE 50:1287–1303.
Toure, A., D.J. Major, and C.W. Lindwall. 1995. Comparison of fi ve wheat simulation models in southern Alberta. Can. J. Plant Sci. 75:61–68. doi:10.4141/cjps95-010