Simulating fluoride evolution in groundwater using a reactive multicomponent transient transport model: Application to a crystalline aquifer of Southern India Marie Pettenati a,⇑ , Jérôme Perrin a,b , Hélène Pauwels a , Shakeel Ahmed c a BRGM, Avenue Claude Guillemin, BP 36009, 45060 Orléans Cedex 02, France b CEFIRES, Indo-French Center for Ground Water Research, NGRI, Uppal Road, 500 007 Hyderabad, India c NGRI, Uppal Road, 500 007 Hyderabad, India article info Article history: Received 12 January 2012 Accepted 9 November 2012 Available online 27 November 2012 Editorial handling by Ron abstract Overexploitation of crystalline aquifers in a semi-arid climate leads to a degradation of water quality, with the main processes responsible for the observed salt loads probably being irrigation return flow (IRF) and a high evaporation rate. The present study has focused on modelling the F accumulation caused by IRF below rice paddy fields in the small endorheic Maheshwaram watershed (Andhra Pradesh, Southern India). The transient simulation was performed with a 1D reactive transport PHREEQC column and took into account IRF evaporation, kinetically controlled mineral dissolution/precipitation, ion adsorption on Fe hydroxides, and mixing with fresh groundwater. The results revealed the role of cationic exchange capacity (CEC) in Ca/Na exchange and calcite precipitation, both favouring a decrease of the Ca 2+ activity that prevents fluorite precipitation. Iron hydroxide precipitation offers a not inconsiderable adsorption capacity for F immobilization. The principal sources of F are fluorapatite dissolution and, to a lesser extent, allanite and biotite dissolution. Anthropogenic sources of F , such as fertilizers, are prob- ably very limited. After simulating an entire dry-season irrigation cycle (120 days), the results are in good agreement with the observed overall increase of Cl in the Maheshwaram groundwater. The model enables one to decipher the processes responsible for water-resource degradation through progressive salinization. It shows that F enrichment of the groundwater is likely to continue in the future if ground- water overexploitation is not controlled. Ó 2012 Elsevier Ltd. All rights reserved. 1. Introduction Fluoride concentrations higher than 1.5 mg L 1 in drinking water are considered to be detrimental to health. Fluorine is widely dispersed in nature and is the 13th most abundant element in the Earth’s crust (Mason and Moore, 1982). Many countries all over the world have groundwater with high F concentrations like parts of Australia, China, Mexico, western USA, Argentina and Africa (Cro- nin et al., 2000; Amini et al., 2008), with the most extensive of these occurring in India (Jacks et al., 2005; Reddy et al., 2010). Many processes can be responsible for high F in drinking water with its concentration in the groundwater being mainly governed by geogenic processes (Edmunds and Smedley, 2005). Fluoride is found in several minerals, especially apatite, micas, amphiboles and epidote, where it substitutes for hydroxyl positions in the min- eral structure (Rao and Devadas, 2003; Jacks et al., 2005), and the dissolution of such minerals constitutes a major source of F in groundwater (Edmunds and Smedley, 2005). Specific conditions can lead to a progressive increase of the F concentration. For exam- ple, evapotranspiration under arid and semi-arid climates can trig- ger calcite precipitation, thus reducing Ca activity; this is known to increase the F concentration in groundwater despite no fluorite (CaF 2 ) precipitation (e.g. Jacks et al., 2005). Increased groundwater residence time is also known to favour higher F concentrations (e.g. Chae et al., 2006). Anthropogenic activities can influence F con- centrations, such as applications of phosphate fertilizers and sew- age sludge (both of which exhibit high F concentrations) to soil, these can increase the F concentrations in agricultural soils consid- erably, and consequently affect groundwater (Datta et al., 1996; Rao, 2003). Another factor that likely to contribute to high F concentrations is aquifer overexploitation. India’s Green Revolution, which began in the 1970s to boost food production and reduce poverty, included policies that encouraged access to irrigation and fertilizers. A negative outcome of this has been a widespread stress on the groundwater resource which is especially acute in the crystalline drought-prone regions of southern India. A major process leading to groundwater quality degradation in this region is probably irri- gation return flow (IRF) (Dai and Labadie, 1997; Causapé et al., 2006; Négrel et al., 2011); this occurs through the fact that the salt load extracted from the wells with the irrigation water becomes spread over the fields and then returns with the IRF to the under- lying groundwater by deep percolation (Milnes and Perrochet, 0883-2927/$ - see front matter Ó 2012 Elsevier Ltd. All rights reserved. http://dx.doi.org/10.1016/j.apgeochem.2012.11.001 ⇑ Corresponding author. Tel.: +33 (0)2 38 64 47 03; fax: +33 (0)2 38 64 34 46. E-mail address: [email protected](M. Pettenati). Applied Geochemistry 29 (2013) 102–116 Contents lists available at SciVerse ScienceDirect Applied Geochemistry journal homepage: www.elsevier.com/locate/apgeochem
Transcript
Applied Geochemistry 29 (2013) 102–116
Contents lists available at SciVerse ScienceDirect
Simulating fluoride evolution in groundwater using a reactive multicomponenttransient transport model: Application to a crystalline aquifer of Southern India
Marie Pettenati a,⇑, Jérôme Perrin a,b, Hélène Pauwels a, Shakeel Ahmed c
a BRGM, Avenue Claude Guillemin, BP 36009, 45060 Orléans Cedex 02, Franceb CEFIRES, Indo-French Center for Ground Water Research, NGRI, Uppal Road, 500 007 Hyderabad, Indiac NGRI, Uppal Road, 500 007 Hyderabad, India
a r t i c l e i n f o
Article history:Received 12 January 2012Accepted 9 November 2012Available online 27 November 2012Editorial handling by Ron
0883-2927/$ - see front matter � 2012 Elsevier Ltd. Ahttp://dx.doi.org/10.1016/j.apgeochem.2012.11.001
Overexploitation of crystalline aquifers in a semi-arid climate leads to a degradation of water quality,with the main processes responsible for the observed salt loads probably being irrigation return flow(IRF) and a high evaporation rate. The present study has focused on modelling the F� accumulationcaused by IRF below rice paddy fields in the small endorheic Maheshwaram watershed (Andhra Pradesh,Southern India). The transient simulation was performed with a 1D reactive transport PHREEQC columnand took into account IRF evaporation, kinetically controlled mineral dissolution/precipitation, ionadsorption on Fe hydroxides, and mixing with fresh groundwater. The results revealed the role of cationicexchange capacity (CEC) in Ca/Na exchange and calcite precipitation, both favouring a decrease of theCa2+ activity that prevents fluorite precipitation. Iron hydroxide precipitation offers a not inconsiderableadsorption capacity for F� immobilization. The principal sources of F� are fluorapatite dissolution and, toa lesser extent, allanite and biotite dissolution. Anthropogenic sources of F�, such as fertilizers, are prob-ably very limited. After simulating an entire dry-season irrigation cycle (120 days), the results are in goodagreement with the observed overall increase of Cl� in the Maheshwaram groundwater. The modelenables one to decipher the processes responsible for water-resource degradation through progressivesalinization. It shows that F� enrichment of the groundwater is likely to continue in the future if ground-water overexploitation is not controlled.
� 2012 Elsevier Ltd. All rights reserved.
1. Introduction
Fluoride concentrations higher than 1.5 mg L�1 in drinkingwater are considered to be detrimental to health. Fluorine is widelydispersed in nature and is the 13th most abundant element in theEarth’s crust (Mason and Moore, 1982). Many countries all over theworld have groundwater with high F� concentrations like parts ofAustralia, China, Mexico, western USA, Argentina and Africa (Cro-nin et al., 2000; Amini et al., 2008), with the most extensive ofthese occurring in India (Jacks et al., 2005; Reddy et al., 2010).Many processes can be responsible for high F� in drinking waterwith its concentration in the groundwater being mainly governedby geogenic processes (Edmunds and Smedley, 2005). Fluoride isfound in several minerals, especially apatite, micas, amphibolesand epidote, where it substitutes for hydroxyl positions in the min-eral structure (Rao and Devadas, 2003; Jacks et al., 2005), and thedissolution of such minerals constitutes a major source of F ingroundwater (Edmunds and Smedley, 2005). Specific conditionscan lead to a progressive increase of the F concentration. For exam-ple, evapotranspiration under arid and semi-arid climates can trig-
ll rights reserved.
; fax: +33 (0)2 38 64 34 46.).
ger calcite precipitation, thus reducing Ca activity; this is known toincrease the F� concentration in groundwater despite no fluorite(CaF2) precipitation (e.g. Jacks et al., 2005). Increased groundwaterresidence time is also known to favour higher F concentrations (e.g.Chae et al., 2006). Anthropogenic activities can influence F� con-centrations, such as applications of phosphate fertilizers and sew-age sludge (both of which exhibit high F concentrations) to soil,these can increase the F concentrations in agricultural soils consid-erably, and consequently affect groundwater (Datta et al., 1996;Rao, 2003).
Another factor that likely to contribute to high F concentrationsis aquifer overexploitation. India’s Green Revolution, which beganin the 1970s to boost food production and reduce poverty, includedpolicies that encouraged access to irrigation and fertilizers. Anegative outcome of this has been a widespread stress on thegroundwater resource which is especially acute in the crystallinedrought-prone regions of southern India. A major process leadingto groundwater quality degradation in this region is probably irri-gation return flow (IRF) (Dai and Labadie, 1997; Causapé et al.,2006; Négrel et al., 2011); this occurs through the fact that the saltload extracted from the wells with the irrigation water becomesspread over the fields and then returns with the IRF to the under-lying groundwater by deep percolation (Milnes and Perrochet,
M. Pettenati et al. / Applied Geochemistry 29 (2013) 102–116 103
2006). The solute concentration of the return flow is, of course,especially high in arid or semi-arid regions due to the high levelof evapotranspiration.
Here the process of F accumulation is outlined in the smallendorheic Maheshwaram watershed (Négrel et al., 2011) wherethe groundwater has a high F� concentration of up to 4 mg L�1
(Pauwels et al., 2010). The Maheshwaram crystalline aquifer is typ-ical of a Southern India watershed, with a granitic basement, inten-sive groundwater abstraction (more than 700 productive irrigationwells), a predominant paddy field cropping pattern, and a ruraleconomy (Kumar and Ahmed, 2003; Maréchal et al., 2006). The linkbetween this overexploitation and the degradation of the ground-water quality is illustrated by the high F� concentrations that havebeen observed over the few last years (Purushotham et al., 2011)and the appearance of dental fluorosis among the local children(Bouzit et al., submitted for publication). Perrin et al. (2011) show,on the basis of field observations, the linear relationship betweenelectrical conductivity (EC) and Cl� content, and a lumped reser-voir model, that a solute recycling model (SRM) can adequatelyreproduce the increase in total dissolved solids (TDS) to their
Fig. 1. Simplified map of the Maheshwaram watershed showing the locat
present concentrations since the start of irrigation pumping. Theobjective of the present study is to simulate the impact of IRF ongroundwater chemistry at a watershed scale using a geochemicalreactive transport model (PHREEQC).
The adopted reactive transfer model incorporates both F-bear-ing mineral dissolution and groundwater salinization due to over-exploitation. It also takes into account SRM characteristics(evaporation, groundwater mixing), groundwater geochemistry,kinetic weathering of the Maheshwaram granite mineralogy,adsorption processes highly favoured by the presence of freshlyprecipitated Fe(OH)3 (Cronin et al., 2000), and the CEC of clays.All the simulations are based on measured field data.
2. The Maheshwaram watershed – climatic and geologicalcontext
The Maheshwaram watershed is located south of Hyderabad inthe State of Andhra Pradesh, India (Fig. 1). It covers an area of53 km2 under a semi-arid climate with a wet monsoon season
ion of farm irrigation wells that were sampled for chemical analysis.
Table 1Hydrodynamic parameters of the three geological layers constituting the modelled vertical column (values from de Condappa (2005), Dewandel et al. (2006) and Ghezzehei et al.(2007)).
104 M. Pettenati et al. / Applied Geochemistry 29 (2013) 102–116
(Kharif) between June and October, and a dry season (Rabi) fromNovember to May. Annual rainfall is around 750 mm with 90% ofthe rain occurring during the monsoon, whilst mean annual tem-perature is 26 �C, although daily temperatures can reach 45 �C dur-ing the dry season (Rabi). The high evaporation rate of about1800 mm/a combined with soil evaporation and plant transpira-tion gives an aridity index of 0.42.
The geology of the Maheshwaram watershed consists of Arche-an granite covered by a weathering profile of varied thickness. Thegranite is cut by quartz reefs and dolerite dykes at several loca-tions. The rock is mainly orthogneissic biotite granite with porphy-ritic K-feldspar (Dewandel et al., 2006). Intrusive leucocraticgranite with a lower biotite content is observed locally. The typicalweathering profile described by Dewandel et al. (2006) comprises:
� A thin layer of red soil (�50 cm).� 1–3 m of sandy regolith with a sandy clay loam composition
and a sandy texture.� 10–15 m of laminated K-feldspar-rich saprolite and clay beds
(fissure filling) forming the capacitive layer of the aquifer (Table1); due to overexploitation, this layer is generally unsaturated.� Fissured fresh granite (15–20 m) with few clay minerals which
constitutes a high-transmissivity aquifer with a low specificyield (Dewandel et al., 2006).� Unfissured granite (bedrock) forming the base of the aquifer.
An extensive unconfined aquifer develops within the weatheredgranite (e.g., Dewandel et al., 2006; Maréchal et al., 2006). It consti-tutes the only perennial water source for irrigation and domesticuses. Piezometric levels are usually at depths comprised between10 and 20 m b.g.s. Seasonal fluctuations are generally significantwith a few metres piezometric rise during the recharge causedby monsoon rainfall and a few metres depletion during the dry sea-son exacerbated by pumping. Inter-annual variability is high sincemonsoon rainfall may be significantly different from one year tothe other and so for recharge.
3. Methods
3.1. Sampling and analytical techniques
Sixty six water samples were collected for analysis from (i)depths between 30 and 60 m in 38 of the 700 irrigation wellsequipped with submersible pumps, and (ii) selected depths witha down-hole sampler in 27 piezometers drilled for scientific pur-poses. Temperature, electrical conductivity (EC) and pH were mea-sured immediately on site, and major- and trace elements weredetermined in the laboratory using ion chromatography and ICP-MS.
Samples of bedrock, after being powdered, were analysed byX-ray diffraction (XRD) to determine the major mineralogicalphases of the biotite granite. Fresh bedrock minerals were sepa-rated out using magnetic and heavy-liquid separation, as well ashand picking under an optical binocular microscope; the abun-dance of each mineral was then determined according to the
quartz-corrected weight of each fraction. An electron probe mi-cro-analyser (EPMA) was used to determine the weight percentageof F� in each F-bearing mineralogical phase. The cation exchangecapacity (CEC) of the weathering profile beneath the paddy fieldswas determined at different depths in order to assess the CEC ofthe soil, the sandy regolith and the laminated layer. Exchangeablecations were displaced by an excess of cobalt hexamine chloride[Co(NH3)6Cl3] solution.
3.2. Modelling
To decipher the relative importance of the physico-chemicalprocesses controlling the F� concentration increase in Maheshwa-ram groundwater, a 1D PHREEQC reactive-transport column wasused (Parkhurst and Appelo, 1999) to conceptualize the infiltrationof paddy field IRF under watershed-scale evaporation conditions.
Fig. 2 shows F� concentration in Maheshwaram watershedwells for different land use during the dry season of 2006. Wellsthat are most impacted by F� increase correspond to those usedfor paddy field irrigation practice. The other land uses show minorincrease to stable or decreasing of F� concentration. The geochem-ical transport model is conceptualized in order to understand theprocesses responsible for the negative impact on water quality ofvery stringent cropping in a semi-arid climate: paddy fieldirrigation.
The model is limited to a single dry season of 120 days, whichcorresponds to one paddy irrigation cycle (usually between 1January and 30 April). The groundwater reservoir during this peri-od is pumped by irrigation wells and recharged by IRF below thepaddy fields; no other recharge flux occurs. For simplification,the pumping and IRF were assimilated into the paddy irrigationin view of the fact that rice cultivation constitutes around 90% ofthe total pumping and return flows at watershed scale (Dewandelet al., 2010).
The system can be conceptualized at watershed scale as follows(Fig. 3): a single irrigation well pumps a given daily amount fromthe groundwater reservoir, with an IRF being generated at eachirrigation time step. Representative watershed-scale values arechosen for the pumping and IRF flux rates and also for the reservoirvolume using a seasonal water balance computation (Maréchalet al., 2006; Dewandel et al., 2010) and the daily lumped reservoirmodel of Perrin et al. (2011).
A 10 m vertical section between the paddy field surface and thetop of the water table is simulated by numerical modelling. First,the hydrodynamic characteristics (pore saturation, pore flowvelocity) of the return flow infiltration under the paddy field arecalculated with a 2D vertical variably-saturated flow model basedon measured hydrogeological and meteorological data (Section3.2.1). Reactive transport modelling is then carried out using thepore flow velocities obtained in the first stage over the entire ver-tical section (Section 3.2.2).
An average evaporation flux is applied through batch modelling(i.e. without transport) to the pumped water solution before infil-tration at each daily step. The paddy field evaporation fluxes werederived from daily evaporation-pan measurements using the FAOapproach as described by Dewandel et al. (2008). Evaporation
Fig. 2. Field measurements of fluoride concentration for specific land use during the dry season (January and March 2006). PF = Paddy Field, V = Vegetables, F = Fruits, N-D = Non-Determined.
Fig. 3. Conceptual model of a crystalline aquifer intensively pumped for paddy irrigation in southern India (after Perrin et al. (2011)) and 1D PHREEQC reactive verticalcolumn model. t is the pore flow velocity.
M. Pettenati et al. / Applied Geochemistry 29 (2013) 102–116 105
pan measurements, available from the Maheshwaram meteorolog-ical station for the period 2000–2007 and using the evaporationpan coefficient recommended by Gundekar et al. (2008) for the re-gional climatic context, give average monthly evaporation fluxes of4.49, 6.03, 7.08 and 7.69 mm day�1 (8 a data 2000–2007), respec-tively, for January, February, March and April.
An IRF that reaches the bottom of the 10 m vertical section ismixed with fresh groundwater (i.e. the groundwater reservoir) be-fore being pumped. The chemical composition of the fresh ground-water was taken as that of a piezometer (IFP 25, Fig. 1) postulatingthat it is representative of the natural groundwater (Table 2), i.e.impacted neither by IRF nor by local contamination sources. In fact,IFP 25 well is located far from any type of cropping. As confirmedby the low NO�3 content (�3 mg L�1) suggesting low or no
anthropogenic influence and low Cl� concentration indicatinglow evaporation impact (Pauwels et al., 2007; Négrel et al.,2010). The IRF/fresh groundwater mixing ratio was determinedusing the solute recycling model (SRM) calibrated results from Per-rin et al. (2011). The model computes on a daily time step IRF usinga soil moisture balance approach and the groundwater storage vol-ume (daily groundwater balance). For the dry season, the represen-tative ratio is 0.01%, that is 0.01% of the IRF composition mixeswith 99.99% of the fresh groundwater composition.
3.2.1. 2D hydrodynamic modelA 2-D variably-saturated vertical flow model was implemented
in the finite-elements code Groundwater (Cornaton, 2004). Themodelled area is 1 m wide and 10 m high with a 0.5 � 0.01 m mesh
Table 2Chemical composition (mg L�1) of freshgroundwater from scientific observationwell IFP25 used for the groundwaterreservoir chemistry in the model.
Li 3.7e�3Ni 6e�4Cu 8e�3Zn 5.6e�3Pb 1e�4U 1.3e�3B 0.021Ba 0.022
106 M. Pettenati et al. / Applied Geochemistry 29 (2013) 102–116
size (2000 rectangular elements). The model was run on a one-daytime step for one dry season irrigation (120 days) similarly to thetransport model. Three hydrogeological units are defined: a topunit (#1) corresponding to the soil zone (0.5 m thick), an interme-diate unit (#2) corresponding to the sandy regolith (2.5 m thick)and a bottom unit (#3) corresponding to the laminated layer(7 m thick). The flow boundary conditions are (a) a variable headat the top of the column to reproduce variably saturated conditionsin the paddy field and (b) a fixed head (H = 0 m) at the bottom ofthe column corresponding to the water table (the conceptual mod-el considers no fluctuation of the water table).
According to the Dewandel et al. (2006) literature synthesis anddirect observations in Maheshwaram, the hydraulic conductivity is2 � 10�6 m s�1 for the entire saprolite and 3 � 10�6 m s�1 for thelaminated layer alone (geometrical means). The saprolite’s compo-sition is sandy-clay or clayey-sand and its total porosity is about10%; due to the presence of clay, however, the effective porosityis less at between 0.5% and 10% according to the literature.
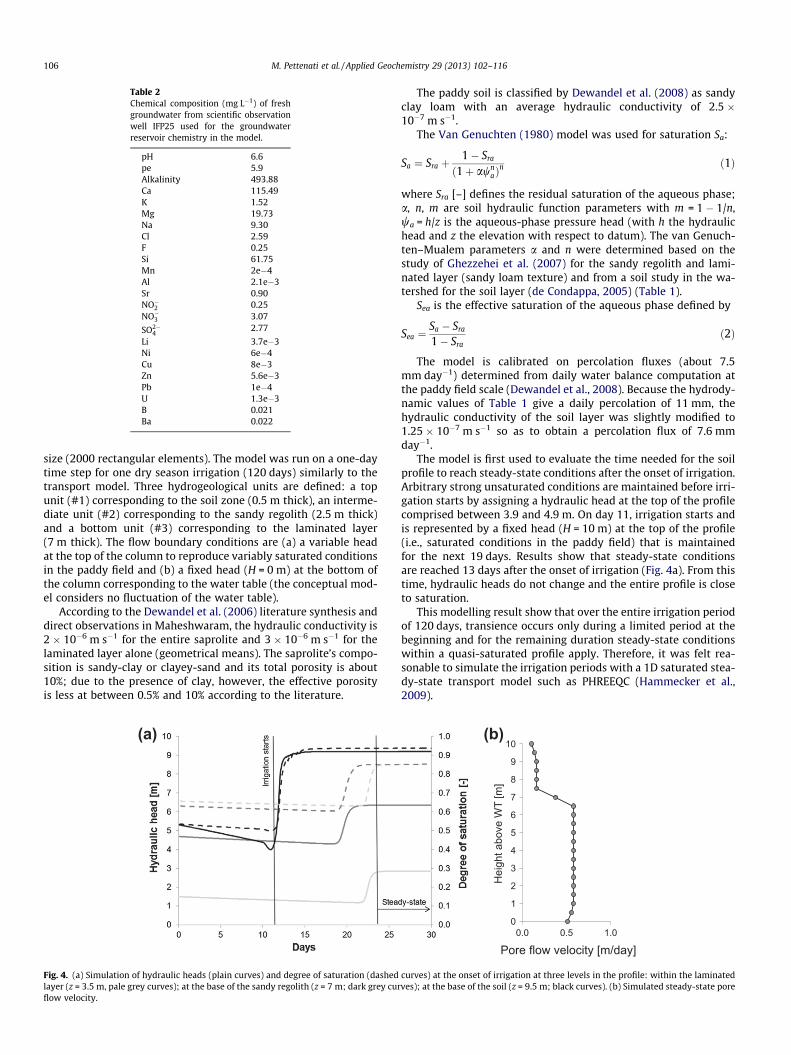
(a)
Fig. 4. (a) Simulation of hydraulic heads (plain curves) and degree of saturation (dashedlayer (z = 3.5 m, pale grey curves); at the base of the sandy regolith (z = 7 m; dark grey curflow velocity.
The paddy soil is classified by Dewandel et al. (2008) as sandyclay loam with an average hydraulic conductivity of 2.5 �10�7 m s�1.
The Van Genuchten (1980) model was used for saturation Sa:
Sa ¼ Sra þ1� Sra
ð1þ awnaÞ
n ð1Þ
where Sra [–] defines the residual saturation of the aqueous phase;a, n, m are soil hydraulic function parameters with m = 1 � 1/n,wa = h/z is the aqueous-phase pressure head (with h the hydraulichead and z the elevation with respect to datum). The van Genuch-ten–Mualem parameters a and n were determined based on thestudy of Ghezzehei et al. (2007) for the sandy regolith and lami-nated layer (sandy loam texture) and from a soil study in the wa-tershed for the soil layer (de Condappa, 2005) (Table 1).
Sea is the effective saturation of the aqueous phase defined by
Sea ¼Sa � Sra
1� Srað2Þ
The model is calibrated on percolation fluxes (about 7.5mm day�1) determined from daily water balance computation atthe paddy field scale (Dewandel et al., 2008). Because the hydrody-namic values of Table 1 give a daily percolation of 11 mm, thehydraulic conductivity of the soil layer was slightly modified to1.25 � 10�7 m s�1 so as to obtain a percolation flux of 7.6 mmday�1.
The model is first used to evaluate the time needed for the soilprofile to reach steady-state conditions after the onset of irrigation.Arbitrary strong unsaturated conditions are maintained before irri-gation starts by assigning a hydraulic head at the top of the profilecomprised between 3.9 and 4.9 m. On day 11, irrigation starts andis represented by a fixed head (H = 10 m) at the top of the profile(i.e., saturated conditions in the paddy field) that is maintainedfor the next 19 days. Results show that steady-state conditionsare reached 13 days after the onset of irrigation (Fig. 4a). From thistime, hydraulic heads do not change and the entire profile is closeto saturation.
This modelling result show that over the entire irrigation periodof 120 days, transience occurs only during a limited period at thebeginning and for the remaining duration steady-state conditionswithin a quasi-saturated profile apply. Therefore, it was felt rea-sonable to simulate the irrigation periods with a 1D saturated stea-dy-state transport model such as PHREEQC (Hammecker et al.,2009).
0
1
2
3
4
5
6
7
8
9
10
0.0 0.5 1.0
Hei
ght a
bove
WT
[m]
Pore flow velocity [m/day]
(b)
curves) at the onset of irrigation at three levels in the profile: within the laminatedves); at the base of the soil (z = 9.5 m; black curves). (b) Simulated steady-state pore
M. Pettenati et al. / Applied Geochemistry 29 (2013) 102–116 107
The model was then used to obtain the pore velocity in the dif-ferent parts of the weathering profile when steady-state conditionsapply (Fig. 4b). So as to respect the hydrodynamic boundary condi-tions, the pore velocities calculated with the variably-saturatedhydrodynamic model were implemented in the advective–reactivetransport simulation. A small dispersion factor was also attributedto the porous media (10% of the total length of the column; Pickensand Grisak, 1981; Xu and Eckstein, 1995). For the 1D transportmodelling, the soil column was divided into 305 computationalcells, with each cell being 1 cm thick in the soil, 1.6 cm thick inthe sandy regolith and 5.8 cm thick in the laminated layer.
3.2.2. Geochemical modellingIn order to synthesize biomass, microbial activity ensures the
decomposition of bioavailable organic matter by oxidative break-down of external organic substrates which provides the micro-organisms with energy, nutrients and electrons (Hunter et al.,1998). These reactions involving redox species are kinetically con-trolled and can be described by Monod equations using geochem-ical codes (Pettenati et al., in press). The redox characteristics ofthe Maheshwaram groundwater are dominated by oxic conditions(measured average Eh � 360 mV). Despite the lack of equilibriumbetween different redox couples for a same water sample, the re-dox potential was fixed so as to simplify the system. Because ofthe lack of relevant dissolved organic matter concentration mea-surements, the model includes no organic process and the partialpressure of CO2, product of organic matter oxidation, was takenas the averaged calculated pCO2 of the Maheshwaram groundwa-ter (logpCO2 = �1.6) for the column solutions and as equilibriumwith atmospheric pressure (logpCO2 = �3.5) for the evaporationof the pumped groundwater in the paddy field.
The thermo-kinetic dissolution of primary aluminosilicatephases (quartz, K-feldspar, epidote [allanite], biotite, albite phlog-opite) and iron oxides (goethite) is based on the Palandri and Kha-raka (2004) formulation according to the Transition State Theory(TST; Aagaard and Helgeson, 1982). According to these authors,the relevant reaction rates (Ri) for aluminosilicate minerals are gi-ven by:
Ri ¼ Se
Xj
kjagj
j e�EAj
RT 1� QK
� �b" #a
ð3Þ
where Se is the mineral’s effective reactive surface (m2 kg�1 water),k a kinetic constant (mol m�2 s�1), aj the activity of chemical speciesj, gj a stœchiometric coefficient of chemical species j for the reac-tion, EA the Arrhénius activation energy (mol�1), R the perfect gasconstant (8.31451 J mol�1 K�1), T the temperature (K), r the globalkinetic constant including chemical species activities, Q the ionicactivity product, K the chemical reaction equilibrium constant,and a, b empirical parameters corresponding to the TST theory (de-fault values are 1).
The dissolution kinetics can be decomposed in neutral (OH�)and acidic (H+) components (Palandri and Kharaka, 2004):
r ¼ kHþanHþ
Hþ e�EAa
RT þ kH2Oe�EAn
RT þ kOH�anOH�OH� e
�EAbRT ð4Þ
Eq. (4) can be expressed as a function of H+ activity using thedissociation constant Kw and the activation energy of kinetic con-stants at 298 K (Palandri and Kharaka, 2004):
r ¼ kHþanHþ
Hþ e�EAa
RT þ kH2Oe�EAn
RT þ kOH�KnOH�w a�nOH�
Hþ e�EAb
RT ð5Þ
r ¼ racid þ rneutral þ rbasic ð6Þ
racid ¼ kHþe�EAaR298 e
EAaR298 � e
�EAaRT
� �anHþ
Hþ ð7Þ
rneutral ¼ kH2Oe�EAnR298 e
EAnR298 � e
�EAnRT
� �ð8Þ
rbasic ¼ k0Hþe�EAbR298 e
EAbR298 � e
�EAbRT
� �a�nOH�
Hþ ð9Þ
Kw ¼ aHþaOH� ð10Þ
k0Hþ ¼ kOH�KnOH�w ð11Þ
The kinetic parameters for the simulation are given in Table 3.Gaus et al. (2008) have identified the difficulty of assessing the spe-cific reactive surface of minerals with dissolution rates for variousmodels varying between 1 and 3 orders of magnitude. This repre-sents the difference between a mineral’s total surface area, gener-ally measured by the BET method, and the sites on the surface thatare reactive for dissolution processes (White and Peterson, 1990).
Here it was chosen to present the general kinetic law as theproduct of the reactive surface area with the kinetic rate constant(keff = Se � kj; Table 4). Due to the high variability of these parame-ters, preliminary batch tests were performed of the dissolutionkinetics in order to adjust the keff parameter of the primary miner-alogy against that of the Maheshwaram groundwater chemistry.
Apart from sphene, which is a highly stable mineral, all themain F�-bearing mineral phases (Eqs. (12)–(14)) identified byEPMA are included in the model. The weight percentage of F� ineach mineral is, based on analysis, �1.1 for biotite, between 3.6and 4.6 for fluorapatite and between 0.7 and 1.2 for allanite (epi-dote). The specific mineralogical phases in the PHREEQC thermo-dynamic database (Thermoddem; Blanc et al., 2007) wereadjusted in order to correspond to the measured weight percent-ages of F�:
� Fluorapatite F� = 3.8% (from Chaïrat et al. (2007))
2þ 3� �
Ca10ðPO4Þ6F2 ¼ 10Ca þ 6PO4 þ 2F ð14Þ
The dissolution rate of natural fluorapatite (Ca10(PO4)6F2) is afunction of the pH corresponding to more complex dissolutionmechanisms than that of aluminosilicate. The rate expressionand thermodynamic constant value for this mineral are based onthe data of Chaïrat et al. (2007).
Under acid pH conditions, fluorapatite dissolution starts withthe release of Ca2+ and F� from the surface site (�) preferentiallyto that of the phosphate:
� Ca10ðPO4Þ6F2 !� Ca9ðPO4Þ6 þ 2F� þ Ca2þ ð15Þ
The Ca2+ release comes from Ca2+/H+ ion exchange and is con-sidered as a rapid and irreversible reaction:
Table 3Mineralogical composition of the weathering profile and kinetic parameters from Palandri and Kharaka (2004). keff is the product of the kinetic constant and reactive surface adjusted for this study.
The surface composition of fluorapatite after these reactions isthus depleted in F� and Ca2+, and enriched in P. It is the precursorcomplex of apatite dissolution with the final and limiting stepbeing destruction of the remaining Ca–O bonds by hydrolysis.
According to the TST, the dissolution rate of fluorapatite is di-rectly proportional to the surface species concentration:
ra ¼ kp � ½� Cað9�xÞHð2xþnÞðPO4Þ6� ð20Þ
Combining Eqs. (17), (19) and (20) we have:
ra ¼ kp �aHþð ÞnKads
1þ aHþð ÞnKads þa
Ca2þð ÞxaHþð Þ2x
Kech
ð21Þ
Under basic pH conditions, the experiments of Chaïrat et al.(2007) show a large depletion of F� at the mineral surface. Underneutral and alkaline pH conditions, fluorapatite dissolution is con-trolled by the breakthrough of Ca–O bounds, or more precisely byspecific surface site � CaOHþ2 hydrolysis. The dissolution rate forbasic conditions is:
rb ¼ kCa � ½� CaOHþ2 �c ð22Þ
with kCa the rate constant, c the calcic site number to be hydrolysedin order to dissolve fluorapatite, and ½� CaOHþ2 � the protonated cal-cium surface site concentration.
The global dissolution rate of fluorapatite is:
r ¼ kp �aHþð ÞnKads
1þ aHþð ÞnKads þa
Ca2þð ÞxaHþð Þ2x
Kech
þ kCa � ½� CaOHþ2 �c ð23Þ
The parameter values are n = 1, kp 6.61 � 10�6 mol m�2 s�1,kCa = 3.69 � 10�8 mol s�1, c = 0.6, x = 3, Kech = 1045, Kads 100.6±0.1,and the surface density of � CaOHþ2 is calculated by a sorptionmodel introduced in PHREEQC with the following surface deproto-nation reaction:
� CaOHþ2 !� CaOH0 þHþ ð24Þ
The logarithm of the reaction’s intrinsic stability constant islog K int
CaOH0 ¼ �10 (Chaïrat et al., 2007).The possible precipitation of secondary minerals at thermody-
namic equilibrium is taken into account for chalcedony, calcite,fluorite, dolomite and ferrihydrite. The precipitation of gibbsiteand kaolinite is kinetically controlled. Weight percentage of allminerals present in the weathering profile are listed Table 4.
The mobility of F� can be limited by adsorption on newlyformed solid phases such as Fe hydroxides, particularly ferrihydrite(Sujana et al., 2009). The adsorption processes are described by theDzombak and Morel (1990) theory for ferrihydrites whose modeltakes into account two types of surface site for the adsorption ofthe chemical species: ‘Hfo_s’ representing strong-affinity connec-tion sites, and ‘Hfo_w’ representing weak-affinity connection sites.The HFO characteristics used for the present modelling are derivedfrom Dzombak and Morel (1990) and Wilkie and Hering (1996); i.e.a surface area of 5.4 � 104 m2 mol�1, with 0.2 � 10�3 and 5.0 �10�3 mol per mol of hydrous ferric oxides for the weak (Hfo_w)and strong (Hfo_s) sites, respectively.
Eqs. (25) and (26), respectively, represent the deprotonationand protonation of Fe hydroxide surfaces:
HfO OH! HfO wO� þHþ ð25ÞHfo OHþHþ ¼ Hfo sOHþ2
K intHfo O� ¼
aHfo O�aHþ
aHfo OHe�
Fws2RT and K int
Hfo OHþ2¼
aHfo wOHþ2
aHfo wOHaHþe�
Fws2RT ð26Þ
where K intHfo wO� and K int
Hfo OHþ2are intrinsic equilibrium constants for
the reactions, and e�Fws2RT is a factor that accounts for the work in-
volved in moving a charged species (H+) away from a charged sur-face. The acidity constant values used for calculating surfacespeciation at 25 �C, 0.1 MPa are from the literature (Dzombak andMorel, 1990; Parkhurst and Appelo, 1999).
The model also takes into account the ion exchange capacity ofclays, with the ion exchange reaction including a solid exchangerwith a high cation exchange capacity. In general, clay mineralshave the following affinity for cation exchange:
Liþ < Naþ < Hþ < Kþ < NH4þ < Mg2þ < Ca2þ < Al3þ
Analysed CEC values for the soil, the sandy regolith and the lami-nated layer are, respectively, 11.6, 7.2 and 2 meq/100 g.
Fig. 5. Results of 1D PHREEQC column simulation versus depth for one cycle of irrigation (120 days) during the dry season. The conservative tracer is applied only on the firstday of irrigation.
110 M. Pettenati et al. / Applied Geochemistry 29 (2013) 102–116
M. Pettenati et al. / Applied Geochemistry 29 (2013) 102–116 111
4. Results and discussion
The transfer through the vertical column was simulated usingPHREEQC by introducing a non-reactive tracer with the return flowsolution at Day 1 of the simulation (Fig. 5a); this showed that theaverage return flow transit time to the water table is about31 days. In other words, during 120 days of irrigation (i.e. the sim-ulation duration), the porosity of the weathered profile is flushedfour times. The pH values (Fig. 5b) increase with time in the differ-ent compartments of the column. The Ca2+ concentration of the IRF,particularly in the soil, decreases during the first steps of the sim-ulation due to the high CEC value, whereas the Na+ concentrationincreases in the entire profile, although more so at depth in thelaminated layer (Fig. 5c and d). Given the lower CEC value withdepth, more of the exchanger sites are occupied by Ca2+ and thusnot available for Na+ sorption. Moreover, the dissolution rates of al-bite are higher in the laminated layer than in the sandy regolith
Fig. 6. Fluoride concentrations in the Maheshwaram watershed wells versus theNa+/Ca2+ ratio (2006 sampling campaign, January and March monthly samples from38 farm irrigation wells).
Fig. 7. PHREEQC-calculated SI for groundwater pumped from farm irrigation wells (2006+0.5 indicate supersaturation.
(Table 4) because of the different solid/liquid ratio due to the var-iation of porosity of the two layers, i.e. proportionally a largerquantity of albite is available for dissolution in the same quantityof water; consequently 1 mol of dissolved albite produces 1 molof Na+ (see formula Table 4). After 120 days, the F� concentrationin the pore solution is multiplied by more than 2 (Fig. 5e).
The occurrence of F� in natural water derives from its abun-dance in the local minerals and rocks. It is also strongly controlledby mineral solubility and in this regard the mineral fluorite, whichis the least soluble and has favourable dissolution kinetics at lowtemperature, can exert the major control on aqueous concentra-tions in the natural environment. An upper limit on F� activity inaqueous solutions is controlled by the solubility product, Kfluorite:
This is an important relationship because it shows that the con-centration of F� in the presence of fluorite is inversely proportionalto that of Ca2+. It is likely that low Ca2+ in solution allows higherconcentrations of F� in solution. Fig. 6 illustrates this increase ofF� in the Maheshwaram groundwater (2006 field campaign) withincreasing Na+/Ca2+ ratio. The removal of Ca2+ can occur throughcation exchange with Na+ from clay minerals and so enhance thelow activity of Ca2+ as highlighted by the simulation (Fig. 5c andd). The higher concentrations of F� found in the Maheshwaramwaters are typical of the Na—HCO�3 type, as is common in ground-waters enriched with F� (Rao, 1997; Saxena and Ahmed, 2003).Many authors have shown that the area of alkaline soils is increas-ing in India due to poorly managed irrigation projects withoutproper drainage (Srinivasulu et al., 2005; Jacks et al., 2009).
Fig. 7 shows the saturation index (SI) of calcite and fluorite cal-culated from the chemical analysis of 39 farm irrigation wellwaters for the period January to March 2006. SI is the logarithmicratio of the ion activity product in solution (IAP) and the thermody-namic equilibrium constant of solubility for the mineral (K) (SI = -log IAP/K). SI = 0 indicates equilibrium between the mineral andthe solution, SI < 0 indicates undersaturation (ideal for dissolution)
field campaign). Results of less than �0.5 indicate undersaturation and more than
112 M. Pettenati et al. / Applied Geochemistry 29 (2013) 102–116
and SI > 0 indicates supersaturation (ideal for precipitation) (Appe-lo and Postma, 2005). Due to the large range of log K values forchemical reactions in the literature, the solutions are consideredto be at thermodynamic equilibrium with SI between �0.5 and+0.5. All the groundwater samples were in equilibrium with calcitebut undersaturated with respect to fluorite. Moreover, no fluoritewas detected in the mineralogical analysis of the saprolite. In thelight of these data, therefore, it can be concluded that there is noimmobilization of F� by fluorite precipitation, and no control ofthe F� concentration by this mineral phase. The calcite and fluoriteSIs calculated from the simulation results (Fig. 8a and b) show thatcalcite is at saturation (i.e. equilibrium) along the entire percola-tion profile, whereas fluorite is systematically undersaturated (SIaround �2 after 120 days of irrigation). These results are in agree-ment with the SIs derived from chemical analysis of bedrockgroundwater (Fig. 7). The fact that calcite is at thermodynamicequilibrium (SI = 0) suggests precipitation, which is also in
Fig. 8. SI of calcite (a) and fluorite (b), and quantity of precipitated ferrihydrite (c) simuirrigation (120 days) during the dry season.
complete agreement with field observations of calcrete depositsand/or calcite precipitation in the laminated saprolite and fissuredzones, as well as within other similar watersheds (White et al.,2005; Reddy et al., 2010).
The simulation indicates significant Fe hydroxide precipitationin the system (Fig. 8c), which would contribute to immobilizingF� on surface sites. Many authors have shown that oxyanions suchas As and anions such as F� can be adsorbed significantly on metal-(Al, Fe) oxides and oxyhydroxides (Raichur and Jyoti Basu, 2001;Smedley and Kinniburgh, 2002; Smedley et al., 2003; Sujanaet al., 2009; Currell et al., 2011). Fig. 9a shows the total quantitiesof F� dissolved from F�-bearing minerals and also of F� adsorbedby ferrihydrite as a function of pore volume. Pore volume (PV)flushed from the column is calculated by shift number; one shiftmoves a solution to the next cell and the last solution out of thecolumn. However, because it is a cell-centred concentration thatis calculated, the last cell concentration arrives a half shift later
lated with the 1D reactive transport PHREEQC column versus depth for one cycle of
M. Pettenati et al. / Applied Geochemistry 29 (2013) 102–116 113
at the column outlet; so PV = (number of shifts + 0.5)/number ofcells (Parkhurst and Appelo, 1999). According to the simulation, alarge part of the F� in solution is adsorbed into the weathered pro-file during successive infiltrations on ferrihydrite, resulting in thesorption of about a half of the total dissolved F� concentration(Fig. 9a). Nevertheless, this quantity of adsorbed F� only representsa minor part (<0.03%) of the occupied ferrihydrite surface sites,whatever the depth (Fig. 9b). Silicate and carbonate account forthe major part of the adsorbed species within this range of simu-lated pH (�7 to 7.1), and the surface sites are mostly protonated.Calcium and Mg are adsorbed to a lesser extent in the weatheredprofile (respectively 2.3% and 0.5% at 0.25 m depth, 2.4% and 0.8%at 1.5 m depth, and 2.5% and 0.9% at 10 m depth). Adsorption onFe hydroxide surfaces enhances the removal of Ca2+ from the
Fig. 9. (a) Total fluoride concentrations dissolved from primary mineralogy and totaltransport simulation. (b) Percentage of adsorbed ions on ferrihydrite surfaces at 0.25, 1.5 a
solution, thus closing the distance to thermodynamic fluoriteequilibrium.
The major contributor to F� mobilization in the simulatedweathering profile is fluorapatite dissolution, and to a lesser extentallanite and biotite weathering (Fig. 9c). Note that the first highpeak of fluorapatite dissolution, between 0 and 0.2 flushed PV(see Fig. 9a and c), is a simulation artefact. Such strong reactivityat the beginning of the infiltration is due to the fact that the kineticdissolution of fluorapatite in the sandy regolith and laminatedlayer starts with a high dissolution rate far from thermodynamicequilibrium (SI � �4) and rapidly reaches a lower dissolution ratecloser to equilibrium (SI � �0.6) (Fig. 9c). The contribution of allthese minerals is in agreement with the Négrel et al. (2010) studywhich shows, with the help of Pb isotopes, that the geochemical
fluoride concentrations adsorbed on ferrihydrite versus pore volume for the fullnd 10 m depth. (c) Total contribution of each mineral to fluoride leached in solution.
Fig. 10. PHREEQC-simulated chemical composition of the column outlet solution(last cell), the pumped groundwater (mix of last cell and fresh groundwater) andthe irrigation return flow (pumped groundwater after evaporation).
Fig. 11. Comparison between the relative aquifer solute concentrations simulated by thecycle of paddy field irrigation (dry season).
Fig. 9. (continued)
114 M. Pettenati et al. / Applied Geochemistry 29 (2013) 102–116
characteristics of the Maheshwaram groundwater solutions reflectweathering of the primary mineralogy, e.g. plagioclase and K-feld-spar, as well as of accessory minerals such as fluorapatite, allaniteand biotite.
Fig. 10 shows the increasing concentration of F� in the differentwater flows of the irrigation system versus time. Because of thehigh degree of evaporation, F� is enriched in the IRF. Its abrupt in-crease at 31, 59 and 90 days corresponds to the monthly stepwiseincrease in evaporation rates applied to the IRF.
The maximum F� concentration of the system is at the columnoutlet just before mixing with groundwater. A slight decrease in F�
is noted at the column outlet from day 49 up to day 70. This inflec-tion is caused by the lower F� concentration at the beginning of thereturn flow infiltration in the pore water of the topmost 50 cm ofthe soil caused by the absence of fluorapatite. The propagation ofthis particular geochemical signature spreads in response to thedispersivity and F� interaction with ferrihydrite surface sites alongthe weathered profile (see Fig. 5e).
The ‘pumped’ groundwater shows a significantly lower F�
concentration after mixing with groundwater (IFP 25 chemical
solute recycling model (Perrin et al., 2011) and by the PHREEQC model during one
M. Pettenati et al. / Applied Geochemistry 29 (2013) 102–116 115
composition), although this gently increases with time due to thesuccessive infiltrations and mixings of the return flow during theirrigation cycle.
The PHREEQC concentration outputs were compared with theconcentrations computed by the SRM (Perrin et al., 2011) for threedry seasons (1998, 2006, 2009; Fig. 11). A good fit is obtained be-tween the Cl� concentrations simulated by the PHREEQC modeland the relative concentrations simulated by the SRM. This corre-lation is especially true for the year 1998, which marked the startof intensive pumping in the Maheshwaram groundwater andwhere the 1D PHREEQC column simulates the first dry period ofirrigation after pumping began. The slight difference between thetwo models is due to the travel time (�31 days) of the conservativetracer Cl� through the unsaturated zone; this is included in thePHREEQC model but not in the SRM model. The agreement be-tween model and field data is also clearly illustrated by the repre-sentation of F� versus Na/Ca (Fig. 6). The calculated F�
concentration obtained from one cycle of irrigation during thedry period of 2006 is lower than the concentration measured in39 of the farm well waters after 9 a of intensive pumping for irri-gation purposes, but the upward trend of F� versus Na/Ca fromthe simulation and that of F� from the field data plot along thesame slope. The higher measured F� concentrations are likelydue to the well’s specific environment in terms of local land use(number of paddy fields = variability of IRF impact) and the localcomposition of the saprolite (CEC, mineralogy).
The F� concentration increases relatively faster than the Cl�
concentration because, in addition to evaporation (which also im-pacts Cl� concentrations), mobilization due to the weathering of F-bearing minerals occurs in the unsaturated zone. Even thoughthese results represent an average solute increase at watershedscale based on average parameters, they do reflect the trends ob-served in the field, especially in the case of paddy field land useand despite the watershed’s high spatial variability. The fact thatsolute recycling and F� input due to water/rock interaction can ex-plain the F� concentrations observed in the Maheshwaram ground-water would seem to indicate that anthropogenic inputs such asfertilizers, which are not included in the model, are a negligiblesource of F� at watershed scale.
5. Conclusions
A solute recycling model that includes water/rock interactionand climatic parameters was used to assess the processes control-ling F� enrichment in a crystalline aquifer intensively exploited forpaddy field irrigation. The model was run on a daily time step overone entire dry-season irrigation cycle (120 days) using boundaryconditions and parameters representative of the entire watershed.Progressive enrichment of F� in the irrigation return flow causedby evaporation and mineral dissolution (no fertilizer input) leadsto an accumulation of F� in the aquifer, despite the high proportionof fresh groundwater mixing with the irrigation return flow. Crys-talline aquifer overexploitation in semi-arid areas exacerbates geo-genic enrichment derived from the dissolution of F�-bearingminerals (fluorapatite, allanite, biotite) through a combination ofcomplex hydrochemical processes. As no significant solid build-up of F� (i.e. precipitation) occurs in the unsaturated zone, a pro-gressive accumulation of F� in the aquifer, as is also observed inthe field from the sampled irrigation wells, was simulated. Themodel shows that F� can be adsorbed onto ferrihydrite surfaces,thus providing a potential enrichment source should destabiliza-tion of such amorphous mineral phases occur (e.g. through changein pH, change in redox conditions, competition at surface sites). Ina context of global climate change, increased water needs andintensive agricultural practices, it is essential that the mechanisms
responsible for water-quality degradation are identified and mod-elled. The present model aims to provide a first step in the devel-opment of prediction tools dedicated to aquifer management inthis specific context.
Future investigations will be devoted to studying the geochem-ical processes occurring during the drainage of the weathering pro-file between two cycles of irrigation.
Acknowledgements
This work has been supported by French National ResearchAgency (ANR) through the VMC programme (project MOHINI, no.ANR-07-VULN-08). It is the result of collaboration between BRGM,the Indo-French Centre for Groundwater Research and NGRI. Theauthors wish to thank P. Skipwith for text editing.
References
Aagaard, P., Helgeson, H.C., 1982. Thermodynamic and kinetic constraints onreaction rates among minerals and aqueous solutions: 1. Theoreticalconsiderations. Am. J. Sci. 282, 237–285.
Amini, M., Mueller, K., Abbaspour, K.C., Rosenberg, T., Afyuni, M., Moller, K.T., Sarr,M., Johnson, C.A., 2008. Statisctical modeling of globla geogenic fluoridecontamiation in groundwaters. Environ. Sci. Technol. 42, 3662–3668.
Appelo, C.A.J., Postma, D., 2005. Geochemistry, Groundwater and Pollution, seconded. A.A. Balkema Publishers, London.
Blanc, P., Lassin, A., Piantone, P., 2007. Thermoddem A Database Devoted to WasteMinerals. BRGM (Orléans, France). thermoddem.brgm.fr.
Bouzit, M., Fatima, S., Pauwels, H., Ahmed, S., Perrin, J., submitted for publication.Fluoride Groundwater Contamination: Impact of Land-use on Prevalence ofDental Fluorosis (Maheshwaram Watershed, India). Fluoride.
Causapé, J., Quilez, D., Aragüés, R., 2006. Irrigation efficiency and quality ofirrigation return flows in the Ebro river basin: an overview. Environ. Monitor.Assess. 117, 451–461.
Chae, G.K., Yun, S.T., Kwon, M.J., Kim, Y.S., Mayer, B., 2006. Batch dissolution ofgranite and biotite in water: Implication for fluorine geochemistry ingroundwater. Geochem. J. 40, 95–102.
Chaïrat, C., Schott, J., Oelkers, E.H., Lartigue, J.-E., Harouiya, N., 2007. Kinetics andmechanism of natural fluorapatite dissolution at 25 �C and pH from 3 to 12.Geochim. Cosmochim. Acta 71, 5901–5912.
Cornaton, F., 2004. Deterministic Models of Groundwater Age, Life Expectancy andTransit Time Distributions in Advective–dispersive Systems. Neuchâtel,Neuchâtel. <www.unine.ch/biblio/bc/theses_pdf/these_CornatonF.pdf>.
Cronin, S.J., Manoharan, V., Hedley, M.J., Loganathan, P., 2000. Fluoride: a review ofits fate, bioavailability and risks of fluorosis in grazed-pasture systems in NewZealand. NZ. J. Agric. Res. 43, 295–321.
Currell, M., Cartwright, I., Raveggi, M., Han, D., 2011. Controls on elevated fluorideand arsenic concentrations in groundwater from the Yuncheng Basin, China.Appl. Geochem. 269, 278–289.
Dai, T., Labadie, J.W., 1997. Integration of Water Quantity/Quality in River BasinNetwork Flow Modeling. U.S. Geol. Surv. Open-File Rep. 12. Colorado WaterResour. Res. Inst., Colorado State University.
Datta, P.S., Deb, D.L., Tyagi, S.K., 1996. Stable isotope (18O) investigations on theprocesses controlling fluoride contamination of groundwater. J. Contamin.Hydrol. 24, 85–96.
de Condappa, D., 2005. Study of the Spatialized Water Flow Processes of the VadoseZone of Hard-rock Aquifers. Implementation for the Evaluation of the Rechargeat the Watershed Scale, Maheshwaram watershed, Andhra Pradesh, India (inFrench). PhD Thesis, Univ. Grenoble, France.
Dewandel, B., Lachassagne, P., Wyns, R., Maréchal, J.C., Krishnamurthy, N.S., 2006. Ageneralized 3-D geological and hydrogeological conceptual model of graniteaquifers controlled by a single or multiple weathering. J. Hydrol. 330, 260–284.
Dewandel, B., Gandolfi, J.-M., de Condappa, D., Ahmed, S., 2008. An efficientmethodology for estimating irrigation return flow coefficients of irrigated cropsat watershed and seasonal scales. Hydrol. Process. 22, 1700–1712.
Dewandel, B., Perrin, J., Ahmed, S., Aulong, S., Hrkal, Z., Lachassagne, P., Samad, M.,Massuel, S., 2010. Development of a Tool for managing groundwater resourcesin semi-arid hard rock regions. Application to a rural watershed in south India.Hydrol. Process. 24, 2784–2797.
Edmunds, W.M., Smedley, P.L., 2005. Fluoride in natural waters. In: Selinus, O.,Alloway, B., Centeno, J.A., Finkelman, R.B., Fuge, R., Lindh, U., Smedley, P. (Eds.),Essentials of Medical Geology. Elsevier Academic Press, pp. 301–329 (Chapter12).
Gaus, I., Audigane, P., André, L., Lions, J., Jacquemet, N., Durst, P., Czernichowski-Lauriol, I., Azaroual, M., 2008. Geochemical and solute transport modelling forCO2 storage, what to expect from it? Int. J. Greenhouse Gas Control 2, 605–625.
Ghezzehei, T.A., Kneafsey, T.J., Su, G.W., 2007. Correspondence of the Gardner andvan Genuchten–Mualem relative permeability function parameters. WaterResour. Res. 43, W10417.
116 M. Pettenati et al. / Applied Geochemistry 29 (2013) 102–116
Gundekar, H., Khodke, U., Sarkar, S., Rai, R., 2008. Evaluation of pan coefficient forreference crop evapotranspiration for semi-arid region. Irrig. Sci. 26, 169–175.
Hammecker, C., Van Asten, P., Marlet, S., Maeght, J.-L., Poss, R., 2009. Simulating theevolution of soil solutions in irrigated rice soils in the Sahel. Geoderma 150,129–140.
Hunter, K.S., Wang, Y.F., Van Cappellen, P., 1998. Kinetic modeling of microbially-driven redox chemistry of subsurface environments: coupling transport,microbial metabolism and geochemistry. J. Hydrol. 209, 53–80.
Jacks, G., Bhattacharya, P., Chaudhary, V., Singh, K.P., 2005. Controls on the genesisof some high-fluoride groundwaters in India. Appl. Geochem. 20, 221–228.
Jacks, G., Harikumar, P.S., Bhattacharya, P., 2009. Fluoride mobilisation in India. In:Goldschmidt Conf. Abstr., June 21–26, 2009, Davos, Switzerland, A578.
Kumar, D., Ahmed, S., 2003. Seasonal behavior of spatial variability of groundwaterlevel in a granitic aquifer in monsoon climate. Curr. Sci. 84, 188–196.
Lotse, E.G., Datta, N.P., Tomar, K.P., Motsara, M.R., 1972. Mineralogical compositionof some red and black soils of India. Prec. Ind. Natl. Sci. Acad. 40B, 216–226.
Maréchal, J.C., Dewandel, B., Ahmed, S., Galeazzi, L., Zaidi, F.K., 2006. Combinedestimation of specific yield and natural recharge in semi-arid groundwaterbasin with irrigated agriculture. J. Hydrol. 329, 281–293.
Mason, B., Moore, C.B., 1982. Principles of Geochemistry. Wiley, New York.Milnes, E., Perrochet, P., 2006. Direct simulation of solute recycling in irrigated
areas. Adv. Water Resour. 29, 1140–1154.Négrel, Ph., Millot, R., Roy, S., Guerrot, C., Pauwels, H., 2010. Lead isotopes in
groundwater as an indicator of water-rock interaction (Maheshwaramcatchment, Andhra Pradesh, India). Chem. Geol. 274, 136–148.
Négrel, Ph., Pauwels, H., Dewandel, B., Gandolfi, J.M., Mascré, C., Ahmed, S., 2011.Understanding groundwater systems and their functioning through the study ofstable water isotopes in a hard-rock aquifer (Maheshwaram watershed, India).J. Hydrol. 397, 55–70.
Palandri, J.L., Kharaka, Y.K., 2004. A Compilation of Rate Parameters of Water-mineral Interaction Kinetics for Application to Geochemical Modelling. U.S.Geol. Surv. Open-File Rep. 2004-1068.
Parkhurst, D.L., Appelo, C.A.J., 1999. User’s Guide to PHREEQC (Version 2) – AComputer Program for Speciation, Batch-Reaction, One Dimensional Transport,and Inverse Geochemical Calculation. U.S. Geol. Surv. Water Resour. Invest. Rep.99–4259.
Pauwels, H., Roy, S., Négrel, Ph., Ahmed, S., Dewandel, B., Gandolfi, J.M., Atal, S.,2007. Genesis and control of fluoride concentrations in groundwater of a smallagricultural watershed (Masheshwaram, Andhra Pradesh, India). In: 3rdInternational Groundwater Conference (IGC-2007) on Water, Environmentand Agriculture, Feb. 7–10, 2007. Combinatore, India.
Pauwels, H., Negrel, P., Bouzit, M., Aquilina, L., Labasque, T., Perrin, J., Fatima, S.,2010. Vulnerability of over-exploited groundwater to fluoride contamination.In: Birkle, P., Torres-Alvarado, I.S. (Eds.), Water Rock Interaction 13. Proc. 13thInternat. Symp. Water–Rock interaction, WRI 13, Balkema, pp. 415–418.
Perrin, J., Mascré, C., Pauwels, H., Ahmed, S., 2011. Solute recycling: an emergingthreat to groundwater resources in southern India? J. Hydrol. 398, 144–154.
Pettenati, M., Croiset, N., Picot-Colbeaux, G., Casanova, J., Azaroual, M., Besnard, K.,Rampnoux, N., in press. Optimisation of waste water treatments through
combined geomaterials and natural soil filter: modelling tools. J. Water ReuseDesalin. 2(4), 185–193.
Pickens, J., Grisak, G., 1981. Scale-dependent dispersion in a stratified granularaquifer. Water Resour. Res. 17, 1191–1211.
Purushotham, D., Prakash, M.R., Narsing Rao, A., 2011. Groundwater depletion andquality deterioration due to environmental impacts in Maheshwaramwatershed of R.R. district, AP (India). Environ. Earth Sci. 62, 1707–1721.
Raichur, A., Jyoti Basu, M., 2001. Adsorption of fluoride onto mixed rare earthoxides. Sep. Purif. Technol. 24, 121–127.
Rao, N.S., 1997. The occurence and behavior of fluoride in the groundwater of theLower Vamsadhara River Basin, India. Hydrol. Sci. J. 42, 877–892.
Rao, N.S., 2003. Groundwater quality: focus on fluoride concentration in rural partsof Guntur district, Andhra Pradesh, India. Hydrol. Sci. J. 48, 835–847.
Rao, N.S., Devadas, D.J., 2003. Fluoride incidence in groundwater in an area ofPeninsular India. Environ. Geol. 45, 243–251.
Rao, A.T., Appa Rao, G., Prabhakara Rao, P., 1979. Fluorian allanite from calc-granulite and pegmatite contacts at Garividi, Andhra Pradesh, India. Mineral.Mag. 43, 312.
Reddy, D.V., Nagabhushanam, P., Sukhija, B.S., Reddy, A.G.S., Smedley, P.L., 2010.Fluoride dynamics in the granitic aquifer of the Wailapally watershed, Nalgondadistrict, India. Chem. Geol. 269, 278–289.
Saxena, V.K., Ahmed, S., 2003. Inferring the chemical parameters for the dissolutionof fluoride in groundwater. Environ. Geol. 43, 731–736.
Smedley, P.L., Kinniburgh, D.G., 2002. A review of the source, behaviour anddistribution of arsenic in natural waters. Appl. Geochem. 17, 517–568.
Smedley, P.L., Zhang, M., Zhang, G., Luo, Z., 2003. Mobilization of arsenic and othertrace elements in fluviolacustrine aquifers of the Huhhot Basin, Inner Mongolia.Appl. Geochem. 18, 1453–1477.
Srinivasulu, A., Satyanarayana, T.V., Hema Kumar, H.V., 2005. Subsurface drainage ina pilot area in Nagajuna Sagar right canal command, India. Irrig. Drain. Syst. 19,61–70.
Sujana, M.G., Soma, G., Vasumathi, N., Anand, S., 2009. Studies on fluorideadsorption capacities of amorphous Fe/Al mixed hydroxides from aqueoussolutions. J. Fluorine Chem. 130, 749–754.
van Genuchten, M., 1980. A closed form equation for predicting the hydraulicconductivity of unsaturated soils. Soil Sci. Soc. Am. J. 44, 892–898.
White, A.F., Peterson, M.L., 1990. Role of reactive surface area characterization ingeochemical models. In: Melchior, D.C., Bassett, R.L. (Eds.), Chemical Modellingof Aqueous Systems II. Am. Chem. Soc. Symp. Ser. 416, 416–475.
White, A.F., Schulz, M.J., Lowenstern, J.B., Vivit, D.V., Bullen, T.D., 2005. Theubiquitous nature of accessory calcite in granitoid rocks: implications forweathering, solute evolution, and petrogenesis. Geochim. Cosmochim. Acta 69,1455–1471.
Wilkie, J.A., Hering, J.G., 1996. Adsorption of arsenic onto hydrous ferric oxide:effect of adsorbate/adsorbent ratios and co-occurring solutes. Colloid Surf. 107,97–110.
Xu, M., Eckstein, Y., 1995. Use of weighted least-squares method in evaluation of therelationship between dispersivity and field scale. Ground Water 33, 905–908.