Simulating microbial degradation of organic matter in a simpleporous system using the 3-D diffusion-based model MOSAIC
O. Monga1, P. Garnier2, V. Pot2, E. Coucheney3, N. Nunan3, W. Otten4, and C. Chenu5
1UMMISCO-Cameroun, Unité Mixte Internationale de recherche UMMISCO, Université de Yaoundé 1 (Cameroun), Institutde Recherche pour le Développement (IRD), Université de Paris 6, Paris, France2INRA, AgroParisTech, UMR1091 EGC, 78850, Thiverval-Grignon, France3CNRS, UMR7618 – Biogéochimie et Ecologie des Milieux Continentaux, 78850, Thiverval-Grignon, France4The SIMBIOS Centre, University of Abertay Dundee, Kydd Building, Dundee, DD1 1HG, UK5AgroParisTech, UMR7618 – Biogéochimie et Ecologie des Milieux Continentaux, 8850, Thiverval-Grignon, France
Received: 1 July 2013 – Published in Biogeosciences Discuss.: 2 October 2013Revised: 7 March 2014 – Accepted: 7 March 2014 – Published: 22 April 2014
Abstract. This paper deals with the simulation of microbialdegradation of organic matter in soil within the pore spaceat a microscopic scale. Pore space was analysed with micro-computed tomography and described using a sphere networkcoming from a geometrical modelling algorithm. The bio-logical model was improved regarding previous work in or-der to include the transformation of dissolved organic com-pounds and diffusion processes. We tested our model usingexperimental results of a simple substrate decomposition ex-periment (fructose) within a simple medium (sand) in thepresence of different bacterial strains. Separate incubationswere carried out in microcosms using five different bacterialcommunities at two different water potentials of−10 and−100 cm of water. We calibrated the biological parametersby means of experimental data obtained at high water con-tent, and we tested the model without changing any parame-ters at low water content. Same as for the experimental data,our simulation results showed that the decrease in water con-tent caused a decrease of mineralization rate. The model wasable to simulate the decrease of connectivity between sub-strate and microorganism due the decrease of water content.
1 Introduction
It is increasingly recognized that accessibility is one ofthe major factors governing soil organic matter decompo-sition (Dungait et al., 2012). Indeed, soil microorganisms
live in a complex network of pores, resulting from the three-dimensional arrangement of soil solid particles. This networkis more or less filled with air and water, variously inter-connected and in which microorganisms as well as organicresources are spatially heterogeneous (Chenu and Stotzky,2002; Nunan et al., 2003, 2007; Young et al., 2008). Mi-crobial degradation of soil organic matter is then expectedto depend on the accessibility of organic matter to microor-ganisms at the microscale (i.e. on their spatial co-occurrenceor separation, and on the rates of diffusion of substrates andenzymes, as well as on local favourable conditions for themicroorganisms).
Current models of soil organic matter dynamics, such asCENTURY (Kelly et al.,1997) and RothC (Coleman et al.,1997), do not take such microscale processes into account,but they typically are process-oriented multi-compartmentalmodels that divide soil organic matter into conceptual poolswith distinct turnover times, assuming that a combination ofbiochemical and physical properties controls decay (Man-zoni and Porporato, 2009). Soil texture or clay content isused in some models to modify decomposition processes, butthe majority of the models treat soil as homogeneous. Thesemodels are capable of simulating soil organic matter dynam-ics at long timescales (Smith et al., 1997), but they are limitedin their ability to predict short-term changes in soil organicmatter (SOM) degradation or to account for changes in soilstructure or moisture (Gottschalk et al., 2010; Falloon et al.,2011). Mechanistic representation of small-scale processes is
Published by Copernicus Publications on behalf of the European Geosciences Union.
2202 O. Monga et al.: 3-D model of microbial degradation in sand
identified as one of the priorities to improve soil organic mat-ter dynamics models (Manzoni and Porporato, 2009). Recentmodelling efforts have attempted to understand how micro-bial processes such as decomposition or competition amongspecies are affected by diffusion in 1-D or 2-D homogeneousporous media (Long and Or, 2009; Ingwersen et al., 2008).A few recent studies have also simulated microbial degrada-tion in structured environments. Gharasoo et al. (2012) havedeveloped a 2-D pore network model able to simulate thebiodegradation of a dissolved contaminant in a virtual porenetwork according to different scenarios of microbial spatialdistributions. Resat et al. (2012) have built a model wheresoluble substrate and enzyme kinetics were described withcontinuous partial differential equations on a 3-D grid. Thepore distribution in aggregates was projected onto a con-structed lattice grid where each grid unit was labelled witha pore parameter, which defined it as solid or porous.
So far the spatial complexity of the pore network in realsoils has rarely been explicitly represented. Exceptions in-clude recent work by Kravchenko et al. (2012), who used a 3-D microscopic-based biophysical model to explore how man-agement affects fungal colonization and interaction. This ispartly because it has been possible only recently to visualizethe soil pore network, using X-ray microtomography (Peth etal., 2008; Mooney, 2002; Wildenschild and Sheppard, 2013)and therefore obtain the data necessary to produce an explicitdescription of the microscale structure of soil. Computed to-mography images provide a first rough pore space represen-tation by means of a set of voxels. However, the size of thisrepresentation, typically up to 30 million of voxels, is toohigh to be used effectively for simulating soil processes inthe pore space, and is restricted to relatively small volumesof soil (Kravchenko et al., 2011). Using X-ray tomographyimages as model input data, Monga et al. (2007) derivedfrom this a network of volume primitives to produce a ge-ometrical representation of pore space in soil that had sim-ilar properties (i.e. total pore volume, pore connectivity) tothose of real soil samples. Biological activity was incorpo-rated and the decomposition of organic matter was simulatedat the microscale (Monga et al., 2008). The latter model didnot, however, take into account the diffusion of dissolved or-ganic matter that we believe to be an important regulator ofmicrobial decomposition in soil.
The objective of the present paper is to test our modellingapproach, partly described in Monga et al. (2008, 2009) withreal data of soil structure and measurements of decomposi-tion of dissolved organic matter. We introduced the diffusionprocess into the graph-based approach using Fick’s laws tosimulate mass exchanges between pores. We used an experi-mental system where it was possible to control and measurevariables that enabled us to test and parameterize our model(soil pore space geometry together with biological variables).Specifically, we experimentally quantified the effect of mois-ture content within a soil structure on the microbial degra-dation of fructose. We investigated the performance of the
model by testing its ability to reproduce (i) the water reten-tion relationship for the microcosms and (ii) the consequenceof water distribution on the microorganisms respiration. Wecompared the results of our 3-D modelling approach withthose obtained using a moisture limiting function from theliterature.
2 Material and methods
2.1 MOSAIC II model
As described in Monga et al. (2007) and Ngom et al. (2012),we approximated the geometry of the pore space by a net-work of volume primitives. To do so, we used a geometricalalgorithm based on Delaunay triangulation to calculate theset of maximal spheres that describe the pore space geome-try. Then we extracted a minimal set of the maximal spheresin order to obtain a compact representation of the porespace. A relational attributed valuated graph (“graph-basedapproach”) was finally attached to the spheres (Monga etal., 2007). LetG(t) = (Bi,Ai,Fi(t)) be the valuated graph,where (Bi) denotes the set of nodes (spheres) of the graph,(Ai) the set of arcs and (Fi(t)) the feature vector defining thephysical and biological parameters of the nodesi at a giventime t . We assumed that the pore space does not vary, andtherefore only the biological features and dissolved organicmatter (DOM) depend on time as detailed below.
In previous version of our model (Monga et al.,2008), we modelled organic matter decomposition using anoffer–demand approach (Masse et al., 2007). We assumedthat, depending on the minimum values of the degradationrate of solid organic matter or microbial growth rate (bothexpressed in C units), one of these two kinetics was domi-nating the decomposition rate. Here we extended the modelby including DOM, coming from the hydrolysis of solid or-ganic matter as one intermediate compartment that is oftenincluded in soil organic matter models (e.g. Garnier et al.,2003). A geodesic distance was previously used to connectDOM and microbial biomass located in different pores. Thegeodesic distance led to an immediate availability of the sub-strate for microorganisms if connecting paths exist. In thisnew version of the model, we modified the organic matterdecomposition module in order to describe the production ofdissolved organic matter by hydrolysis of solid organic mat-ter and introduce mechanistic diffusion of DOM in pores. Asin soils, DOM diffuses between microbial habitats, where itis assimilated and mineralized. The microbial decompositionsimulation was processed by graph updating using time dis-cretization as described in Monga et al. (2008).
Let Bk in G be a node attached to a volume primitive(i.e. pore). The biological and physical featuresFk(t) thatdescribeBk are as follows:
O. Monga et al.: 3-D model of microbial degradation in sand 2203Figures
Figure 1: Biological model
Fig. 1.Biological model.
– Fk(1)(t): mass of microbial biomass (MB) (gC),
– Fk(2)(t): mass of dissolved organic matter (DOM)(gC),
– Fk(3)(t): mass of soil organic matter (SOM) (gC),
– Fk(4)(t): mass of fresh organic matter (FOM) (gC),
– Fk(5)(t): mass of inorganic carbon CO2 (gC),
– Fk(6)(t): presence of water or air,
– Fk(7)(t): volume of the sphere.
We described the microbial decomposition process with fivecompartments (Fig. 1), namely MB (microbial biomass),FOM (fresh organic matter), SOM (soil organic matter),DOM (dissolved organic matter) and CO2 (mineralized or-ganic matter). FOM and SOM are decomposed rapidly andslowly, respectively. DOM comes from the hydrolysis ofSOM and FOM. DOM diffuses through water paths (water-filled spheres) and is consumed by MB for its growth. Wehypothesized that MB does not move. Dead microorganismsare recycled into SOM and DOM. MB respires by producinginorganic carbon (CO2), as represented in Fig. 1.
The changes of the biological featuresFi(t) within a timestep1t in a water-filled sphereBi are expressed as follows:
Fi (1)(t + 1t) = Fi (1)(t) − ρFi (1)(t) (1)
1t − µFi (1)(t)1t +
(ϑDOMFi (2)(t)
Kb × Fi(7)(t) + Fi (2)(t)
)Fi (1)(t)1t,
Fi (2)(t + 1t) = Fi (2)(t) + pmµFi (1)(t) (2)
1t −
(ϑDOMFi (2)(t)
Kb × Fi(6)(t) + Fi (2)(t)
)Fi (1)(t)
1t + ϑSOMFi (3)(t)1t + ϑFOMFi (4)(t)1t,
Fi (3)(t + 1t) = Fi (3)(t) + (1− pm)µFi (1)(t) (3)
1t − ϑSOMFi (3)(t)1t,
Fi (4)(t + 1t) = Fi (4)(t) − ϑFOMFi (4)(t)1t, (4)
Fi (5)(t + 1t) = Fi (5)(t) + ρFi (1)(t)1t, (5)
whereρ is the relative respiration rate (d−1), µ the relativemortality rate (d−1), pm the proportion of MB that returns toDOM (the other fraction returns to SOM),ϑFOM andϑSOMthe relative decomposition rates of FOM and SOM respec-tively (d−1), andϑDOM (d−1) and Kb (gC) the maximumrelative growth rate of MB and constant of half-saturation ofDOM by MB, respectively.
In MOSAIC II, the implementation of the diffusion pro-cess of DOM within water-filled pore space by updating thevaluated graph representing the pore network was performedaccording to classical diffusion scheme. Diffusion of DOMbetween two connected water-filled pores (Bk, Bp) can beexpressed as the material exchangeδmkp:
δmkp =−D
(dk − dp
)Skpδt
gkp
(6)
with
dk =Fk (2)(t)
43πr3
k
(7)
dp =Fp (2)(t)
43πr3
p
,
whereD denotes the molecular diffusion coefficient of DOMin water (cm2 d−1), gkp corresponds to the distance betweenthe two water-filled pores (cm) (calculated as the distance be-tween the centres of two neighbouring water-filled spheres),dk anddp denote the DOM concentration within the water-filled poresBk andBp (gC cm−3), respectively, andrk andrp denote the radius of the poresBk andBp (cm).Skp is thecontact surface between the two water-filled pores (cm2).
The DOM mass variation due to diffusion can then be ex-pressed as follows (first Fick law):
Fk(2)(t + 1t) = Fk(2)(t) + δmkp, (8)
Fp(2)(t + 1t) = Fp(2)(t) + δmkp. (9)
The mass transfer between water-filled poresBk andBp be-tween timet andt+dt is calculated att . If the total estimatedmass transfer for poreBk, 1mk exceedsFk(2)(t), then theavailable mass is distributed proportionally to the neighbour-ing pores.
Equations (1)–(10) express the change of the biologicaland biochemical vectors describing each of the water-filledpores (graph node) within time step1t . These equations cor-respond to the discrete version of a partial differential equa-tion system (in 3-D space) and describe the biological modelMOSAIC II.
2204 O. Monga et al.: 3-D model of microbial degradation in sand
The distribution of air and water in the sphere network wasperformed by applying an algorithm based on the Young–Laplace law in the sample border to determine spheres filledwith water according to water potential (Monga et al., 2008):
1p =2σ cosθ
req, (10)
with 1p the capillary pressure (m),req the equivalent max-imum radius of water-filled pores (m) at1p, αg the contactangle equal to 0, andσ the surface tension of water equalto 0.0728 N m−1. According to the capillary pressure, thespheresBi were either filled by water (Fi(6)(t) =1) or empty(full of air, Fi(6)= 0). Then an iterative drainage algorithmwas used to drain the remaining water inside the sample ifit was connected to air pathway (Monga et al., 2008). A wa-ter retention curve was predicted this way by calculating thetotal volumetric water content as a function of pressure.
2.2 Biodegradation experiment
In order to test the model, we performed experiments inwhich we monitored the mineralization of a simple solublesubstrate, fructose, by different single bacterial species insand microcosms. Sand was selected as a simplified variantof soil architecture and because it does not add additionalSOM to the system. The 3-D structure of soil pore space ofthe sand was obtained by X-ray microCT (described below).
A range of bacterial species with differing physiologi-cal properties were selected: threeArthrobacterspecies re-named as 3R, 7R, and 9R; and twoRhodococcusspecies re-named as 5L and 6L. The different bacterial strains testedwere isolated from a soil and selected for their ability togrow in a minimal medium amended with fructose in aer-obic conditions (Coucheney, 2009). Microcosms consistedin 60 g of dry sand, placed in an autoclavable glass jar.Quartz sand of Fontainebleau (Prolabo), with 150–300 µmgrain size, was used after rinsing with deionized water anddrying in an oven for 1 h at 500◦C in order to oxidizeany remaining organic matter present. An amount of purebacterial cultures (Approx. 10∧6 cells) of each species wasinoculated in the sterile sand microcosms with a minimalmedium (1.28 % Na2HPO4–7H2O, 0.3 % KH2PO4, 0.05 %NaCl, 0.1 % NH4Cl, 0.024 % MgSO4 and 0.001 % CaCl2;Sambrook et al., 1989) containing fructose as a sole carbonsource (8 mg C/microcosm, i.e. 0.13 mg g−1 sand) in threereplicates. The minimal medium containing the bacterial sus-pension was thoroughly mixed with the sand under sterileconditions, disposed in a Petri dish and compacted at a fixeddensity of 1.56 g cm−3. The amount of water was adjustedin order to achieve two contrasting gravimetric water con-tents of 0.216 and 0.087 g H2O g−1 sand (equivalent to waterpotentials of−10 and−100 cm, respectively). The concen-trations of fructose were 0.26 and 1.53 mg C cm−3 of waterfor high and low water contents, respectively. The concentra-tions of bacteria were 4.10−9 and 10−8 mg C cm−3 of water
for high and low water contents, respectively (we assumedthat one bacterium contains 5.10−14 mg C). Each microcosmwas then closed inside an air-tight jar and incubated for aweek at 25◦C. An aliquot of a few microlitres of the atmo-sphere was taken daily and analysed by gas chromatography(Agilent 3000A) in order to measure CO2 concentration inthe atmosphere of the jar. All measurements were replicatedthree times.
2.3 Physical characterization of the sand
The water release curve of the sand was measured using pres-sure plates (n = 3). The total porosity of the sand column cal-culated from the water retention curve was 38 %. The sandcolumn was scanned with a high-resolution X-ray micro-computed tomography machine (µSIMCT Equipment: SIM-BIOS Centre University of Abertay Dundee, Scotland) at avoxel resolution of 5 µm. For the numerical simulations, weextracted an image of 500× 500× 500 voxels (i.e. 15 mm3)from the total 3-D image, which was the largest sample wecould comfortably cope with given the memory requirementsand computing times. For the simulations we have done, ona regular PC, a few hours (2–3 h) were necessary to run onesimulation with diffusion. A global threshold was used tosegment the CT images and identify the pore space within the3-D samples. The threshold value was adjusted in order to fita porosity of 31 %. This was the porosity calculated from theexperimental water retention curve considering pores withdiameters larger than 5 µm (i.e. pores filled with water be-tween−600 and 0 cm of water).
2.4 Simulating microbial decomposition by graphupdating with Mosaic II
As fructose is a soluble molecule and the sand was OM-free,we assumed that initially only MB (microbial biomass) andDOM (dissolved organic matter) were present within pores.The DOM was initially spread in a homogeneous way withinthe water-filled pores space with the same amount but withdifferent concentrations for each water content. The MB wasinitially spread randomly within the water-filled pore spacealso with the same amount but with higher concentration forlower water content. At the start of the simulation, SOM andCO2 were equal to zero. The duration of the microbial de-composition simulation was 7 days. We assumed that oxygenwas not a limiting factor of biodegradation.
We emptied the spheres of their water according to thedrainage algorithm. For this, we calculated the radius thresh-olds,r1 andr2, given by Young–Laplace law (Eq. 12) for thetwo water potentials of the experiment, which were1p1 =
−10 cm (high water potential) and1p2 = −100 cm (low wa-ter potential) as being respectively 145 µm and 14.5 µm. Inthe following components of the simulation, we retained onlythe water-filled pores.
O. Monga et al.: 3-D model of microbial degradation in sand 2205
Table 1.Parameter values estimated by the calibration of MOSAIC II from carbon mineralization curves registered from incubation of eachspecies with fructose at high water content (whereϑDOM is the maximum growth rate,Kb is the constant of half-saturation,µ is the mortality,ρ is the respiration,pm is the proportion of MB that returns to DOM) with their respective efficiency coefficients.
Simulations were carried out in two steps. In the first step,the five parameters of the model (ϑDOM, Kb, µ, ρ, pm) werecalibrated using the experimental CO2 mineralization curveobtained at the high water potential of−10 cm (Table 1) foreach species. We used the same diffusion parameter for allspecies. The parameter estimation was carried out by trialand error.
In the second step, we tested the model with the data ob-tained at low water potential of−100 cm. We kept the samebiological parameters obtained at the high water potential.We assumed that the differences of mineralization betweenboth water contents came from the diffusion limitation due tothe lower soil moisture. We hypothesized that the physiologyof microorganisms (i.e. their maximal growth rate, constantof half saturation or mortality rate) was not affected by thedecrease in moisture, because the water potential remainedtoo high to cause a physiological stress (Manzoni et al.,2012). The bacteria are supposed to be attached to the solidparticles and are submitted to the same micro-environmentat−10 or−100 cm of water. Several studies have found thatdiffusion limitation was the main factor explaining the de-crease of respiration with soil moisture (e.g. Harms, 1996;Dechesne et al., 2010; Moyano et al., 2013). A meta-analysisby Manzoni et al. (2012) showed that moisture soil respira-tion curves were not affected by microbial community com-position, which they interpreted by other factors than micro-bial physiology controlling respiration (i.e. solute diffusiv-ity).
2.5 Simulating microbial decomposition with a simpleapproach
We compared also our results with the results obtained froma simpler approach. We simulated the effect of moisture ondegradation by using a simple moisture limitation functioninstead of calculating the change in connected water path-way with Mosaic II. The biological system of Fig. 1 wassimulated in one sphere of Mosaic II to remove the spatialdimension. Parameters of step 1 were used to simulate thelower water potential of−10 cm. We simulated the water po-tential of −100 cm by using the limitation function used in
RothC and described in Jenkinson and Coleman (2008). Themicrobial growth rate (µ) was multiplied by this limitationfunction equal to 0.7 for the water content change from−10to −100 cm (Fig. 5).
2.6 Statistics
The effectiveness of simulations was determined by calcu-lating the efficiency coefficient (EF) for CO2 mineralizationcurve of each bacterial species:
EF=
n∑i=1
(Oi − O)2−
n∑i=1
(Si − O)2
n∑i=1
(Oi − O)2, (11)
wheren is the number of experimental observations of CO2;Si and Oi are the simulated and observed values, respec-tively; andO is the average ofn experimental values.
3 Results and discussion
3.1 Simulation of sand structure and water retention
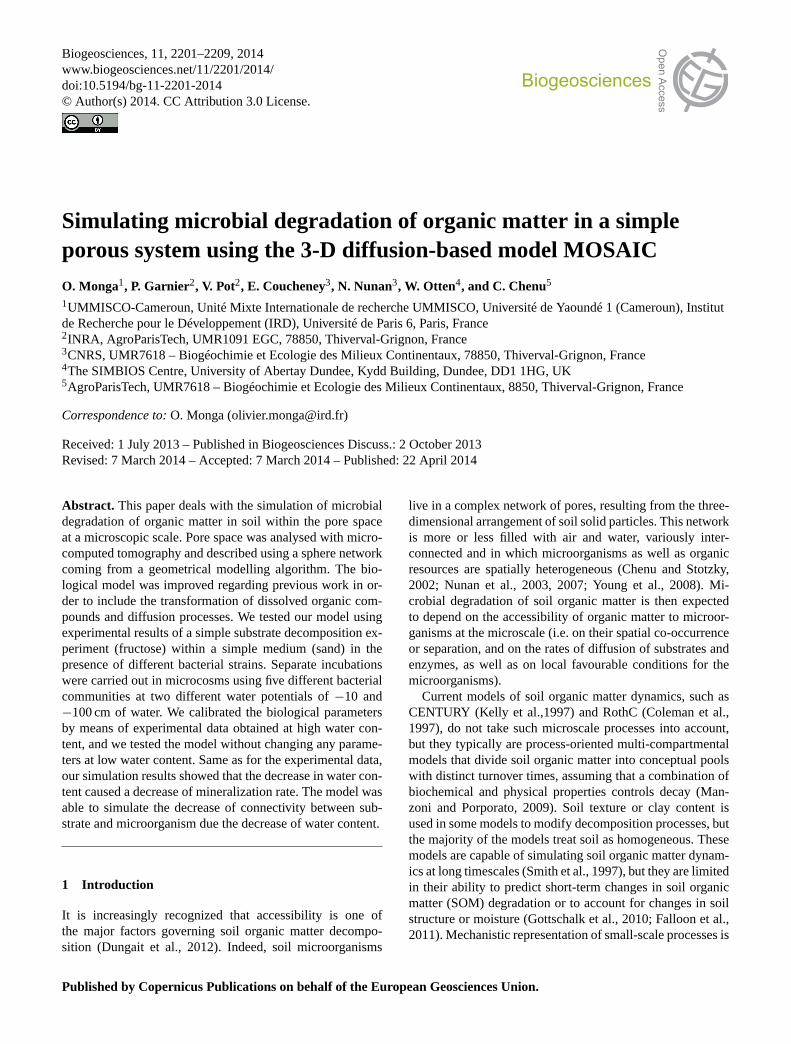
Figure 2 shows 2-D sections of the CT images of the sandmicrocosms and the segmented images (Fig. 2c) that wereused as the initial data to define the pore space and param-eterize the physical model. Figures 3 and 4 present the re-sulting minimal set of maximal spheres of the sand porespace. We applied the drainage algorithm for the two ra-dius thresholds, and we obtained different sphere networksdepending on water potential, which included 860 710 and782 691 water-filled spheres for the high and low water po-tentials respectively with a percentage of water in total porevolume of 99 % and 24 %, respectively. We found 704 and43 067 sets of connected spheres for high and low waterpotentials, respectively, that occupied an average volume of80 550 and 334 voxels, respectively. These results indicatedthat although the numbers of water-filled spheres were not sodifferent between both water potentials, the connectivity wasstrongly affected by the decrease of water content.
2206 O. Monga et al.: 3-D model of microbial degradation in sand
Figure 2: View of a slice (1650x1650 pixels) of the CT image of the sand (a). View of a slice
(400 x 400 pixels) extracted of the 3D image (b) and segmented image (c). In figures (a) and
(b) the grey level intensity is proportional to the density of the material, while in the
segmented image (c) the pore space is in black and the solid phase is in white. The porosity
comprising pores ≥ 5 µm diameter is 31%.
(a) (c) (b)
Fig. 2. View of a slice (1650× 1650 pixels) of the CT image of thesand(a). View of a slice (400× 400 pixels) extracted of the 3-Dimage(b) and segmented image(c). In (a) and (b) the grey levelintensity is proportional to the density of the material, while in thesegmented image(c) the pore space is in black and the solid phaseis in white. The porosity comprising pores≥ 5 µm diameter is 31 %.
Figure 3: Perspective views of the sphere based pore space of the sand. The spheres whose
radius were higher than 10 µm were displayed.
0.5 mm
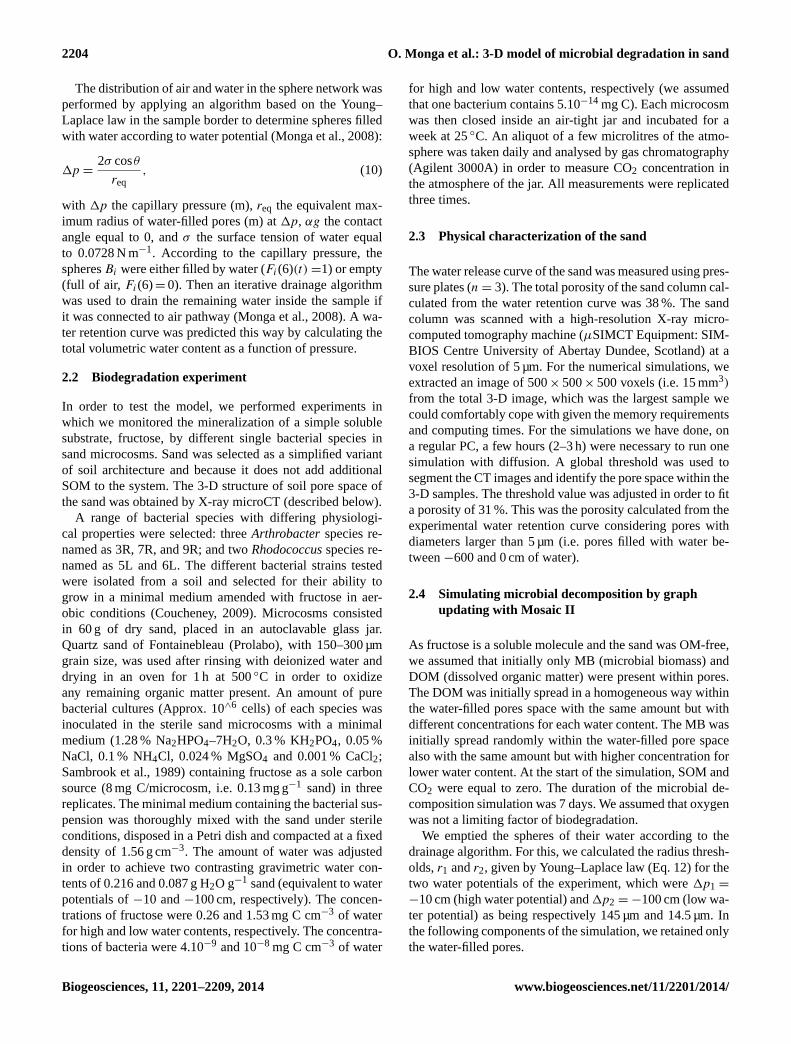
Fig. 3.Perspective views of the sphere-based pore space of the sand.The spheres whose radii were higher than 10 µm were displayed.
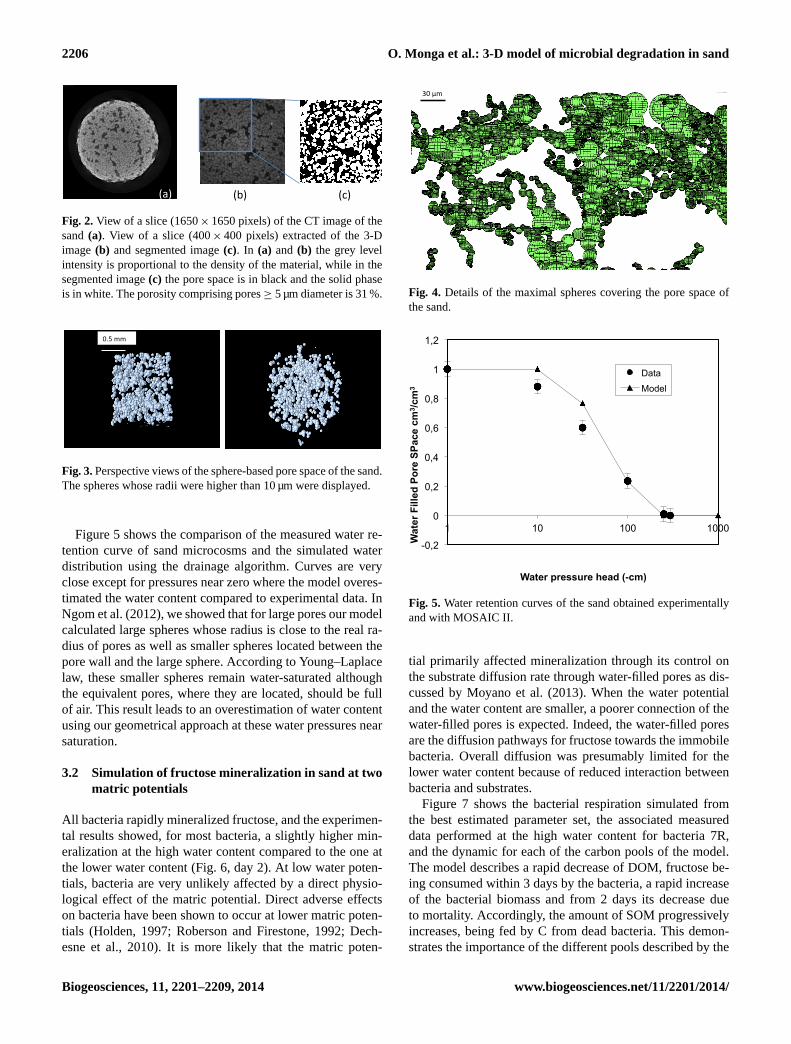
Figure 5 shows the comparison of the measured water re-tention curve of sand microcosms and the simulated waterdistribution using the drainage algorithm. Curves are veryclose except for pressures near zero where the model overes-timated the water content compared to experimental data. InNgom et al. (2012), we showed that for large pores our modelcalculated large spheres whose radius is close to the real ra-dius of pores as well as smaller spheres located between thepore wall and the large sphere. According to Young–Laplacelaw, these smaller spheres remain water-saturated althoughthe equivalent pores, where they are located, should be fullof air. This result leads to an overestimation of water contentusing our geometrical approach at these water pressures nearsaturation.
3.2 Simulation of fructose mineralization in sand at twomatric potentials
All bacteria rapidly mineralized fructose, and the experimen-tal results showed, for most bacteria, a slightly higher min-eralization at the high water content compared to the one atthe lower water content (Fig. 6, day 2). At low water poten-tials, bacteria are very unlikely affected by a direct physio-logical effect of the matric potential. Direct adverse effectson bacteria have been shown to occur at lower matric poten-tials (Holden, 1997; Roberson and Firestone, 1992; Dech-esne et al., 2010). It is more likely that the matric poten-
Figure 4: Details of the maximal spheres covering the pore space of the sand
30 µm
Fig. 4. Details of the maximal spheres covering the pore space ofthe sand.
Figure 5: Water retention curves of the sand obtained experimentally and with MOSAIC II
-0,2
0
0,2
0,4
0,6
0,8
1
1,2
1 10 100 1000
Wat
er F
illed
Por
e SP
ace
cm3 /c
m3
Water pressure head (-cm)
Data Model
Fig. 5. Water retention curves of the sand obtained experimentallyand with MOSAIC II.
tial primarily affected mineralization through its control onthe substrate diffusion rate through water-filled pores as dis-cussed by Moyano et al. (2013). When the water potentialand the water content are smaller, a poorer connection of thewater-filled pores is expected. Indeed, the water-filled poresare the diffusion pathways for fructose towards the immobilebacteria. Overall diffusion was presumably limited for thelower water content because of reduced interaction betweenbacteria and substrates.
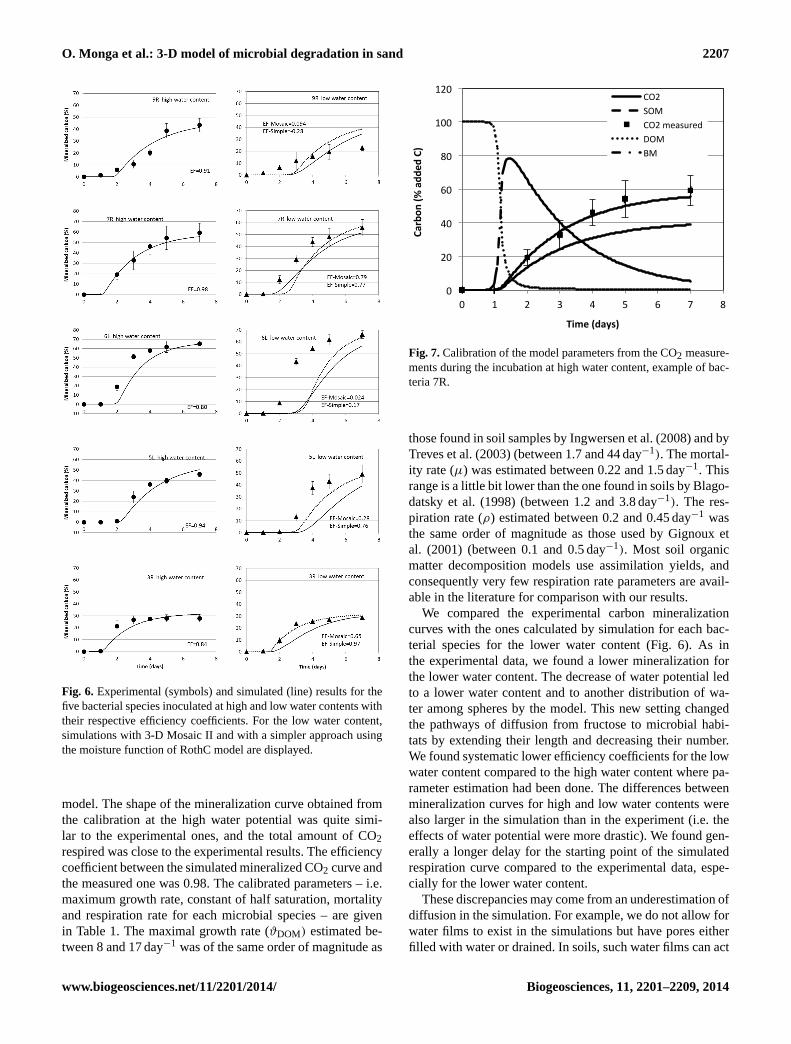
Figure 7 shows the bacterial respiration simulated fromthe best estimated parameter set, the associated measureddata performed at the high water content for bacteria 7R,and the dynamic for each of the carbon pools of the model.The model describes a rapid decrease of DOM, fructose be-ing consumed within 3 days by the bacteria, a rapid increaseof the bacterial biomass and from 2 days its decrease dueto mortality. Accordingly, the amount of SOM progressivelyincreases, being fed by C from dead bacteria. This demon-strates the importance of the different pools described by the
O. Monga et al.: 3-D model of microbial degradation in sand 2207
Figure 6: Experimental (symbols) and simulated (line) results for the 5 bacterial species
inoculated at high and low water contents with their respective efficiency coefficients. For the
Fig. 6. Experimental (symbols) and simulated (line) results for thefive bacterial species inoculated at high and low water contents withtheir respective efficiency coefficients. For the low water content,simulations with 3-D Mosaic II and with a simpler approach usingthe moisture function of RothC model are displayed.
model. The shape of the mineralization curve obtained fromthe calibration at the high water potential was quite simi-lar to the experimental ones, and the total amount of CO2respired was close to the experimental results. The efficiencycoefficient between the simulated mineralized CO2 curve andthe measured one was 0.98. The calibrated parameters – i.e.maximum growth rate, constant of half saturation, mortalityand respiration rate for each microbial species – are givenin Table 1. The maximal growth rate (ϑDOM) estimated be-tween 8 and 17 day−1 was of the same order of magnitude as
Figure 7: Calibration of the model parameters from the CO2 measurements during the
incubation at high water content, example of bacteria 7R.
0
20
40
60
80
100
120
0 1 2 3 4 5 6 7 8
Carbon
(% add
ed C)
Time (days)
CO2 SOM CO2 measured DOM BM
Fig. 7.Calibration of the model parameters from the CO2 measure-ments during the incubation at high water content, example of bac-teria 7R.
those found in soil samples by Ingwersen et al. (2008) and byTreves et al. (2003) (between 1.7 and 44 day−1). The mortal-ity rate (µ) was estimated between 0.22 and 1.5 day−1. Thisrange is a little bit lower than the one found in soils by Blago-datsky et al. (1998) (between 1.2 and 3.8 day−1). The res-piration rate (ρ) estimated between 0.2 and 0.45 day−1 wasthe same order of magnitude as those used by Gignoux etal. (2001) (between 0.1 and 0.5 day−1). Most soil organicmatter decomposition models use assimilation yields, andconsequently very few respiration rate parameters are avail-able in the literature for comparison with our results.
We compared the experimental carbon mineralizationcurves with the ones calculated by simulation for each bac-terial species for the lower water content (Fig. 6). As inthe experimental data, we found a lower mineralization forthe lower water content. The decrease of water potential ledto a lower water content and to another distribution of wa-ter among spheres by the model. This new setting changedthe pathways of diffusion from fructose to microbial habi-tats by extending their length and decreasing their number.We found systematic lower efficiency coefficients for the lowwater content compared to the high water content where pa-rameter estimation had been done. The differences betweenmineralization curves for high and low water contents werealso larger in the simulation than in the experiment (i.e. theeffects of water potential were more drastic). We found gen-erally a longer delay for the starting point of the simulatedrespiration curve compared to the experimental data, espe-cially for the lower water content.
These discrepancies may come from an underestimation ofdiffusion in the simulation. For example, we do not allow forwater films to exist in the simulations but have pores eitherfilled with water or drained. In soils, such water films can act
2208 O. Monga et al.: 3-D model of microbial degradation in sand
as diffusion pathways and connect sites that appear separateotherwise in the simulation. In addition, because of the res-olution of 5 µm of the microCT scans, the pores of smallerdiameter cannot be visualized and hence are not accountedfor in the simulation with MOSAIC II. However, such poresmay contribute significantly to diffusion of the substrate, es-pecially when the water content is low, where pores< 5 µmrepresent a proportion of water-filled pores of 7 % (calcu-lated from the water retention curve). We very likely under-estimated the diffusion pathways. This limit is not intrinsicto the MOSAIC II model but to its use with microCT imageshaving insufficient resolution regarding the processes stud-ied.
The mineralization of fructose simulated with a simplerapproach using the moisture function of RothC also under-estimated the experimental mineralization (Fig. 6). The effi-ciency coefficients were higher for 3R, 5L, and 6L and lowerfor 9R and 7R compared to those obtained using the 3-DMOSAIC II approach. The moisture function proposed in theliterature, as the one used in RothC, gave similar trends as theone explicitly calculated using our 3-D approach.
4 Conclusion and perspectives
The decomposition of soil organic matter is highly impactedby water content, and poor accounting of this control by cur-rent soil organic matter dynamics models is a major sourceof uncertainty (Falloon et al., 2011). The soil water contentand energy state has both direct impacts on microbial physi-ology, especially at extreme values, and indirect impacts viathe diffusion of oxygen and that of solutes like soluble car-bon and nitrogen compounds (Moyano et al., 2013). Theseprocesses affect the microbial decomposition kinetics. Cur-rent compartment-based soil organic matter models use em-pirical functions to describe the effect of limiting water con-tent on decomposition rates (Moyano et al., 2012). In MO-SAIC II, the explicit description of the 3-D interactions be-tween decomposition actors and organic matter in an unsatu-rated habitat reproduced, without using empirical functions,the decrease of decomposition due to the decrease of watercontent in a realistic way. We simulated explicitly and cal-ibrated for the first time with real data the indirect impactof changing water content on mineralization via the modi-fication of connected water-filled pathways. Our modellingexercise gave results as good as those obtained using a sim-ple moisture function found in the literature. We anticipatethat, for more complex 3-D architectures, such as those ofsoil compared to sand, the simulation using MOSAIC shouldbe superior. Two directions for improvement can be identi-fied: (i) using CT images with a better spatial resolution, asit is increasingly possible using new generationµCTs, in or-der to describe and model the processes within micrometre-scale pores; and (ii) describing better the water connectivityat low water content in the model, accounting for water films.
In future studies more scenarios will be tested using morecomplex systems (real soil and more complex bacterial com-munity) and for different distances between degraders andorganic substrates.
Acknowledgements.This work was financed by the FrenchNational Agency for Research (ANR SYSCOMM) within theMEPSOM project.
Edited by: R. Conant
References
Blagodatsky, S. A., Yevdokimov, I. V., Larinova, A. A., and Richter,J.: Microbial growth in soil and nitrogen turnover: model calibra-tion with laboratory data, Soil Biol. Biochem., 30, 1757–1764,1998.
Chenu, C. and Stotzky, G.: Interactions between microorganismsand soil particles: An overview, in: Interactions between soil par-ticles and microorganisms, edited by: Huang, P. M., Bollag, J.M., and Senesi, N., IUPAC Serie Appl. Geochem., Wiley andSons, New York, 3–40, 2002.
Coleman, K., Jenkinson, D. S., Crocker, G. J., Grace, P. R., Klir,J., Korschens, M., Poulton, P. R., and Richter, D. D., Simulat-ing trends in soil organic carbon in long-term experiments usingRothC-26.3, Geoderma, 81, 29–44, 1997.
Coucheney, E.: Impact of bacterial diversity on community re-sponse to climatic factors: a microcosms study on microbial res-piration and metabolomics, University of Paris 6 (France), 239pp., 2009.
Dechesne, A., Owsianiak, M., Bazire, A., Grundmann, G. L., Bin-ning, P. J., and Smets, B. F.: Biodegradation in a partially satu-rated sand matrix: compounding effects of water content, bacte-rial spatial distribution, and motility, Environ. Sci. Technol., 44,2386–2392, 2010.
Dungait, J. A. J., Hopkins, D. W., Gregory, A. S., and Whitmore, A.P.: Soil organic matter turnover is governed by accessibility notrecalcitrance, Global Change Biology, 18, 1781–1796, 2012.
Falloon, P., Jones, C. D., Ades, M., and Paul, K.: Direct soil mois-ture controls of future global soil carbon changes: An impor-tant source of uncertainty, Global Biogeochem. Cy., 25, GB3010,2011.
Garnier, P., Neel, C., Aita, C., Recous, S., Lafolie, F., and Mary, B.:Modelling carbon and nitrogen dynamics in soil with and withoutstraw incorporation, Europ. J. Soil Sci., 54, 555–568, 2003.
Gharasoo, M., Centler, F., Regnier, P., Harms, H., and Thullner, M.:A reactive transport modeling approach to simulate biogeochem-ical processes in pore structures with pore-scale heterogeneities,Environ. Model. Software, 30, 102–114, 2012.
Gignoux, J., J., H., Hall, D., Masse, D., Nacro, H. B., and Abbadie,L.: Design and test of a generic cohort model of soil organicmatter decomposition: the SOMKO model, Global Ecol. Bio-geochem., 10, 639–660, 2001.
Gottschalk, P., Bellarby, J., Chenu, C., Foereid, B., Smith, P., Wat-tenbach, M., Zingore, S., and Smith, J.: Simulation of soil or-ganic carbon response at forest cultivation sequences using C-13measurements, Organic Geochem., 41, 41–54, 2010.
O. Monga et al.: 3-D model of microbial degradation in sand 2209
Harms, H.: Bacterial growth on distant naphthalene diffusingthrough water, air, and water-saturated and nonsaturated porousmedia, Appl. Environ. Microbiol., 62, 2286–2293, 1996.
Holden: Water stress effects on toluene biodegradation byPseu-domonas putida, Biodegradation, 8, 143–151, 1997.
Ingwersen, J., Poll, C., Streck, T., and Kandeler, E.: Micro-scalemodelling of carbon turnover driven by microbial succession ata biogeochemical interface, Soil Biol. Biochem., 40, 864–878,2008.
Jenkinson, D. S. and Coleman, K.: The turnover of organic carbonin subsoils. Part 2. Modelling carbon turnover, Europ. J. Soil Sci.,59, 400–413, 2008.
Kelly, R. H., Parton, W. J., Crocker, G. J., Grace, P. R., Klir, J.,Korschens, M., Poulton, P. R., and Richter, D. D.: Simulatingtrends in soil organic carbon in long-term experiments using thecentury model, Geoderma, 81, 75–90, 1997.
Kravchenko, A., Falconer, R., Grinev, D., and Otten, W.: Fungalcolonization in soils of contrasting managements: modelling fun-gal growth in 3-D pore volumes of undisturbed soil samples,Ecol. Appl., 21, 1202–1210, 2011.
Long, T. and Or, D.: Dynamics of Microbial Growth and Coexis-tence on Variably Saturated Rough Surfaces, Microb. Ecol., 58,262–275, 2009.
Manzoni, S. and Porporato, A.: Soil carbon and nitrogen mineral-ization: Theory and models across scales, Soil Biol. Biochem.,41, 1355–1379, 2009.
Manzoni, S., Schimel, J. P., and Porporato, A.: Responses of soil mi-crobial communities to water stress: results from a meta-analysis,Ecology, 93, 930–938, 2012
Masse, D., Cambier, C., Brauman, A., Sall, S., Assigbetse, K., andChotte, J. L.: MIOR: an individual-based model for simulatingthe spatial patterns of soil organic matter microbial decomposi-tion, Europ. J. Soil Sci., 58, 1127–1135, 2007.
Monga, O., Ngom, N. F., and Delerue, J. F.: Representing geometricstructures in 3-D tomography soil images: Application to porespace modelling, Comput. Geosci., 33, 1140–1161, 2007.
Monga, O., Bousso, M., Garnier, P., and Pot, V.: 3-D geometricalstructures and biological activity: application to soil organic mat-ter microbial decomposition in pore space, Ecol. Modell., 216,291–302, 2008.
Monga, O., Bousso, M., Garnier, P., and Pot, V.: Using pore space 3-D geometrical modelling to simulate biological activity: Impactof soil structure, Comput. Geosci., 35, 1789–1801, 2009.
Mooney, S. J.: Three-dimensional visualization and quantificationof soil macroporosity and water flow patterns using computedtomography, Soil Use Manag., 18, 142–151, 2002.
Moyano, F., Manzoni, S., and Chenu, C.: Responses of soil het-erotrophic respiration to moisture availability: An exploration ofprocesses and models (review), Soil Biol. Biochem., 59, 72–85,2013.
Moyano, F. E., Vasilyeva, N., Bouckaert, L., Cook, F., Craine, J.,Curiel Yuste, J., Don, A., Epron, D., Formanek, P., Franzlueb-bers, A., Ilstedt, U., Kätterer, T., Orchard, V., Reichstein, M.,Rey, A., Ruamps, L., Subke, J.-A., Thomsen, I. K., and Chenu,C.: The moisture response of soil heterotrophic respiration: in-teraction with soil properties, Biogeosciences, 9, 1173–1182,doi:10.5194/bg-9-1173-2012, 2012.
Ngom, N. F., Monga, O., Mohamed, M. M. O., and Garnier, P.:3-D shape extraction segmentation and representation of soil mi-crostructures using generalized cylinders, Comput. Geosci., 39,50–63, 2012.
Nunan, N., Wu, K., Young, I. M., Crawford, J. W., and Ritz, K.: Spa-tial distribution of bacterial communities and their relationshipswith the micro-architecture of soil, FEMS Microbiol. Ecol., 44,203 pp., 2003.
Nunan, N., Young, I. M., Crawford, J. W., and Rithz, K.: Bacterialinteractions at the microscale – Linking habitat to function insoil, in: The spatial distribution of microbes in the environment,edited by: Franklin, R. B., and Mills, A. L., Kluwer AcademicPublishers, New York, 61–86, 2007.
Peth, S., Horn, R., Beckmann, F., Donath, T., Fischer, J., andSmucker, A. J. M.: Three dimensional quantification of intra ag-gregate pore space features using synchrotron radiation basedmicrotomography, Soil Sci. Soc. Am. J., 72, 897–907, 2008.
Resat, H., Bailey, V., McCue, L. A., and Konopka, A.: Modelingmicrobial dynamics in heterogeneous environments: growth onsoil carbon sources, Microb. Ecol., 63, 883–897, 2012.
Roberson, E. B. and Firestone, M. K.: The relationship betweendesiccation and exopolysaccharide production by a soilPseu-domonas, Appl. Environ. Microbiol., 58, 1284–1291, 1992.
Sambrook, J., Fritsch E. F., and Maniatis T.: Molecular cloning: Alaboratory manual, 2nd Edn., Cold Spring Harbour Laboratorypress, New York, 1989.
Treves, D. S., Xia, B., Zhou, J., and Tiedje, J. M.: A two-speciestest of the hypothesis that spatial isolation influences microbialdiversity in soil, Microb. Ecol., 45, 20–28, 2003.
Wildenschild, D. and Sheppard, A. P.: X-ray imaging and analy-sis techniques for quantifying pore-scale structure and processesin subsurface porous medium systems, Adv. Water Resour., 51,217–246, 2013.
Young, I. M., Crawford, J. W., Nunan, N., Otten, W., and Spiers, A.:Microbial distribution in soils: physics and scaling, Adv. Agron-omy, 100, 80–121, 2008.