124
FACULTY OF TECHNOLOGY SIMULATING PROJECT NETWORK GOVERNANCE USING AGENT BASED MODELING Tapio Vuorinen INDUSTRIAL ENGINEERING AND MANAGEMENT Master’s Thesis November 2016

FACULTY OF TECHNOLOGY
SIMULATING PROJECT NETWORK
GOVERNANCE USING AGENT BASED
MODELING
Tapio Vuorinen
INDUSTRIAL ENGINEERING AND MANAGEMENT
Master’s Thesis
November 2016

TEKNILLINEN TIEDEKUNTA
PROJEKTIVERKOSTON HALLINNAN
AGENTTIPOHJAINEN SIMULOINTI
Tapio Vuorinen
Ohjaaja(t): Kujala, Jaakko & Kauppila, Osmo
TUOTANTOTALOUS
Diplomityö
Marraskuu 2016

TIIVISTELMÄ
OPINNÄYTETYÖSTÄ Oulun yliopisto Teknillinen tiedekunta Koulutusohjelma (kandidaatintyö, diplomityö) Pääaineopintojen ala (lisensiaatintyö)
Tuotantotalous
Tekijä Työn ohjaaja yliopistolla
Tapio Vuorinen Jaakko Kujala, Osmo Kauppila
Työn nimi
Projektiverkoston hallinnan agenttipohjainen simulointi
Opintosuunta Työn laji Aika Sivumäärä
Laatu- ja projektijohtaminen Diplomityö November 2016 119+10
Tiivistelmä
Projektikirjallisuus on perinteisesti tarkastellut lähinnä projektien teknistä toteutusta. Vähemmän voimavaroja on
kohdistettu kompleksisten projektiverkostojen sekä organisaatioden ja yksilöiden välillä olevien suhteiden
tutkimukseen. Yksi projektimaailman uusimmista tutkimusalueista on projektiverkoston hallinta. Sen tarkoitus on
tuottaa viitekehys, jolla projektiverkostoa voidaan esimerkiksi kontrolloida, palkita ja projektiverkoston osallistujien
välistä yhteistyötä parantaa.
Projektitutkimus on myös karttanut simulaatioiden käyttämistä tutkimusmetodina monestakin eri syystä. On
kuitenkin todettava, että tulevaisuudessa ongelmat saattavat muuttua yhä monimutkaisimmiksi, jolloin
perinteisemmät metodit voivat olla tehottomia. Kompleksisten verkostojen ja suhteiden tutkiminen perinteisin
keinoin saattaa olla jopa mahdotonta silkan koon vuoksi. Simulaatiot ovat hyvä työkalu tilanteissa, joissa oikeaa
systeemiä on hankala tutkia sellaisenaan.
Nykyään prosessipohjainen, systeemidynaaminen ja agenttipohjainen mallinnus ovat kolme käytetyintä
simulaatiometodia. Kolmesta vallitsevasta mallinnustavasta, agenttipohjainen mallinnus on uusin, mutta samalla
myös joustavin. Agenttipohjainen mallinnus on tehokas työkalu emergentin käytöksen tutkimiseen autonomisten
agenttien avulla. Agenttipohjaisen mallinnuksen taustalla ovat yksittäisten agenttien ominaisuudet – ne voivat oppia,
niillä on erilaisia suhteita ympäristöönsä ja kullakin voi olla yksilölliset käyttäytymissäännöt. Täten emergenttiä
käytöstä voidaan tutkia tuntematta järjestelmän rakennetta tai prosesseja – agentit kykenevät luomaan nämä
itsenäisesti, jopa yksinkertaisten sääntöjen avulla.
Projektikontekstissa agentit voivat olla yksittäisiä henkilöitä, organisaatioita tai vaikkapa projektialliansseja.
Tarkkuus ja eri tasojen määrä jääköön mallintajan päätettäväksi. Esimerkiksi agenttipohjainen malli voisi olla useita
organisaatioita työskentelemässä yhteisen projektin eteen erilaisista lähtökohdista. Organisaatiot voisivat koostua
erilaisista yksilöistä, joilla on kyky toimia itsenäisesti. Projekti voisi koostua erilaisista tehtävistä, joilla on eriasteisia
vaatimuksia ja päämääriä. Projektin lopputulos voisi määräytyä projektiverkoston hallinnan eri mekanismien
vaikutuksesta. Tämän työn tavoitteena on tuottaa edellä kuvatun kaltainen malli.
Työn tavoitteena on rakentaa simulaatiomalli projektiverkoston hallinnan simulointia varten. Työssä vastattiin
seuraaviin tutkimuskysymyksiin:
RQ1: Mitkä ovat projekti- ja tehtäväverkon tärkeimmät ominaisuudet?
RQ2: Mitkä ovat projektiverkoston hallinnan eri mekanismit?
RQ3: Mitkä ovat simulaatiomallin kehityksen eri vaiheet?
RQ4: Mitkä ovat eri simulaatiometodien vahvuudet ja heikkoudet projektiverkoston hallinnan simuloinnissa?
Kysymyksiin vastaamisen ohella, agenttipohjainen malli luotiin onnistuneesti käyttäen Anylogic-ohjelmistoa ja
seuraten kirjallisuudesta perustuvaa simulaatiomallin kehitysprosessia. Agenttipohjainen malli verifioitiin toimivaksi
projektiverkostojen ja projektiverkoston hallinnan simulointiin. Seuraava vaihe olisi validoida malli käyttäen oikeasta
maailmasta saatua dataa. Lisäksi luotuun malliin voitaisiin tulevaisuudessa lisätä joko uusia projektiverkoston
hallinnan mekanismeja tai samanaikaisia projekteja resurssirajoitteisilla tehtävillä. Agenttipohjainen mallinnus sopii
tähän tarkoitukseen.
Muita tietoja
Malli on ladattavissa osoitteessa http://tavu.eu/thesis (Anylogic tulee olla asennettuna)
ABSTRACT
FOR THESIS University of Oulu Faculty of Technology Degree Programme (Bachelor's Thesis, Master’s Thesis) Major Subject (Licentiate Thesis)
Industrial Engineering and Management
Author Thesis Supervisor
Tapio Vuorinen Jaakko Kujala, Osmo Kauppila
Title of Thesis
Simulating project network governance using agent based modeling
Major Subject Type of Thesis Submission Date Number of Pages
Quality and project management Master’s Thesis November 2016 119+10
Abstract
Project management literature has previously mainly focused on the technical aspects of project delivery. Less focus
has been on the complex inter-connected relations between different organizational and individual actors in project
networks. One of the newer approaches to project management research is project network governance. Its aim is to
provide a framework for controlling, rewarding and enabling collaboration between organizational actors in project
networks.
Project management literature has shied away from using simulation as a research method for various reasons.
However, at some point in the future problems can become increasingly complex and traditional research methods
can be ineffective. Additionally, to research different phenomena regarding complex networks, be it between
organizations, actors or project alliances, traditional research methods can fail altogether due to sheer scope. This is
where simulation can come in.
Discrete event, system dynamics and agent based simulation are the most used paradigms today. Three of the most
prevalent are discrete event, system dynamics and agent based modeling. Agent based simulation is a powerful tool
for discovering emergent behavior using autonomous agents. Agent based modeling relies on the different
characteristics of agents – learning ability, number of connections to other agents and individual behavioral
guidelines. This approach enables modeling of emergent behavior without knowledge of exact processes or structures
– the agents can be made capable of creating all of these, even with simple algorithms.
In project management context, these agents can be individual persons, organizations or projects. The levels and
layers of detail are left for the modeler. An agent based model could be about a set of inter-connected organizations
working on a project based on different inputs. The organizations could comprise different individual actors with
their own volition. Project could consist of different inter-connected tasks with varying requirements and goals. The
ensuing outcome of the project could be for example be influenced by different project network governance
mechanisms. That is what this thesis is about.
The goal of the thesis was to develop a simulation model which could be used to simulate project network governance.
Following research questions were answered:
RQ1: What are the most significant characteristics of project network and task network?
RQ2: What are different mechanisms of project network governance?
RQ3: What are different stages in the simulation model development?
RQ4: What are the strengths and weaknesses of different modeling paradigms in simulating project networks?
An agent based model was successfully developed using Anylogic software and following the simulation model
development process. It was verified that agent based modeling can be used to simulate project networks and project
network governance. Next step would be to validate the results using inputs gathered from real world dataset. The
developed model could also be further enhanced by implementing more project network governance mechanisms or
including multiple concurrent projects and resource constraints. Agent based modeling provides a powerful platform
for experimenting and exploring.
Additional Information
The model can be downloaded from http://tavu.eu/thesis (Anylogic is required)
LIST OF CONTENTS
TIIVISTELMÄ ................................................................................................................. 9
ABSTRACT .................................................................................................................... 10
LIST OF CONTENTS .................................................................................................... 11
1 Introduction .................................................................................................................. 13
1.1 Background ........................................................................................................... 13
1.2 Research scope and objectives .............................................................................. 15
1.3 Research process ................................................................................................... 16
2 Project network governance ......................................................................................... 18
2.1 Project ................................................................................................................... 18
2.2 Project network ..................................................................................................... 24
2.3 Project network governance .................................................................................. 28
2.4 Mechanisms of project network governance ......................................................... 31
2.4.1 Goal setting .................................................................................................. 32
2.4.2 Incentives ..................................................................................................... 33
2.4.3 Monitoring ................................................................................................... 34
2.4.4 Coordination ................................................................................................ 35
2.4.5 Roles and Decision-making ......................................................................... 37
2.4.6 Capability building ...................................................................................... 38
2.5 Theory of planned behavior and coordination ...................................................... 39
2.6 Synthesis ............................................................................................................... 41
3 Simulation .................................................................................................................... 42
3.1 Simulation as a research method ........................................................................... 44
3.2 Process of creating a simulation model ................................................................. 48
3.2.1 Problem definition ....................................................................................... 49
3.2.2 Setting objectives for the project ................................................................. 50
3.2.3 Model conceptualization and data collection .............................................. 51
3.2.4 Model translation ......................................................................................... 52
3.2.5 Verification and validation .......................................................................... 54
3.2.6 Experimentation and analysis ...................................................................... 57
3.2.7 Documentation ............................................................................................. 59
3.2.8 Implementation ............................................................................................ 61
3.3 Prior research on project simulation ..................................................................... 62
3.4 Simulation modeling methods............................................................................... 65

3.4.1 System dynamics method ............................................................................ 66
3.4.2 Discrete event method ................................................................................. 68
3.4.3 Agent based method .................................................................................... 70
3.4.4 Comparisons in literature ............................................................................. 72
3.4.5 Comparisons for the case model .................................................................. 75
4 Simulation model ......................................................................................................... 79
4.1 Anylogic as a software .......................................................................................... 80
4.2 Basic logic and structure of the model .................................................................. 81
4.2.1 Simulation process ....................................................................................... 83
4.3 Development process ............................................................................................ 86
4.4 Final version of the model ..................................................................................... 88
4.4.1 Functional elements ..................................................................................... 88
4.4.2 Graphical interface ....................................................................................... 93
4.5 Verification ........................................................................................................... 99
4.5.1 PERT and uncertainty .................................................................................. 99
4.5.2 Learning aspect .......................................................................................... 104
4.6 Summary ............................................................................................................. 107
5 Discussion .................................................................................................................. 108
5.1 Limitations .......................................................................................................... 111
5.2 Future research .................................................................................................... 111
6 Conclusions ................................................................................................................ 113
7 List of references ........................................................................................................ 117
APPENDIX 1 ................................................................................................................ 121
APPENDIX 2 ................................................................................................................ 122
APPENDIX 3 ................................................................................................................ 124
APPENDIX 4 ................................................................................................................ 127
APPENDIX 5 ................................................................................................................ 129

1 INTRODUCTION
1.1 Background
Project management has been around for ages and, traditionally, project management
research has dealt with issues related to the technical implementation of a project. Even
though project organizations have been defined as temporary endeavors to achieve a
common goal, less research has been conducted on the complex organizational structures
and relations behind such implementations.
Some of the newer research on the area are the concepts of governance of projects
(Müller, 2009) and project network governance (Kujala et al., 2016), two slightly
different approaches to the same realm. While the governance of projects (or project
governance) has been established by a hefty amount of scientific research, the new
approach of project network governance is still work in progress. Project network
governance has been defined by (Kujala et al., 2016) as follows: “coordination,
adaptation and safeguarding mechanisms that enable multiple organizational actors in
project networks to work toward shared goals”. In short, project network governance
aims to provide means for project organization to coordinate work internally between
different actors.
With the ever-increasing power of computers and the consequent rise of computer
simulations, a foray into the world of project management through simulation is
imminent. Although project management research has delved into the simulation territory
already, the raw numbers speak for themselves: simulation is not widely regarded as a
relevant tool in management research. (Berends and Romme, 1999)
How can simulation be applied in the realm of project management? The answer could
be any of the three different paradigms of simulation modeling described in this thesis.
All the methods have their particular strengths and weaknesses – the choice is only related
to the problem at hand. However, agent based modeling can be effectively used in variety
of different cases. The agents have variety of different attributes, but the most important
feature is that they are distinguishable from each other and have individual behavior
(Borshchev, 2013).

Human behavior in a context of projects can be simulated by establishing the agents as
individual actors. Different individual actors can be part of organizations which in turn
can be part of larger networks. The structures of these networks and organizations can
change over time. Therefore, actors, organizations and networks need to be implemented
to simulate project network governance. Since the project network governance ultimately
requires individual actors to make decisions based on the available information, agent
based modeling is more than suitable for the job.
1.2 Research scope and objectives
The main goal of this research is to create a model to simulate project governance methods
and their influence on a project. Different mechanisms of project network governance and
forms of simulation are studied through a literature review. After preliminary studies have
been performed a model is constructed that has its base in aforementioned theories. A
choice will be made on which aspects of project governance will be included in the model,
based on the level of complexity chosen for the model.
The research contains four research questions and the resulting information will be used
later to construct the simulation model. The first question defines the underlying
mechanics of project and task network based on project management literature.
RQ1: What are the most significant characteristics of project network and task network?
The second question deals with a singular issue of project network governance.
Mechanisms of governance will be listed as presented in the literature and later used as a
part of the simulation.
RQ2: What are different mechanisms of project network governance?
The third question is about going through different stages in the simulation model
development based on the literature.
RQ3: What are different stages in the simulation model development?
The fourth question is to be answered through analysis of the model built for this thesis
and based on literature as well.
RQ4: What are the strengths and weaknesses of different modeling paradigms in
simulating project networks?

1.3 Research process
Peffers et al. (2008) describe a design science research methodology (DSRM) as “a
rigorous process to design artifacts to solve observed problems, to make research
contributions, to evaluate the designs, and to communicate the results to appropriate
audiences”. In figure 1 we can see four possible research entry points. This thesis could
fall into two categories: define objectives of a solution or design and development.
However, the design and development entry point was chosen because most of the work
has been done building the model and less work has been done on the documentation.
Meaning most of the work to define different phenomena and theories that work as a basis
for the model was done before this project.
Figure 1. The research entry point, design and development, bolded (adapted from Peffers
et al. 2008).
The research consists of a literature review, and creation and verification of a simulation
model. Literature review consists of general project management literature and delves
into project network governance and its aspects. The model is conceptualized, created
(coding using Anylogic) and verified for this thesis. Similar models have been in
development before this thesis had even started but in the light of the modeler’s ability to
produce a working model of this scope, it has only helped to produce this document. The
research process is presented in the figure 2.
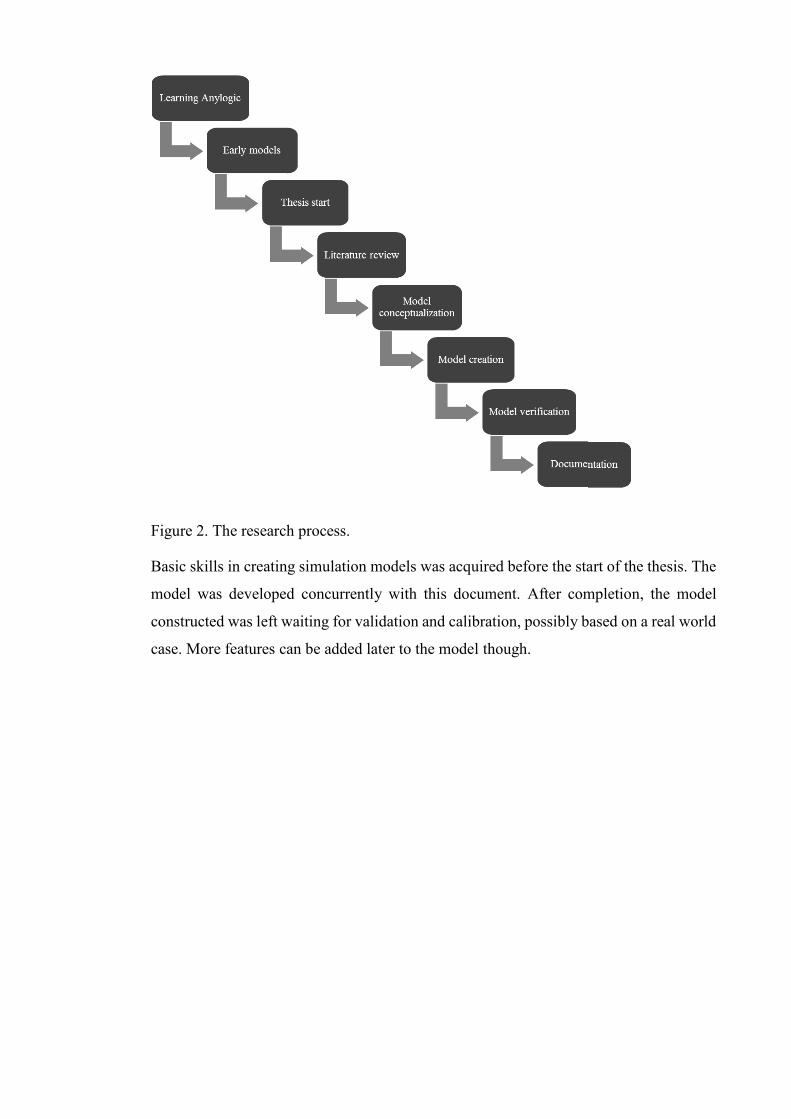
Figure 2. The research process.
Basic skills in creating simulation models was acquired before the start of the thesis. The
model was developed concurrently with this document. After completion, the model
constructed was left waiting for validation and calibration, possibly based on a real world
case. More features can be added later to the model though.

2 PROJECT NETWORK GOVERNANCE
2.1 Project
Artto et al. (2006) define project as predefined goal-oriented, complex and interconnected
set of tasks that construct a unique entity, with constraints regarding time, cost and scope.
Lester (2014) defines project as “a unique process, consisting of a set of coordinated and
controlled activities with start and finish dates, undertaken to achieve an objective
conforming to specific requirements, including constraints of time, cost and resources.”
Project can be seen from different angles while still carrying out a project to the finish
line. Artto et al. (2006) list three different following point of views to a project:
1. a project can be seen as a temporary organization,
2. as a work breakdown structure or
3. as a set of tasks.
Projects usually include a temporary organization established for sake of a particular
project. Temporary organizations are responsible for completion of the project and the
members are selected with care to be able to carry out the project with the best end result.
Projects can also be broken down to their core elements, either based on the end product
or on the work required. Breaking the project down to smaller portions makes them more
manageable. Lastly, a project can be introduced as a process, with interconnected tasks
that can run simultaneously or require a previous task(s) to be completed before starting
themselves. Process-oriented thinking helps planning the schedule of the project. Figure
3 illustrates these points of view. (Artto et al., 2006)

Figure 3. Different points of view to a project (adapted from Artto et al. 2006).
As stated by Lester (2014), projects typically consist of a set of tasks, resources and goals.
He continues, that projects have three important aspects in respect to their successful
completion. These three aspects are time, cost and quality. While Artto et al. (2006) and
Lester (2014) both agree that projects must be completed on time, within budget and all
quality requirements met, Artto et al. (2006) continue that due to uniqueness and
complexity of projects, appropriate special skillsets and creative management is required.
In this thesis, tasks of a project play an important role. These sets of tasks can be broken
down with work breakdown structures (WBS) and visualized by process-oriented
approach as activity networks diagrams. WBS is a visual tool to help understanding the
whole project by separating certain activities under sections and subsections. WBS can
be then included in a list containing all the relevant information related to the tasks e.g.
durations and predecessors. Through this list of all tasks we can conjure an activity
network diagram that consists of tasks with visual indications of predecessors and
successors. (Turner, 2014)
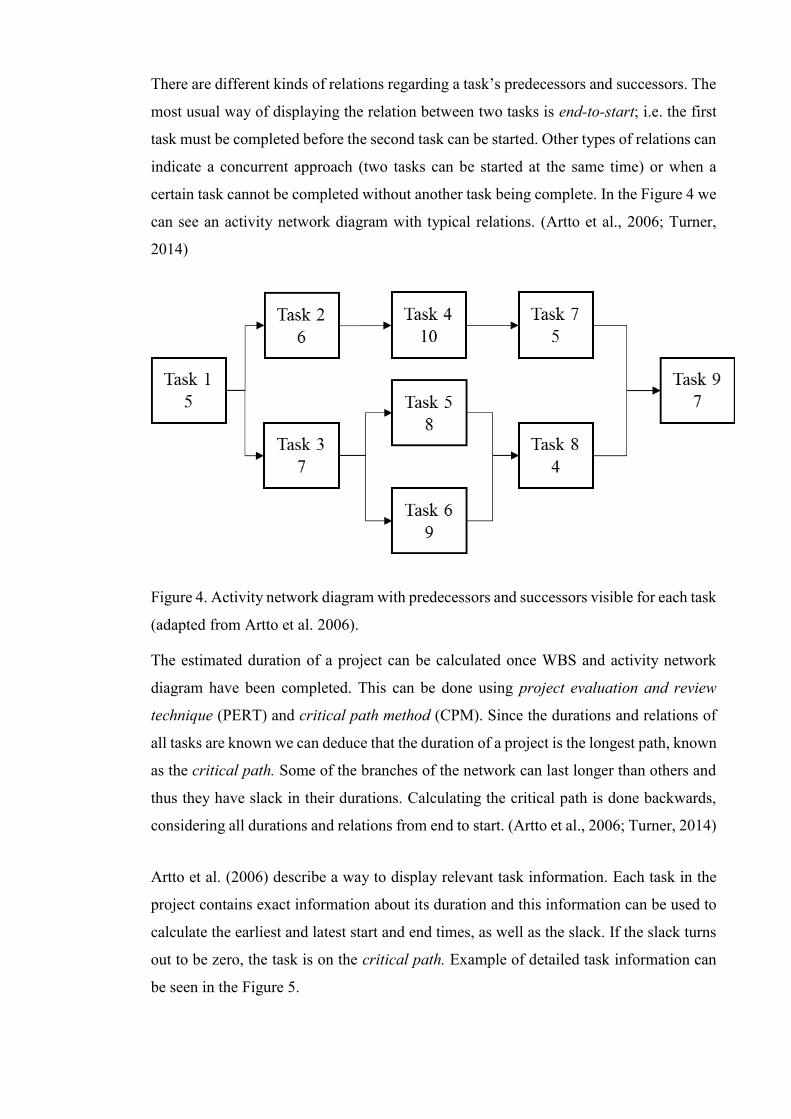
There are different kinds of relations regarding a task’s predecessors and successors. The
most usual way of displaying the relation between two tasks is end-to-start; i.e. the first
task must be completed before the second task can be started. Other types of relations can
indicate a concurrent approach (two tasks can be started at the same time) or when a
certain task cannot be completed without another task being complete. In the Figure 4 we
can see an activity network diagram with typical relations. (Artto et al., 2006; Turner,
2014)
Figure 4. Activity network diagram with predecessors and successors visible for each task
(adapted from Artto et al. 2006).
The estimated duration of a project can be calculated once WBS and activity network
diagram have been completed. This can be done using project evaluation and review
technique (PERT) and critical path method (CPM). Since the durations and relations of
all tasks are known we can deduce that the duration of a project is the longest path, known
as the critical path. Some of the branches of the network can last longer than others and
thus they have slack in their durations. Calculating the critical path is done backwards,
considering all durations and relations from end to start. (Artto et al., 2006; Turner, 2014)
Artto et al. (2006) describe a way to display relevant task information. Each task in the
project contains exact information about its duration and this information can be used to
calculate the earliest and latest start and end times, as well as the slack. If the slack turns
out to be zero, the task is on the critical path. Example of detailed task information can
be seen in the Figure 5.
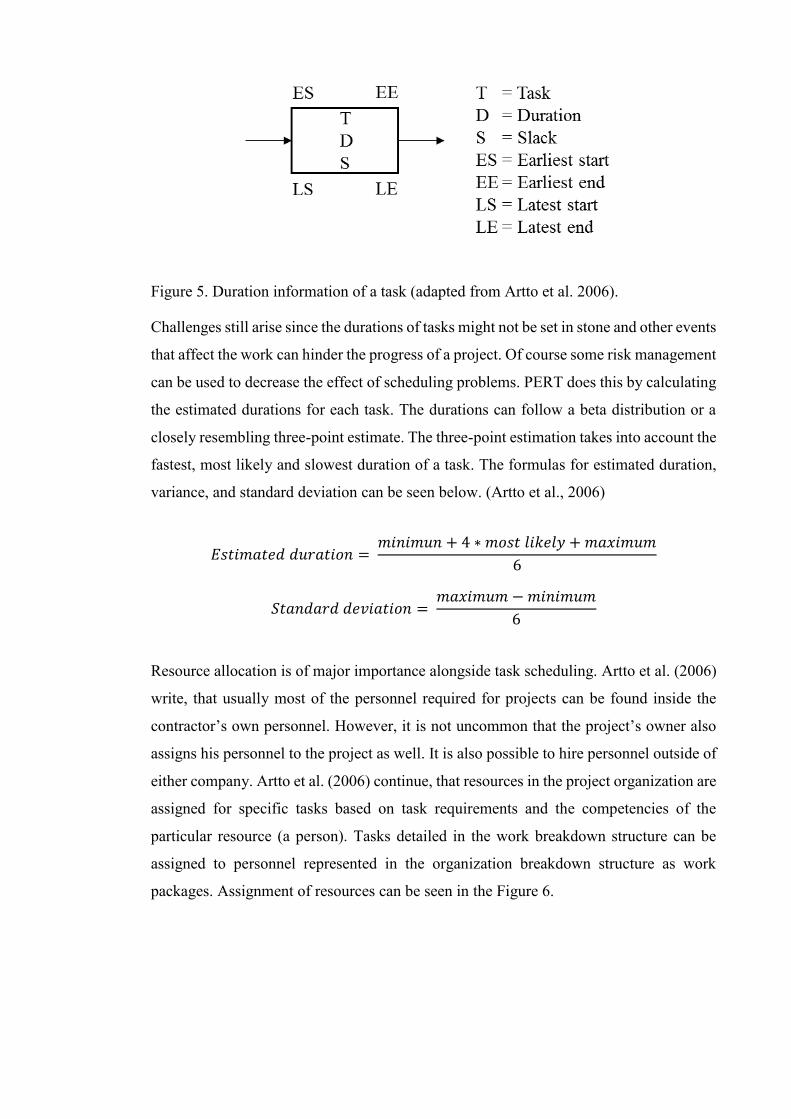
Figure 5. Duration information of a task (adapted from Artto et al. 2006).
Challenges still arise since the durations of tasks might not be set in stone and other events
that affect the work can hinder the progress of a project. Of course some risk management
can be used to decrease the effect of scheduling problems. PERT does this by calculating
the estimated durations for each task. The durations can follow a beta distribution or a
closely resembling three-point estimate. The three-point estimation takes into account the
fastest, most likely and slowest duration of a task. The formulas for estimated duration,
variance, and standard deviation can be seen below. (Artto et al., 2006)
𝐸𝐸𝐸𝐸𝐸𝐸𝐸𝐸𝐸𝐸𝐸𝐸𝐸𝐸𝐸𝐸𝐸𝐸 𝐸𝐸𝑑𝑑𝑑𝑑𝐸𝐸𝐸𝐸𝐸𝐸𝑑𝑑𝑑𝑑 = 𝐸𝐸𝐸𝐸𝑑𝑑𝐸𝐸𝐸𝐸𝑑𝑑𝑑𝑑 + 4 ∗ 𝐸𝐸𝑑𝑑𝐸𝐸𝐸𝐸 𝑙𝑙𝐸𝐸𝑙𝑙𝐸𝐸𝑙𝑙𝑙𝑙 + 𝐸𝐸𝐸𝐸𝑚𝑚𝐸𝐸𝐸𝐸𝑑𝑑𝐸𝐸6
𝑆𝑆𝐸𝐸𝐸𝐸𝑑𝑑𝐸𝐸𝐸𝐸𝑑𝑑𝐸𝐸 𝐸𝐸𝐸𝐸𝑑𝑑𝐸𝐸𝐸𝐸𝐸𝐸𝐸𝐸𝑑𝑑𝑑𝑑 = 𝐸𝐸𝐸𝐸𝑚𝑚𝐸𝐸𝐸𝐸𝑑𝑑𝐸𝐸 −𝐸𝐸𝐸𝐸𝑑𝑑𝐸𝐸𝐸𝐸𝑑𝑑𝐸𝐸6
Resource allocation is of major importance alongside task scheduling. Artto et al. (2006)
write, that usually most of the personnel required for projects can be found inside the
contractor’s own personnel. However, it is not uncommon that the project’s owner also
assigns his personnel to the project as well. It is also possible to hire personnel outside of
either company. Artto et al. (2006) continue, that resources in the project organization are
assigned for specific tasks based on task requirements and the competencies of the
particular resource (a person). Tasks detailed in the work breakdown structure can be
assigned to personnel represented in the organization breakdown structure as work
packages. Assignment of resources can be seen in the Figure 6.
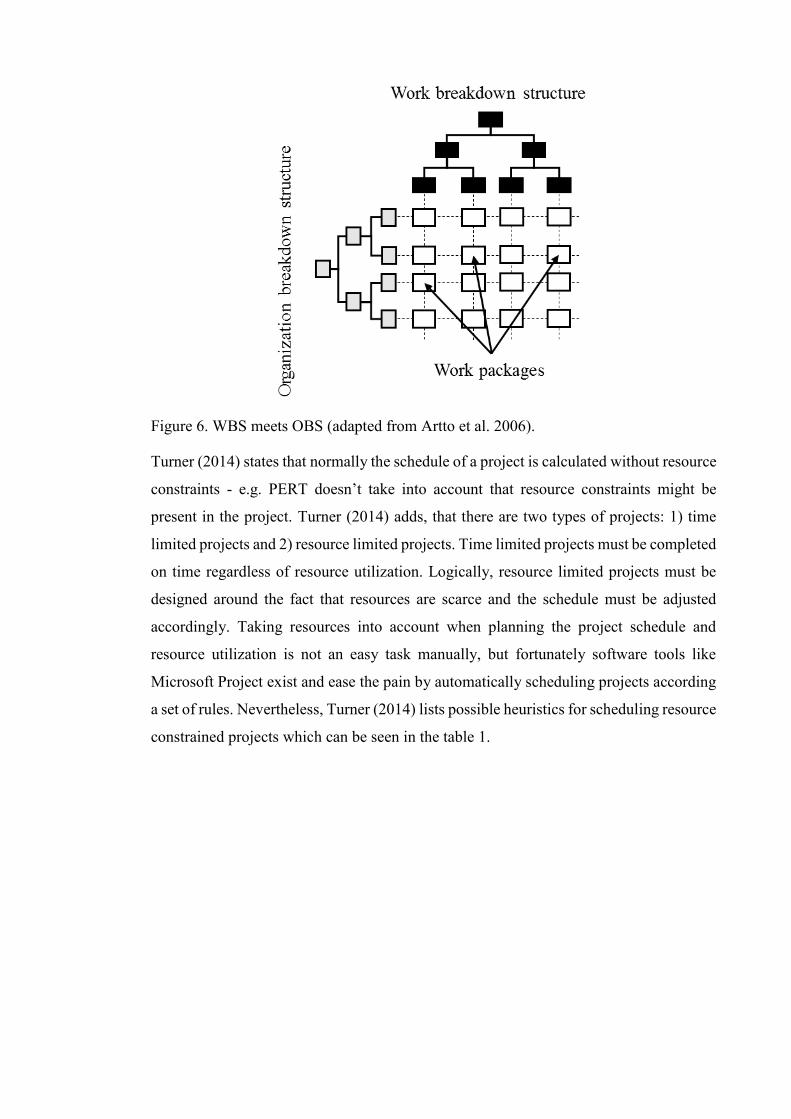
Figure 6. WBS meets OBS (adapted from Artto et al. 2006).
Turner (2014) states that normally the schedule of a project is calculated without resource
constraints - e.g. PERT doesn’t take into account that resource constraints might be
present in the project. Turner (2014) adds, that there are two types of projects: 1) time
limited projects and 2) resource limited projects. Time limited projects must be completed
on time regardless of resource utilization. Logically, resource limited projects must be
designed around the fact that resources are scarce and the schedule must be adjusted
accordingly. Taking resources into account when planning the project schedule and
resource utilization is not an easy task manually, but fortunately software tools like
Microsoft Project exist and ease the pain by automatically scheduling projects according
a set of rules. Nevertheless, Turner (2014) lists possible heuristics for scheduling resource
constrained projects which can be seen in the table 1.

Heuristic Description
As soon as possible Most commonly used.
As late as possible Delay tasks to redirect their
use of resources.
Shortest task first Assigns resources to shortest
tasks first.
Most resources first
This method assumes that
tasks with large resource
requirements are important.
Minimum slack first
This method favors tasks
that have little or no slack
whatsoever and therefore
assigns resources to tasks on
critical path or near it.
Most critical followers
Assigns resources to tasks
that are followed by critical
tasks. All tasks are not
necessary on the critical
path.
Most successors
Resources assigned to tasks
with most followers in
general.
Table 1. Heuristics for scheduling resource constrained projects (adapted from Turner
2014).
Turner (2014) states that research has found using the minimum slack first method yields
best results. However, Artto et al. (2006) add that using resources such as human labor
must be calculated so that the utilization rate is closely equal among available resources
to avert exhaustion. Artto et al. (2006) also continue that in addition to heuristics above,
tasks can be completed by stretching the duration and therefore lessening the strain on
resources assigned to the task (in the event of concurrent tasks this might be necessary).
Tasks can also be divided into smaller packets in order to free a resource mid-task to
somewhere else. One solution is also to bring new resources in the project. This however,
will require the new employee to get up to speed on the progress and might require further
counselling to be able to work efficiently.

2.2 Project network
Ahola (2009) begins his dissertation by defining the inter-organizational network as
following: “set of organizations, from which two or more nodes are connected by inter-
organizational relationships”. This in turn leads to the concept of project network, as
described by Ahola (2009), a temporary organization that consists of all parties
participating in delivery of a project and all the inter-organizational relationships between
those parties. The definition above can be seen as a synthesis of the following
descriptions: a dense temporary network of organizations consisting of multiple firms
working on a single project Artto et al. (2006), a network of project based firms
transforming from episodic into more continuous form of collaboration Grabher (2002)
and a network of firms with a wide range of conflicting or supporting business interests
Ruuska et al. (2009).
The complex nature of project networks is further evident in the stakeholder landscapes
described by Aaltonen and Kujala (2016). Project managers need to take into account
many intertwined stakeholders linked to the project. The number of stakeholders, the
relationships between stakeholders, uncertainty towards stakeholders and dynamic nature
of stakeholders. All of this influences the interplay between different actors inside the
project network.
Project network is related to business network which is a collective network of companies
in a similarly positioned project based industry that have inter-organizational
relationships between them. Organizations in a business network might not necessarily
work on the same projects and as with all networks, business networks change over time
as organizations enter and exit. (Ahola, 2009)
Projects can be done by a singular organization or multiple organizations operating
jointly. Simultaneously one or more firm can work on multiple projects. This leads to
concept of project business. Project business is the area of a corporation that relates to
work on projects, while reaching the goal set by one or multiple organizations. Artto and
Kujala (2008) provide a framework for analyzing different forms of project based
operations which can be seen in the Figure 7.
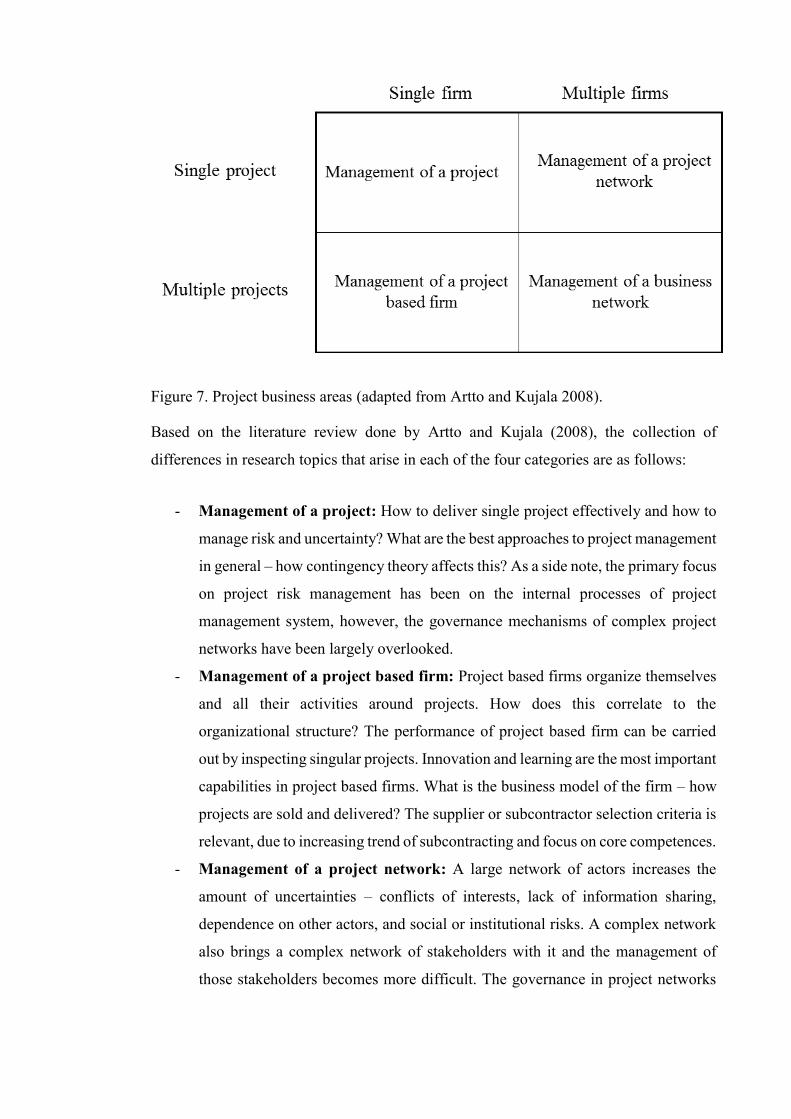
Figure 7. Project business areas (adapted from Artto and Kujala 2008).
Based on the literature review done by Artto and Kujala (2008), the collection of
differences in research topics that arise in each of the four categories are as follows:
- Management of a project: How to deliver single project effectively and how to
manage risk and uncertainty? What are the best approaches to project management
in general – how contingency theory affects this? As a side note, the primary focus
on project risk management has been on the internal processes of project
management system, however, the governance mechanisms of complex project
networks have been largely overlooked.
- Management of a project based firm: Project based firms organize themselves
and all their activities around projects. How does this correlate to the
organizational structure? The performance of project based firm can be carried
out by inspecting singular projects. Innovation and learning are the most important
capabilities in project based firms. What is the business model of the firm – how
projects are sold and delivered? The supplier or subcontractor selection criteria is
relevant, due to increasing trend of subcontracting and focus on core competences.
- Management of a project network: A large network of actors increases the
amount of uncertainties – conflicts of interests, lack of information sharing,
dependence on other actors, and social or institutional risks. A complex network
also brings a complex network of stakeholders with it and the management of
those stakeholders becomes more difficult. The governance in project networks

consists of legally binding contracts, risk sharing, interest alignment partly due
incentives and integrated culture.
- Management of a business network: The more permanent business network is
influenced by the temporary project network and vice versa. The firms in the
business network can take part in different projects in different roles and scopes.
The interests between actors in the business network can be conflicting.
Discontinuity describes the project business – there is a time period between a
delivery and a sale. This has been tried to counter by offering more long lasting
relationships with other actors. The position of the firm in the larger business
network and the focus area of value adding activities are significant strategic
questions.
Project networks can be seen as a part of project business universe in a sense that
whenever there are multiple firms involved in one project, a project network is born.
Business network in turn is the collection of all companies that compete or collaborate in
the same industrial space. Furthermore, a business network and an example of project
network can be seen in the Figure 8.
Figure 8. Project and business network (adapted from Ahola 2009).
Typical project network consists of owner, main contractor(s) and subcontractors.
Multiple main contractors can be responsible for different areas of project delivery. Even
though projects are temporary organizations, and project networks can be defined the
same way, it is established that previous experiences influence the choice of actors for
the consequent projects. (Ahola, 2009)

Project alliance is one form of organizing joint collaboration in project networks.
Lahdenperä (2009) defines project alliance as a project delivery method where a contract
binds multiple actors that implies shared design and implementation assignments in
addition to positive and negative risks through a singular project organization. This joint
agreement also includes sharing readily accessible information and close co-operation to
achieve a common goal.
Lahdenperä (2009) elaborates on the structure of an alliance project with the following
topics:
- Joint agreement: Multiple parties sign a singular contract rather than multiple
contracts for the project. The contract contains all the responsibilities of
corresponding actors.
- Joint organization: All parties including the project’s owner are invited into the
project organization. This is followed by the fact that all decisions will be made
among all parties jointly. Costs are estimated to cover all expenses of all different
actors and forms the total cost of the project.
- Risk sharing: All parties in the alliance share positive and negative risks.
Performance of singular organization inside the alliance directly influences the
whole project and therefore a transparent cost monitoring should take place.
Projects are evaluated based on their performance as a whole, not of single
organization’s output.
- Trust: Trust is the basis of a functioning project alliance. Since transparency is to
be expected and risks are being shared, the role trust cannot be underestimated.
Also, building trust is a time-consuming process and because of that the selection
of alliance partners is a crucial.
- Commitment: Commitment is required for the project to solve problems,
eliminate obstacles and continuously improve to reach the common goal.
Commitment can be attributed to appropriate organization design, joint decision
making and incentive systems.
- Co-operation: The culture of co-operation can be influenced by integrated
information systems, joint space arrangements and commonly agreed decision-
making principles. In the end information sharing is the cornerstone of co-
operation.

2.3 Project network governance
There are currently two different approaches to project governance in the literature. The
first one focuses on external values such as the correctness of project portfolio and its
execution. On the other hand, the second one sets its eyes on the internal issues of project
network such as that the project meets its goals while satisfying all different stakeholders.
(Ahola et al., 2014)
Based on the literature review done by Ahola et al. (2014), these two different points of
view were summarized as follows. The project governance as external to a project has
these characteristics:
1. Principal agent relationship between a project based firm and its projects.
2. The firm is interested in strategically aligned, efficient deliveries of projects.
3. The project manager can prioritize the project over the interests of the firm
creating an agency problem.
4. To align the interests of both the firm and the project, structures must be
established that ensure proper reporting, role assignment and monitoring
procedures.
The project governance as internal to a project in turn has the following characteristics:
1. A project is a network of companies with interdependent economic transactions.
2. A project is a joint goal driven organization actor.
3. The short term and long term goals of participating organizations and the project
may conflict.
4. The alignment of participant organization’s goals can be achieved through
coordination, control and safeguarding – a governance structure.
5. The governance structure should be constructed in a way that supports both
internal and external contingencies.
Müller (2009) defines governance of projects as “… consistent and predictable delivery
of the project’s planned contribution to the portfolio…” and continues “project
governance provides risk minimization, transparency, division of ownership and control
at the project level”. Additionally, Müller (2009) states that, the steering group is the

main entity for project governance as it has the most authority in most cases. Steering
group is the entity which holds the keys for the project execution – meaning that they are
responsible for the outcome, distribute resources and approve changes throughout the
project. An organizational chart based on this mindset can be seen in the Figure 9.
Figure 9. An example of different levels of steering groups inside the organizational
structure of a company (adapted from Turner 2014).
In the Figure above we can see an example of an organizational structure of a project
based company. Turner (2014) has included four different steering groups at different
levels of the organization. This means that the influence of steering groups on the higher
levels of hierarchy can be observed also on the lower levels. The difference in decision
making at different levels of hierarchy ranges from long term strategic at the top to short
term tactic choices at the project level.
Meanwhile, Kujala et al. (2016) define project network governance as “the coordination,
adaptation and safeguarding mechanisms that enable multiple organizational actors in
project networks to work toward shared goals”. They continue that while project
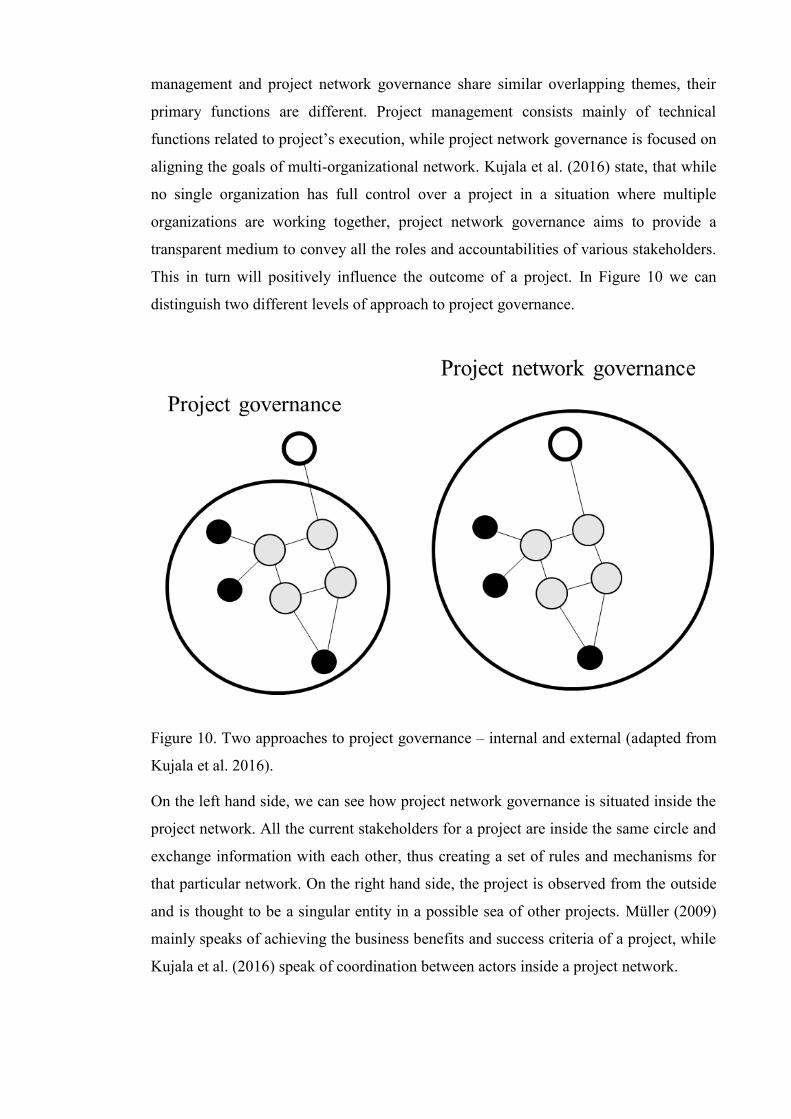
management and project network governance share similar overlapping themes, their
primary functions are different. Project management consists mainly of technical
functions related to project’s execution, while project network governance is focused on
aligning the goals of multi-organizational network. Kujala et al. (2016) state, that while
no single organization has full control over a project in a situation where multiple
organizations are working together, project network governance aims to provide a
transparent medium to convey all the roles and accountabilities of various stakeholders.
This in turn will positively influence the outcome of a project. In Figure 10 we can
distinguish two different levels of approach to project governance.
Figure 10. Two approaches to project governance – internal and external (adapted from
Kujala et al. 2016).
On the left hand side, we can see how project network governance is situated inside the
project network. All the current stakeholders for a project are inside the same circle and
exchange information with each other, thus creating a set of rules and mechanisms for
that particular network. On the right hand side, the project is observed from the outside
and is thought to be a singular entity in a possible sea of other projects. Müller (2009)
mainly speaks of achieving the business benefits and success criteria of a project, while
Kujala et al. (2016) speak of coordination between actors inside a project network.

2.4 Mechanisms of project network governance
Kujala et al. (2016) created a list of mechanisms for project network governance based
on the current project management literature. Different sized projects of various industries
and their approaches to governance issues are discussed in the articles on which the list
is based upon. The list contains seven different categories. The values of components in
the list as whole result in the project safety performance in the context of nuclear industry.
The Figure 11 describes the list of items that influence the project safety performance,
i.e. project network governance mechanisms.
Figure 11. Project network governance mechanisms (adapted from Kujala et al. 2016).
A brief elaboration on the different mechanisms is in order, even though some of the
topics described in the figure above are self-explanatory. Since the literature review for
the mechanisms is extensive, only a handful of notions from each category is explained
through citations from the original authors.
2.4.1 Goal setting
“Goal setting seeks to create shared performance goals for the project that will be
understood by all project actors” (Kujala et al., 2016)
In this category, the most common way of establishing shared targets was through
different contracts. Clarity of goals in turn was based on creating key performance
indicators and conducting financial calculations to make sure that the project is on solid
ground. Flexibility of goals was achieved using different tendering methods and
collaboration between participating organizations.
Lu et al. (2015) discuss legally binding documents to prevent opportunistic behavior as
well as contracts that define the delivery of project output in schedule and on budget. This
is backed up by Guo et al. (2014) with emphasis on early relationship building between
actors to agree on said project schedule and general objectives. Davies et al. (2014) adds
that early involvement of key stakeholders to collaborate with each other and flexible
tendering brings along innovative solutions. Chang (2015) also points out that the
possibility of sequential tendering allows changes in plans down the line. According to
Nisar (2013) long-term issues should be handled accordingly using strategic toolset. This
means that participating organizations should align their businesses and service plans to
reach long-term goals over the course of the project.
Liu and Wilkinson (2014) continue that a thorough cost-benefit analysis should be
conducted and relevant stakeholders should be consulted to develop a sound business
case. Nisar (2013) makes the connection between goal orientation and progress
monitoring by setting up clear standards and performance targets thus providing
measurable results.
2.4.2 Incentives
“Rewarding refers to aligning actors’ goals with project goals by means of incentives”
(Kujala et al., 2016)
Rewards tied to performance and lifecycle as listed by Kujala et al. (2016), were mostly
monetary benefits described in contracts or the possibility of using reputation as an
incentivizing reward. Risk allocation was also tied to the type of selected contract or other
financial ways of protecting assets. Risk and profit sharing between participating parties
was also discussed.
According to Lu et al. (2015) and Nisar (2013) incentives and penalties should be
described in contracts. Davies et al. (2014) recommends using target cost contracts that
include pain/gain mechanisms to drive performance. Similarly, Nisar (2013) also talks
about reductions in payments if project performance is underwhelming.
Liu and Wilkinson (2014) point out that effective risk transfer is in order to enable
maximum business potential. They also continue that profit-sharing mechanisms based
on an agreement can be used if revenues reach certain levels. On the other hand, Guo et
al. (2014) talk about shared cost savings across all participating organizations.
Additionally, Ruuska et al. (2011) reminds that risks can be shared among different actors
and therefore the ways risks are managed become of note. This if further evident in the
choice of contract types (fixed price vs. cost-plus) and of other financial protective
measures (insurances etc.) – the choices which can balance the amount of risk carried by
the owner and the contractor (Chang, 2015; Chang and Ive, 2007).
Reputation can also be used as an incentive as stated by Chang and Ive (2007). Short-
term disadvantages can be turned to long-term advantages through stellar work
reputation. According to Chang (2015), including the possibility of future collaboration
between organizations as an incentive based on performance can reduce the amount of
hold-up problems.

2.4.3 Monitoring
“Monitoring seeks to ensure that all actors behave as expected, enabling the use of
performance-based incentives” (Kujala et al., 2016)
According to the list of Kujala et al. (2016) contracts again play a big role in monitoring
the performance of a project. The literature suggests a thorough planning of monitoring
practices in order to efficiently manage project progression. While monitoring should be
conducted by the teams responsible for delivering, a third-party monitoring can also be
used extensively.
According to Lu et al. (2015) monitoring the performance of a project is part of project
governance and the monitoring practices themselves are detailed in contracts. On top of
contractually established set of performance targets, Nisar (2013) reminds that only
realistic and monitored project milestones and performance targets are useful. Therefore
Ruuska et al. (2011) recommends careful design of mechanisms for monitoring as
synchronous work is more difficult to monitor than sequential. Additionally Guo et al.
(2014) and Nisar (2013) list periodic cost and quality reviews as a key performance
indicators (KPI). They continue that stakeholder involvement during the project is
advisable e.g. in form of site visits and inspections. Guo et al. (2014) also add that team
managers should be responsible for reporting and monitoring risks. On top of internal
monitoring, external monitoring can be used as well, for both monitoring schedule and
budget. Nisar (2013) points out that a steering group can be beneficial to overall progress
monitoring and can also be a provider of guidance through consulting.
2.4.4 Coordination
“Coordination is required to align the behavior of each actor so that they can effectively
work together”(Kujala et al., 2016)
The list of Kujala et al. (2016) suggests that common project management practices
should take place to coordinate the project. In literature, this means general agreements
on budget, schedule and quality. Additionally, formal and non-formal means of enhancing
collaboration are advised in the form of shared structures and procedures. Information
sharing should be conducted in the confines of these established structures and procedures
and conflict resolution can be done either through legal consultation or non-formally
between parties.
According to Lu et al. (2015), project management practices (budget, deadlines, quality,
safety), expected behavior and processes related to resolving emergent events can be
contractually bound. Nisar (2013) adds that in order to create and manage collaborative
working relationships, correct structures and procedures must take place. The toolkit for
achieving this ranges from formal constructs (e.g. steering groups) to less formal
arrangements.
(Chang and Ive, 2007) speak of different ways of settling disputes – some problems
require the presence of legal counselling, while others can be negotiated without going to
court. (Lu et al., 2015) talks about using personal relationships between actors to resolve
conflicts and (Nisar, 2013) adds that open discussion should be the basis of conflict
resolution. On the other hand, (Nisar, 2013) also mentions a methodology for
collaborative problem resolution should be used to find solutions systematically within a
realistic time window.
Guo et al. (2014) recommends aiming towards a shared culture between organizations in
the network. Davies et al. (2014) adds that geographically closely located project teams
are beneficial. Additionally, Nisar (2013) talks about change management strategy to re-
locate services to better answer to issues in co-location.
Guo et al. (2014) suggests that in order to keep the schedule, regular meetings with project
participants should take place. On top of communicating schedule updates, information
about risks should also be shared between participants. Nisar (2013) speaks of

establishing a semi-hierarchical system as a basis for coordination. This grants the ability
to make democratic mechanisms to achieve trust and confidence between the participants.
These mechanisms should help to integrate the spectrum of skills, resources and networks
that the participating organizations own. Lu et al. (2015) has this to say about trust
between organizations: “trust has been identified as one of the deterministic factors to
reduce the negotiation cost, decrease the monitoring cost, and increase the possibility to
attain mutually beneficial agreements”.
Davies et al. (2014) speaks of creating strategy document that consists of the vision for
the project and the organizational processes that are needed to achieve that vision. They
also continue that an efficient document management system can be utilized to enable
data sharing between organizations.
2.4.5 Roles and Decision-making
“Roles and decision making refers to giving actors the necessary information to
understand the effect of decisions on overall performance, enabling them to make
appropriate decisions” (Kujala et al., 2016)
The list of Kujala et al. (2016) contains roles and decision-making as part of the project
network governance. According to Lu et al. (2015) roles and responsibilities among
participants should be defined in contracts. Ruuska et al. (2011) talk about balancing
authority and responsibility among the different stakeholders. They also emphasize the
role of the owner; the responsibility of establishing the management structure is in the
hands of the owner. Therefore, it is crucial that the owner has the competence and interest
to invest resources into the process. Nisar (2013) continues that project management
structure is important since it enables the reporting to reach the top levels of project’s
management.
2.4.6 Capability building
“Capability building ensures that project actors have adequate capabilities to meet
performance expectations” (Kujala et al., 2016)
According to the list of Kujala et al. (2016), actor selection, training and continuous
learning can have positive effect on the performance of the project. Literature
recommends thorough selection process and establishing long-term relations to ensure
reliable quality of delivery. Training and continuous learning also play their part and are
closely related to the upkeep of long-term relations.
Liu and Wilkinson (2014) points out that capable suppliers can be acquired by setting up
thorough market soundings; emphasis is on how the procurement process is organized.
Guo et al. (2014) adds that to ensure the expected project performance, selecting people
with established experience and good quality history is advisable. According to Nisar
(2013), it is important to discover the needs and requirements for different skills as early
as possible and acquiring said skills to avoid possible problems later on. Davies et al.
(2014) also recommends recruiting experienced managers to apply their past knowledge
and expertise to task at hand.
According to Davies et al. (2014) lessons from previous projects need to be learned, but
the vast possibilities of innovative solutions must not be neglected. Ruuska et al. (2011)
add that systematic practice development and taking good care of partnerships leads to
frictionless collaboration. They add that training should be provided for those suppliers
that lack the expected level of skill in an absolutely necessary area. Nisar (2013) talks
about joint organizational development to enable proper handling of issues rising from
culture changes.
Tynjälä (2008) supports the idea that learning at a workplace can be influenced by
collaboration. She continues that interaction between novices and experts is of great
importance since some of the knowledge cannot be obtained without the help of more
experienced staff. Additionally, if an employee cannot collaborate with others to share
information, they will gain less knowledge than their capable peers. However, she notes
that workplace learning outcomes are less predictable than learning in formal education.
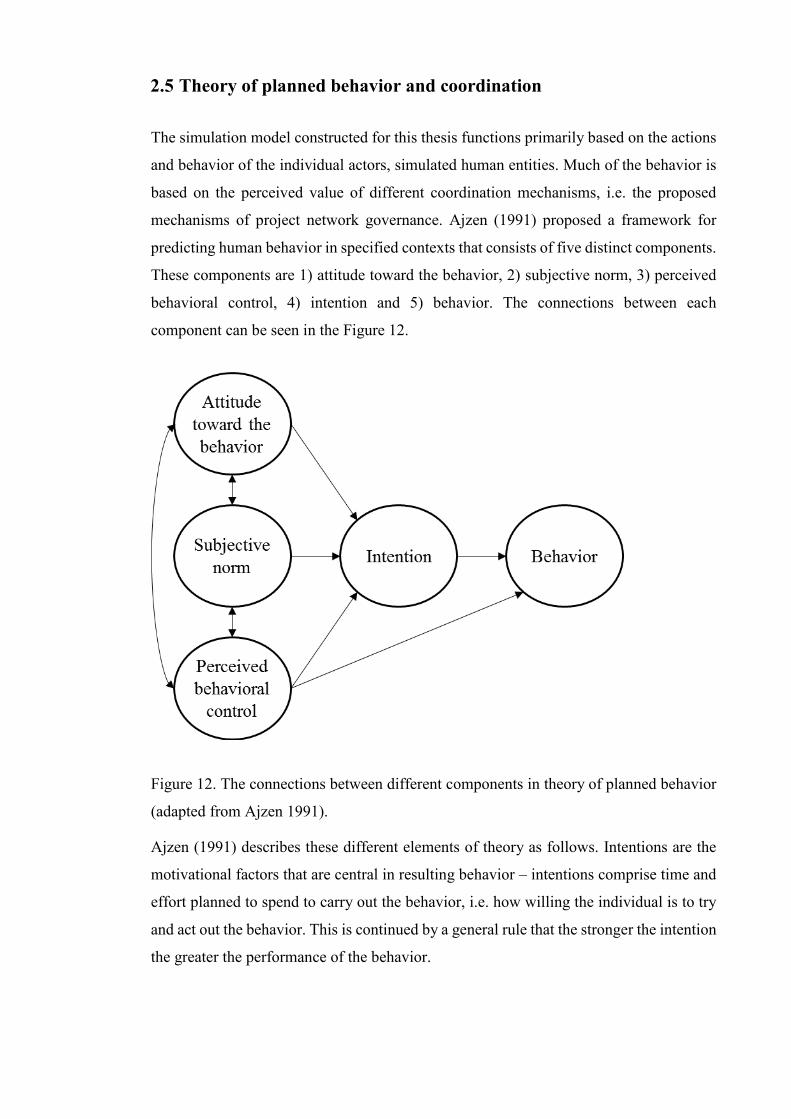
2.5 Theory of planned behavior and coordination
The simulation model constructed for this thesis functions primarily based on the actions
and behavior of the individual actors, simulated human entities. Much of the behavior is
based on the perceived value of different coordination mechanisms, i.e. the proposed
mechanisms of project network governance. Ajzen (1991) proposed a framework for
predicting human behavior in specified contexts that consists of five distinct components.
These components are 1) attitude toward the behavior, 2) subjective norm, 3) perceived
behavioral control, 4) intention and 5) behavior. The connections between each
component can be seen in the Figure 12.
Figure 12. The connections between different components in theory of planned behavior
(adapted from Ajzen 1991).
Ajzen (1991) describes these different elements of theory as follows. Intentions are the
motivational factors that are central in resulting behavior – intentions comprise time and
effort planned to spend to carry out the behavior, i.e. how willing the individual is to try
and act out the behavior. This is continued by a general rule that the stronger the intention
the greater the performance of the behavior.

According to Ajzen (1991), attitude toward the behavior signals the individuals perceived
evaluation of the behavior, be it negative or positive. He continues that, subjective norm
is the perceived social pressure to behave or not to behave as in the behavior in question.
Lastly, the perceived behavioral control, signifies the perceived level of difficulty of
carrying out the behavior – this includes the resources available to the individual, such as
time, skills or other people.
As a whole, the framework delivers the resulting behavior as a joint function of intentions
and the perceived behavioral control. It is possible to predict the behavioral achievement,
the performance of behavior, through a combination of intention and perceived behavioral
control. (Ajzen, 1991)
Hsu et al. (2016) follow the thought process of Ajzen (1991) and his subsequent work.
They propose that expertise coordination, as a follow up on the theory of planned
behavior, is influenced by both cognitive and affective factors. In their work, Hsu et al.
(2016) describe the exchange of knowledge, expertise coordination behavior, as a
combination of ability and willingness. Ability and willingness can be linked to the theory
of planned behavior (perceived behavioral control and intention, respectively) and
coincidentally, to the project network governance mechanisms proposed by Kujala et al.
(2016). Furthermore, Hsu et al. (2016) also link the project performance to the behavior
of the experts exchanging knowledge, much like Kujala et al. (2016) describe the project
safety performance as a result of ability and willingness. Figure 13 depicts the expertise
coordination behavior described by Hsu et al. (2016).
Figure 13. The proposed framework for knowledge exchange (adapted from Hsu et al.
2016).
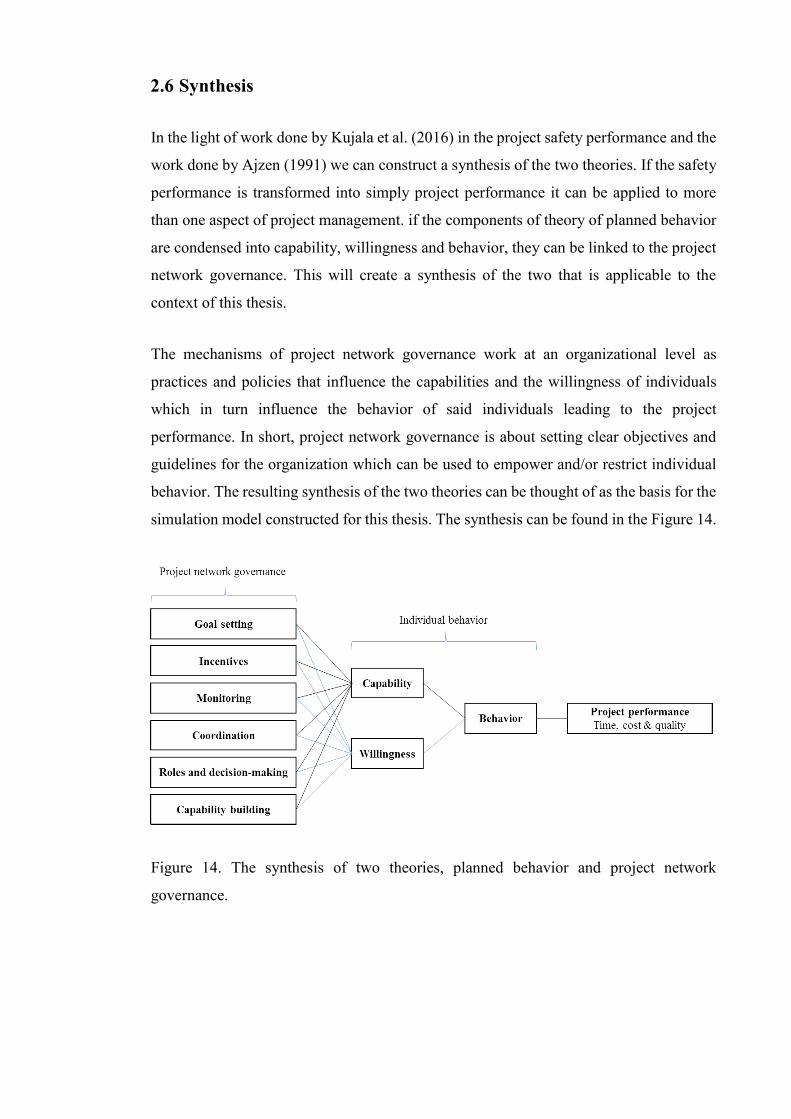
2.6 Synthesis
In the light of work done by Kujala et al. (2016) in the project safety performance and the
work done by Ajzen (1991) we can construct a synthesis of the two theories. If the safety
performance is transformed into simply project performance it can be applied to more
than one aspect of project management. if the components of theory of planned behavior
are condensed into capability, willingness and behavior, they can be linked to the project
network governance. This will create a synthesis of the two that is applicable to the
context of this thesis.
The mechanisms of project network governance work at an organizational level as
practices and policies that influence the capabilities and the willingness of individuals
which in turn influence the behavior of said individuals leading to the project
performance. In short, project network governance is about setting clear objectives and
guidelines for the organization which can be used to empower and/or restrict individual
behavior. The resulting synthesis of the two theories can be thought of as the basis for the
simulation model constructed for this thesis. The synthesis can be found in the Figure 14.
Figure 14. The synthesis of two theories, planned behavior and project network
governance.

3 SIMULATION
Although different kinds of simulations and simulators have existed throughout the ages,
the usage of computer simulations has been on the rise in the late-20th century as a result
of ever-increasing computational power and complexity of problems. Definition of
simulation according to Banks et al. (2010) is the following: “simulation is the imitation
of the operation of a real-world process or system over time”.
Gilbert and Troitzsch (1999) describe a model as “a simplification – smaller, less
detailed, less complex, or all of these together – of some other structure or system”. This
means that in order to build a simulation model, some action must be taken to increase
the level of abstraction. Leaving some components out of the simulation model increases
the amount of control the modeler has on the execution of the simulation.
Edmonds and Meyer (2013) defines the purpose of computer simulations as creation and
observation of a model based on behavior and interaction of the entities in the simulated
system. While Banks et al. (2010) and Gilbert and Troitzsch (1999) add that simulation
involves history of the system, inputs, and inferences about the execution of the
simulation model, outputs. Inputs can be artificially created or manually collected based
on the real system’s behavior. In a case of a real system being simulated, the outputs can
be used i.e. as a decision-making tool. This operation is illustrated in the Figure 15.
Figure 15. Creating a simulation model based on a real system and real data (adapted
from Gilbert and Troitzsch 1999).
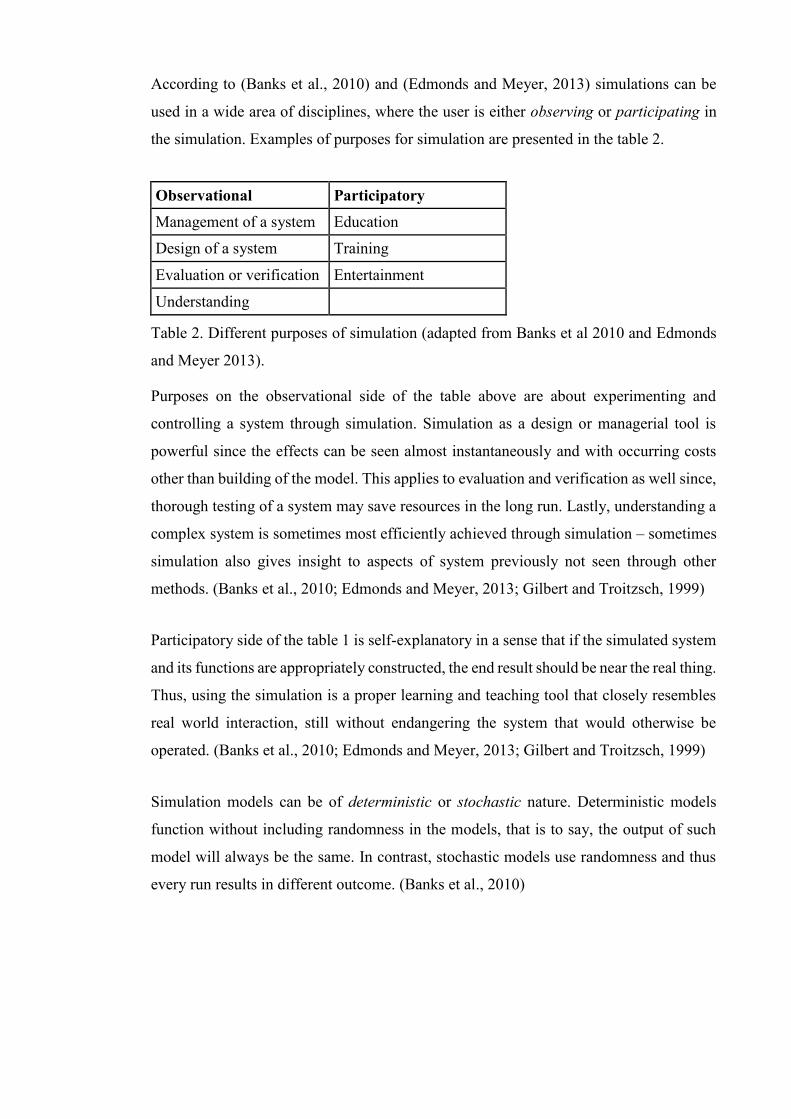
According to (Banks et al., 2010) and (Edmonds and Meyer, 2013) simulations can be
used in a wide area of disciplines, where the user is either observing or participating in
the simulation. Examples of purposes for simulation are presented in the table 2.
Observational Participatory
Management of a system Education
Design of a system Training
Evaluation or verification Entertainment
Understanding
Table 2. Different purposes of simulation (adapted from Banks et al 2010 and Edmonds
and Meyer 2013).
Purposes on the observational side of the table above are about experimenting and
controlling a system through simulation. Simulation as a design or managerial tool is
powerful since the effects can be seen almost instantaneously and with occurring costs
other than building of the model. This applies to evaluation and verification as well since,
thorough testing of a system may save resources in the long run. Lastly, understanding a
complex system is sometimes most efficiently achieved through simulation – sometimes
simulation also gives insight to aspects of system previously not seen through other
methods. (Banks et al., 2010; Edmonds and Meyer, 2013; Gilbert and Troitzsch, 1999)
Participatory side of the table 1 is self-explanatory in a sense that if the simulated system
and its functions are appropriately constructed, the end result should be near the real thing.
Thus, using the simulation is a proper learning and teaching tool that closely resembles
real world interaction, still without endangering the system that would otherwise be
operated. (Banks et al., 2010; Edmonds and Meyer, 2013; Gilbert and Troitzsch, 1999)
Simulation models can be of deterministic or stochastic nature. Deterministic models
function without including randomness in the models, that is to say, the output of such
model will always be the same. In contrast, stochastic models use randomness and thus
every run results in different outcome. (Banks et al., 2010)

3.1 Simulation as a research method
According to Kothari (2004) the basic formula for conducting a scientific research project
is a process of about seven steps. The process kicks off with defining the research
problem, then proceeds to literature review and formulating hypothesis. Research design
can be done after preliminary studies have been concluded, and then proceed to collecting
data. After enough data has been collected and analysed (sometimes multiple rounds of
data gathering is required), the research project can begin its final step – interpretation
and reporting. The research process flow chart can be seen in the Figure 16.
Figure 16. Research process flow chart (adapted from Kothari 2004).
Davis et al. (2007) point out that, while simulations can be used during non-simulation
based research as an additional tool (e.g. usage of pre-built models to analyze or interpret
collected data), simulation as a research method can be valid as well. According to Davis
et al. (2007), simulation is capable tool to develop new theories since simulations rely on
the accuracy and the ability to experiment of computer software. Accuracy is achieved by
thorough understanding of the theory being developed and the corresponding translation
to modeling language. Once the theory has been included in the programming, it can be
expanded and refined through experimentation.

Davis et al. (2007) provides a guide on how to conduct a simulation based research. While
similar to figure above, but not as extensive as the process for building simulation models
Banks et al. (2010) provide (this will be more thoroughly inspected in later chapter), it
still has its merits. The list of activities can be seen below.
1. Research question
2. Identify simple theory
3. Choose simulation approach
4. Create computational representation
5. Verify computational representation
6. Experiment to build a novel theory
7. Validate with empirical data
According to Banks et al. (2010), there are multiple advantages and disadvantages in
using simulation. Simulations can be run without interrupting the underlying real system.
New resources can be tested without acquiring them first (machines etc.). Reasons for
how and why certain phenomena occur can be investigated. Time can be altered to get a
closer or wider look at the effects of an event. Bottleneck analysis regarding various
variables can be performed. Simulation can be used to answer “what if”-questions.
In addition, Banks et al. (2010) also list the disadvantages of simulation. Using and
building simulation models require special training and resources. Results of a simulation
can be hard to interpret (due to randomness). Simulations can be time and cost intensive.
However, some of these disadvantages can be countered by the following Banks et al.
(2010). Many vendors have been developing simulators that only require input (thus
eliminating the work on building models). Similarly, many vendors have also included
thorough tools for analyzing simulation results in their software. Simulation software are
continuously being developed and contain ever-increasing number of pre-built packages
for specific tasks.
According to Banks et al. (2010), due to ever-increasing computing power and cost-
efficiency simulation has been accepted as a tool in operations research and system
analysis. Banks et al. (2010) have also compiled a list of appropriate uses of simulation
as a tool which are the following in a condensed form. Simulation can be used to study
or experiment interactions of a complex system or a subsystem within. Changes in

information, organization or environment can be simulated to see the effects on behavior.
Building a simulation model can be insightful for suggesting improvements to system
under investigation. Experimenting with variables can yield important information
regarding the most influential variables. Simulations can be used to test out policies and
designs to see the results before implementation.
Banks et al. (2010) also mention situations where simulation is not advised. These
situations include the following. Simulation should not be used when the solution can be
found using common sense or analytically. It is not advised to use simulation when (real
world) experiments are cheaper than building a simulation model. Similarly, simulation
should not be used if the projected savings do not exceed the costs of a simulation project.
Simulation often requires data to be performed accurately, and if that data is not available
or is scarce, then it should be considered if simulation is appropriate. Lastly, if the
simulated system is too complex to describe, the simulation will probably be too complex
to build as well.
Berends and Romme (1999) formulate three problems why simulation is not widely
utilized by management researchers. First of all, academic researchers are prone to be
specialized in their field, while using simulation might require more insight to the system
as a whole (on top of the skill required to operate the software). The term jack-of-all-
trades comes into mind. The second reason relates to definitions of complicated and
complex. While complicated systems can be broken down to smaller components and then
analyzed using existing tools and methods, complex systems consist of intricate patterns
and interactions between components and are therefore hard to decipher. According to
Berends and Romme (1999), since most of the management research falls into category
of complicated rather than complex, simulation is not so commonly used. The third and
last reason for simulation’s low presence in management research is that most of the
research tends to fall on the empirical science side of research rather than design science.
Harrison et al. (2007) continues to list possible problems regarding simulation based
research. Modeling and experimental structures are not sufficiently detailed to yield
enough information to understand what has been done. Programming errors might skew
results in various ways. The programmer may take liberties in translating formal model
to simulation language resulting in different behaviors than intended. Two different
researchers may use the same formal model and develop two different simulation models

with different results (not intended). The results of a simulation may not be suitable for
generalization outside the parameters that were used during the simulation.
However, Harrison et al. (2007) considers the simulation in management research a
potentially rich tool. For example, organizations are complex and many of their traits and
behaviors are not easily accessible to researchers, especially longitudinal studies, whereas
simulation provides an environment for theorists to experiment. Simulation can also be
used in creation of new theories or validating of previous arguments. The links between
different types of approaches to simulation of management research by Harrison et al.
(2007) can be seen in Figure 17.
Figure 17. How simulation fits into management research environment (adapted from
Harrison et al. 2007).

3.2 Process of creating a simulation model
Banks et al. (2010) present a flow chart for a simulation study. This flow chart can be
used a general form of project plan for developing a simulation model. Other similar flow
charts have been developed by e.g. Perros (2009) and Sterman (2000), however the flow
chart chosen for this thesis had the best combination of characteristics of all other
versions. This version encompasses the iterative nature of the development process and
is thorough in approach to verification, validation and experimentation. The development
of a simulation model and the relevant steps will be detailed in this chapter. Flow chart is
in the Figure 18.
Figure 18. Simulation study process chart (adapted from Banks et al. 2010).

3.2.1 Problem definition
As stated by Banks et al. (2010), simulation study begins with a problem statement. The
problem should be thoroughly analyzed and presented in such a way that both the
problem’s owner and the builder clearly understand what is being simulated. However, it
is possible that the problem is not clear during the early phases of the study and must be
revised as time passes. Edmonds and Meyer (2013) speak of writing a problem
description which composes of key requirements for the project – meaning that what is
to be gained from building and later using the simulation. Sterman (2000), adds that the
problem articulation is the most important step in a simulation study. A clear purpose
needs to be set for the model and it should be considered what question simulation is
going to answer to. This will concentrate the focus on a singular, more manageable and
comprehensible topic.
According to Gilbert and Troitzsch (1999), observing the target of the simulation is
required to build the model with accurate parameters and initial conditions. They continue
that once observations have been concluded, one can make assumptions and begin the
design process.
3.2.2 Setting objectives for the project
Objectives in this case mean what are the goals of the simulation, what is one trying to
achieve. This is the time to weigh different approaches to the problem and verify that
simulation is indeed the correct tool for the job. It is advised to construct a project plan
for the study that includes information about the resources required, costs that will incur
and the duration of the study. Project plan can also include the alternative approaches and
the reasoning why they were not chosen for the study. The expected results should be
placed in the plan as well, since this information might be vital for the progress of the
study. (Banks et al., 2010)
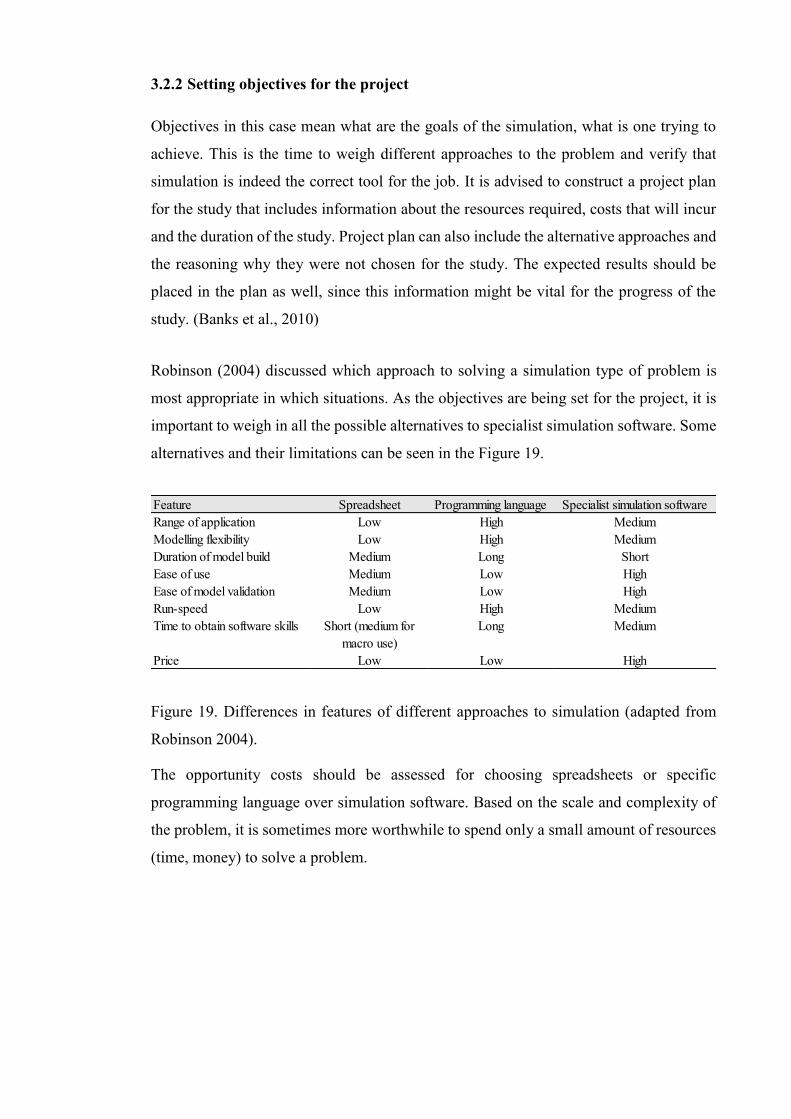
Robinson (2004) discussed which approach to solving a simulation type of problem is
most appropriate in which situations. As the objectives are being set for the project, it is
important to weigh in all the possible alternatives to specialist simulation software. Some
alternatives and their limitations can be seen in the Figure 19.
Figure 19. Differences in features of different approaches to simulation (adapted from
Robinson 2004).
The opportunity costs should be assessed for choosing spreadsheets or specific
programming language over simulation software. Based on the scale and complexity of
the problem, it is sometimes more worthwhile to spend only a small amount of resources
(time, money) to solve a problem.
Feature Spreadsheet Programming language Specialist simulation software
Range of application Low High Medium
Modelling flexibility Low High Medium
Duration of model build Medium Long Short
Ease of use Medium Low High
Ease of model validation Medium Low High
Run-speed Low High Medium
Time to obtain software skills Short (medium for
macro use)
Long Medium
Price Low Low High

3.2.3 Model conceptualization and data collection
Gilbert and Troitzsch (1999) state that “every model will be a simplification – sometimes
a drastic simplification”. This means that it is paramount that the modeler decides what
is included in the model and what is left out. Banks et al. (2010) elaborates that it is
beneficial to start with a simple model and continue to build upon the foundation as time
progresses. Banks et al. (2010) continue that while adding features to the model is a
possibility, it does not mean that the model should be flooded with features not essential
for solving the problem it was meant solve. Robinson (2004) emphasizes the impact of
well-designed model on the schedule of a simulation study. He continues that while
modern simulation software provides the possibility of rapid early prototype development
and reduces the distance between conceptual modeling and computer modeling, the
decision making regarding the model design still remains. Robinson (2004) also points
out that recent advances in computer hardware and software enable modelers to build
increasingly complex models all the while the need for more complex models is not
always the case.
Of course in order to make assumptions and abstractions of the system, some data
collection might be required. Banks et al. (2010) advise to begin the data collection as
early as possible since it will take a lot of time and resources. According to Gilbert and
Troitzsch (1999), it is dangerous to include too many features in the model. This can result
in large amounts of extra work just from collecting the required data. Additionally, large
quantities of data and features could make verification and validation a tedious and
difficult effort.
Robinson (2004) defines three types of data: A) available, B) not available but collectable,
and C) not available and not collectable data. Category A data can already be collected
for different purpose and can be reused again. The heavy use of information systems and
other monitoring means in the modern society provide a good basis for data collection.
Category B data needs to be collected, and it is often subjective to the problem at hand.
Data can be can quantitative or qualitative, depending on the need of different types
information and nature of the problem. Category C data may pose problem if the real
world system does not exist or the time window for collecting the data does not fit into
the schedule of the study.
3.2.4 Model translation
According to Banks et al. (2010), it is possible to reach a conclusion using the chosen
simulation software’s own solutions which can eliminate large portions of actual
modeling and coding. It is also possible to accomplish the whole ordeal with little or no
coding at all. Banks et al. (2010) continues, that modern simulation software is flexible
and powerful – with wide variety of options to choose from. If a new software is needed
to complete the simulation study, a selection of software provider is necessary. Robinson
(2004) summarizes the selection process as follows:
1. establish the modeling requirements
2. survey the software
3. establish evaluation criteria
4. evaluate the software
5. select the software
In a case where the solution requires programming, Gilbert and Troitzsch (1999) state
that the language should have the following characteristics: well structured, contain the
possibility of incremental refinement, easy and rapid debugging, easy instrumentation,
and contains good graphics libraries.
Gilbert and Troitzsch (1999) continue that the modeler should have pre-existing
knowledge of the language, and the language itself should be widely known to enable the
model’s replication or adaptation by other researchers. Robinson (2004) notes that while
the selection of simulation software is of great importance, most of the software are
capable of delivering wide range of solutions. Far more pressing matter is the capability
of the modeler as development projects are demanding tasks that include management
skills on top of problem solving and programming.
Robinson (2004) reminds that before writing a single line of code, the structure of the
model should be clarified first and designed thoroughly. If the structure is preplanned and
executed in a consistent manner, a lot of the mistakes and rework can be evaded. Robinson
(2004) also lists four key elements for designing the model structure:

- Speed of coding
- Transparency, i.e. how easily the code can be understood
- Flexibility, i.e. how easily the code can be modified
- Run-speed, i.e. how fast the simulation will run
These are not mutually exclusive and the project requirements may conflict with some of
the elements. The model structure itself may be written on a piece of paper, using
standardized modeling languages (e.g. UML) or by constructing the model using
pseudocode. This process can be iterative and it is advised to document the structure and
keep it up to date as the project progresses. Robinson (2004)
Robinson (2004) advises to develop the code, test the code and document the model all
at the same time rather than doing them back to back. This approach will increase the
level of refinement from early on and can eliminate problems before they are hard to
track. Robinson (2004) also emphasizes that the code should be separated from the results.
This way users of the model do not need training in data input or understanding the
underlying code.

3.2.5 Verification and validation
Verification and validation are often defined hand in hand. Gilbert and Troitzsch (1999)
defines them as follows: verification means that the program is working as intended and
validation means that the model is a good fit for the purpose. According to Banks et al.
(2010), verification can require a lot of debugging the amount of which can increase as
the complexity of the model increases. Validation on the other hand, according to Banks
et al. (2010), is basically done by calibrating the model to match the system being
simulated. Calibration is performed by comparing the outputs or behavior of the model
to that of the system’s.
Verification and validation is a costly and time consuming process according to Sargent
(2003) and often testing is not done to account one hundred percent of intended
applicability. Instead the tests are run until an adequate confidence level is achieved. The
relation between costs incurred and value gained can be seen in the Figure 20.
Figure 20. Model confidence (adapted from Sargent 2003).
According to Sargent (2003), there are two approaches to validation, internal and external
types. Internal validation is the more frequently used method where the development team
itself is responsible for both developing the model and the subsequent validation of it.
Since this produces a subjective statement of the validity, Sargent (2003) recommends
using one of the following methods of external validation to ensure credibility. First of
the external validation methods is to involve the user of the model as validators. However,
the model size and complexity should be taken into account – large and complex model
should be handled by experts which is the following method. Sargent (2003) speaks of
“independent verification and validation” (IV & V), a third party reviewer that is
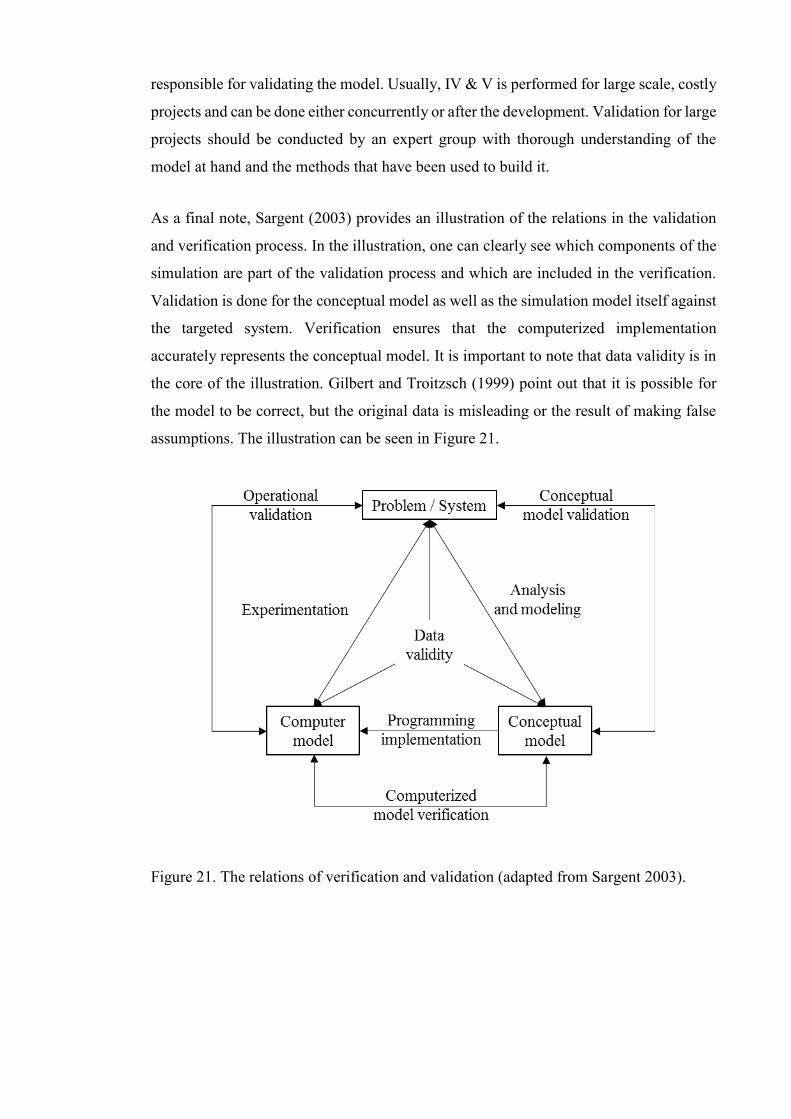
responsible for validating the model. Usually, IV & V is performed for large scale, costly
projects and can be done either concurrently or after the development. Validation for large
projects should be conducted by an expert group with thorough understanding of the
model at hand and the methods that have been used to build it.
As a final note, Sargent (2003) provides an illustration of the relations in the validation
and verification process. In the illustration, one can clearly see which components of the
simulation are part of the validation process and which are included in the verification.
Validation is done for the conceptual model as well as the simulation model itself against
the targeted system. Verification ensures that the computerized implementation
accurately represents the conceptual model. It is important to note that data validity is in
the core of the illustration. Gilbert and Troitzsch (1999) point out that it is possible for
the model to be correct, but the original data is misleading or the result of making false
assumptions. The illustration can be seen in Figure 21.
Figure 21. The relations of verification and validation (adapted from Sargent 2003).

Rand and Rust (2011) provide a step-by-step guide for verification and validation to
create rigorous simulation models. This guide elaborates on the different tasks of the
verification and validation process. The verification process mainly consists of testing
and reviewing of the code with additional targeted experiments. The validation process
focuses on the structures and results gained from the model and compares them to targeted
system or real world. The table 3 contains all the necessary steps suggested.
Verification
1. Documentation
Documentation of conceptual design and model
2. Programmatic testing
Testing of each functional component
Examining the code in group setting
Going through the execution of the model step by step
Testing the model against logical assumptions
3. Test cases and scenarios - testing the conceptual model
Corner case or extreme values are tested
Samples of different inputs are compared to find any deviating
behavior
Testing inputs against known outputs
Testing the relationships between inputs and
outputs
Validation
1. Micro-face validation
Elements correspond to the real world
2. Macro-face validation
Processes and patterns correspond to the real world
3. Empirical input validation
Input data corresponds to the real world
4. Empirical output validation
Output data corresponds to the real world
Seeking known patterns that will be reproduced in the model
Achieving real world results using the model
Comparing the model to a previous model to cross validate
Table 3. The steps for verification and validation (adapted from Rand and Rust 2011).

3.2.6 Experimentation and analysis
Experimentation aims to find the solution to a problem by comparing results from
different sets of configurations, statistical analysis or sensitivity analysis. The solution
can be either a best scenario, a solution that satisfies the customer or simply an increase
in the knowledge of the system. Keyword here is finding the solution space. Solution
space is the total amount of different conditions or combinations the simulation can be
run with. Solution spaces can be enormous and sometimes the effort required to find the
solution is equally large. (Banks et al., 2010; Gilbert and Troitzsch, 1999; Robinson,
2004)
Tools for experimentation according to Robinson (2004) are interactive and batch
experimentation, comparing alternatives and search experimentation. Interactive
experimentation implies that the user handles the inputs for the modeled system and tries
to gain understanding of the model through results. Batch experiments on the other hand
are run without interaction for a pre-determined length (Monte Carlo simulation will fall
into this category) to gain accurate results. Comparing alternatives can be done with
statistical tools such as calculating confidence intervals, measures of variability and
paired t-test. Search experimentation can be done manually after identifying important
experimental factors and therefore reducing the number of factor combinations or
computationally through optimization
Sensitivity analysis, according to Gilbert and Troitzsch (1999), aims to investigate the
sensitivity of the simulation model to the underlying assumptions made during the
development. This means that using different parameters the output can change,
drastically or very slightly. The sensitivity analysis can be used in discovering anomalies
in the parameters, e.g. if changing one or more parameter slightly influences the model’s
behavior immensely, the correctness and origin of those parameters can be questioned.
According to Robinson (2004), sensitivity analysis is beneficial for the following reasons.
Firstly, sensitivity analysis gives insight about the uncertainties in data, e.g. data
unavailable for collection influences the results greatly. Secondly, it yields information
about how different experimental factors influence the results. Lastly, it can be used to
determine the robustness of the solution.

Gilbert and Troitzsch (1999) emphasize that experimentations can include hundreds of
runs and for this reason, the simulation program has to run as fast as possible. They also
mention that simulations generate large quantities of data and therefore the process of
transforming that resulting data in manageable form must be straightforward.

3.2.7 Documentation
According to Banks et al. (2010), there are two different types of documentation
necessary for a simulation study. First of all, documentation for the program itself must
be generated. A thorough inspection of the program’s functionalities and design
principles should be detailed in case of the program being used later for similar studies or
if the development is continued by the same or different modeler. Robinson (2004) adds
that documentation is crucial for clients to understand the inner machinations of the model
and it is essential for verification and validation.
Banks et al. (2010) also mentions that the progress of the project should be documented
as well. It can prove itself valuable during the development process, since any
misconceptions can be dealt with and the problems can be addressed early on. Later, the
documentation can be used to review all the design choices and justifications that lead to
the conclusion – as a learning or decision tool.
Robinson (2004) quotes Oscarsson and Urenda Moris (2002) that typical cost of
documentation in a software development project is between 20 and 30 percent of the
total cost. As simulation development is somewhat similar to typical software project, the
numbers should be similar. Robinson (2004) lists three different kinds of documentation
for simulation studies. These are model, project and user documentation. Examples for
each category can be found in the table 4.
Table 4. Different forms of documentation (adapted from Robinson 2004).
Model Project User
Conceptual model Project specifications Project background
Assumptions and simplifications Meeting lengths Guide to running the model
Input data and experimental
factors (interpretations, sources
of data) Experimental scenarios run
Input data and experimental
factors (interpretations, sources
of data)
Model structure
Verification and validation
performed
Experimental factors (meaning
and how to change them)
Interpretation of results Results of said experiments Interpretation of results
Meaningful names for variables Final report
Commenting code Project review
Visual representation of the
model

The ODD (Overview, Design concepts, Details) protocol is a framework for documenting
agent based models. The framework’s purpose is to standardize and simplify the
description of agent based models. Many agent based models fall into the category of
high complexity and therefore a need for logical way to structure them was born.
Overview section of the framework defines the purpose, components and processes of the
model. Design concepts offer a glimpse of the defining characteristics of the individual
agents – their sets of rules for behavior. Details section provides the necessary
information about initialization, types of input and submodels. The original framework
was developed by Grimm et al. in 2006 and the updated version was released in 2010.
Differences between the two versions lie mostly in the agent characteristics description
section and can be observed in Figure 22. (Grimm et al., 2010)
Figure 22. The updated ODD protocol as a documentation framework (adapted from
Grimm et al. 2010).
Benefits from using the ODD protocol are more structured and rigorous model
formulation, more straightforward review process and comparison possibilities, and
clearer communication of theory. On the downside, ODD can be too laborious for simple
models and some of the parts might require too detailed descriptions. (Grimm et al., 2010)
4. Design concepts 4. Design concepts
- Emergence - Basic principles
- Adaptation - Emergence
- Fitness - Adaptation
- Prediction - Objectives
- Sensing - Learning
- Interaction - Prediction
- Stochasticity - Sensing
- Collectives - Interaction
- Observation - Stochasticity
- Collectives
- Observation
5. Initialization 5. Initialization
6. Input 6. Input data
7. Submodels 7. Submodels
1. Purpose
2. Entities, state variables and scales
3. Process overview and scheduling
Desi
gn
co
ncep
ts
Original ODD (Grimm et al. 2006) Updated ODD
1. Purpose
2. State variables and scales
3. Process overview and scheduling
Deta
ils
Ov
erv
iew

3.2.8 Implementation
In this case implementation means that the simulation study has an impact on the real
world in some way. The effect can be achieved by a change in a system or increased
knowledge of subject matter. Robinson (2004) mentions three possible types of
implementation:
- Implementing the findings: Based on the findings and the report of the
simulation study, the client can decide which (if none at all) of the
recommendations will be implemented on the system. If some changes can be put
into practice the modeler may be included in the project which is a great advantage
given the in depth knowledge of the simulation. The simulation and its results
should be kept closely at hand in order to keep the changes made to real world
system in check. Making revised experiments on the model with newly found
evidence can lead to better results.
- Implementing the model: In this case, the model is the result which can be used
by client for their own experiments or as tool for decision making. The client can
run the simulation by themselves or it possible for the modeler to do runs and
experiments for the client by request. User documentation should be adequately
constructed and support for the model as a whole should be continued after the
hand-over.
- Implementing as learning: Modeler, client and the users all learn about the real
world system during the whole simulation development project not just from the
direct results. The knowledge gained from the study can exceed the limits of the
simulation area.

3.3 Prior research on project simulation
A short study was conducted to find out the current state of project simulation as a whole.
The goal was to find whether or not there were any studies that relate to simulating project
governance or projects in general. Also the chosen simulation modeling method was
interesting to analyze.
Searching for agent based simulation articles from the International Journal of Project
Management concluded with only one article from year 2015. With simulation as the only
input, the same search found 74 articles. Respectively, Project Management Journal
search yielded no results for agent based simulation and two articles for simulation.
Thus a search was conducted with different search terms for all available journals. After
refining the search inputs, some interesting articles were found. A list of different project
simulation articles including method and key findings can be found in table 6.
Title, Author(s) Year Method Findings
The Role of System
Dynamics in Project
Management: A
Comparative Analysis with
Traditional Models,
(Rodrigues, 1994)
1994 System
dynamics
System dynamics models have not been
built under an organized framework.
They provide systematic analysis of
management issues, but lack detailed
operational translation.
A simulation model for
multi-project resource
allocation,
(Fatemi Ghomi and Ashjari,
2002)
2002
GPSS
(discrete-
event)
Results for four different resource levels
for project durations
A Simulation-Based Process
Model for Managing
Complex Design Projects,
(Cho and Eppinger, 2005)
2005 Discrete-
event
The model can be used for evaluating
project plans and risk management.
Increased understanding of behaviour of
engineering design processes.
An Agent-Based System for
Multi-Project Planning and
Scheduling,
(Jinghua and Wenjian,
2005)
2005 Agent
based
An agent based software for multi-
project planning which can be integrated
to existing ERP system.

Cooperative subcontracting
relationship within a project
supply chain: A simulation
approach,
(Parrod et al., 2007)
2007 Discrete-
event
The model can be used as tool for testing
different policies of co-operation. Project
manager can use the model to convince a
subcontractor to see the value of co-
operative processes.
System Dynamics
Simulation to Support
Decision Making in
Software Development
Project,
(Xie et al., 2008)
2008 System
dynamics
The benefits of recruiting programmers
versus adding overtime are discussed. In
conclusion, sometimes overtime is better
than recruitment.
Simulating Learning
Dynamics in Project
Networks,
(Taylor et al., 2009)
2009 Agent
based
Negative impact on system level learning
when relations are unstable and task
interdependencies exist between firms.
Monte Carlo simulation in
risk management in projects
using Excel,
(Tysiak and Sereseanu,
2009)
2009
Excel
(discrete-
event)
Usage of Excel brings a lot of the
statistical tools for risk management as a
cost-effective alternative.
Activity scheduling in the
dynamic, multi-project
setting: choosing heuristics
through deterministic
simulation,
(Melorose et al., 2015)
2015 Algorithm
The algorithm presented can be used for
calculating schedules and resource
allocations.
Table 5. A list of different project simulation articles and their findings.
As can be seen from the list, the simulation side of research papers contain a wide array
of different approaches to simulation itself, let alone the problems they are solved with.
While the problems presented in each paper differ somewhat from one another, the most
common problem that was solved using simulation was resource constrained project
scheduling problem (RCPSP). Aspects of the problem were utilized in the papers of
Fatemi Ghomi and Ashjari (2002), Cho and Eppinger (2005) and Melorose et al. (2015).
The agent based models on the list tackle two different problems. In the model of Jinghua
and Wenjian (2005), all the agents have specified tasks assigned to them and the purpose
of the model is to provide a comprehensive tool for multi-project environment. The agents

communicate with each other and convey information. Scheduling of the project is done
by the agents and monitored by them.
The paper of Taylor et al. (2009) discusses the effect of learning in project organizations
when there are task interdependencies and instability in project network. By increasing
the number of different roles per organization, the learning slows down. This is due to the
fact that as the number of roles increase so does the number of possible combinations of
firms in a network. When projects are not always completed with the same set of firms
the learning effect is slower.
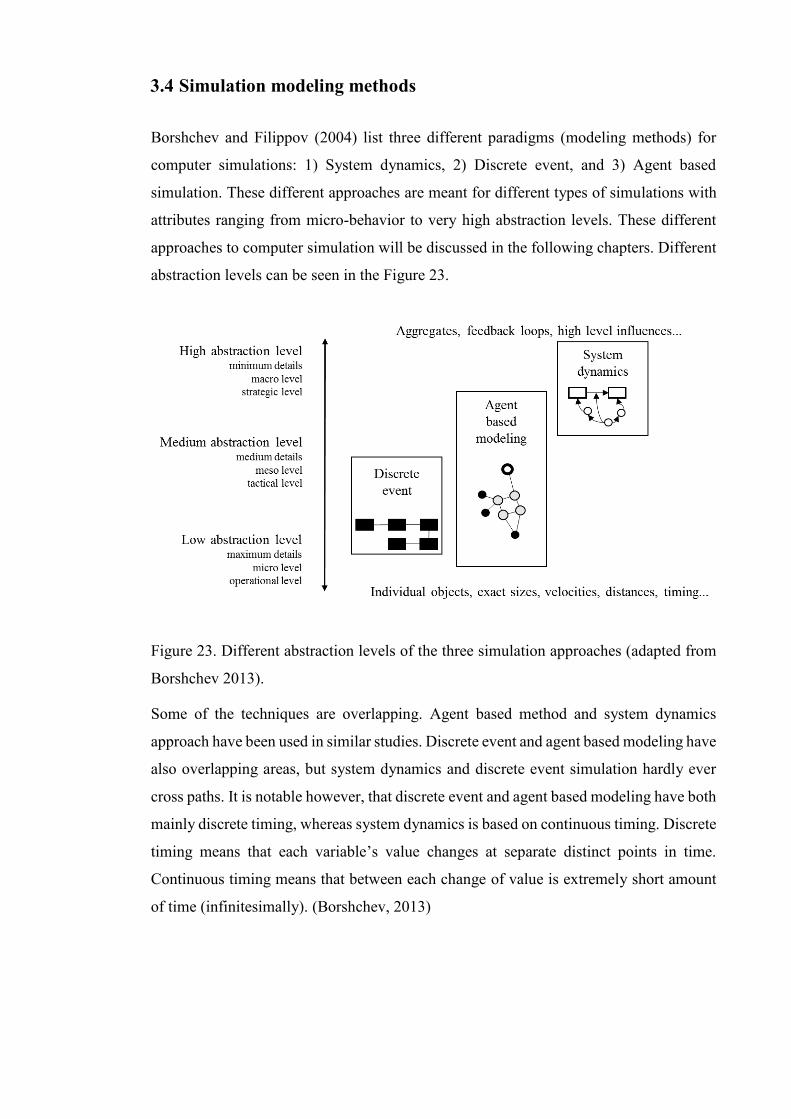
3.4 Simulation modeling methods
Borshchev and Filippov (2004) list three different paradigms (modeling methods) for
computer simulations: 1) System dynamics, 2) Discrete event, and 3) Agent based
simulation. These different approaches are meant for different types of simulations with
attributes ranging from micro-behavior to very high abstraction levels. These different
approaches to computer simulation will be discussed in the following chapters. Different
abstraction levels can be seen in the Figure 23.
Figure 23. Different abstraction levels of the three simulation approaches (adapted from
Borshchev 2013).
Some of the techniques are overlapping. Agent based method and system dynamics
approach have been used in similar studies. Discrete event and agent based modeling have
also overlapping areas, but system dynamics and discrete event simulation hardly ever
cross paths. It is notable however, that discrete event and agent based modeling have both
mainly discrete timing, whereas system dynamics is based on continuous timing. Discrete
timing means that each variable’s value changes at separate distinct points in time.
Continuous timing means that between each change of value is extremely short amount
of time (infinitesimally). (Borshchev, 2013)

3.4.1 System dynamics method
System dynamics models are based on a top-down type of method, meaning that the
system is broken into its major components and the interactions are observed between
them. These components are the system state and rate variables that define the whole
system being modeled. (Sargent, 2010)
The idea behind system dynamics models is that they closely resemble differential
equations, but are run with a fixed time step. Sargent (2010) defines system dynamics
model (SDM) formally:
SDM = {St, Rt(St-1), T},
where St equals to state variables at time t, Rt(St-1) are the rate variables (dependent on
previous time periods), and T is the simulation engine used to bring the model forward
step by step in time. An example will be given later to shed some light on the definition.
Simulations using system dynamics approach has been around since the 1950’s, and was
invented by Jay W. Forrester. Borshchev and Filippov (2004) lay their foundation on
Forrester’s work and describe system dynamics as a combination of stocks, flows, and
information. Information determines the rate of which the flows affect the stocks. Sterman
(2000) continues that system dynamics are a collection of feedback loops – loops that
either reinforce or balance the system.
Stocks are aggregated containers of information, e.g. amount of population in a country
or an inventory size. The stocks are identified by their type, but system dynamics doesn’t
take into account if the items contained in the stock are heterogeneous. Stocks are affected
by corresponding flows of the same type, e.g. mortality or birth rate for populations. The
notion that feedback loops either reinforce or balance the system means that if a change
happens somewhere in the system, that change can have an effect somewhere else in the
system, either negative or positive. This is best explained through a simple model in
Figure 24. (Borshchev, 2013)

Figure 24. Bass diffusion model using Anylogic system dynamics library.
In the Bass diffusion model in Figure 24 we can see two stocks, potential adopters and
adopters. We have one flow, adoption rate which signifies that a potential adopter buys
products and shift to being adopters. The model contains multiple feedback loops – if
potential adopters increase the number of purchases increase and at the same time
completed purchases increase the number of adopters. On top of that, adoption from word
of mouth increases as more purchases are being completed. System dynamics models are
usually deterministic and therefore produce the same results every run.
Areas of use for system dynamics by System Dynamics Society (2011):
- Economics
- Social science
- Management
- Public policies
- Environmental studies

3.4.2 Discrete event method
Discrete event (DE) method is designed for dynamic, stochastic models where events are
fired up in discrete points in time causing state variables to change. Due to their stochastic
nature, DE models usually require replications or long runs to even out the results. There
are two worldviews on discrete event method, process-oriented and event-oriented.
(Heath et al., 2011)
Looking at discrete event method from the process-oriented point of view is similar to
designing a process chart and according to Borshchev (2013) “the modeler considers the
system being modeled as a process, i.e. a sequence of operations being performed across
entities”. According to Banks et al. (2010) discrete event simulations consist of sequences
of operations, that include delays, resources, and branches. Heath et al. (2011) describes
the process-oriented of DE method as a system where entities pass through processes that
require resources and time.
The event-oriented approach on the other hand is simply defined as a system where each
component’s state is defined by a function the parameters of which are the initial state
and a sequence of events that have occurred by the time of inspection. While the event-
oriented approach is the older definition, the process-oriented mindset has surpassed its
old brother in popularity. The defining characteristic is that discrete event simulations
often deal with queues as seen in the example Figure 25. (Heath et al., 2011)
Figure 25. Bank queueing system using Anylogic discrete event (process) library.

The queue system is a classic use case for discrete event simulations, since most of its
applications lie in the operations research. Figure above contains one source (clients
arrive) and one sink (clients leave). It also has two activities (service at ATM or at cashier)
and two branches for different needs of service. System states could be utilization of the
ATM or queue length to cashiers.
Areas of use for discrete event method by Banks et al. (2010):
- Manufacturing
- Business processes
- Construction
- Logistics
- Health care
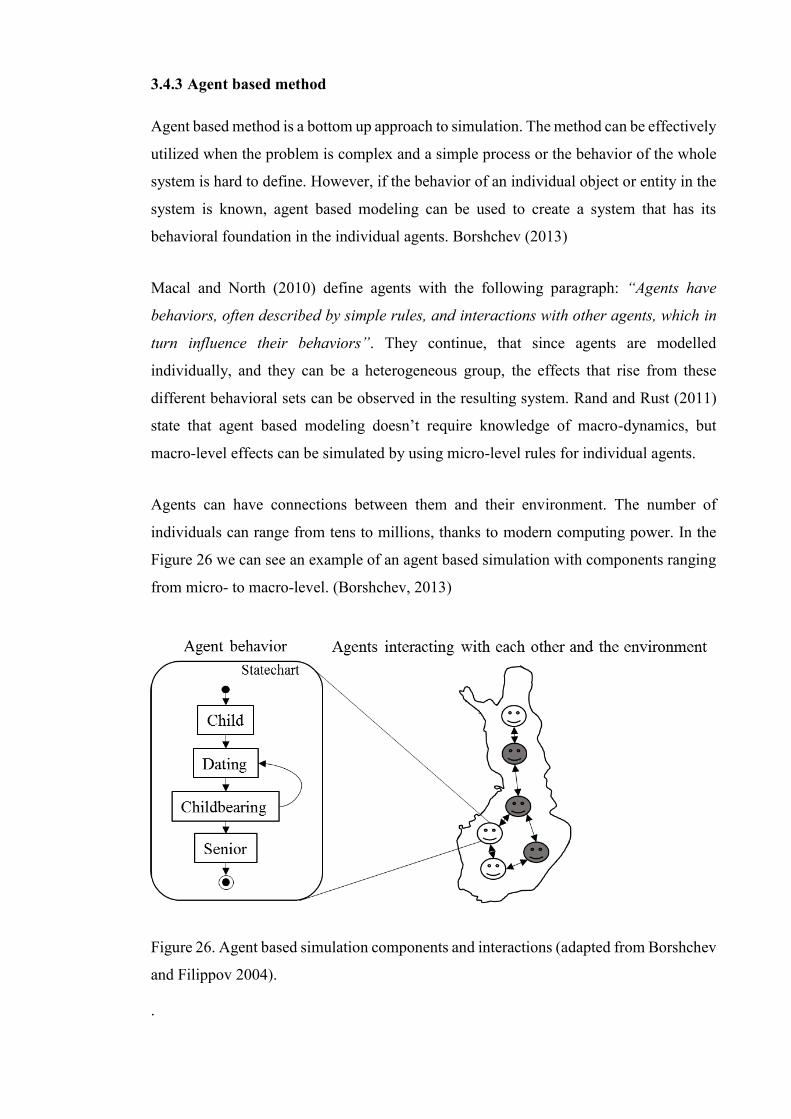
3.4.3 Agent based method
Agent based method is a bottom up approach to simulation. The method can be effectively
utilized when the problem is complex and a simple process or the behavior of the whole
system is hard to define. However, if the behavior of an individual object or entity in the
system is known, agent based modeling can be used to create a system that has its
behavioral foundation in the individual agents. Borshchev (2013)
Macal and North (2010) define agents with the following paragraph: “Agents have
behaviors, often described by simple rules, and interactions with other agents, which in
turn influence their behaviors”. They continue, that since agents are modelled
individually, and they can be a heterogeneous group, the effects that rise from these
different behavioral sets can be observed in the resulting system. Rand and Rust (2011)
state that agent based modeling doesn’t require knowledge of macro-dynamics, but
macro-level effects can be simulated by using micro-level rules for individual agents.
Agents can have connections between them and their environment. The number of
individuals can range from tens to millions, thanks to modern computing power. In the
Figure 26 we can see an example of an agent based simulation with components ranging
from micro- to macro-level. (Borshchev, 2013)
Figure 26. Agent based simulation components and interactions (adapted from Borshchev
and Filippov 2004).
.
The following are the key characteristics of an agent based on Macal and North (2010).
Each agent has unique attributes, thus is identifiable as an individual – creating a
heterogeneous group. Agents can function on their own separately from their
environment. Every agent has a state representing its current actions, behavior. Agents
can modify their behavior – they can learn from their past experiences. Agent has
connections to other agents and they can have their own goals to achieve.
Heath et al. (2011) adds that the behavioral complexity of the agent can range from simple
if-then rules to learning algorithms or mappings of complex stimulus-reaction charts. The
information sensed by the agent, gives it the possibility to alter its behavior and actions.
Even the simplest of rules can result in emergent behavior patterns.
According to Rand and Rust (2011), the design choices that need to made while building
an agent based model are the following. Firstly, scope of the model must be defined –
what components of a complex system will be portrayed in the model. The types of agents
that will exist in the model and their properties must be chosen and described. On top of
that, a description of how each agent behaves on its own and how it can interact with the
environment or other agents should be constructed. Lastly, what are the inputs and outputs
of the model – how the model is initialized and what kind of data is collected.
Areas of use for agent based method by Macal and North (2006):
- Individual and population behavior analysis
- Businesses and organizations
- Society and culture
- Military simulations
- Biology
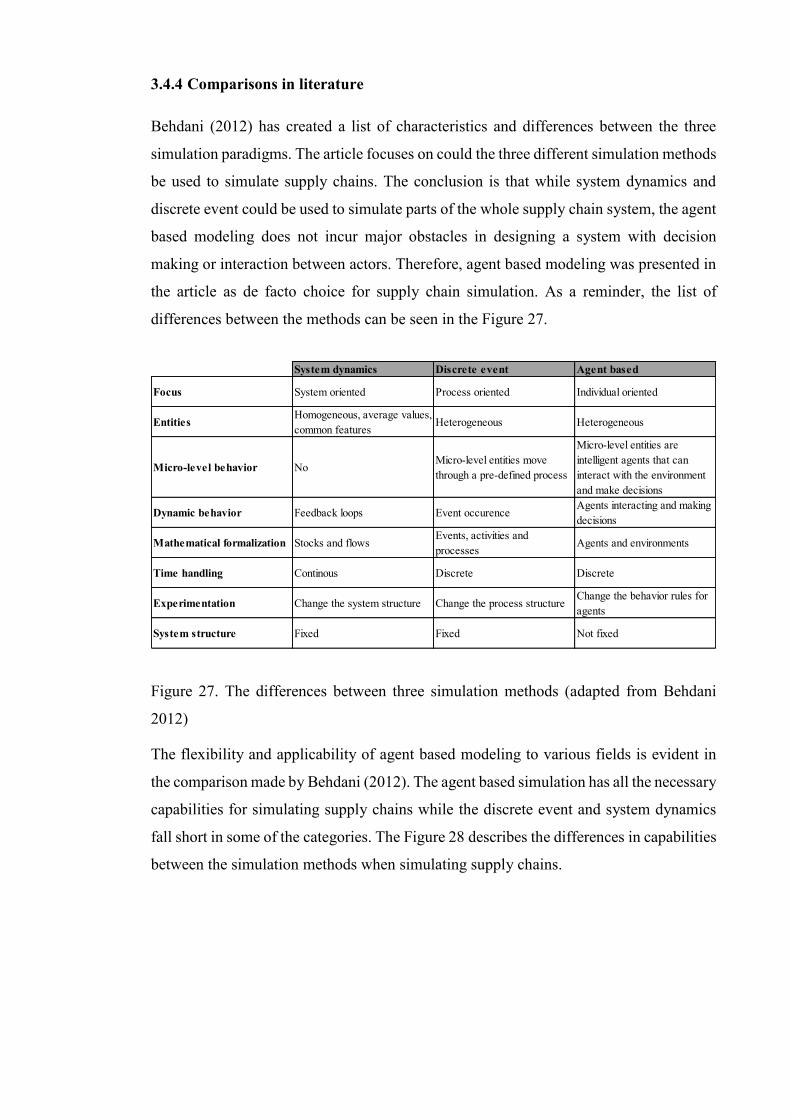
3.4.4 Comparisons in literature
Behdani (2012) has created a list of characteristics and differences between the three
simulation paradigms. The article focuses on could the three different simulation methods
be used to simulate supply chains. The conclusion is that while system dynamics and
discrete event could be used to simulate parts of the whole supply chain system, the agent
based modeling does not incur major obstacles in designing a system with decision
making or interaction between actors. Therefore, agent based modeling was presented in
the article as de facto choice for supply chain simulation. As a reminder, the list of
differences between the methods can be seen in the Figure 27.
Figure 27. The differences between three simulation methods (adapted from Behdani
2012)
The flexibility and applicability of agent based modeling to various fields is evident in
the comparison made by Behdani (2012). The agent based simulation has all the necessary
capabilities for simulating supply chains while the discrete event and system dynamics
fall short in some of the categories. The Figure 28 describes the differences in capabilities
between the simulation methods when simulating supply chains.
System dynamics Discrete event Agent based
Focus System oriented Process oriented Individual oriented
EntitiesHomogeneous, average values,
common featuresHeterogeneous Heterogeneous
Micro-level behavior NoMicro-level entities move
through a pre-defined process
Micro-level entities are
intelligent agents that can
interact with the environment
and make decisions
Dynamic behavior Feedback loops Event occurenceAgents interacting and making
decisions
Mathematical formalization Stocks and flowsEvents, activities and
processesAgents and environments
Time handling Continous Discrete Discrete
Experimentation Change the system structure Change the process structureChange the behavior rules for
agents
System structure Fixed Fixed Not fixed
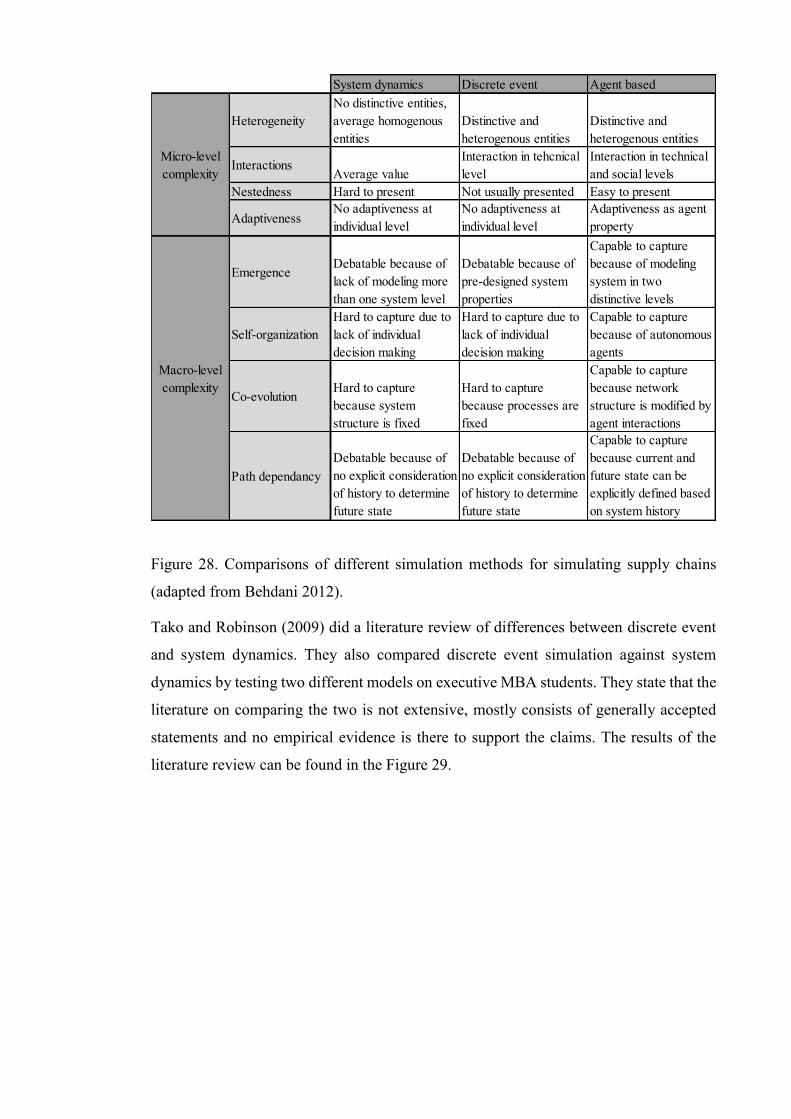
Figure 28. Comparisons of different simulation methods for simulating supply chains
(adapted from Behdani 2012).
Tako and Robinson (2009) did a literature review of differences between discrete event
and system dynamics. They also compared discrete event simulation against system
dynamics by testing two different models on executive MBA students. They state that the
literature on comparing the two is not extensive, mostly consists of generally accepted
statements and no empirical evidence is there to support the claims. The results of the
literature review can be found in the Figure 29.
System dynamics Discrete event Agent based
Heterogeneity
No distinctive entities,
average homogenous
entities
Distinctive and
heterogenous entities
Distinctive and
heterogenous entities
InteractionsAverage value
Interaction in tehcnical
level
Interaction in technical
and social levels
Nestedness Hard to present Not usually presented Easy to present
AdaptivenessNo adaptiveness at
individual level
No adaptiveness at
individual level
Adaptiveness as agent
property
EmergenceDebatable because of
lack of modeling more
than one system level
Debatable because of
pre-designed system
properties
Capable to capture
because of modeling
system in two
distinctive levels
Self-organization
Hard to capture due to
lack of individual
decision making
Hard to capture due to
lack of individual
decision making
Capable to capture
because of autonomous
agents
Co-evolutionHard to capture
because system
structure is fixed
Hard to capture
because processes are
fixed
Capable to capture
because network
structure is modified by
agent interactions
Path dependancy
Debatable because of
no explicit consideration
of history to determine
future state
Debatable because of
no explicit consideration
of history to determine
future state
Capable to capture
because current and
future state can be
explicitly defined based
on system history
Micro-level
complexity
Macro-level
complexity

Figure 29. Comparisons of discrete event and system dynamics found in the literature
(adapted from Tako and Robinson 2009).
Wakeland et al. (2004) compared system dynamics and agent based modeling in the
context of biomedical research, cellular receptor dynamics. They found that developing
with two very different methods was useful and both of the modeling paradigms could be
used for education purposes and to assist research. However, they concluded that system
dynamics could be the better option for research and agent based modeling could be
probably used for education.
Model use Discrete event System dynamics
Model understanding
Understanding The client does not understand the
underlying mechanics
Models (links and flows) are transparent to
the client
Animation Animation and graphic tools help model
understanding
No animation. Visual display of model aids
model understanding
Complexity
Level of detail Emphasis on detail complexity Emphasis on dynamic complexity
Feedback Feedback is not explicit Feedback effects are clear to the client
Model validity
Credibility
Model usefulness
Learning tool DES models are less used as learning tools SD models, so called 'learning
laboratories', enhance the users' learning
Strategic thinking DES models are mostly used in soving
operational/tactical issues
SD models aid strategic thinking
Communication tool
Model results
Nature of results DES provides statistically valid estimates
of system's performance. Results aid
instrumental learning
SD model results provide full picture of the
system. Results aid conceptual learning
Interpretation of results More difficult, requires users to have
statistical background
Ouputs are easily intepreted, little or no
statistical analysis is required
Results observation Randomness/variation of results is explicit Generally deterministic results, which
convey causal relationships between
variables
Both models are perceived as representative, provide realistic outputs and create
confidence in decision-making
Both DES and SD models are seen as good communication tools and facilitate
communication with the client
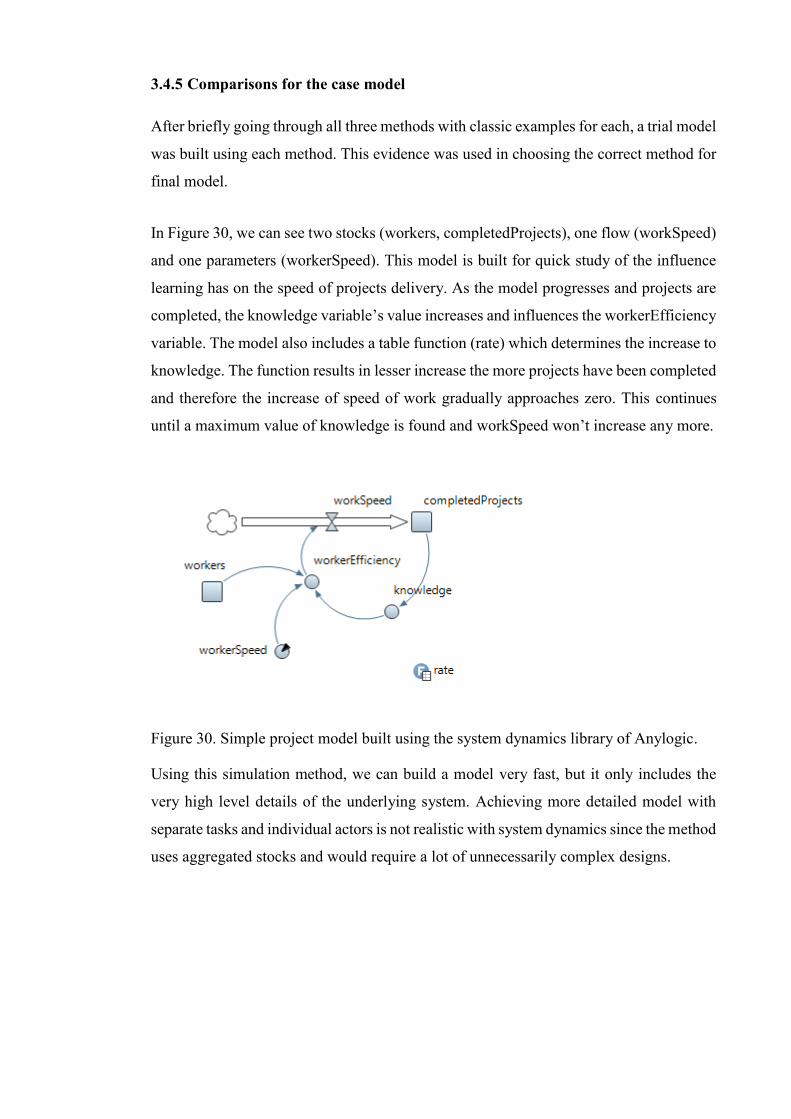
3.4.5 Comparisons for the case model
After briefly going through all three methods with classic examples for each, a trial model
was built using each method. This evidence was used in choosing the correct method for
final model.
In Figure 30, we can see two stocks (workers, completedProjects), one flow (workSpeed)
and one parameters (workerSpeed). This model is built for quick study of the influence
learning has on the speed of projects delivery. As the model progresses and projects are
completed, the knowledge variable’s value increases and influences the workerEfficiency
variable. The model also includes a table function (rate) which determines the increase to
knowledge. The function results in lesser increase the more projects have been completed
and therefore the increase of speed of work gradually approaches zero. This continues
until a maximum value of knowledge is found and workSpeed won’t increase any more.
Figure 30. Simple project model built using the system dynamics library of Anylogic.
Using this simulation method, we can build a model very fast, but it only includes the
very high level details of the underlying system. Achieving more detailed model with
separate tasks and individual actors is not realistic with system dynamics since the method
uses aggregated stocks and would require a lot of unnecessarily complex designs.

Comparing to the system dynamics model, the discrete event method seems far more
suitable tool for this kind of simulation at the first glance. In the Figure 31, we can see a
project task network built using discrete event method.
Figure 31. Project task network created using discrete-event (process) library of
Anylogic.
In contrast to system dynamics version of project simulation, the discrete event method
gives more detailed access to the task network. Using discrete event method, we can
model different tasks as steps or services within a process. We can also assign different
resources (actors) to specific tasks. However, the resources are pooled and no individual
actors can be distinguished, unless using pools of one resource. In true nature of the
method, the durations of tasks can be stochastic, using wide variety of distributions. The
tasks have no further attributes linked directly to them that can be changed and therefore,
can be cumbersome to track and create.
If the aim of this thesis was to provide a model to track the progress in a task network,
the discrete event method would absolutely suffice. However, since the design of the
model requires more control over individual aspects of the model, we have to rely on
agent based modeling.

Using agent based modeling we can achieve more control over individual components
and aspects of the model. Project and task networks created using agent based modeling
can be seen in the Figure 32.
Figure 32. Agent based project network and task network diagrams using built using
Anylogic.
Even though this is not a single view that can be seen in the model, it still varies
significantly from the two previous paradigms. In this modeling style, much greater detail
can be achieved in areas that are deemed significant. Agent based modeling is an excellent
tool for modeling complex networks, with different links between different building

blocks. In this model the tasks in the task network for example have been assigned to
specific actors in the project network. Figure 32 illustrates the different possibilities in
network visualization – actors belonging in the same organization are color coded and the
actors responsible for delivering a specific task are indicated as well. The power of agent
based modeling is in the many possibilities connectivity provides.
In this agent based model, each task is an agent with separate variables that signal various
information about that particular task, i.e. task duration, cost, problems etc. Even though
not shown here, each different project would also be an agent with similar, although not
identical, task network. Same pattern can be seen in organizations (networks), and people.
Every individual actor has its own unique values for variables, different links between
other actors and its own behavioral guidelines.
In light of the previous statement, we can create behavioral guidelines or heuristics for
agents that are required to function during the model without guidance from the modeler.
We can also insert learning patterns or decision-making to agents.
4 SIMULATION MODEL
In order to make some sense of the development process, a brief history is presented in
this chapter. While the goal and structure was already presented in the previous chapter
and the models presented here might differ from the end result, they were crucial learning
lessons for the final model. For those interested only in the final version of the model –
skip directly to chapter 4.4. Additionally, a table of changes made during the development
process can be found in the appendix 1.
The model was developed for European Academy of Management (EURAM) conference
in Paris, France which was held 30.5.-1.6.2016. The model was a part of a seminar about
(project) simulation. The development began on the conference model in January and first
version of the simple model was produced at the end of the month. All models are based
on earlier experimentations and use basic functions from those models for project network
construction and reading initial conditions from an Excel file.
The goal of the project was to build a model that is simple yet it is possible to continue
the work after the basic functionalities have been tested and validated. The core
functionalities include a selected set of mechanisms of project network governance with
the possibility to add more. Additionally, it can visually give important information about
each element, e.g. who has worked on a particular task and how many days, what is the
cost of the task (divided into different categories) and what is the quality.
4.1 Anylogic as a software
Anylogic supports all the most used simulation methods: system dynamics, discrete event
and agent based modeling. It also the only one to support them all with added
functionality of multimethod modeling. Multimethod modeling enables the use of
different paradigms in the same model – e.g. system dynamic models can be accompanied
by agent based modeling tools or any other possible combination. (Anylogic, 2016)
Anylogic is object-oriented by nature and allows modular and incremental building of
complex models. It provides pre-built libraries, objects and tools for various simulation
needs. Java environment supports custom code and external libraries. A thorough set of
different experiment tools is included. Visual development interface is fast and the jump
from other platforms is easy. All of this leads to reduced development cost and duration.
(Anylogic, 2016)
Impressive visuals, controls and navigation can be achieved easily enabling more control
over the model for the user. The software is available on all common operating systems.
Models can be exported to variety of formats, executable across multiple operating
systems without the need of the software itself. Anylogic also provides support and
consulting services. (Anylogic, 2016)
Anylogic was chosen as the platform for the development process due to its capabilities
in agent based and multimethod modeling. No extensive comparisons between different
simulation software was conducted. However, based on the different requirements for
simulation software as defined by Robinson (2004), Anylogic fares well. The speed of
coding is increased as the software already contains many prebuilt modules and the use
of drag-and-drop style creation. Java as a language is a high-level programming language
and therefore understandable with little experience. Flexibility of the coding and
modeling process is high since many of the components can be reused in other models
with little modification. Simulation run speed is dependent on the capabilities of the
system and how optimized the code is. Anylogic provides debugging and optimization
for the commercial version.

4.2 Basic logic and structure of the model
The goal of the development project was to build a model representation of a project
network that consists of multiple actors and project with multiple tasks, possibly
overlapping tasks. Individual actors have inter-organizational relations and those develop
over time. Much like relation between actors deepen as time passes, so does their
knowledge of the skills they are using. Different layers of the model can be seen in the
Figure 33.
Figure 33. The structure of the model. Project network consists of multiple organizations
which themselves consists of multiple actors. Task network contains multiple tasks.
These two sides together form a project.
Basic idea behind the model is a research conducted in Stanford University regarding
Virtual Design Teams (VDT). Based on aforementioned research a software called
POWer was built which in turn was a basis for commercial product, SimVision. POWer
is an agent based simulation tool that handles concurrent projects with a focus on the
project team’s performance. This includes information sharing, exception handling and
work package deliveries. More information on the VDT can be obtained from the papers
of Jin and Levitt (1996).
While the structure in VDT-based POWer is akin to one used in this model, there are
some differences. The point of this model is simulating the project network governance
in the form of multiple mechanisms that influence the decision making. Actors are given
a set of tasks that need to be done, but by simple heuristics they decide which task they

are working on at any given point in time. In POWer the emphasis is on the
communication side. If an actor is overloaded with work, he might not respond to
messages sent to him due to time constraints. Also, in POWer, all actors belong to the
same organization thus eliminating all inter-organizational interaction.
The model built here requires inputs that are read from an Excel file. The file contains
information which is the basis of all the major components in the model. These
components, which in this simulation modeling method are called agents are as follows:
- Main: The main agent is the collective heart of the model. All other agents are
contained inside of it. Main contains also all the functions that are needed in
initializing the model, such as reading the Excel file and constructing all the
necessary components (such as rest of the agents).
- Actor network: The actor network contains all the actors. It can also be called
the project network – a collection of organizations that are tied to the project’s
execution. Individual actors are part of one of many organizations.
- Actor: The model contains multiple actors, each of them have individual set of
skills and relations. These attributes are changed over time and every actor
behaves based on the logic that has been written for them. Actors are the smallest
piece in the puzzle and through their actions and decisions the results of the
simulation emerge.
- Project: In this model, there is only one project, although adding multiple projects
is a possibility. The project agent contains all the related tasks and has a view of
the activity network diagram (tasks can be accessed through this diagram during
runtime).
- Task: Tasks are part of the project. The task network consists of different
relations; some tasks require previous task to be complete while others are
executed simultaneously. On top of the start-end relations, tasks have varying
quality links between them – the quality of one task can influence the quality of
several tasks and vice versa.

4.2.1 Simulation process
The simulation process starts with reading of the Excel file and optionally changing
settings through a screen before the simulation begins. Right at the beginning of the
simulation, a group of functions are called to construct all agents based on the Excel file
values. A critical path is defined and all remaining relations for tasks and actors are
created as well. After initial steps have been taken care of, a cycle of actions begins that
pushes the project forward. The cycle can be seen in the Figure 34.
Figure 34. The basic flow of the model. Information is exchanged between actors and
tasks.
Every morning at 7am all of the tasks send out a call that they are ready to be worked on.
In a case that the preconditions are not met, e.g. previous tasks are not completed, the task
is ignored for the time being. However, if the task can be started, the actors that are
associated with the task will calculate a value for it. The calculated value is a combination
of parameters e.g. “is the task on critical path?” or “is the task late?”. This value will be
then compared against other tasks in the task list and the task with the highest value will
be chosen. More simple heuristics could be implemented here, e.g. the task could be
chosen randomly or based on some assumption.
Work is conducted in packets of one hour, eight hours per day. The default amount of
work that can be completed in that time window is one hour. However, the amount of
work completed can increase or decrease based on the current skill the actor has. The
learning effect can be observed in those actors who have been working and working with
another actor with greater skill will increase the speed of learning. Working on a task with
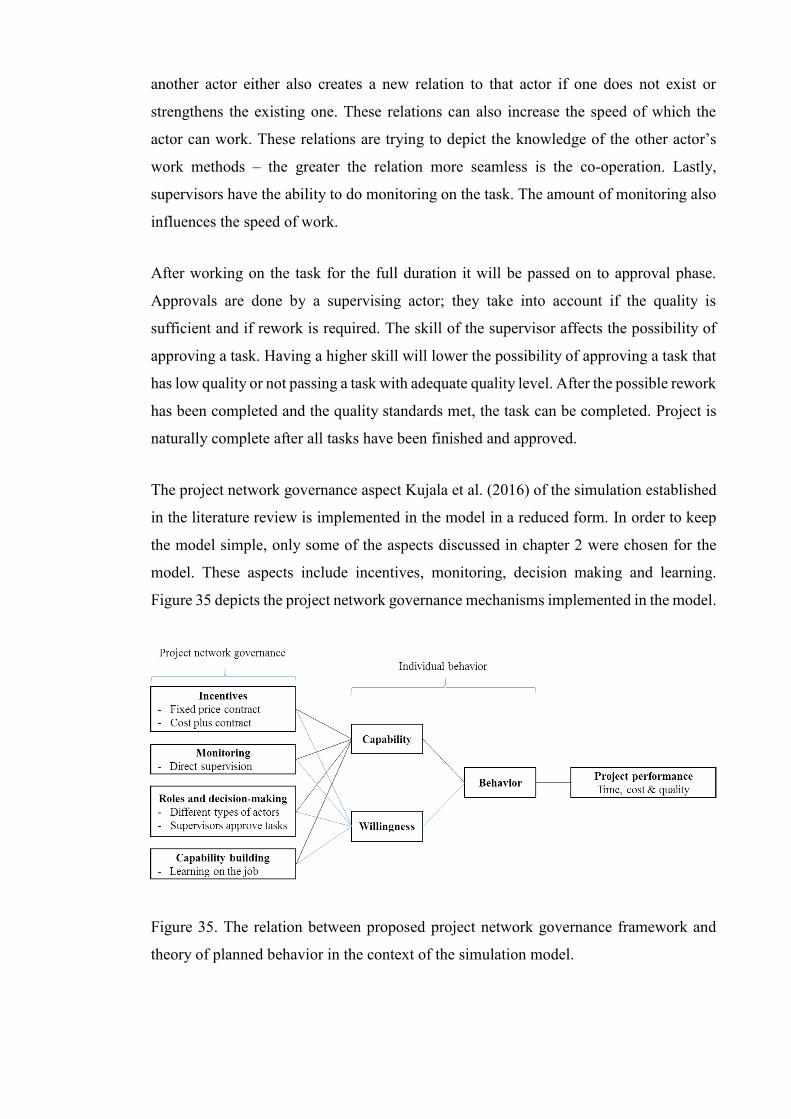
another actor either also creates a new relation to that actor if one does not exist or
strengthens the existing one. These relations can also increase the speed of which the
actor can work. These relations are trying to depict the knowledge of the other actor’s
work methods – the greater the relation more seamless is the co-operation. Lastly,
supervisors have the ability to do monitoring on the task. The amount of monitoring also
influences the speed of work.
After working on the task for the full duration it will be passed on to approval phase.
Approvals are done by a supervising actor; they take into account if the quality is
sufficient and if rework is required. The skill of the supervisor affects the possibility of
approving a task. Having a higher skill will lower the possibility of approving a task that
has low quality or not passing a task with adequate quality level. After the possible rework
has been completed and the quality standards met, the task can be completed. Project is
naturally complete after all tasks have been finished and approved.
The project network governance aspect Kujala et al. (2016) of the simulation established
in the literature review is implemented in the model in a reduced form. In order to keep
the model simple, only some of the aspects discussed in chapter 2 were chosen for the
model. These aspects include incentives, monitoring, decision making and learning.
Figure 35 depicts the project network governance mechanisms implemented in the model.
Figure 35. The relation between proposed project network governance framework and
theory of planned behavior in the context of the simulation model.

Contracts are implemented in the model as two different types. Fixed price contracts only
cover the cost of work scheduled originally. Fixed price contracts also contain penalties
for failing to deliver tasks on schedule (fixed price contracts are highly valued tasks for
actors since failing to complete them on time incurs penalties). Cost plus contracts cover
all cost of work conducted. Cost plus contracts do not contain penalties.
Monitoring influences the speed and quality of work as well as the amount of rework
required. This tries to imitate the presence of a supervisor – employees try to do their best
and work more efficiently under the scrutiny of a person in charge. In turn, monitoring
creates additional work for the supervisors, time which they could potentially spend
elsewhere.
Different work types can only be completed by different types of actors. Roles assigned
to actors dictate the work they will be doing – supervisors monitor and approve done work
and workers do all the heavy lifting. Decision making is implemented in the model in a
sense that the tasks that employees work on are chosen by the actors themselves.
Additionally, the approval of tasks (checking of adequate level of quality and completion
of all work) is also conducted by the actors. The amount of information available can be
varied, resulting in different results. Learning occurs by doing work suitable for the actor
and other actors working on the same task increase the speed of learning. Learning is
further increased by teaching which occurs if a skilled worker is doing the same task with
a not-so-skilled worker.

4.3 Development process
The development process loosely followed the flow chart of Banks et al. (2010) for
simulation study – only component that was left out was validation. Validation was left
out due to absence of any real-world data, although the possibility of later validating
remains through calibration. In January, the general aim for the project was laid out and
the targeted deadline for the model was May, before the conference in Paris. Some parts
of the model had already been completed during the fall in preliminary studies. These
parts included the initialization of the model i.e. the creation of project, tasks, network,
and actors.
The team mainly consisted of two persons, professor Jaakko Kujala and yours truly. The
principal role of professor Kujala was to act as a source of guidance for the theoretical
background and understanding behind the project network governance aspect. Principal
roles for yours truly were programming the simulation model and producing
documentation. Samuli Kortelainen from SimAnalytics provided guidance in Anylogic
related questions at the beginning of the project. Additional personnel on the project were
Kirsi Aaltonen, Osmo Kauppila and Teemu Lappi. Kirsi provided additional insight to
project network governance, Osmo was helpful with mathematical side of uncertainties
and distributions, and Teemu contributed to project network practicalities such as value
distribution.
During the development, approximately two meetings per week were organized, with
additional information sharing through email. The meetings were either face to face or
through Skype. Both approaches worked similarly since Skype contains a feature for
screen sharing thus enabling the both sides of the call to see the model in real time. The
meetings usually lasted from one hour to three hours, depending on the number of topics
and new changes at hand. The meetings consisted of a brief report of new changes made
to the model, elaborations on the changes and finally plans for possible new changes for
the next meeting.
The design of the model, conceptualization, was done by discussing and reaching a
consensus. A theoretical foundation was applied to the model and an image of the
resulting implementation was usually described through visual aids, drawings or mind
maps. Programming side of the model was left to the responsibility of the programmer,

although some alterations were done based on the discussions. The ODD protocol detailed
in Grimm et al. (2010), was used in the beginning the describe the model, its components
and functionalities. However, as the project progressed, updating the document was left
on hold since the changes to the model were in such small increments that it was decided
to update the document once the model was finished. Nevertheless, the initial work
invested in the document proved to be valuable later in communicating the details of any
particular component of the model.
Aside the general progress report meetings, at least once a month a thorough inspection
of the model as a whole was carried out. This inspection included a look at the
programming layer of the model as each component (agents, functions, statecharts) were
checked in case of errors in either programming implementation or misunderstandings in
conceptualization. This was helpful for both the programmer and designer; a further
insight was gained through discussion and new ideas were conceived as well. As stated
in the literature (e.g. Robinson (2004)), an iterative approach to software development
with early reviews helps rooting out problems that could be hard and time consuming to
fix later.
The defining philosophy in the development was to create a simple model in every phase
and then continue to build more or refine older components. This resulted in a very
iterative process where building blocks were added to each agent constantly during the
development. At the same time, some of the older designs were removed or modified
during the process to be replaced by more elegant design, either for increased
performance or re-imagined purpose.
It is notable that although Skype-meetings always brought the project forward, the face
to face meetings provided better framework for thoroughly understand what different
team members were trying to convey with their ideas. Skype-meetings served their
purpose as a fast way of going through different changes made to the model. Most
advances in the design were made during face to face meetings.

4.4 Final version of the model
The final version of the model was completed in May before the conference and presented
there for an audience of 25. The graphical representation and the functional side of the
model are discussed in this chapter. Additionally, a snippet of pseudocode about how
work is being added as a task progresses can be seen in the appendix 2. All table functions
(i.e. learning curves, increases in relations) applied during the execution of the model are
described in the appendix 3.
4.4.1 Functional elements
The final version of the model consists of five important agents: Main, ActorNetwork,
Actor, Project and Task. Most of the attributes and structures inside those agents are
created using an Excel-file. The simulation starts by creating necessary networks – i.e.
project network, task network, actor connections, skills etc. This is simply done by calling
the following functions on startup (see appendix 5 for further details):
readActorNetworks();
readProjects();
readTasks();
createTaskLinks();
defineCriticalChain();
createRelations();
readSkills();
Once every element has been created and is fully operational the Main-agent fires up an
event called createWork(), an event that is going to be fired up every morning at 7am
until the simulation finishes. This event sends work through each task that is ready to start
to the project’s contractor, who in turn delegates the work to his subordinates and possible
subcontractors. This chain of delegating continues until the work has reached the actors
who are assigned to do the job. At the same time, when a particular task is ready to begin,
a meeting will be created. This meeting could represent all kinds of different meetings,
however, in this case the meeting serves only as a display of functionality. Meetings could
be generated as an answer to a problem or they could be general weekly meetings. In this
model meetings only result in greater improvement in actor relationships of those actors
who attend the meeting.

The actions related to actors and tasks are closely related to one another. After the task is
ready to start it changes its state to inProgress which means that as long as the task still
has work to be done it remains in that state. Work is being sent to corresponding actors
and if they have any work in their inbox, they will begin the evaluation process. A
function called prio() is used to evaluate the value of each task in currently in the actor’s
inbox. Later a function choose() is called to pick up the task (or meeting) that has the
greatest value. This work package is then processed for one hour. The amount of work
that is completed during that one-hour period defaults to one hour, but can be less or more
depending on various factors.
The factors that can influence the amount of work completed are as follows: learning,
monitoring, relations, and skill. All curves created for the model can be adjusted to match
the requirements the user wants to have in any particular setting. The current curves can
be observed in appendix 3.
- Learning: Learning happens after each work package. Learning can be also
affected by a presence of a more skilled actor, who will teach as the work
progresses. Learning curve created for this model is an approximation of other
learning curves described in Anzanello and Fogliatto (2011).
- Monitoring: Monitoring amount by default is the same amount as the task’s
duration multiplied by a factor k which is between 0 and 1 (defined in the
initialization parameters). This way the amount of monitoring is related to the
duration of a task, but the overall level of monitoring can still be changed.
Monitoring affects the speed of work based on how much monitoring has been
done in comparison to work completed at the time of inspection.
- Relations: Relations increase or decrease the speed of work. This is done in order
to simulate the work habits of each individual – if one is familiar to the work
habits of someone else, working becomes more fluid and vice versa.
- Skill: Skills can affect the speed of work in a positive or negative way. A
difference in skill is calculated and the difference is used either as an increase or
decrease in the speed.
The factors that can influence the quality of work are as follows: skill and quality links.

- Skill: The default quality for each task is 100. The quality is influenced by the
work of an actor with each work package. The quality of completed work is added
to the overall quality of the task and a mean is calculated.
- Quality links: Quality links can be set up between any consequent tasks. If two
tasks have a quality link between them, the quality of a later task cannot reach any
higher than the mean between two linked tasks.
The factors that influence the duration of work are as follows: uncertainty, exceptions,
approvals, rework.
- Uncertainty: Uncertainty in duration is calculated for each task using a PERT
distribution (closely resembles a beta distribution). It uses a minimum, maximum
and most likely duration as inputs.
- Exceptions: Exceptions can occur during the state where standard work is being
done. They cannot happen during any other state. Exceptions halt the task and no
further work can be completed until the problem is solved. The problems are sent
to the superior of the actor working on the task and once a solution has been found,
work can be continued. The default time for solving the exception is two hours.
- Approvals: Approval is done by appropriate supervisor and will be delegated
upwards in the chain of superiors until the project’s owner has approved the task.
If a task fails to reach the required quality level, it will create work to address the
problem. The approval process also has a randomness element tied to the prowess
of the person doing the approving. The higher the skill the more accurate is the
perceived quality. This can lead to either unnecessary rework or passing a low-
quality task forward, depending on the skill level.
- Rework: Rework has a chance to be created after each work package. The amount
of rework generated is based on the amount of monitoring done and the difficulty
of the task versus the skill of a worker. Generated rework also lowers the attained
quality level of the task by a fraction of the amount of rework created.
The simplified flow of what happens during the calculations of different influences can
be found in the appendix 2.

The statecharts of Task-agent and Actor-agent can be seen in Figures 36 and 37
respectively.
Figure 36. The statechart of Task-agent.
The general flow of a task can be seen from the statechart. Some of the transitions between
states are triggered by a condition (arrow with a question mark icon) and some are
triggered by a particular message (arrow with a mail icon). After the exception state has
ended, it uses a history state to return to a state the was before the exception happened.

Figure 37. The statechart of Actor-agent.
In the actor’s statechart we can see same elements as in the task statechart with an
additional branch (signified by a diamond shape). This statechart works as follows: the
actor is offDuty between 4pm - 8am, transitions to idle during office hours, checks if there
is work to be done and branches between the options of 1. there is work to be done and
2. there is no work to be done. The wait and wait1 states are simple there for the design
to work, it eliminates some of the possible infinite loops (which might be more easily
eliminated by other means which are unknown to the modeler at this point).

4.4.2 Graphical interface
Each view in the simulation is equipped with navigation buttons to ease traversal between
different views and all elements will update in real time. In the Figure 38 we can see a
screen from the simulation initialization step which has the options to turn different
parameters on or off depending on which attributes are being tested.
Figure 38. View of the different parameters and the corresponding descriptions. Visible
at the start of the simulation.
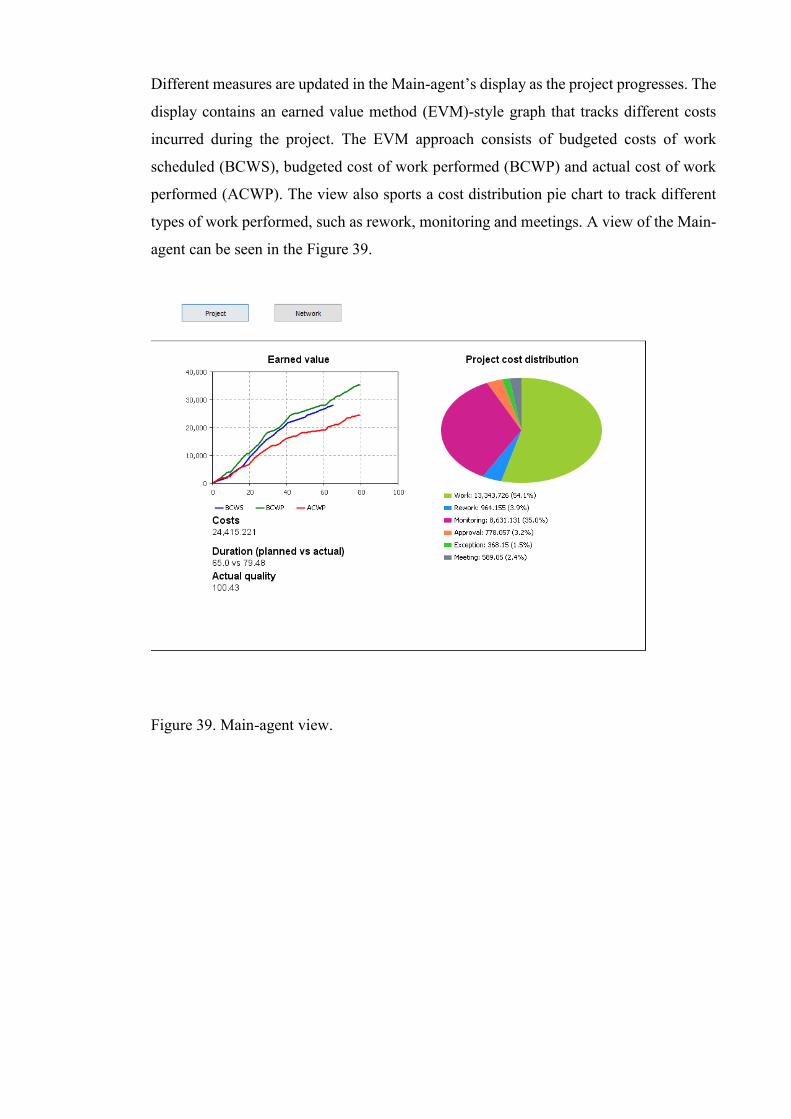
Different measures are updated in the Main-agent’s display as the project progresses. The
display contains an earned value method (EVM)-style graph that tracks different costs
incurred during the project. The EVM approach consists of budgeted costs of work
scheduled (BCWS), budgeted cost of work performed (BCWP) and actual cost of work
performed (ACWP). The view also sports a cost distribution pie chart to track different
types of work performed, such as rework, monitoring and meetings. A view of the Main-
agent can be seen in the Figure 39.
Figure 39. Main-agent view.
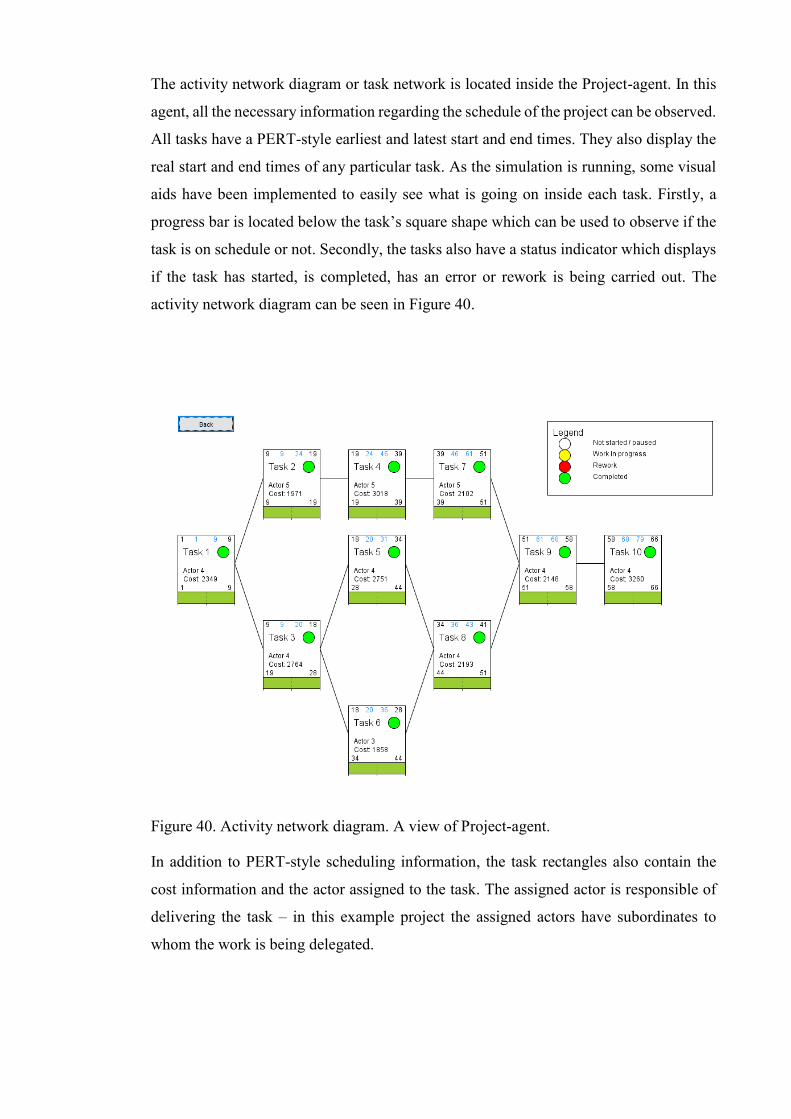
The activity network diagram or task network is located inside the Project-agent. In this
agent, all the necessary information regarding the schedule of the project can be observed.
All tasks have a PERT-style earliest and latest start and end times. They also display the
real start and end times of any particular task. As the simulation is running, some visual
aids have been implemented to easily see what is going on inside each task. Firstly, a
progress bar is located below the task’s square shape which can be used to observe if the
task is on schedule or not. Secondly, the tasks also have a status indicator which displays
if the task has started, is completed, has an error or rework is being carried out. The
activity network diagram can be seen in Figure 40.
Figure 40. Activity network diagram. A view of Project-agent.
In addition to PERT-style scheduling information, the task rectangles also contain the
cost information and the actor assigned to the task. The assigned actor is responsible of
delivering the task – in this example project the assigned actors have subordinates to
whom the work is being delegated.
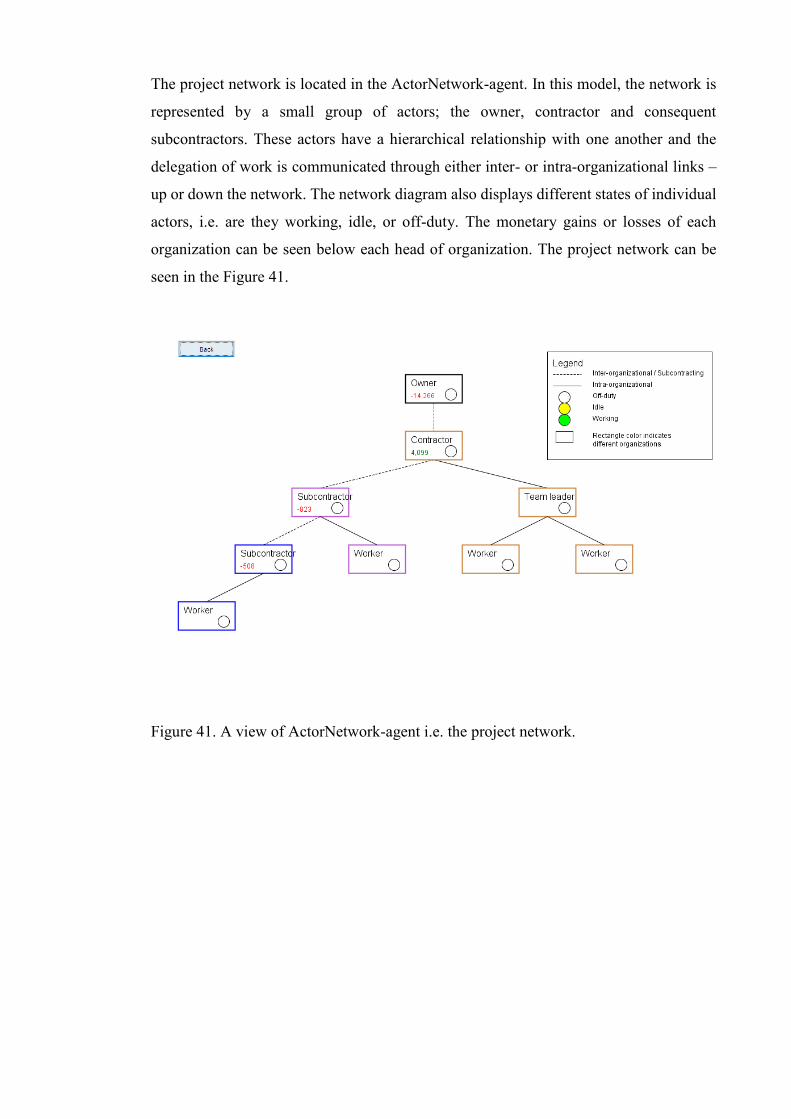
The project network is located in the ActorNetwork-agent. In this model, the network is
represented by a small group of actors; the owner, contractor and consequent
subcontractors. These actors have a hierarchical relationship with one another and the
delegation of work is communicated through either inter- or intra-organizational links –
up or down the network. The network diagram also displays different states of individual
actors, i.e. are they working, idle, or off-duty. The monetary gains or losses of each
organization can be seen below each head of organization. The project network can be
seen in the Figure 41.
Figure 41. A view of ActorNetwork-agent i.e. the project network.
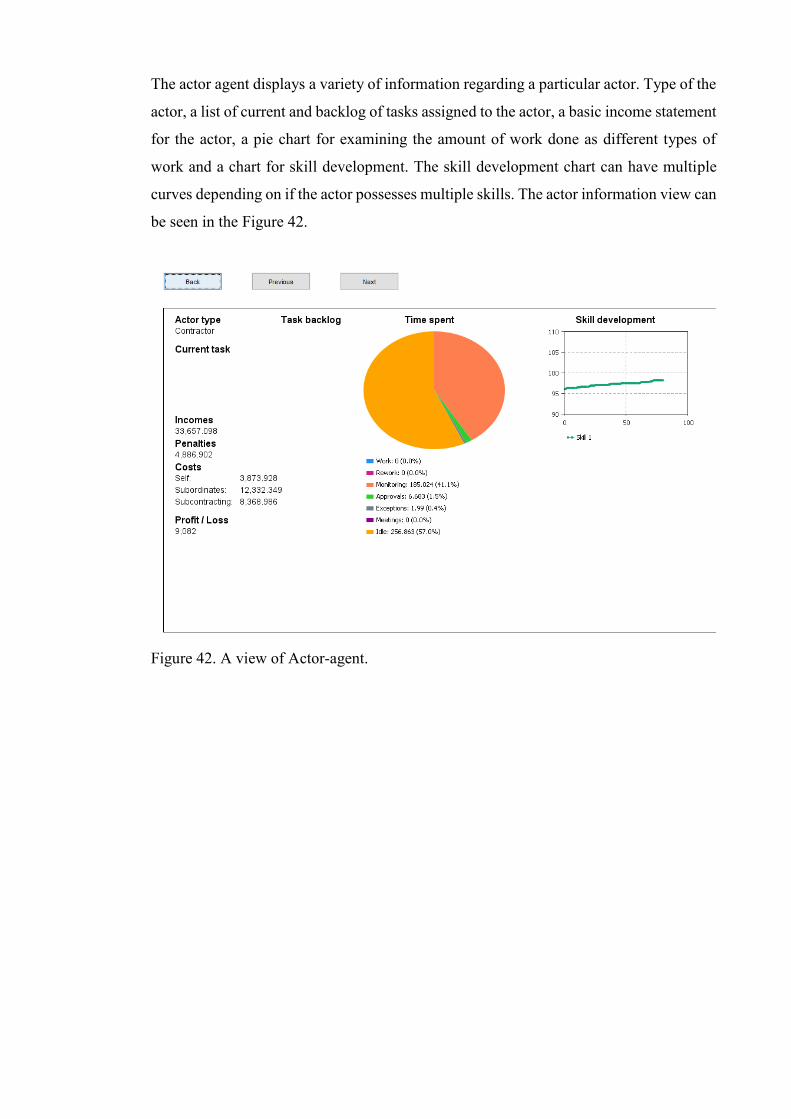
The actor agent displays a variety of information regarding a particular actor. Type of the
actor, a list of current and backlog of tasks assigned to the actor, a basic income statement
for the actor, a pie chart for examining the amount of work done as different types of
work and a chart for skill development. The skill development chart can have multiple
curves depending on if the actor possesses multiple skills. The actor information view can
be seen in the Figure 42.
Figure 42. A view of Actor-agent.

Task agent’s view provides information about general planning and scheduling, as well
as listings of what has been done, by who and what amount. The most important values
here are duration, the contract type, required skill, difficulty and worker limit. These
values will influence the outcome of any particular task. Different metrics can also be
inspected here in real time such as costs and penalties, work done by type and quality.
The actor view can be seen in the Figure 43.
Figure 43. A view of Task-agent.

4.5 Verification
The model presented in this thesis will only be verified and validation will be left to be
conducted later in the future once applicable empiric case study is found. The verification
process is done by testing only two separate functionalities of the model. Firstly, the
underlying basic mechanisms of activity task network is tested against the PERT
framework. Secondly, the learning effect is tested graphically. Other functionalities were
left out to keep the scope of the work in check.
4.5.1 PERT and uncertainty
The estimated project duration was calculated in Excel using the same input as the model
for durations of each task. PERT was used in calculations with addition of number of
workers per task – increasing the number of workers on a task reduces the time required.
Same results can be achieved using the simulation model, albeit with few modified lines
of code (since the model does not use the three-point-estimate, but rather a PERT
distribution). Table 7 shows project starting at day one and lasts until day 68, rounded up.
Table 6. Calculating the estimated project duration in Excel using PERT.
The project duration is calculated using the three-point-estimate. E.g. the expected
duration and standard deviation for the first task is:
𝐸𝑥𝑝𝑒𝑐𝑡𝑒𝑑 𝑑𝑢𝑟𝑎𝑡𝑖𝑜𝑛 (𝑒𝑡) = 𝑡𝑚𝑖𝑛 + 4𝑡𝑜𝑝𝑡 + 𝑡𝑚𝑎𝑥
6=
142 + 4
162 +
202
6=
49
6= 8,166 …
𝑆𝑡𝑎𝑛𝑑𝑎𝑟𝑑 𝑑𝑒𝑣𝑖𝑎𝑡𝑖𝑜𝑛 (𝜎𝑒𝑡) =𝑡𝑚𝑎𝑥 − 𝑡𝑚𝑖𝑛
6=
202 −
142
6=
1
2
Task Previous Critical Minimum Optimal Maximum Workers Expected time Standard deviation Square
1 - Yes 14 16 20 2 8,17 0,50 0,25
2 1 Yes 8 10 14 1 10,33 0,50 0,25
3 1 16 18 22 2 9,17 0,50 0,25
4 2 Yes 18 20 24 1 20,33 0,50 0,25
5 3 14 16 20 1 16,33 0,50 0,25
6 3 8 10 14 1 10,33 0,50 0,25
7 4 Yes 10 12 16 1 12,33 0,50 0,25
8 5,6 12 14 18 2 7,17 0,50 0,25
9 7,8 Yes 12 14 18 2 7,17 0,50 0,25
10 9 Yes 14 16 20 2 8,17 0,50 0,25
Total 67,50 Standard deviation 1,22
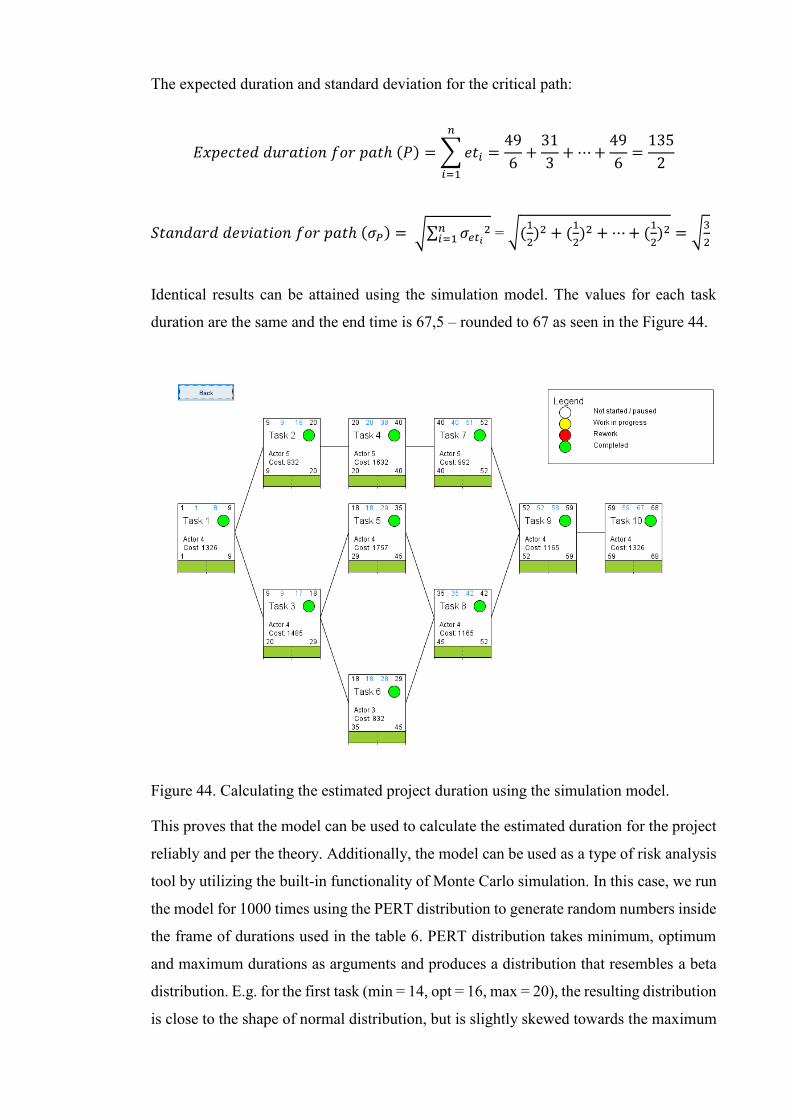
The expected duration and standard deviation for the critical path:
𝐸𝑥𝑝𝑒𝑐𝑡𝑒𝑑 𝑑𝑢𝑟𝑎𝑡𝑖𝑜𝑛 𝑓𝑜𝑟 𝑝𝑎𝑡ℎ (𝑃) = ∑ 𝑒𝑡𝑖
𝑛
𝑖=1
=49
6+
31
3+ ⋯ +
49
6=
135
2
𝑆𝑡𝑎𝑛𝑑𝑎𝑟𝑑 𝑑𝑒𝑣𝑖𝑎𝑡𝑖𝑜𝑛 𝑓𝑜𝑟 𝑝𝑎𝑡ℎ (𝜎𝑃) = √∑ 𝜎𝑒𝑡𝑖2𝑛
𝑖=1 = √(1
2)2 + (
1
2)2 + ⋯ + (
1
2)2 = √
3
2
Identical results can be attained using the simulation model. The values for each task
duration are the same and the end time is 67,5 – rounded to 67 as seen in the Figure 44.
Figure 44. Calculating the estimated project duration using the simulation model.
This proves that the model can be used to calculate the estimated duration for the project
reliably and per the theory. Additionally, the model can be used as a type of risk analysis
tool by utilizing the built-in functionality of Monte Carlo simulation. In this case, we run
the model for 1000 times using the PERT distribution to generate random numbers inside
the frame of durations used in the table 6. PERT distribution takes minimum, optimum
and maximum durations as arguments and produces a distribution that resembles a beta
distribution. E.g. for the first task (min = 14, opt = 16, max = 20), the resulting distribution
is close to the shape of normal distribution, but is slightly skewed towards the maximum
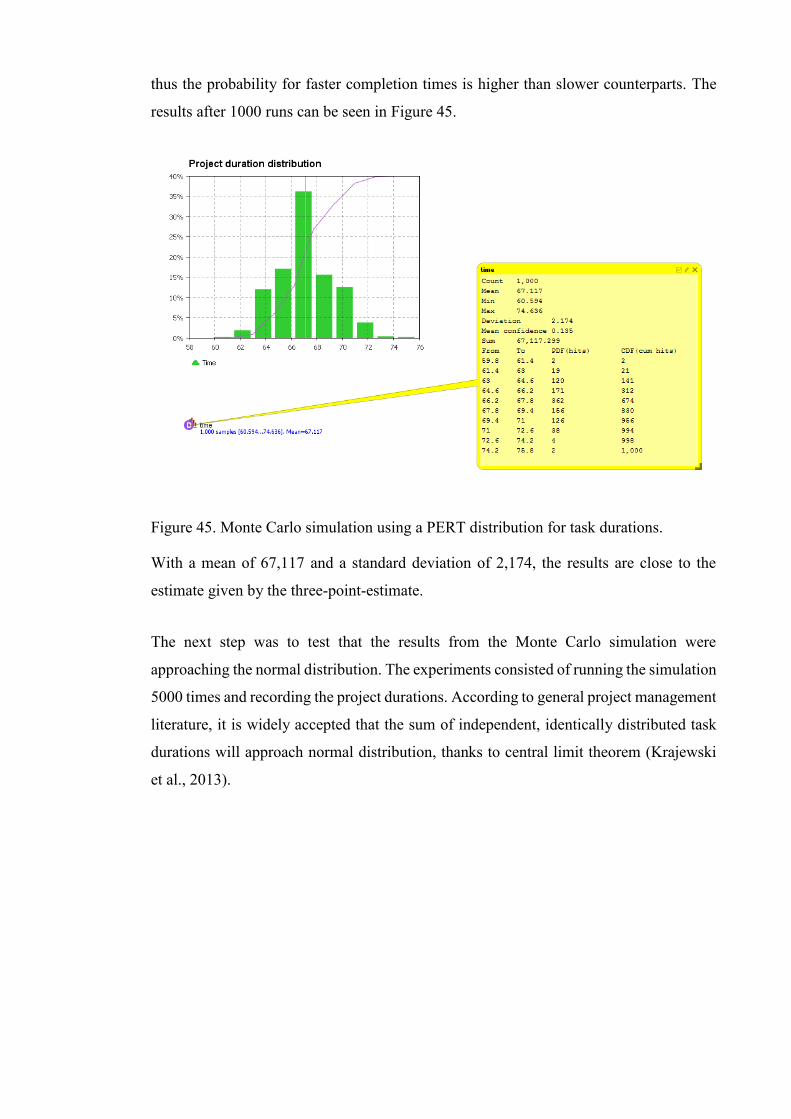
thus the probability for faster completion times is higher than slower counterparts. The
results after 1000 runs can be seen in Figure 45.
Figure 45. Monte Carlo simulation using a PERT distribution for task durations.
With a mean of 67,117 and a standard deviation of 2,174, the results are close to the
estimate given by the three-point-estimate.
The next step was to test that the results from the Monte Carlo simulation were
approaching the normal distribution. The experiments consisted of running the simulation
5000 times and recording the project durations. According to general project management
literature, it is widely accepted that the sum of independent, identically distributed task
durations will approach normal distribution, thanks to central limit theorem (Krajewski
et al., 2013).
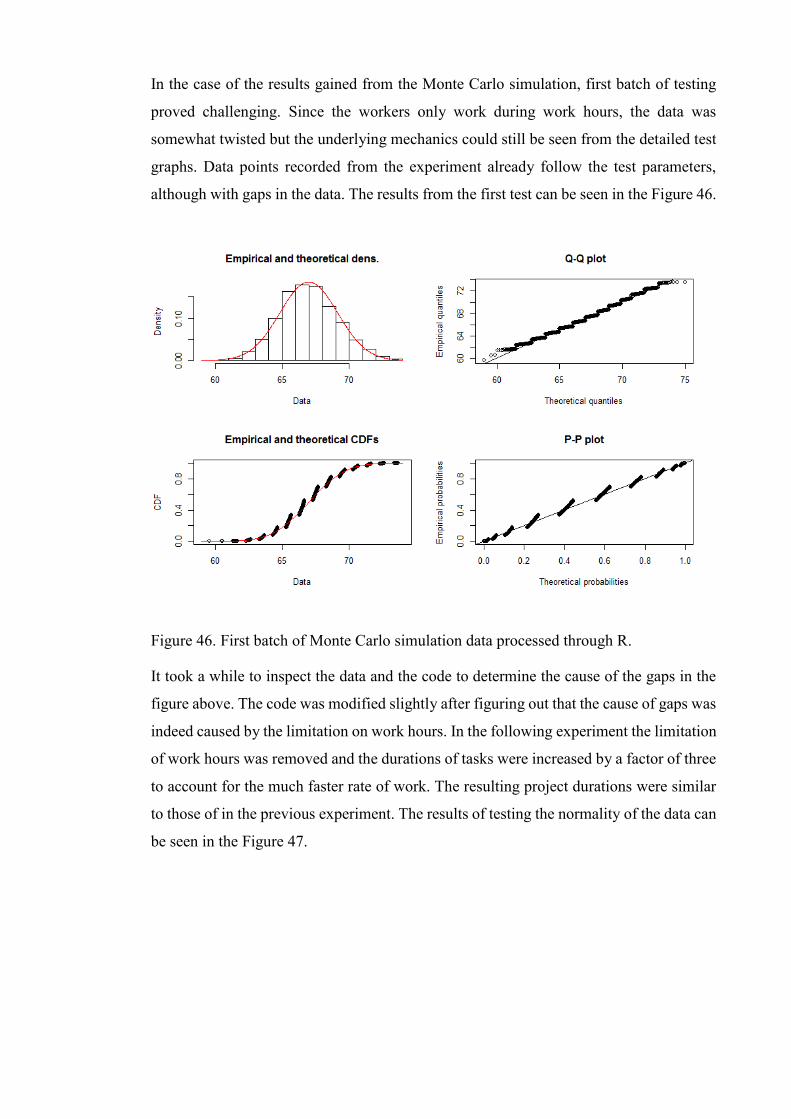
In the case of the results gained from the Monte Carlo simulation, first batch of testing
proved challenging. Since the workers only work during work hours, the data was
somewhat twisted but the underlying mechanics could still be seen from the detailed test
graphs. Data points recorded from the experiment already follow the test parameters,
although with gaps in the data. The results from the first test can be seen in the Figure 46.
Figure 46. First batch of Monte Carlo simulation data processed through R.
It took a while to inspect the data and the code to determine the cause of the gaps in the
figure above. The code was modified slightly after figuring out that the cause of gaps was
indeed caused by the limitation on work hours. In the following experiment the limitation
of work hours was removed and the durations of tasks were increased by a factor of three
to account for the much faster rate of work. The resulting project durations were similar
to those of in the previous experiment. The results of testing the normality of the data can
be seen in the Figure 47.
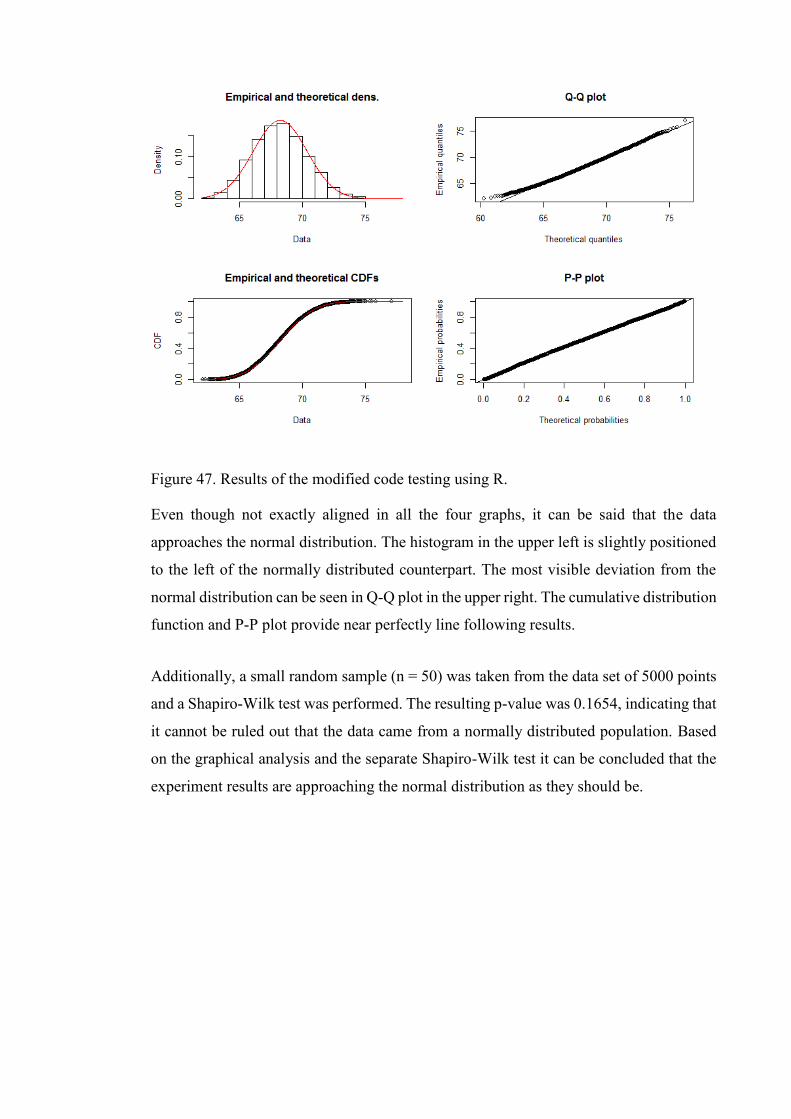
Figure 47. Results of the modified code testing using R.
Even though not exactly aligned in all the four graphs, it can be said that the data
approaches the normal distribution. The histogram in the upper left is slightly positioned
to the left of the normally distributed counterpart. The most visible deviation from the
normal distribution can be seen in Q-Q plot in the upper right. The cumulative distribution
function and P-P plot provide near perfectly line following results.
Additionally, a small random sample (n = 50) was taken from the data set of 5000 points
and a Shapiro-Wilk test was performed. The resulting p-value was 0.1654, indicating that
it cannot be ruled out that the data came from a normally distributed population. Based
on the graphical analysis and the separate Shapiro-Wilk test it can be concluded that the
experiment results are approaching the normal distribution as they should be.

4.5.2 Learning aspect
The learning aspect of the model was tested by turning off all other options except
learning itself, skills affecting the speed and skills affecting the quality. Additionally, a
hypothetical project of 500 identical consecutive tasks were created with no concurrency.
The testing was conducted by two separate sets of experiments. In the first one there was
only one worker with varying level of skill and task difficulty. The second set added a
second worker with a varying skill while keeping the first worker’s skill level at zero. All
of the Excel charts are presented in the same format to enhance the comparability between
them. On the left hand side of the chart is the quality and skill level, right hand side
presents the duration of individual task and the horizontal axis is the whole duration of
the project.
At a fast glimpse, it can be easily concluded that the two worker composition results in
faster overall project completion times. The task duration curve is erratic because the
workers only work during office hours and this leads to tasks lasting over partial days.
The learning curve and skill to speed chart can be found in the appendix 3. Figures 48
and 49 contains the data from runs with single worker.
Figure 48. Learning effect with single worker at normal difficulty.
The learning effect on skill is identical to the quality since the only that affects the quality
is the skill of the worker. The quality follows the curve of the worker’s skill since there
is only one worker.

Figure 49. Learning effect with single worker at very high difficulty.
Task durations decrease as the skill level rises – initially they decrease faster and level
out as diminishing returns kick in. The quality and skill levels are approaching one
hundred, but the length of the time window is more than 1,5 times longer than with two
workers. Figures 50 and 51 contain data from runs with two workers.
Figure 50. Learning effect with two workers at normal difficulty.
The quality is a mean value of the skill of two workers. The execution of the whole set is
much faster than that of the set with only one worker. The fact that two workers are
working on each task leads to lower skill rating since there is less work to be done.
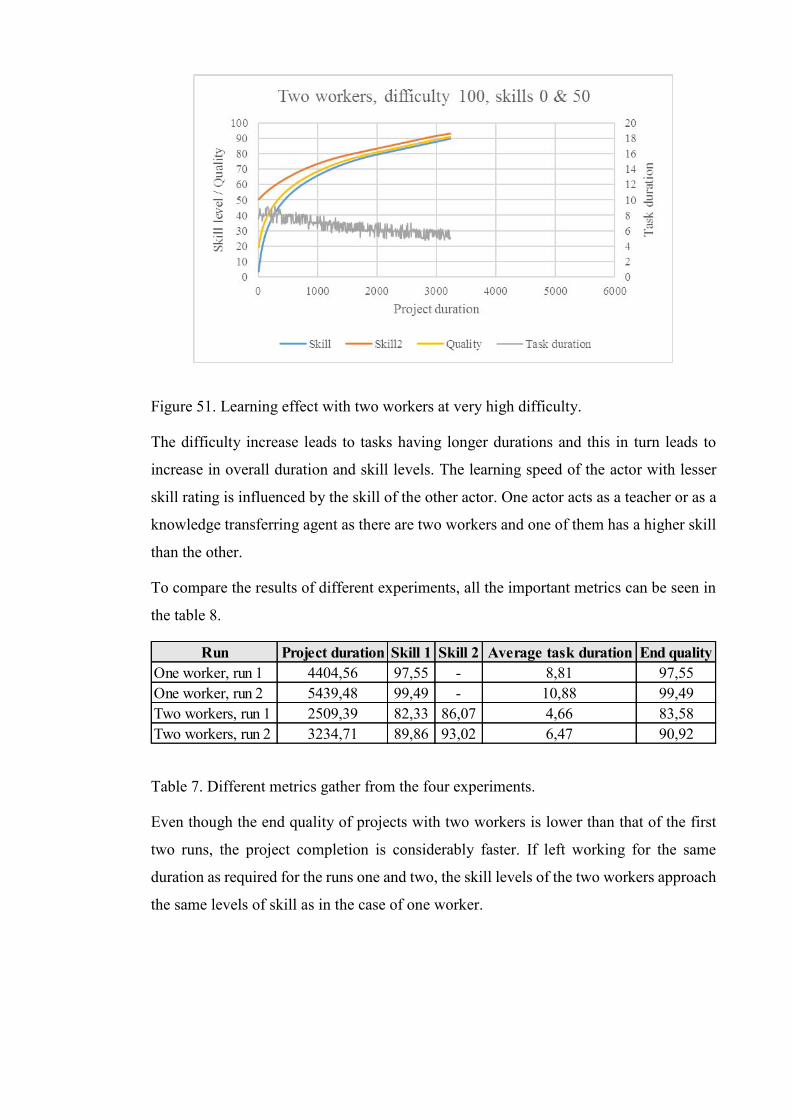
Figure 51. Learning effect with two workers at very high difficulty.
The difficulty increase leads to tasks having longer durations and this in turn leads to
increase in overall duration and skill levels. The learning speed of the actor with lesser
skill rating is influenced by the skill of the other actor. One actor acts as a teacher or as a
knowledge transferring agent as there are two workers and one of them has a higher skill
than the other.
To compare the results of different experiments, all the important metrics can be seen in
the table 8.
Table 7. Different metrics gather from the four experiments.
Even though the end quality of projects with two workers is lower than that of the first
two runs, the project completion is considerably faster. If left working for the same
duration as required for the runs one and two, the skill levels of the two workers approach
the same levels of skill as in the case of one worker.
Run Project duration Skill 1 Skill 2 Average task duration End qualityOne worker, run 1 4404,56 97,55 - 8,81 97,55One worker, run 2 5439,48 99,49 - 10,88 99,49Two workers, run 1 2509,39 82,33 86,07 4,66 83,58Two workers, run 2 3234,71 89,86 93,02 6,47 90,92

4.6 Summary
The process for creating the model was for the most part non-formal, although it followed
a structured format described in the literature. Graphical interface built for the model
presented enough information to make conclusions about what is happening in the model
during any particular run. The basic functionalities of the model were working as intended
based on the two experiments conducted. The agent based modeling approach was used
to construct a basic model with a small number of features – with the option for later
inclusion of more complex phenomena and features.
The agent based modeling paradigm was used here over the other possible paradigms
because it enabled the modeling of individual actors and tasks without imposing any
limitations on what these elements can do. It also provided the most straightforward way
of building the model, since new concepts were easily modified to fit the agent based
world. The other paradigms either required too much simplification or overcomplicating
the design.

5 DISCUSSION
According to Artto et al. (2006) a project can be defined through three different point of
views – two of those, project as a temporary organization and as a work structure, are
used prominently in this thesis. Different links between actors and between tasks are the
basis for the model to function properly. The cornerstones of project performance as
described by Lester (2014), time, cost and quality, also have their place in the model
created for this thesis. The manipulation of their value and the sources of manipulation
can be modified or added later, which brings increasing value for the simulation model
for future use. Even with all project network governance options turned off, the model
can be used as a teaching tool for various topics such as calculating critical path or using
the earned value method (EVM).
Project networks can be complex entities comprising different organizational actors with
different roles and interests. The main challenge in this area is how to control and
coordinate the variety of actors to work towards a shared goal. The proposed mechanisms
of project network governance Kujala et al. (2016) exist to modify and guide the behavior
of actors to enable achieving project’s goals in a coordinated fashion.
Project network governance as defined by Kujala et al. (2016) is a novel approach to a
previously researched area. The project’s performance as a combination of abilities and
willingness of different actors fills a gap between the original project definition of
working towards a shared goal and the prevalent (see Müller (2009)) project governance
definition of ensuring business alignment of a project. The differences between project
network governance and general project management also support the filling of the void.
Since the theory takes a different perspective to governance it can be utilized in different
contexts – as it is evident in the original paper: the safety performance.
Talking about flexibility, the suggested project network governance theory fits into the
canvas of theory of planned behavior. The theory created by Ajzen (1991) can also be
summed as a combination of ability and willingness – the basics of which Hsu et al.
(2016) used to describe the expertise coordination. The synthesis of these three results in
the model described in this thesis – a description of human behavior in the context of
project environment.
The behavior of individuals was modeled through a value calculating function for
different activities with predefined weights for influencing factors. Actors themselves
made the decisions on which task they are going to work on based on the value and always
choose the task with highest value. In the future, the number of factors influencing the
decisions can be increased and additional logic can be included in the selection process.
This could mean that the behavior and the choices of an individual could be influenced
by irrational thinking or lack of crucial information – all unique attributes of different
individuals at different levels of the project network.
In the present model, the role of contracts was significant. The behavior of actors was
mostly dependent on whether the task was labeled as fixed price contract or cost plus.
This was due to deliberate weight assignments for different influencing factors – the role
of contracts was designed to be the most important. Because of the importance of keeping
the schedule in fixed price contracts, the actors always chose fixed price tasks over cost
plus. The effect of this behavior could be further evident if the task network was more
complex, containing many tasks in parallel or resource constraints were in place. The
mathematical optimization problem would in these cases be handled by the heuristics of
the actors.
The creation of the simulation model in part followed the process mapping suggested by
Banks et al. (2010). Although the development team was small and inexperienced in
creating simulation models, a complete model was created – a model that represents the
goals set in the beginning. If looked at critically, the conceptual modeling part of the
development process should have been done more elaborately in the beginning. Even
though the goal remained the same, many important components changed multiple times
during the development – some unnecessarily high number of times. This could have been
evaded by more thorough planning at the beginning as suggested by Sterman (2000).
However, as stated in the literature, creating simulation models is and should be a highly
iterative process. In this regard, the development process was successful – iterations were
done in small packages often revamping a whole section couple of times.
Berends and Romme (1999) and Harrison et al. (2007) both provided different views on
why simulation is not widely accepted and used method in management literature. These
reasons included both the management researchers’ lack of ability to build simulation
models and the applicability of results. This was also evident in the small literature review

done in the context of this thesis. The literature search of the two main project
management journals concluded with very small amount of scientific studies with
simulation being as the main tool. However, simulation studies that have some
significance in the project management world have been published in other journals most
of which are related to computer science.
Agent based simulation is no different in this matter since it quite heavily relies on
programming skills. Basic models can be created with ease, but creating more complex
models increases the difficulties for seeing the big picture while creating the smaller
components. The applicability of agent based simulation in general is promising however,
the advantages in theory building or as a teaching tool are obvious. However, the effort
required for scholars to effectively learn agent based programming can be daunting. On
top of that, it could be debated whether it is financially beneficial for management
researchers to learn programming or focus on their primary research and let the simulation
part be outsourced.
The analysis of activity network diagram and task network using PERT has a long history
and it has been researched extensively. Therefore, the theoretical foundation for the model
and the verification of that part was straightforward. The results fell into the mold
established by the literature – the results of the Monte Carlo simulation indicated that the
project durations with beta-distributed tasks approach the normal distribution.
Even though the learning by doing process is well documented, the amount of quantitative
research on the topic of collaborative learning is limited. Therefore, the learning curves
in the model are based on the research done on individual learning Anzanello and
Fogliatto (2011) and the collaborative learning aspect is an estimation of the effect it
potentially could have. Tynjälä (2008) acknowledges the effect of collaborative learning,
but the study is of qualitative nature. The reasoning behind the low number of studies
regarding collaborative learning might be because learning can be hard to measure.
Measuring learning in the workplace can provide enormous difficulties if the nature of
the work is non-physical labor – calculating the efficiency of a painter is much easier than
that of a project manager.
Verification process for the model in this thesis was brief, but deliberate – by focusing
only on two different aspects we can achieve a more in depth results for those two in the
scope of this document. By verifying only two aspects, a more thorough understanding
of how these two work is gained – in contrast to verifying all the aspects and either
prolonging the document or losing details in the process.
5.1 Limitations
The model has been developed by a small team and all its features are on a theoretical
basis. No empirical data was used for the project nor for the different influences on tasks
or actor’s. No further calibration of values based on empirical data was conducted –
though the validation process is possible in the future. The project network and task
network are small with little complexity. Also of note are the programming skills of the
modeler – a minor in computer science with little experience in Java, or programming in
general. However, it is notable that the work can be continued and improved in the future,
since the code is available and the software is moderately approachable.
Many of the design choices, particularly on the programming side of things, could be
done better by more thoroughly exploring the capabilities of the Anylogic platform. The
aid of Anylogic’s support could have been utilized more frequently in the case of
designing features since many of the functionalities in the model are made by hand instead
of pre-built modules. Nevertheless, the Anylogic support was contacted multiple times
during the development process and it provided solutions for all problems presented.
5.2 Future research
As the model developed, some of the aspects were cut and left out of the model. However,
since the model is purposely constructed as a platform on which it is possible to build
more on, future seems bright. In the context of this thesis, some possible research in the
future can be done in the area of project alliance Lahdenperä (2009), or business networks
Ahola (2009). This means increasing the number of participating actors and networks.
These areas can be easily implemented into the model since most of the elements in those
topics already exists in the model, at least partly.
Other possible directions that can be explored with the model are, e.g. trust and
information sharing. Both are also included in the broader context of project alliance, but
could also be explored in the current type of model with only one network. Inter-

organizational links have a vast variety of different attributes that can be easily added and
simulated using this model. Information could be utilized as one of the mechanisms to
determine the outcome of a task, i.e. the amount of information any particular actor has
influences the quality of decisions they can make.
Additionally, the simulation model could be used as a teaching tool. The decision-making
logic could be turned off and transfer that responsibility to the user or put the user in
control of some of the actors in the network. This way the real human behavior could be
registered and the data gathered could be used as a basis for improving the ruleset for the
autonomous agents. This would create a reinforcing loop that might yield some interesting
insights to the whole project governance phenomena.
6 CONCLUSIONS
The goal of this thesis was to build a baseline model for simulating project network
governance and to gain deeper understanding of the matter. The development project of
the model was successful and the model was used to examine the simulated human
behavior in the context of project environment. Deeper understanding of the project
network governance and its mechanisms was gained through the simulation itself.
Depending on how the values for decision making were weighted, the behavior of
different actors changed. Their behavior was influenced by the mechanisms, although,
more calibration is in order.
Simulating complex project networks can be achieved through agent based modeling.
Changes in the network structure, different attributes and behaviors of actors, and
underlying business elements can all be naturally applied to agent based models. The
learning lesson here is that a more refined approach to conceptual modeling is required
to build these models more efficiently. More time needs to be invested to describe all the
components and different relations between them to keep the complexity of the models
in check.
The model can be downloaded from http://tavu.eu/thesis (Anylogic is required to run the
model).
Key findings presented in this thesis are summarized below.
RQ1: What are the most significant characteristics of project network and task network?
Project networks consist of organizations that have inter-organizational relationships
linking them together. The basic formula of a project network is that it has a project owner
and a contractor. However, larger projects can require larger network of contractors of
different fields with differing sets of relations with one another. These networks can also
include subcontractors of various tiers.
Task network is a collection of tasks that together form a project. Tasks form the
backbone of a project and their end results (time, cost and quality) will influence the
performance of the whole endeavor. Activity network diagram can be used to display the

different relations tasks have between each other. Possible start and end times in addition
to secondary scheduling information can also be displayed through the diagram.
RQ2: What are different mechanisms of project network governance?
There are two main approaches to project governance in management literature. The
external project governance has been discussed in the literature for years. This only takes
into account the performance indicators of a project and how the project can be guided to
completion while aligned with business goals. However, the project network governance
is a novel approach to internal project governance. It considers all the organizations that
are relevant to the project’s success, and presents different mechanisms to control or
influence the behavior of these actors.
The first point of view on project governance used steering groups on various levels of
the organizations to keep the projects aligned with the business goals. The project network
governance is more democratic in a sense that the basic project definition of working
towards a common goal is extended to contractual agreements, decision making and
coordination. All the relevant stakeholders have a voice when discussing important
arrangements – a shared culture and formal structures are commonly agreed between
parties.
The different mechanisms of project network governance as defined by (Kujala et al.,
2016) are as follows: goal setting, incentives, monitoring, coordination, roles and
decision making, and capability building. The mechanisms can be applied to mitigate
risks or prevent them. Contracts and agreements play a big part in ensuring that the project
as a whole is understood by the whole network of actors and that they are committed to
delivering results. Coordination between all actors of the project network can be
controlled and monitored through these contracts and agreements.

RQ3: What are different stages in the simulation model development?
The most important stages in the simulation model development in chronological order:
1. Problem definition
2. Setting objectives for the project
3. Model conceptualization and data collection
4. Model translation
5. Verification and validation
6. Experimentation and analysis
7. Documentation
8. Implementation
A clear problem needs to be defined – this is an overlooked part of the modeling process.
Without a clearly thought out problem, the conceptualization is difficult since the modeler
is then looking for answers in the wrong direction. A suitable coding language most be
chosen that is fast to execute, easy to construct and debug. Verification means that the
model works internally correctly – it does what it is designed to do. Validation in turn is
the external fit, to what extent the model represents the original need or modeled system.
Experimentation and analysis is conducted to find out optimal or alternative solutions to
the defined problem. It is essential that documentation starts as early as possible to ensure
that everything is going according to plan, changes in design are saved, and the work can
be continued later by someone who was not part of the project. Implementation is either
putting the model into use for the client or can be thought as a learning process if done
with pure research in mind.
RQ4: What are the strengths and weaknesses of different modeling paradigms in
simulating project network governance?
First and foremost, the agent based modeling approach is the best method to model project
network governance. The freedom granted in the ability to create agents with their own
behavior suits well the problems presented in the project network governance theory.
With agent based modeling, any abstraction or structure is not an issue since everything
is built from the ground up.

However, system dynamics approach is not without merit in this matter. System dynamics
uses aggregated stocks of individuals, tasks or other countable items. Even though the
individuals cannot be distinguished from the stocks, the system dynamics approach could
be used to model individual aspects of the project network governance mechanisms.
Discrete event method is most efficient in dealing with process oriented problems. There
are not a lot of problems regarding any type of process in project network governance and
therefore the applicability of the method is limited. However, those problems that can be
identified as process related, discrete event is the go-to tool.
Strengths of the paradigm are the freedom in design and from the ground up approach. In
the context of project networks, every component of the network, be it a task or an
individual, can be modeled with the correct amount of detail and depth depending on the
needs of the simulation. There are no bounds on what the agent based method can be used
to model, although larger quantities of agents can be demanding on the processing power
if not properly optimized.
Weaknesses of agent based modeling lie in the complexity of created models, the creation
of such models through programming and the time consumed by the process. In contrast
to other simulation methods, agent based models can get increasingly complex to create,
because the programming skill requirements might often be above average.
System dynamics approach is very well documented and standardized, closely followed
by discrete event modeling with rich history in process modeling. However, the agent
based modeling is the youngest of the three and therefore, it has not had the time to evolve
into standardized form with large libraries for different needs. This means that agent
based models that are more complex than say, bass diffusion model, are likely to need
some custom work done on the functionalities. All of this leads to the fact that the
requirements for modeling with agent based approach are higher, both in skill and time
invested.
7 LIST OF REFERENCES
Aaltonen, K. and Kujala, J. (2016), “Towards an improved understanding of project
stakeholder landscapes”, JPMA, Elsevier Ltd and Association for Project
Management and the International Project Management Association, Vol. 34 No. 8,
pp. 1537–1552.
Ahola, T. (2009), Efficiency in Project Networks: The Role of Inter-Organizational
Relationships in Project Implementation.
Ahola, T., Ruuska, I., Artto, K. and Kujala, J. (2014), “What is project governance and
what are its origins?”, International Journal of Project Management, Elsevier Ltd
and International Project Management Association, Vol. 32 No. 8, pp. 1321–1332.
Ajzen, I. (1991), “The theory of planned behavior”, Orgnizational Behavior and Human
Decision Processes, Vol. 50, pp. 179–211.
Anylogic. (2016), “Anylogic features”, available at: http://www.anylogic.com/features
(accessed 7 August 2016).
Anzanello, M.J. and Fogliatto, F.S. (2011), “Learning curve models and applications:
Literature review and research directions”, International Journal of Industrial
Ergonomics, Elsevier Ltd, Vol. 41 No. 5, pp. 573–583.
Artto, K. and Kujala, J. (2008), Project Business as a Research Field, International
Journal of Managing Projects in Business, Vol. 1, available
at:http://doi.org/10.1108/17538370810883819.
Artto, K., Martinsuo, M. and Kujala, J. (2006), Projektiliiketoiminta, Vol. 2006, available
at: http://pbgroup.aalto.fi/en/the_book_and_the_glossary/projektiliiketoiminta.pdf.
Banks, J., II, J.S.C., Nelson, B.L. and Nicol, D.M. (2010), “Discrete - Event System
Simulation 5th Edition”.
Behdani, B. (2012), “Evaluation of paradigms for modeling supply chains as complex
sociotechnical systems”, Proceedings of the 2012 Winter Simulation Conference,
pp. 1–12.
Berends, P. and Romme, G. (1999), “Simulation as a research tool in management
studies”, European Management Journal, Vol. 17 No. 6, pp. 576–583.
Borshchev, A. (2013), The Big Book of Simulation Modeling.
Borshchev, A. and Filippov, A. (2004), “From System Dynamics to Agent Based
Modeling”, Simulation, Vol. 66 No. 11, pp. 25–29.
Chang, C.Y. (2015), “Risk-bearing capacity as a new dimension to the analysis of project
governance”, International Journal of Project Management, Elsevier Ltd and
International Project Management Association, Vol. 33 No. 6, pp. 1195–1205.
Chang, C.Y. and Ive, G. (2007), “The hold-up problem in the management of construction
projects: A case study of the Channel Tunnel”, International Journal of Project
Management, Vol. 25 No. 4, pp. 394–404.
Cho, S.-H. and Eppinger, S.D. (2005), “A Simulation-Based Process Model for Managing
Complex Design Projects”, IEEE Transactions on Engineering Management, Vol.
52 No. 3, pp. 316–328.
Davies, A., MacAulay, S., DeBarro, Ti. and Thurston, M. (2014), “Making Innovation
Happen in a Megaproject: London’s Crossrail Suburban Railway System”, Project
Management Journal, available at:http://doi.org/10.1002/pmj.
Davis, J.P., Eisenhardt, K.M. and Bingham, C.B. (2007), “Developing Theory Through
Simulation Methods”, Academy of Management.The Academy of Management
Review, Vol. 32 No. 2, pp. 480–499.
Edmonds, B. and Meyer, R. (2013), Simulating Social Complexity: A Handbook,
available at:http://doi.org/10.1007/978-3-540-93813-2.

Fatemi Ghomi, S.M.T. and Ashjari, B. (2002), “A simulation model for multi-project
resource allocation”, International Journal of Project Management, Vol. 20 No. 2,
pp. 127–130.
Gilbert, N. and Troitzsch, K.G. (1999), Simulation for the Social Scientist, 2nd ed.
Grabher, G. (2002), “Cool Projects, Boring Institutions: Temporary Collaboration in
Social Context”, Regional Studies, Vol. 36 No. 3, pp. 205–214.
Grimm, V., Berger, U., Deangelis, D.L., Polhill, J.G., Giske, J. and Railsback, S.F.
(2010), “The ODD protocol : a review and first update”, Ecological Modelling.
Guo, F., Chang-Richards, Y., Wilkinson, S. and Li, T.C. (2014), “Effects of project
governance structures on the management of risks in major infrastructure projects:
A comparative analysis”, International Journal of Project Management, Elsevier
Ltd, Vol. 32 No. 5, pp. 815–826.
Harrison, J.R., Carroll, G.R. and Carley, K.M. (2007), “Simulation modeling in
organizational and management research”, Academy of Management Review, Vol.
32 No. 4, pp. 1229–1245.
Heath, S.K., Brailsford, S.C., Buss, A. and Macal, C.M. (2011), “Cross-paradigm
simulation modeling: Challenges and successes”, Proceedings - Winter Simulation
Conference, pp. 2783–2797.
Hsu, J.S., Hung, Y.W., Shih, S.-P. and Hsu, H.-M. (2016), “Expertise coordination in
information systems development projects”, Project Management Journal, No.
September, pp. 1–22.
Jin, Y. and Levitt, R.E. (1996), “The virtual design team: A computational model of
project organizations”, Computational and Mathematical Organization Theory, Vol.
2 No. 3, pp. 171–195.
Jinghua, L. and Wenjian, L. (2005), “An Agent-Based System for Multi-Project Planning
and Scheduling”, No. July, pp. 659–664.
Kothari, C. (2004), Research Methodology: Methods and Techniques, available
at:http://doi.org/http://196.29.172.66:8080/jspui/bitstream/123456789/2574/1/Rese
arch%20Methodology.pdf.
Krajewski, L.J., Ritzman, L.P. and Malhotra, M.K. (2013), Operations Management:
Processes and Supply Chains, 10th ed., Vol. 1.
Kujala, J., Aaltonen, K. and Gotcheva, N. (2016), Key Dimensions of Governance in
Inter-Organizational Project Networks and Implications Nuclear Safety.
Lahdenperä, P. (2009), Project Alliance the Competitive Single Target-Cost Approach ,
VTT Tiedotteita - Valtion Teknillinen Tutkimuskeskus, available at:
http://www.scopus.com/inward/record.url?eid=2-s2.0-
80052619587&partnerID=40&md5=699238d65df23b3b17ef3f0036101d44.
Lester, E.I.A. (2014), “Project Definition”, Project Management, Planning and Control,
pp. 1–6.
Liu, T. and Wilkinson, S. (2014), “Large-scale public venue development and the
application of Public-Private Partnerships (PPPs)”, International Journal of Project
Management, Elsevier Ltd and APM IPMA., Vol. 32 No. 1, pp. 88–100.
Lu, P., Guo, S., Qian, L., He, P. and Xu, X. (2015), “The effectiveness of contractual and
relational governances in construction projects in China”, International Journal of
Project Management, Elsevier B.V., Vol. 33 No. 1, pp. 212–222.
Macal, C.M. and North, M.J. (2006), “Tutorial on agent-based modeling and simulation
part 2: how to model with agents”, Proceedings of the 2006 Winter Simulation
Conference, pp. 73–83.
Macal, C.M. and North, M.J. (2010), “Tutorial on agent-based modelling and
simulation”, Journal of Simulation, Palgrave Macmillan, Vol. 4 No. 3, pp. 151–162.
Melorose, J., Perroy, R. and Careas, S. (2015), “Activity scheduling in the dynamic,

multi-project setting: choosing heuristics through deterministic simulation”,
Statewide Agricultural Land Use Baseline 2015, Vol. 1 No. Id, pp. 937–941.
Müller, R. (2009), Project Governance.
Nisar, T.M. (2013), “Implementation constraints in social enterprise and community
Public Private Partnerships”, International Journal of Project Management, Elsevier
Ltd and IPMA, Vol. 31 No. 4, pp. 638–651.
Parrod, N., Thierry, C., Fargier, H. and Cavaille, J.B. (2007), “Cooperative
subcontracting relationship within a project supply chain: A simulation approach”,
Simulation Modelling Practice and Theory, Vol. 15 No. 2, pp. 137–152.
Peffers, K., Tuunanen, T., Rothenberger, M. and Chatterjee, S. (2008), “A Design Science
Research Methodology for Information Systems Research”, Journal of Management
Information Systems, Vol. 24 No. January, pp. 45–77.
Perros, H. (2009), Computer Simulation Techniques : The Definitive Introduction.
Rand, W. and Rust, R.T. (2011), “Agent based modeling in marketing: Guidelines for
rigor”, International Journal of Research in Marketing, Vol. 1, pp. 1–13.
Robinson, S. (2004), Simulation: The Practice of Model Development and Use, 1st ed.,
available at:http://doi.org/10.1057/palgrave.jos.4250031.
Rodrigues, A.G. (1994), “The Role of System Dynamics in Project Management: A
Comparitive Analysis with Traditional Models”, Proceedings of the 1994
International System Dynamics Conference.
Ruuska, I., Ahola, T., Artto, K., Locatelli, G. and Mancini, M. (2011), “A new governance
approach for multi-firm projects: Lessons from Olkiluoto 3 and Flamanville 3
nuclear power plant projects”, International Journal of Project Management,
Elsevier Ltd and IPMA, Vol. 29 No. 6, pp. 647–660.
Ruuska, I., Artto, K., Aaltonen, K. and Lehtonen, P. (2009), “Dimensions of distance in
a project network: Exploring Olkiluoto 3 nuclear power plant project”, International
Journal of Project Management, Vol. 27 No. 2, pp. 142–153.
Sargent, R.G. (2003), “Verification and validation of simulation models”, Time, pp. 556–
564.
Sargent, R.G. (2010), “To agent-based simulation from system dynamics”, Simulation,
No. 2001, pp. 135–150.
Sterman, J.D. (2000), Systems Thinking and Modeling for a Complex World, Vol. 6,
available at:http://doi.org/10.1108/13673270210417646.
System Dynamics Society. (2011), “What is system dynamics?”, available at:
http://www.systemdynamics.org/what_is_system_dynamics.html (accessed 16 June
2016).
Tako, A.A. and Robinson, S. (2009), “Comparing discrete-event simulation and system
dynamics: users’ perceptions”, Journal of the Operational Research Society, Vol.
60 No. 3, pp. 296–312.
Taylor, J.E., Levitt, R. and Villarroel, J.A. (2009), “Simulating Learning Dynamics in
Project Networks”, Journal of Construction Engineering and Management, Vol. 135
No. October, pp. 1009–1015.
Turner, R. (2014), Gower Handbook of Project Management.
Tynjälä, P. (2008), “Perspectives into learning at the workplace”, Educational Research
Review, Vol. 3 No. 2, pp. 130–154.
Tysiak, W. and Sereseanu, a. (2009), “Monte Carlo simulation in risk management in
projects using Excel”, 2009 IEEE International Workshop on Intelligent Data
Acquisition and Advanced Computing Systems: Technology and Applications, No.
September, pp. 4–8.
Wakeland, W.W., Gallaher, E.J., Macovsky, L.M. and Aktipis, C. a. (2004), “A
comparison of system dynamics and agent-based simulation applied to the study of

cellular receptor dynamics”, Proceedings of the 37th Annual Hawaii International
Conference on System Sciences, pp. 1–10.
Xie, M., Li, C. and Chen, J. (2008), “System Dynamics Simulation to Support Decision
Making in Software Development Project”, 2008 4th International Conference on
Wireless Communications Networking and Mobile Computing, pp. 1–4.
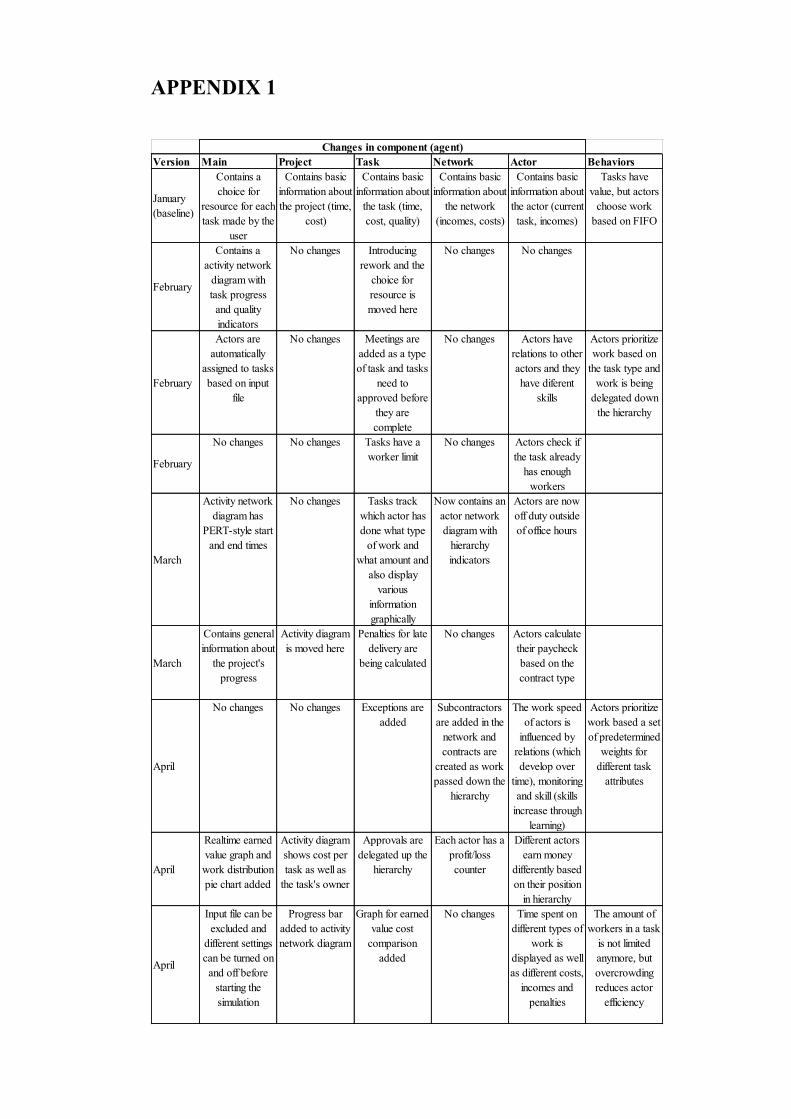
APPENDIX 1
Version Main Project Task Network Actor Behaviors
January
(baseline)
Contains a
choice for
resource for each
task made by the
user
Contains basic
information about
the project (time,
cost)
Contains basic
information about
the task (time,
cost, quality)
Contains basic
information about
the network
(incomes, costs)
Contains basic
information about
the actor (current
task, incomes)
Tasks have
value, but actors
choose work
based on FIFO
February
Contains a
activity network
diagram with
task progress
and quality
indicators
No changes Introducing
rework and the
choice for
resource is
moved here
No changes No changes
February
Actors are
automatically
assigned to tasks
based on input
file
No changes Meetings are
added as a type
of task and tasks
need to
approved before
they are
complete
No changes Actors have
relations to other
actors and they
have diferent
skills
Actors prioritize
work based on
the task type and
work is being
delegated down
the hierarchy
February
No changes No changes Tasks have a
worker limit
No changes Actors check if
the task already
has enough
workers
March
Activity network
diagram has
PERT-style start
and end times
No changes Tasks track
which actor has
done what type
of work and
what amount and
also display
various
information
graphically
Now contains an
actor network
diagram with
hierarchy
indicators
Actors are now
off duty outside
of office hours
March
Contains general
information about
the project's
progress
Activity diagram
is moved here
Penalties for late
delivery are
being calculated
No changes Actors calculate
their paycheck
based on the
contract type
April
No changes No changes Exceptions are
added
Subcontractors
are added in the
network and
contracts are
created as work
passed down the
hierarchy
The work speed
of actors is
influenced by
relations (which
develop over
time), monitoring
and skill (skills
increase through
learning)
Actors prioritize
work based a set
of predetermined
weights for
different task
attributes
April
Realtime earned
value graph and
work distribution
pie chart added
Activity diagram
shows cost per
task as well as
the task's owner
Approvals are
delegated up the
hierarchy
Each actor has a
profit/loss
counter
Different actors
earn money
differently based
on their position
in hierarchy
April
Input file can be
excluded and
different settings
can be turned on
and off before
starting the
simulation
Progress bar
added to activity
network diagram
Graph for earned
value cost
comparison
added
No changes Time spent on
different types of
work is
displayed as well
as different costs,
incomes and
penalties
The amount of
workers in a task
is not limited
anymore, but
overcrowding
reduces actor
efficiency
Changes in component (agent)
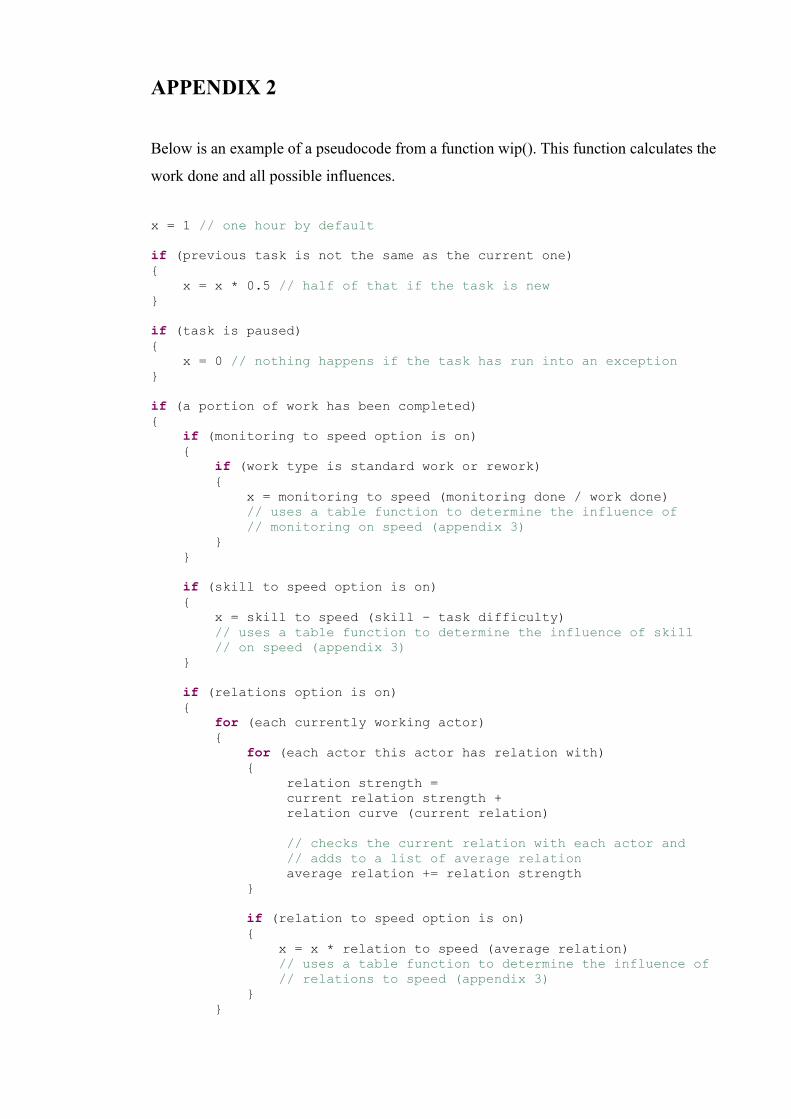
APPENDIX 2
Below is an example of a pseudocode from a function wip(). This function calculates the
work done and all possible influences.
x = 1 // one hour by default
if (previous task is not the same as the current one)
{
x = x * 0.5 // half of that if the task is new
}
if (task is paused)
{
x = 0 // nothing happens if the task has run into an exception
}
if (a portion of work has been completed)
{
if (monitoring to speed option is on)
{
if (work type is standard work or rework)
{
x = monitoring to speed (monitoring done / work done)
// uses a table function to determine the influence of
// monitoring on speed (appendix 3)
}
}
if (skill to speed option is on)
{
x = skill to speed (skill – task difficulty)
// uses a table function to determine the influence of skill
// on speed (appendix 3)
}
if (relations option is on)
{
for (each currently working actor)
{
for (each actor this actor has relation with)
{
relation strength =
current relation strength +
relation curve (current relation)
// checks the current relation with each actor and
// adds to a list of average relation
average relation += relation strength
}
if (relation to speed option is on)
{
x = x * relation to speed (average relation)
// uses a table function to determine the influence of
// relations to speed (appendix 3)
}
}

}
work to be completed (actor’s efficiency * x)
// work done added to task after calculating all the influences
if (work type is standard work or rework)
{
for (each currently working actor)
{
if (actor has better skill)
{
teaching = teacher’s skill / this actor’s skill
// checks who has the highest skill and uses his skill
// divided by this actor’s skill as value for teaching
}
}
if (learning option is on)
{
skill = current skill +
learning curve (current skill) * teaching
// uses a table function to determine the increase of
// skill with possible addition of teaching
}
if (skill to quality option is on)
{
task quality = (task quality + current skill) / 2
// task’s quality influenced by skill
}
create rework (current skill and work left)
// creates rework based on the current skill and amount of
// work left
create an exception (superior)
// checks if an exception will occur and notifies this actor’s
// superior
}
calculate quality
// calculates quality
test if complete
// checks if all work has been done
calculate paycheck
// calculates how much actor receives from the work done (based on
// contract)
}

APPENDIX 3
Figure 52. Relation to speed (faster speed if higher relation).
Figure 53. Monitoring to speed (faster speed if more monitoring).
Figure 54. Monitoring to quality (higher quality if more monitoring).
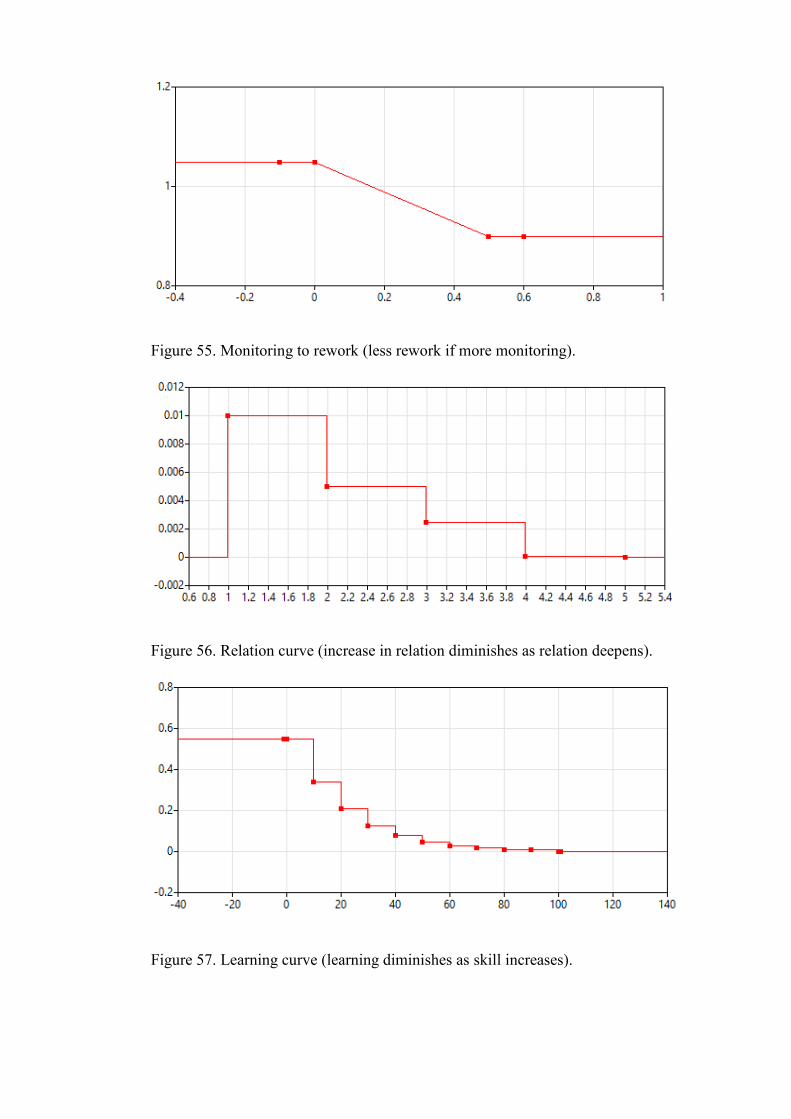
Figure 55. Monitoring to rework (less rework if more monitoring).
Figure 56. Relation curve (increase in relation diminishes as relation deepens).
Figure 57. Learning curve (learning diminishes as skill increases).

Figure 58. Skill to speed (task completion speed increases as skill increases).

APPENDIX 4
Java code example for calculating the critical path, including latest and earliest start and
end times.
for (Project p: projects)
{
for (Task t: p.tasks)
{
// first task
if (t.previousTask.size() == 0)
{
t.start = p.startTime;
}
// rest of the tasks
else
{
for (Task tp: t.previousTask)
{
if (tp.end > t.start)
{
t.start = tp.end;
}
}
}
t.end = t.start + (t.duration / t.workerLimit);
// end time for project aka end time of last task
if (t.nextTask.size() == 0)
{
p.endTime = t.end;
}
// set start time for task (dynamic event)
t.create_StartTask(1);
}
}
for (Project p: projects)
{
// go through the tasks in reverse to find out critical path
for (int a=p.tasks.size()-1;a>=0;a--)
{
double finalEnd = p.endTime;
Task t = p.tasks.get(a);
// final task
if (t.nextTask.size() == 0)
{
t.laterEnd = finalEnd;
t.laterStart = finalEnd - (t.duration / t.workerLimit);
if (abs(t.start - t.laterStart) <= 0.0001)
{
t.isCritical = true;
}
}

// rest of the tasks
else
{
for (Task tp: t.nextTask)
{
if (tp.laterStart < finalEnd)
{
finalEnd = tp.laterStart;
}
t.laterEnd = finalEnd;
t.laterStart =
t.laterEnd - (t.duration / t.workerLimit);
if (abs(t.start - t.laterStart) <= 0.0001)
{
t.isCritical = true;
}
}
}
}
}

APPENDIX 5
Figure 59. Input data from Excel for creating tasks. Contains task id, previous task id,
task duration, actor network id, contract type, skill type requirement, main contractor and
quality links.
Figure 60. Input data from Excel for creating tasks (continues). Contains worker limit,
task difficulty, assigned team, subcontracting tiers, subcontract type, fixed price hourly
fee, cost plus hourly fee and monitoring amount.
TID PTID min mode max Network Contract Type Main contractor Quality links
1 ; 14 16 20 1 2 2 2 2/1;3/1
2 ;1 8 10 14 1 2 2 2 5/1
3 ;1 16 18 22 1 2 3 2 6/1
4 ;2 18 20 24 1 2 2 2 7/1
5 ;3 14 16 20 1 2 2 2 6/1
6 ;3 8 10 14 1 2 3 2 8/1
7 ;4 10 12 16 1 2 2 2 9/1
8 ;5;6 12 14 18 1 2 2 2 9/1
9 ;7;8 12 14 18 1 2 3 2
10 ;9 14 16 20 1 2 2 2
Worker limit Difficulty Team Subcontractor Subcontract type Fixed Cost+ Monitoring
2 95 4 30 20 0.4
1 95 3;5 1 30 20 0.4
2 95 4 30 20 0.4
1 95 3;5 1 30 20 0.4
1 95 4 30 20 0.4
1 95 3 1 30 20 0.4
1 95 3;5 1 30 20 0.4
2 95 4 30 20 0.4
2 95 4 30 20 0.4
2 95 4 30 20 0.4

Figure 61. Input data from Excel for creating actors. Contains actor network id, actor type,
actor id, actor paycheck, actor skill, actor role.
Figure 62. Input data from Excel for creation of inter-organizational links between actors.
Network Actor type ID Paycheck Skill Role
1 1 1 20 1/98 Owner
1 1 2 20 1/96 Contractor
1 2 3 15 1/97 Subcontractor
1 2 4 15 1/95 Team leader
1 2 5 15 1/96 Subcontractor
1 3 6 10 3/94 Worker
1 3 7 10 2/96;3/94 Worker
1 3 8 10 2/95;3/97 Worker
1 3 9 10 2/95 Worker
From To Relation typeStrength
1 2 2 1
2 1 2 1
2 3 2 1
2 4 1 1
3 2 2 1 Legend
3 5 2 1 1 Network hierarchy
3 6 1 1 2 Subcontrating
4 2 1 1 3 Worker to worker
4 7 1 1 4 Monitor to monitor
4 8 1 1 5 Monitor to worker
5 3 2 1
5 9 1 1
6 3 1 1
7 4 1 1
7 8 3 1
8 4 1 1
8 7 3 1
9 5 1 1


