17
Prof. Dr.-Ing. Peter Steinberg, BTU Cottbus M.Sc. Oleg Krecker, PhD candidate, BMW SIMULATION AND EVALUATION OF ENGINE FRICTION EUROPEAN GT CONFERENCE, FRANKFURT/MAIN, OCTOBER 9TH, 2017
| Date post: | 10-Jun-2018 |
| Category: |
Documents |
| Upload: | duongquynh |
| View: | 218 times |
| Download: | 0 times |

Prof. Dr.-Ing. Peter Steinberg, BTU Cottbus
M.Sc. Oleg Krecker, PhD candidate, BMW
SIMULATION AND EVALUATION OF ENGINE FRICTIONEUROPEAN GT CONFERENCE, FRANKFURT/MAIN, OCTOBER 9TH, 2017

Simulation and Evaluation of Engine Friction | Oleg Krecker | October 9th 2017 Slide 2
AGENDA
Motivation and objective1
Modelling of friction related components 2
Validation3
Conclusion and further developments4

Simulation and Evaluation of Engine Friction | Oleg Krecker | October 9th 2017 Slide 3
01MOTIVATION AND OBJECTIVE

MOTIVATION
Simulation and Evaluation of Engine Friction | Oleg Krecker | October 9th 2017 Slide 4
Thermal engine
model1D Simulation warm up
& fuel consumption
within driving cycles
Test
Warm up
0 200 400 600 800 1000 12000
50
100
150
Zeit [s]
TH
_Z
ST
_1
_2
_0
5 [°C
]
m.TH_ZST_1_2_05
eSCV zu Mean
eSCV auf Mean
0 200 400 600 800 1000 12000
50
100
150
Zeit [s]
TH
_Z
W_
A0
2_
03
5 [°C
]
m.TH_ZW_A02_035
eSCV zu Mean
eSCV auf Mean
Tem
per
atur
e [°
C]
Time [s]
Cylinder Bridge Temperature, NEDC
0D/1D Simulation Friction
Total engine
GT-Suite
Simulation
data
Final result:
Impact on
CO2 - emissions
Cor
rela
tion
&
valid
atio
n
Predictive evaluation of concepts and trends in engine friction reduction.
„As simple as possible and as complex as necessary.“
other
lossesmech.
power
Piston
assembly
Crank-
shaft
Oil + vacuum
Belt driveCylinder head
+ chain drive
Measurement data (motored and fired)
Fri
ctio
n
Speed
pump
Friction
Low
Total
engine
fired
1-cylinder fired(floating liner)
Total engine /
strip-down
Single components
motored
Transient
cycles
Low High
Real boundary conditions
Data resolution &reproducibility
High

OBJECTIVE
Simulation and Evaluation of Engine Friction | Oleg Krecker | October 9th 2017 Slide 5
Low
Total engine
fired
1-cylinder fired(floating liner)
Total engine /
strip-down
Single components
motored
Transient cycles
Low High
Closeness of basic
conditions to reality
Possible measuring
resolution & reproducibility
High
Fast prediction
Agile transferability
Relative comparison
Physical evaluation
Req
uire
men
ts
Simulation and Evaluation of Engine Friction | Oleg Krecker | October 9th 2017 Slide 6
02MODELLING OF FRICTION RELATED COMPONENTS

IDENTIFICATION OF MAJOR FRICTION SOURCES
Simulation and Evaluation of Engine Friction | Oleg Krecker | October 9th 2017 Slide 7
Chain drive & hydraulic components
Guides and tensioner
Oil & vacuum pump
VANOS
Chain
Cylinder head unit
Camshaft bearings
Valvetrain and VALVETRONIC
High pressure pump
Crank train
Piston – Liner system
Conrod and crankshaft bearings
Balancer shaft
Front end accessory drive
Multiple v-belt
Auxiliaries, e.g. alternator

CAPABILITIES IN GTSOME EXAMPLES
Simulation and Evaluation of Engine Friction | Oleg Krecker | October 9th 2017 Slide 8
Surface propertiesInlet camshaft and VALVETRONIC
of a 3-cylinder engine
Crank train of a 4-cylinder engine
Dynamic beam modelling and
hydrodynamic bearing solution
Complex kinematics (var. valve lift)
& independent definition of each
friction contact
Detailed piston and liner
geometry

Simulation and Evaluation of Engine Friction | Oleg Krecker | October 9th 2017 Slide 9
03VALIDATION

CRANKSHAFTVALIDATION AND CALIBRATION
Simulation and Evaluation of Engine Friction | Oleg Krecker | October 9th 2017 Slide 10
Friction torque deviation between measurement and
simulation is shown (strip-down crankshaft).
At high speeds >3500 RPM the model lacks in accuracy more effort in calibration is necessary.
Good correlation in usual speed ranges (<2500 RPM) of driving cycles fuel consumption area of interest.
Model calibration on temperature, oil flow and friction
torque.
Model overestimates
friction
Model underestimates friction
Area of good correlation

0 1000 2000 3000 4000 5000 6000
Fri
ctio
n To
rque
[N
m]
Speed [RPM]
1
Messung
Simulation
CRANKSHAFTMODEL TRANSFERABILITY (CASE STUDY ON BEARING CLEARANCE)
Simulation and Evaluation of Engine Friction | Oleg Krecker | October 9th 2017 Slide 11
0 1000 2000 3000 4000 5000 6000
Fri
ctio
n To
rque
[N
m]
Speed [RPM]
Friction Crankshaft only, 90°C
Messung
Simulation
Investigation on transferability at
changing boundary conditions
(bearing clearance).
Experiment on strip-down test rig and
variation of clearance:
• Minimum = 20 µm
• Maximum = 60 µm
GT setup:
• Bearing mobility method
• Crankshaft 3D beam dynamic
• Tuning of oil temperature model
Model shows good agreement of
frictional losses with changing
clearances.
Clearance 20µm
measured
Clearance 20µm
simulation
Clearance 60µm
simulation
Clearance 60µm
measured

PISTON ASSEMBLYTOTAL FRICTION OF PISTON SKIRT + RINGS (FLOATING LINER)
Simulation and Evaluation of Engine Friction | Oleg Krecker | October 9th 2017 Slide 12
Study shows the importance of proper geometry definition in the piston-liner system (convexity, ovality, distortion).
Unsteady peaks occur due to high contact pressure on partial areas at the skirt.
Current investigation on thermal FE skirt calculation and development of a work around by modifying skirt geometry. also V2019 will include an elastic deformation model for the skirt to improve friction prediction.
Measurement
A – w/o bore distortion & skirt geom.
B – with bore distortion & skirt geom.

CYLINDER HEAD UNITEXAMPLE: EXHAUST CAMSHAFT AND VALVETRAIN
Simulation and Evaluation of Engine Friction | Oleg Krecker | October 9th 2017 Slide 13
0 1000 2000 3000 4000 5000 6000
Fri
ctio
n To
rque
[N
m]
Speed [RPM]
Camshaft and Valvetrain Friction, exhaust side, 90°C
Strip-Messung Bezug AZ3.2 Simulation
0%
10%
20%
30%
40%
50%
60%
70%
80%
90%
100%
750 1000 1500 2000 3000 4000 5000
Fri
ctio
n To
rque
dis
trib
utio
n [%
]
Speed [RPM]
Friction distribution, exhaust side, 90°C
Friction Torque - CamShaftBearings
Reibmoment HVA
Reibmoment Ventilfuß
Reibmoment Ventilführung
Friction Torque - Cam-FollowerContacts absolut
MWälz; Part Mittelwert
Measurement Simulation Camshaft Bearings
Hyd. Lash Adjuster
Valve Pad
Valve Guide
Cam Follower
Roller Bearing
State of measurement: camshafts are driven by chain, valvetrain rocker arms are partly removed dynamic chain movement might interfere result fidelity (4500/5000 RPM)
Percentage distribution of friction contacts is a current state estimation.

TOTAL ENGINESIMULATION AND ADDITIONAL MEASUREMENTS
Simulation and Evaluation of Engine Friction | Oleg Krecker | October 9th 2017 Slide 14
Total Engine
Test Rig Transmission
Oil- & Vacuum – Pump
Water pump
Acc. Belt Drive
Inlet Camshaft + Valvetrain
Exhaust Camshaft + Valvetrain
Balancer Shaft
Piston Skirt
Piston Rings
Small End Bearing
Big End Bearing
Main Bearings
Seals
Sim
ulat
ion
Exp
eri-
men
t
Gap due to:
Missing simulation of chain friction
Belt drive friction needs a bit more tuning
Deviation in piston assembly
Strip-Down Test, 90°C

Simulation and Evaluation of Engine Friction | Oleg Krecker | October 9th 2017 Slide 15
04CONCLUSION AND FURTHER DEVELOPMENTS
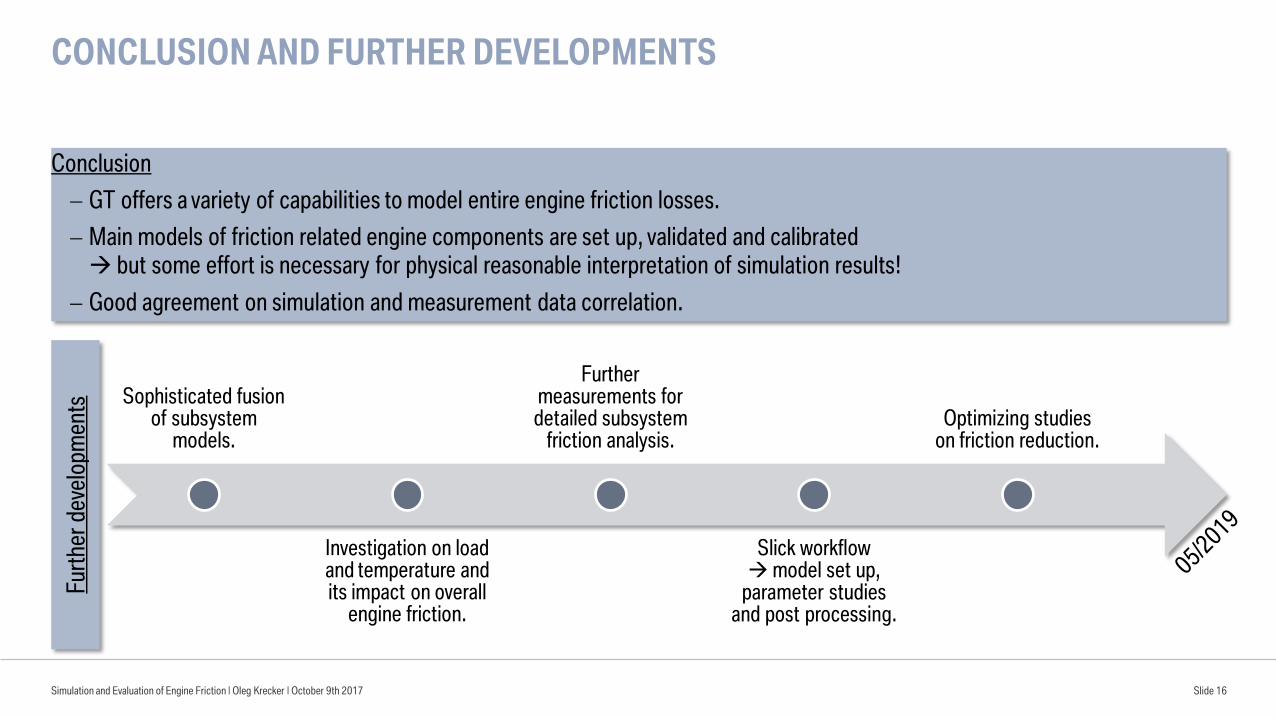
CONCLUSION AND FURTHER DEVELOPMENTS
Simulation and Evaluation of Engine Friction | Oleg Krecker | October 9th 2017 Slide 16
Conclusion
GT offers a variety of capabilities to model entire engine friction losses.
Main models of friction related engine components are set up, validated and calibrated but some effort is necessary for physical reasonable interpretation of simulation results!
Good agreement on simulation and measurement data correlation.
Sophisticated fusion of subsystem
models.
Investigation on load and temperature and its impact on overall
engine friction.
Further measurements for
detailed subsystem friction analysis.
Slick workflowmodel set up,
parameter studies and post processing.
Optimizing studies on friction reduction.
Fur
ther
dev
elop
men
ts

Simulation and Evaluation of Engine Friction | Oleg Krecker | October 9th 2017 Slide 17
THANK YOU!


![Temperature Dependent Molecular Dynamic Simulation of Friction · produce several features of the friction at a nanoscopic scale [8, 9]. In this work we use molecular dynamics (MD)](https://static.documents.pub/doc/80x56/5fb2837af6b57011fa60b87c/temperature-dependent-molecular-dynamic-simulation-of-produce-several-features-of.jpg)


