30 Iranian Journal of Chemical Engineering Vol. 11, No. 1 (Winter), 2014, IAChE Simulation and Optimization of Styrene Monomer Production Using Neural Network M. Aghayarzadeh, R. Alizadeh ∗ , S. Shafiei Faculty of Chemical Engineering, Sahand University of Technology, Tabriz, Iran Abstract Due to wide application of styrene for production of different materials, it is considered as an important product in industry. Therefore, optimizing styrene production conditions is of great importance in petrochemical industry. In this paper, styrene production reactors of Tabriz Petrochemical Complex are modeled using Artificial Neural Network (ANN) model and Adaptive Neuro Fuzzy Inference System (ANFIS). Comparison of two models revealed that the neural networks are more reliable. The process of design and evaluation of models are carried out using industrial data which show credibility of designed models. The neural networks are designed to predict the styrene output from reactors as a function of effective input parameters on the styrene production. Predictions of designed neural networks were used to study the effect of each variable, such as oxygen flow rate and steam oil ratio, on the amount of styrene produced. Also, the optimal values of effective variables for maximum production of styrene were obtained. Furthermore, in order to obtain accurate results, catalyst deactivation of styrene reactors has been modeled using Fuzzy Inference System. As a result, catalyst activity as a function of time is obtained. Keywords: Styrene Monomer, Artificial Neural Network, Catalyst Deactivation, Fuzzy Inference System ∗ Corresponding author: [email protected]1. Introduction Styrene Monomer or Vinyl Benzene is one of the most important monomers used in petrochemical industries for production of polymeric materials such as polystyrene, acrylonitrile-styrene, acrylonitrile-butadiene- styrene (ABS), and latex styrene-butadiene [1]. Due to wide application of styrene for production of various materials, it is produced in large amounts in petrochemical units. It must be mentioned that in 2012, styrene monomer production worldwide exceeded 26.4-million tonnes [2]. Therefore, finding the optimal conditions for styrene production in petrochemical reactors has great economic value. The most important techniques for commercial production of styrene are catalytic dehydrogenation of ethyl benzene and oxidation of ethyl benzene to ethyl benzene hydro peroxide after which ethyl benzene hydro peroxide reacts with propane in order to produce styrene and
Transcript
30
Iranian Journal of Chemical Engineering Vol. 11, No. 1 (Winter), 2014, IAChE
Simulation and Optimization of Styrene Monomer
Production Using Neural Network
M. Aghayarzadeh, R. Alizadeh∗, S. Shafiei Faculty of Chemical Engineering, Sahand University of Technology, Tabriz, Iran
Abstract Due to wide application of styrene for production of different materials, it is considered as an important product in industry. Therefore, optimizing styrene production conditions is of great importance in petrochemical industry. In this paper, styrene production reactors of Tabriz Petrochemical Complex are modeled using Artificial Neural Network (ANN) model and Adaptive Neuro Fuzzy Inference System (ANFIS). Comparison of two models revealed that the neural networks are more reliable. The process of design and evaluation of models are carried out using industrial data which show credibility of designed models. The neural networks are designed to predict the styrene output from reactors as a function of effective input parameters on the styrene production. Predictions of designed neural networks were used to study the effect of each variable, such as oxygen flow rate and steam oil ratio, on the amount of styrene produced. Also, the optimal values of effective variables for maximum production of styrene were obtained. Furthermore, in order to obtain accurate results, catalyst deactivation of styrene reactors has been modeled using Fuzzy Inference System. As a result, catalyst activity as a function of time is obtained. Keywords: Styrene Monomer, Artificial Neural Network, Catalyst Deactivation, Fuzzy
1. Introduction Styrene Monomer or Vinyl Benzene is one of the most important monomers used in petrochemical industries for production of polymeric materials such as polystyrene, acrylonitrile-styrene, acrylonitrile-butadiene-styrene (ABS), and latex styrene-butadiene [1]. Due to wide application of styrene for production of various materials, it is produced in large amounts in petrochemical units. It must be mentioned that in 2012,
styrene monomer production worldwide exceeded 26.4-million tonnes [2]. Therefore, finding the optimal conditions for styrene production in petrochemical reactors has great economic value. The most important techniques for commercial production of styrene are catalytic dehydrogenation of ethyl benzene and oxidation of ethyl benzene to ethyl benzene hydro peroxide after which ethyl benzene hydro peroxide reacts with propane in order to produce styrene and
Aghayarzadeh, Alizadeh, Shafiei
Iranian Journal of Chemical Engineering, Vol.11, No. 1 31
propylene oxide [1,3-4]. Catalytic dehydrogenation route using potassium promoted iron oxide as a catalyst has been used to produce most of the required styrene since 1957 [5, 6]. Catalyst deactivation is a serious issue that decreases production of styrene monomer. On the other hand, the great need of industry for styrene production forces producers to increase production rate. This results in hasty catalyst deactivation and it seems to be a somewhat inevitable process in styrene monomer reactors. In order to find the optimal condition, such as steam oil ratio or temperature for styrene production to obtain high productivity, researchers have conducted further investigations to study various aspects of this reaction. During the last decades, a great deal of effort was put into studying the modeling, simulation, and optimization of styrene reactors [7-9]. Sheel and Crow [10] modeled adiabatic styrene reactor using pseudo- homogeneous model to determine rate constants and heat of reactions in industrial styrene reactor. This model has been widely used by many researchers for simulation and optimization of styrene production reactors [8, 11]. A rigorous heterogeneous model was developed by Elnashaiea et al. [12] to extract intrinsic data from industrial reactors. Lee et al. [9] modeled the ethylbenzene dehydrogenation reaction into styrene by proposing a set of intrinsic rate equations. This kinetic model satisfied the experimental data including temperature, feed molar ratios of steam to ethylbenzene, that of styrene to ethylbenzene, and hydrogen to ethylbenzene ratio. Some studies were focused on the simultaneous optimization of multiple objectives [8, 11]. Yee et al. [8] carried out
multi objective optimization to derive optimal conditions for adiabatic and steam-injected styrene reactors using non-dominated sorting genetic algorithm (NSGA). They used kinetic models for simulation of reactors, and NSGA for optimization. It was found that NSGA could be a reasonable method for multi-objective optimization and also the optimal results are accurate in case of several measurements [8]. Artificial neural networks can correlate the output data with the input data according to preferred algorithm, which is introduced by the researcher. Neural network modeling has been widely applied in different areas of science including chemical engineering [13, 14]. Kito et al [14] used neural network modeling to estimate catalytic performance in the oxidative dehydrogenation of ethylbenzene on different catalysts. In a research conducted by Lim et al. [15] styrene monomer reactor system was modeled by taking into account the catalyst deactivation. The model is composed of a mathematical model and a neural network model. Moreover, optimization of variables was conducted by holding other operating factors constant at their average values. In this work, styrene production reactors of Tabriz Petrochemical Complex were modeled using Artificial Neural Network (ANN). Afterward, the trained neural network was used to study the effect of parameters such as steam oil ratio and oxygen flow rate on the styrene monomer production. The main objective of this work is to optimize the styrene monomer production by considering the mentioned parameters. Since the catalyst deactivation could be an effective parameter on the
Simulation and Optimization of Styrene Monomer Production Using Neural Network
32 Iranian Journal of Chemical Engineering, Vol. 11, No. 1
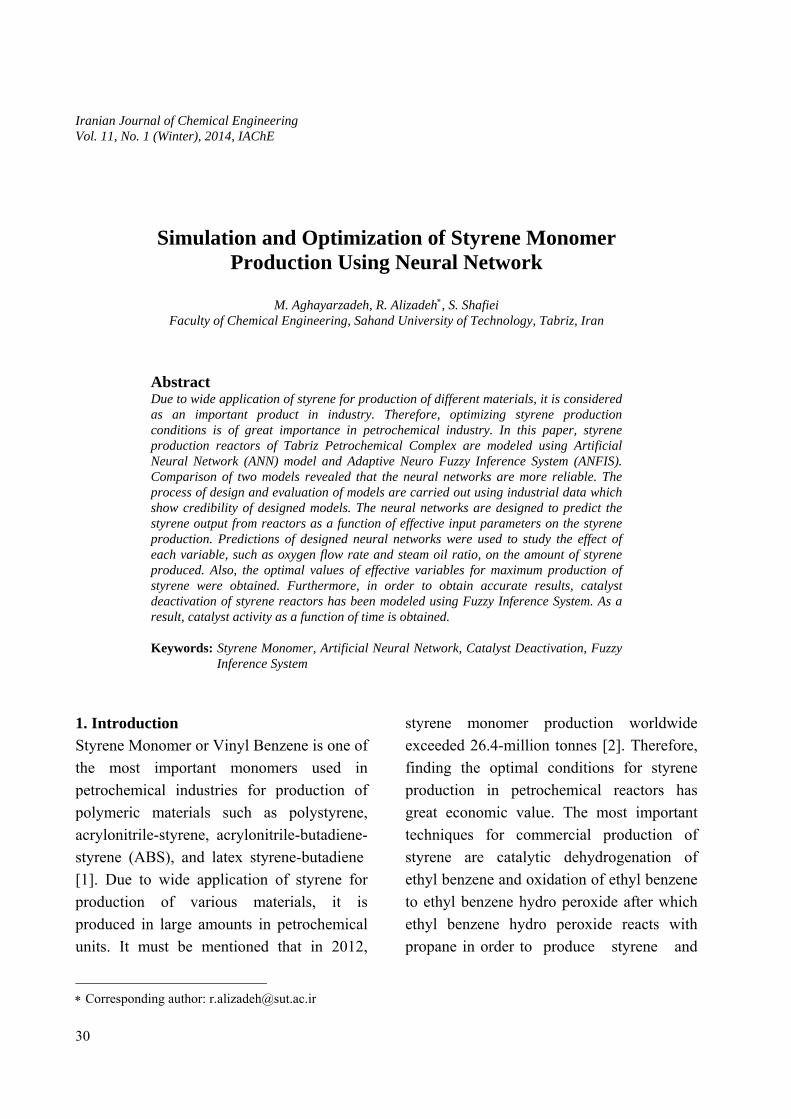
production and optimization of styrene monomer, catalyst deactivation is taken into consideration and its activity as a function of time is studied. 2. Process description The ethylbenzene dehydrogenation reaction (Reaction (1)) into styrene monomer is an endothermic reaction [10]. This reaction is conducted in presence of steam over iron oxide based catalyst at temperatures above 600°C. Styrene reactors of Tabriz Petrochemical Complex are radial and adiabatic. In the reaction unit, ethyl benzene is dehydrogenated in three fixed bed reactors connected in series [16]. The schematic of styrene monomer unit is shown in Fig. 1. C6H5 – CH2CH3 ↔ C6H5 – CH = CH2 + H2 Reaction (1)
Figure 1. Schematic of styrene monomer reactors. The feed to this unit is azoetrope mixture of steam, fresh ethylbenzene and recycled unreacted ethyl benzene from the third reactor, which are introduced to the first reactor. Afterwards, the outlet of the first reactor is mixed with superheated steam, into which the oxygen is injected from oxygen
package, and is directed to the second reactor. In the same way, the outlet of the second reactor is mixed with vapor, with oxygen injection, and is introduced to the third reactor [16]. 3. Results and discussion 3-1. Neural network modeling and results In the mathematical model, estimation of styrene output from styrene monomer reactors is possible by using balance equations and catalyst activity as a function of time. The catalyst activity decreases during reaction. Four major parameters, including coke formation, promoters loss or their redistribution, catalyst reduction, physical degradation of catalyst, have been considered to cause catalyst deactivation. Since these parameters interact with each other and occur simultaneously, calculation of catalyst deactivation is complicated [1, 17]. Therefore, neural network modeling can be a suitable alternative to evaluate styrene monomer production and catalyst deactivation. In artificial neural network modeling, a set of input data along with output data are given to neural network. Neural network calculates a set of output data and it repetitively adjusts its own pattern using the given algorithm to make calculated output data as close as possible to the given output data. Then, the trained network pattern is used to calculate unknown output data according to the input data. Styrene monomer reactor modeling by neural networks was carried out using data from styrene monomer reactor unit of Tabriz Petrochemical Complex from 2007 to 2010. A set of 75% of data was randomly selected for training of network and the rest was used
Styrene monomer
Third reactor Second reactor First reactor
Oxygen
Ethylbenzene
Steam
Aghayarzadeh, Alizadeh, Shafiei
Iranian Journal of Chemical Engineering, Vol.11, No. 1 33
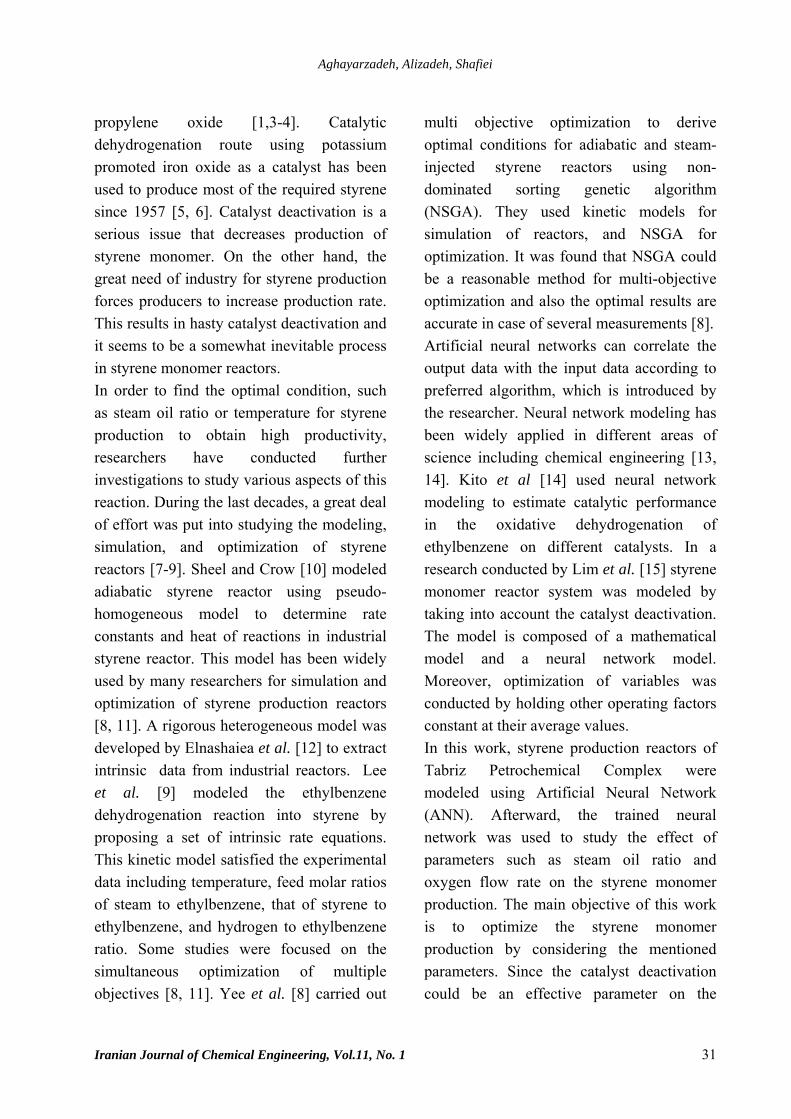
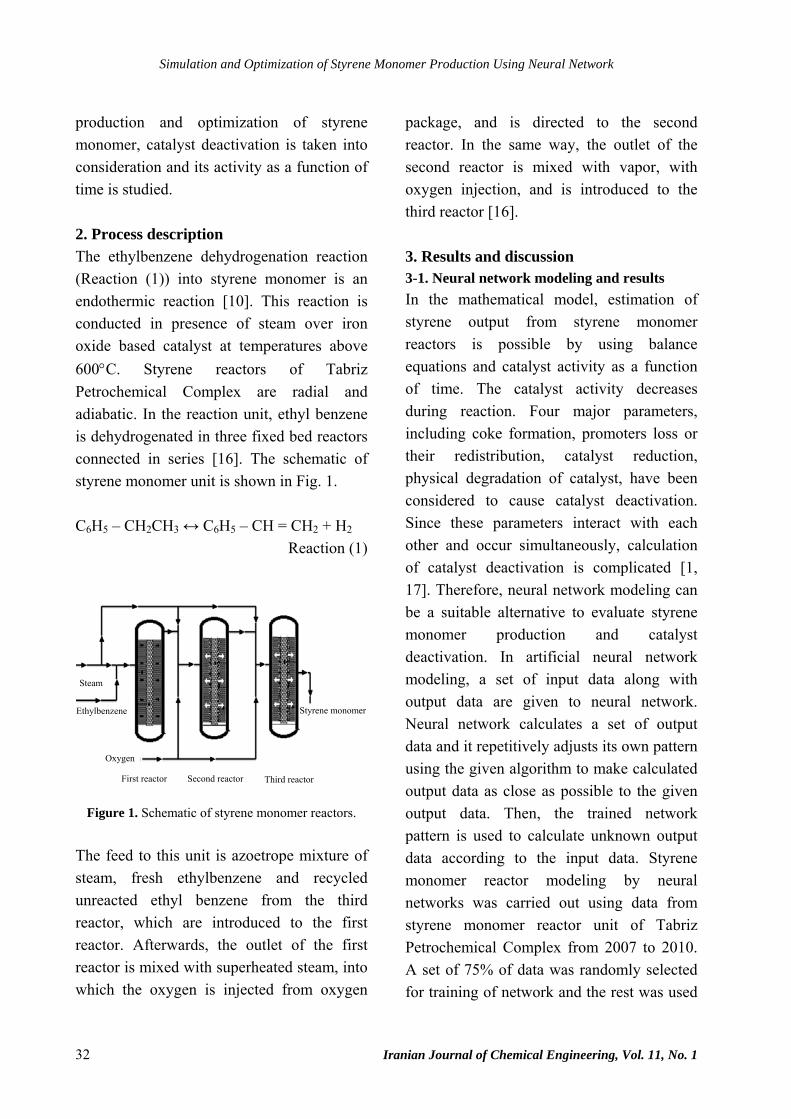
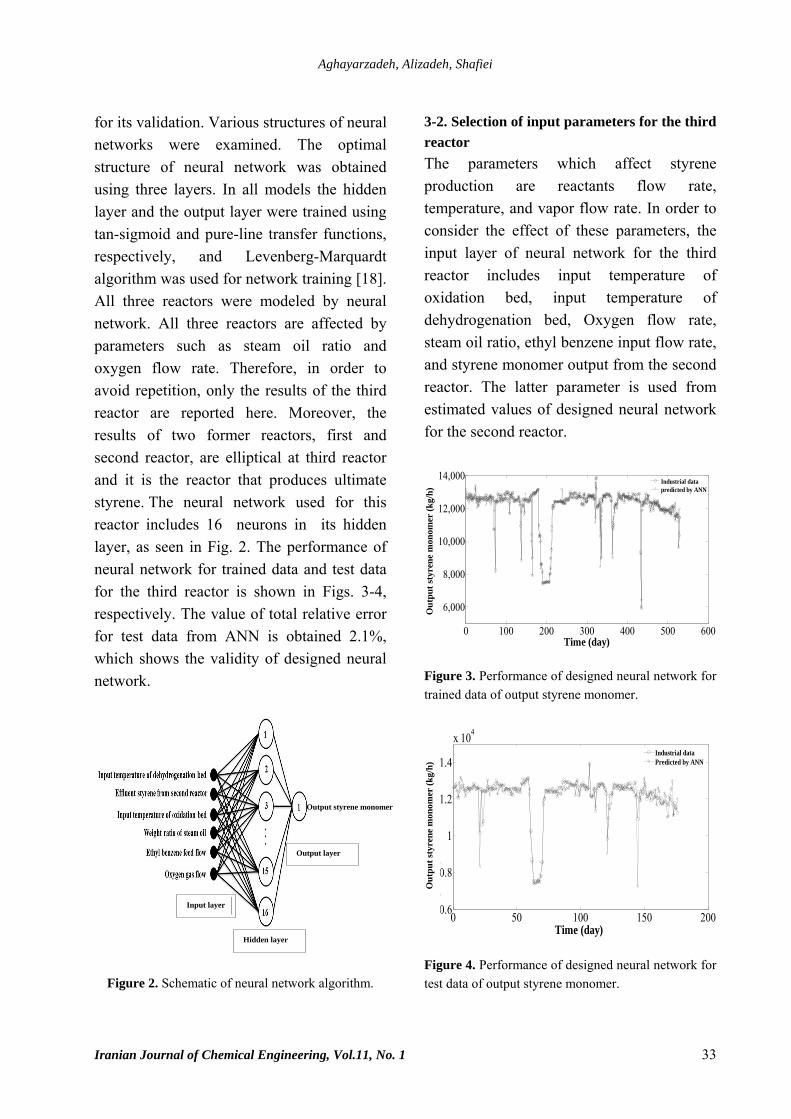
for its validation. Various structures of neural networks were examined. The optimal structure of neural network was obtained using three layers. In all models the hidden layer and the output layer were trained using tan-sigmoid and pure-line transfer functions, respectively, and Levenberg-Marquardt algorithm was used for network training [18]. All three reactors were modeled by neural network. All three reactors are affected by parameters such as steam oil ratio and oxygen flow rate. Therefore, in order to avoid repetition, only the results of the third reactor are reported here. Moreover, the results of two former reactors, first and second reactor, are elliptical at third reactor and it is the reactor that produces ultimate styrene. The neural network used for this reactor includes 16 neurons in its hidden layer, as seen in Fig. 2. The performance of neural network for trained data and test data for the third reactor is shown in Figs. 3-4, respectively. The value of total relative error for test data from ANN is obtained 2.1%, which shows the validity of designed neural network.
Figure 2. Schematic of neural network algorithm.
3-2. Selection of input parameters for the third reactor The parameters which affect styrene production are reactants flow rate, temperature, and vapor flow rate. In order to consider the effect of these parameters, the input layer of neural network for the third reactor includes input temperature of oxidation bed, input temperature of dehydrogenation bed, Oxygen flow rate, steam oil ratio, ethyl benzene input flow rate, and styrene monomer output from the second reactor. The latter parameter is used from estimated values of designed neural network for the second reactor.
0 100 200 300 400 500 600
6,000
8,000
10,000
12,000
14,000
Time (day)
Out
put S
tyre
ne M
onom
er (k
g/hr
)
Industrial datapredicted by ANN
Figure 3. Performance of designed neural network for trained data of output styrene monomer.
0 50 100 150 2000.6
0.8
1
1.2
1.4
x 104
Time (day)
Out
put S
tyre
ne M
onom
er (k
g/hr
)
Industrial dataPredicted by ANN
Figure 4. Performance of designed neural network for test data of output styrene monomer.
Output styrene monomer
Output layer
Hidden layer
Input layer
Out
put s
tyre
ne m
onom
er (k
g/h)
O
utpu
t sty
rene
mon
omer
(kg/
h)
Simulation and Optimization of Styrene Monomer Production Using Neural Network
34 Iranian Journal of Chemical Engineering, Vol. 11, No. 1
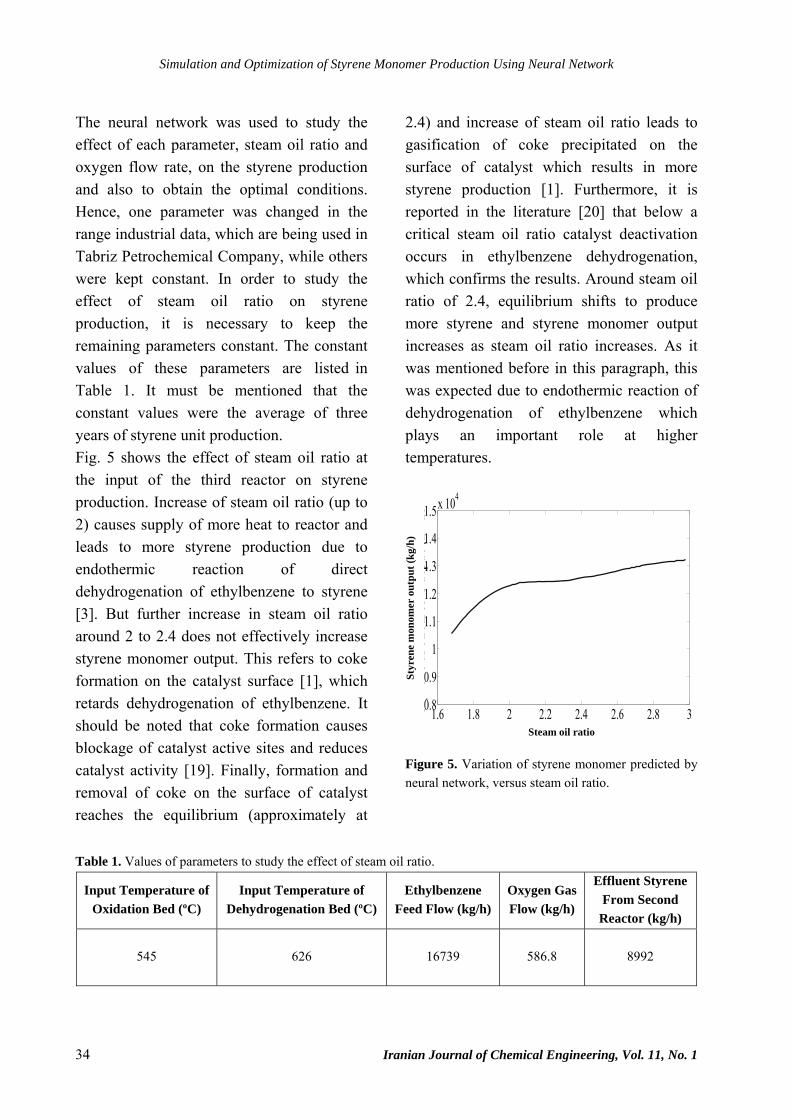
The neural network was used to study the effect of each parameter, steam oil ratio and oxygen flow rate, on the styrene production and also to obtain the optimal conditions. Hence, one parameter was changed in the range industrial data, which are being used in Tabriz Petrochemical Company, while others were kept constant. In order to study the effect of steam oil ratio on styrene production, it is necessary to keep the remaining parameters constant. The constant values of these parameters are listed in Table 1. It must be mentioned that the constant values were the average of three years of styrene unit production. Fig. 5 shows the effect of steam oil ratio at the input of the third reactor on styrene production. Increase of steam oil ratio (up to 2) causes supply of more heat to reactor and leads to more styrene production due to endothermic reaction of direct dehydrogenation of ethylbenzene to styrene [3]. But further increase in steam oil ratio around 2 to 2.4 does not effectively increase styrene monomer output. This refers to coke formation on the catalyst surface [1], which retards dehydrogenation of ethylbenzene. It should be noted that coke formation causes blockage of catalyst active sites and reduces catalyst activity [19]. Finally, formation and removal of coke on the surface of catalyst reaches the equilibrium (approximately at
2.4) and increase of steam oil ratio leads to gasification of coke precipitated on the surface of catalyst which results in more styrene production [1]. Furthermore, it is reported in the literature [20] that below a critical steam oil ratio catalyst deactivation occurs in ethylbenzene dehydrogenation, which confirms the results. Around steam oil ratio of 2.4, equilibrium shifts to produce more styrene and styrene monomer output increases as steam oil ratio increases. As it was mentioned before in this paragraph, this was expected due to endothermic reaction of dehydrogenation of ethylbenzene which plays an important role at higher temperatures.
1.6 1.8 2 2.2 2.4 2.6 2.8 30.8
0.9
1
1.1
1.2
1.3
1.4
1.5x 10⁴
Steam Oil Ratio
Styr
ene
Mon
omer
Out
put (
kg/h
r)
Figure 5. Variation of styrene monomer predicted by neural network, versus steam oil ratio.
Table 1. Values of parameters to study the effect of steam oil ratio.
Input Temperature of Oxidation Bed (ºC)
Input Temperature of Dehydrogenation Bed (ºC)
Ethylbenzene Feed Flow (kg/h)
Oxygen Gas Flow (kg/h)
Effluent Styrene From Second
Reactor (kg/h)
545 626 16739 586.8 8992
Styr
ene
mon
omer
out
put (
kg/h
)
Steam oil ratio
Aghayarzadeh, Alizadeh, Shafiei
Iranian Journal of Chemical Engineering, Vol.11, No. 1 35
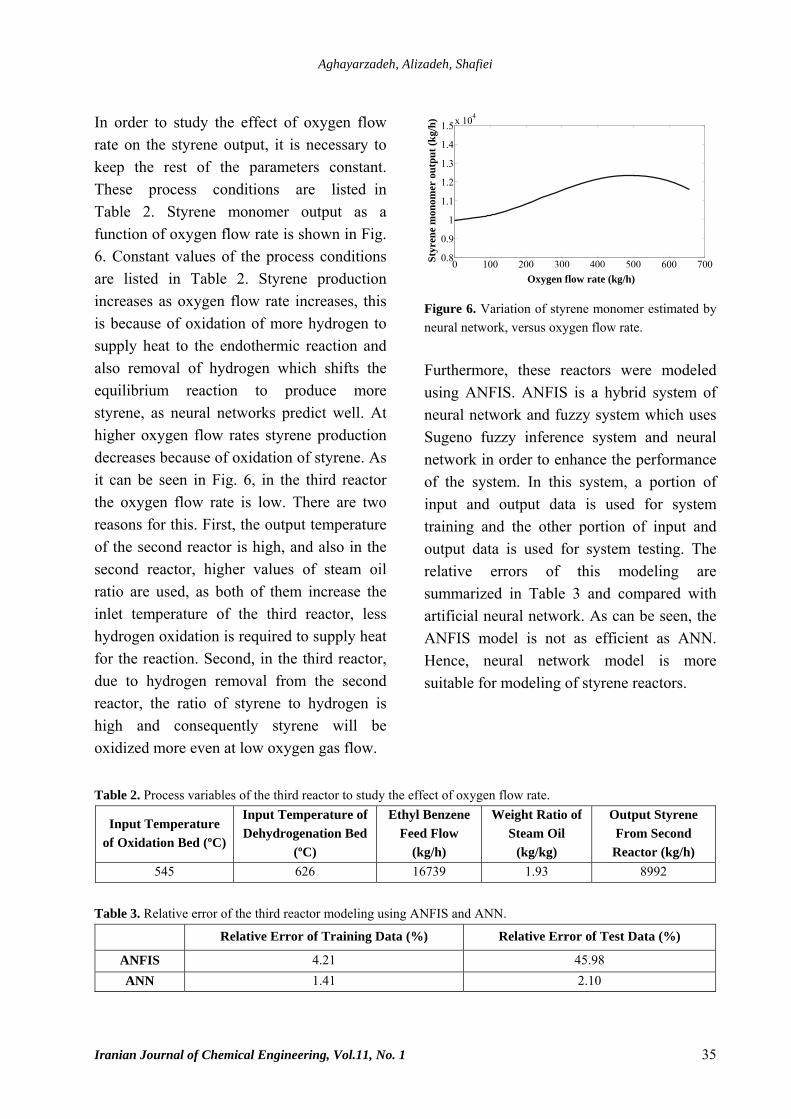
In order to study the effect of oxygen flow rate on the styrene output, it is necessary to keep the rest of the parameters constant. These process conditions are listed in Table 2. Styrene monomer output as a function of oxygen flow rate is shown in Fig. 6. Constant values of the process conditions are listed in Table 2. Styrene production increases as oxygen flow rate increases, this is because of oxidation of more hydrogen to supply heat to the endothermic reaction and also removal of hydrogen which shifts the equilibrium reaction to produce more styrene, as neural networks predict well. At higher oxygen flow rates styrene production decreases because of oxidation of styrene. As it can be seen in Fig. 6, in the third reactor the oxygen flow rate is low. There are two reasons for this. First, the output temperature of the second reactor is high, and also in the second reactor, higher values of steam oil ratio are used, as both of them increase the inlet temperature of the third reactor, less hydrogen oxidation is required to supply heat for the reaction. Second, in the third reactor, due to hydrogen removal from the second reactor, the ratio of styrene to hydrogen is high and consequently styrene will be oxidized more even at low oxygen gas flow.
0 100 200 300 400 500 600 7000.8
0.9
1
1.1
1.2
1.3
1.4
1.5x 10⁴
Oxygen Flow Rate (kg/hr)
Styr
ene
Mon
omer
Out
put (
kg/h
r)
Figure 6. Variation of styrene monomer estimated by neural network, versus oxygen flow rate. Furthermore, these reactors were modeled using ANFIS. ANFIS is a hybrid system of neural network and fuzzy system which uses Sugeno fuzzy inference system and neural network in order to enhance the performance of the system. In this system, a portion of input and output data is used for system training and the other portion of input and output data is used for system testing. The relative errors of this modeling are summarized in Table 3 and compared with artificial neural network. As can be seen, the ANFIS model is not as efficient as ANN. Hence, neural network model is more suitable for modeling of styrene reactors.
Table 2. Process variables of the third reactor to study the effect of oxygen flow rate.
Input Temperature of Oxidation Bed (ºC)
Input Temperature of Dehydrogenation Bed
(ºC)
Ethyl Benzene Feed Flow
(kg/h)
Weight Ratio of Steam Oil
(kg/kg)
Output Styrene From Second
Reactor (kg/h) 545 626 16739 1.93 8992
Table 3. Relative error of the third reactor modeling using ANFIS and ANN.
Relative Error of Training Data (%) Relative Error of Test Data (%)
ANFIS 4.21 45.98 ANN 1.41 2.10
Oxygen flow rate (kg/h)
Styr
ene
mon
omer
out
put (
kg/h
)
Simulation and Optimization of Styrene Monomer Production Using Neural Network
36 Iranian Journal of Chemical Engineering, Vol. 11, No. 1
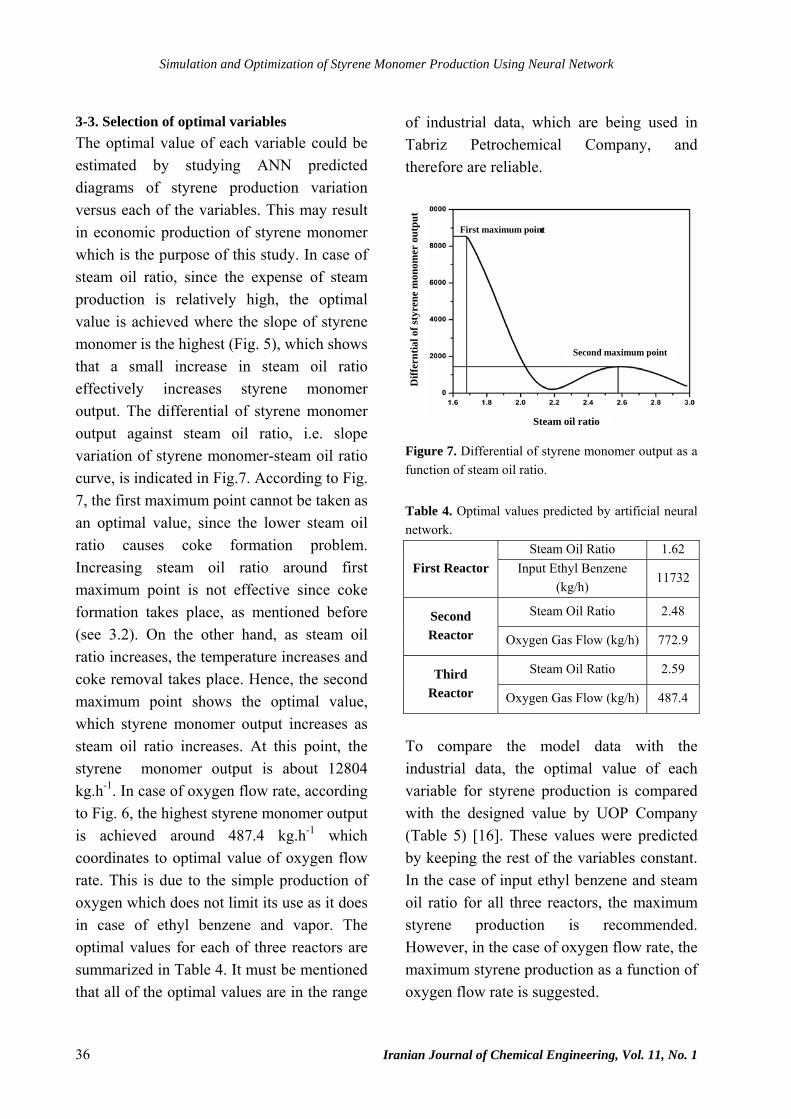
3-3. Selection of optimal variables The optimal value of each variable could be estimated by studying ANN predicted diagrams of styrene production variation versus each of the variables. This may result in economic production of styrene monomer which is the purpose of this study. In case of steam oil ratio, since the expense of steam production is relatively high, the optimal value is achieved where the slope of styrene monomer is the highest (Fig. 5), which shows that a small increase in steam oil ratio effectively increases styrene monomer output. The differential of styrene monomer output against steam oil ratio, i.e. slope variation of styrene monomer-steam oil ratio curve, is indicated in Fig.7. According to Fig. 7, the first maximum point cannot be taken as an optimal value, since the lower steam oil ratio causes coke formation problem. Increasing steam oil ratio around first maximum point is not effective since coke formation takes place, as mentioned before (see 3.2). On the other hand, as steam oil ratio increases, the temperature increases and coke removal takes place. Hence, the second maximum point shows the optimal value, which styrene monomer output increases as steam oil ratio increases. At this point, the styrene monomer output is about 12804 kg.h-1. In case of oxygen flow rate, according to Fig. 6, the highest styrene monomer output is achieved around 487.4 kg.h-1 which coordinates to optimal value of oxygen flow rate. This is due to the simple production of oxygen which does not limit its use as it does in case of ethyl benzene and vapor. The optimal values for each of three reactors are summarized in Table 4. It must be mentioned that all of the optimal values are in the range
of industrial data, which are being used in Tabriz Petrochemical Company, and therefore are reliable.
Figure 7. Differential of styrene monomer output as a function of steam oil ratio. Table 4. Optimal values predicted by artificial neural network.
First Reactor Steam Oil Ratio 1.62
Input Ethyl Benzene (kg/h)
11732
Second Reactor
Steam Oil Ratio 2.48
Oxygen Gas Flow (kg/h) 772.9
Third Reactor
Steam Oil Ratio 2.59
Oxygen Gas Flow (kg/h) 487.4
To compare the model data with the industrial data, the optimal value of each variable for styrene production is compared with the designed value by UOP Company (Table 5) [16]. These values were predicted by keeping the rest of the variables constant. In the case of input ethyl benzene and steam oil ratio for all three reactors, the maximum styrene production is recommended. However, in the case of oxygen flow rate, the maximum styrene production as a function of oxygen flow rate is suggested.
Diff
ernt
ial o
f sty
rene
mon
omer
out
put
Steam oil ratio
Second maximum point
First maximum point
Aghayarzadeh, Alizadeh, Shafiei
Iranian Journal of Chemical Engineering, Vol.11, No. 1 37
Table 5. Comparison of optimal values predicted by model and designed values by UOP.
Variables Values
Predicted by Model
Designed Values by
UOP Input Ethyl Benzene to the First Reactor
(kg/h) 16954 17781.7
Steam Oil Ratio of the First Reactor
1.75 1.28
Steam Oil Ratio of the Second Reactor
2.26 1.569
Steam Oil Ratio of the Third Reactor
2.59 1.892
Oxygen Flow to the Second Reactor (kg/h)
755.5 743.8
Oxygen Flow to the Third Reactor (kg/h)
487.4 515.4
As it can be seen in Table 5, the values of input ethyl benzene and oxygen flow are close to the designed values of UOP, but in the case of steam oil ratio, the recommended values by neural network differs significantly. 3-4. Catalyst deactivation Due to the measurement problems for catalyst deactivation in styrene reactors, obtaining an accurate model for styrene catalysts deactivation has not been possible until now. Artificial neural network and Fuzzy Inference System (FIS) are the most suitable methods to model catalyst deactivation, since they only require input and output data. In this part, deactivation of catalyst is investigated and a model is derived for catalyst deactivation. Fuzzy inference system (FIS) is a way of mapping input data to output data using fuzzy logic. In FIS, the input data are fuzzified and transformed into the values,
then they are evaluated by rule evaluator and at the end the values are transformed to output by defuzzification. One of the widely used fuzzy systems is Sugeno method. FIS uses a set of input data for training and the remaining data for testing the method. During ethylbenzene dehydrogenation, six independent reactions (Reaction (2) to (6)) including a major reaction of ethylbenzene dehydrogenation into styrene and five side reactions occur [10]. C6H5CH2CH3 → C6H6 + C2H4 Reaction (2) C6H5CH2CH3 → C6H5CH3 + CH4 Reaction (3) 2H2O + C2H4 → 2CO + 4H2 Reaction (4) H2O + CH4 → CO + 3H2 Reaction (5) H2O + CO → CO2 Reaction (6) Elnashaie et al. [12] presented kinetic equations for the above mentioned reactions using power law of kinetic model. The kinetic equation for styrene reaction is formulated as follows:
2
90891 4
1
8320.
St HRTEB EB
P Pr e . P
K− ⎛ ⎞
− = −⎜ ⎟⎝ ⎠
(1)
where rEB is reaction rate, PEB is partial pressure of ethylbenzene, PSt is partial pressure of styrene,
2HP is partial pressure of
hydrogen component, T is the temperature, R is gas constant and K1 is the rate constant. Since the proposed reaction rate constants [12] are intrinsic, they could be used for any
Simulation and Optimization of Styrene Monomer Production Using Neural Network
38 Iranian Journal of Chemical Engineering, Vol. 11, No. 1
reactor condition. The rate constant of this reaction is calculated as follows:
21 2 0 3 0
1( c c T c T )K exp( )RT
+ += − (2)
where the c1, c2 and c3 are constant values and are equal to 122725.157 kJ kmol-1, -126.267 kJ kmol-1 K-1 and -٢.١٩×١٠۴-3kJ kmol-1 K-2. Catalyst activity of third reactor based on the bed average temperature (T) and catalyst functioning time (t) were estimated here. It must be mentioned that in fuzzy logic system the output temperature of each reactor is estimated by input variables of each reactor. Catalyst activity as a function of time is as follows:
rete of reaction at time tactivityrate of reaction by fresh catalyst
= (3)
The objective of this part is to estimate catalyst activity as a function of temperature to obtain constant conversion. Combining Equation (1) to (3):
2
90891 4
21 2 0 3 0
8320.
STY HRTEB EB
P Pr e ( P )
c c T c Texp RT
α−
− = −⎛ ⎞+ + +−⎜ ⎟⎝ ⎠
(4) where a is the catalyst activity. The conversion will be in a steady level, if
1
11( )K
α− is constant. When the catalyst
activity begins to decrease gradually, the temperature has to be increased to keep it in a steady manner.
At the beginning of process, when the catalyst is fresh, the catalyst activity is 1 and the temperature is assumed to be T0.
0
90891 4
21 2 0 3 0
0
18320 1 1.
RTe . cte( c c T c T )exp( )RT
−⎛ ⎞⎜ ⎟− =⎜ ⎟
+ +⎜ ⎟−⎜ ⎟⎝ ⎠
(5)
Based on Equation (5), kinetic reactions and R=8.314 J mol-1 k-1, the final equation for catalyst activity as a function of bed average temperature (T) is as follows:
0
41 1 010932 331
0
4
11 14761 265 1458 2 639 10
11 14761 265 1458 2 639 10
. ( )T T
.exp( . T )T
e
.exp( . T )T
α
−
− −
−
⎛ ⎞⎜ ⎟⎜ ⎟−⎜ ⎟− + + × ×⎜ ⎟⎝ ⎠=⎛ ⎞⎜ ⎟−⎜ ⎟
⎜ ⎟− + + × ×⎝ ⎠
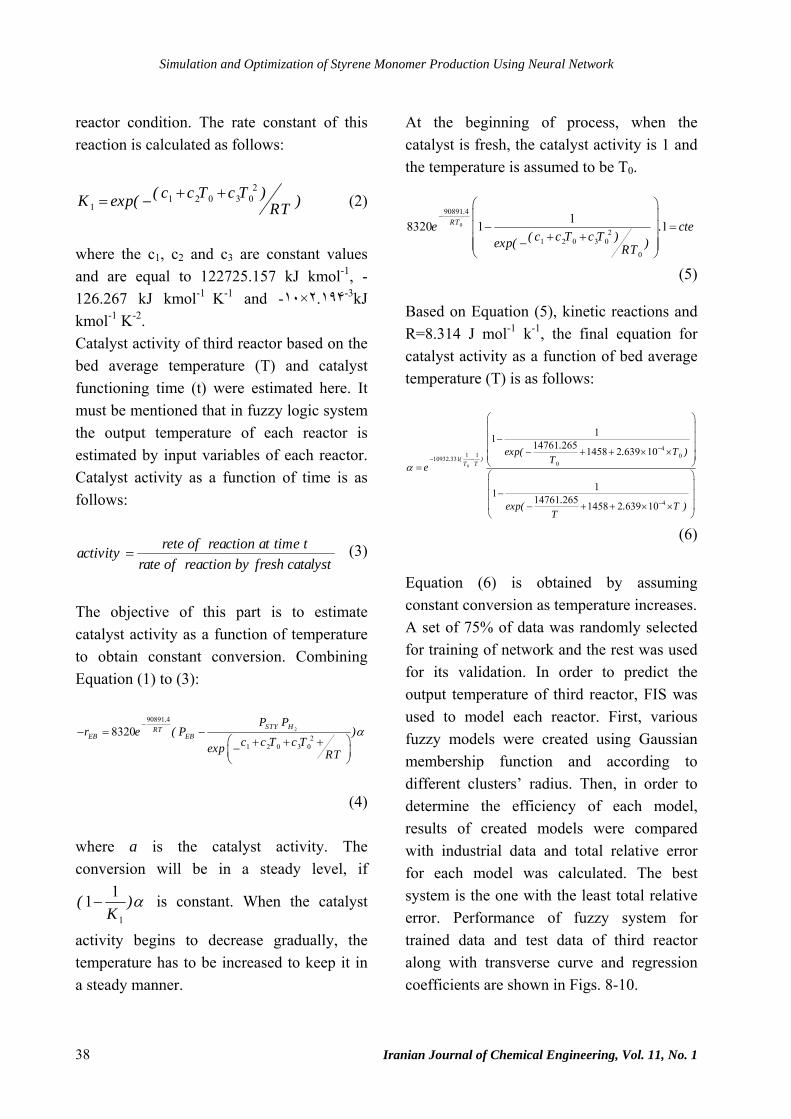
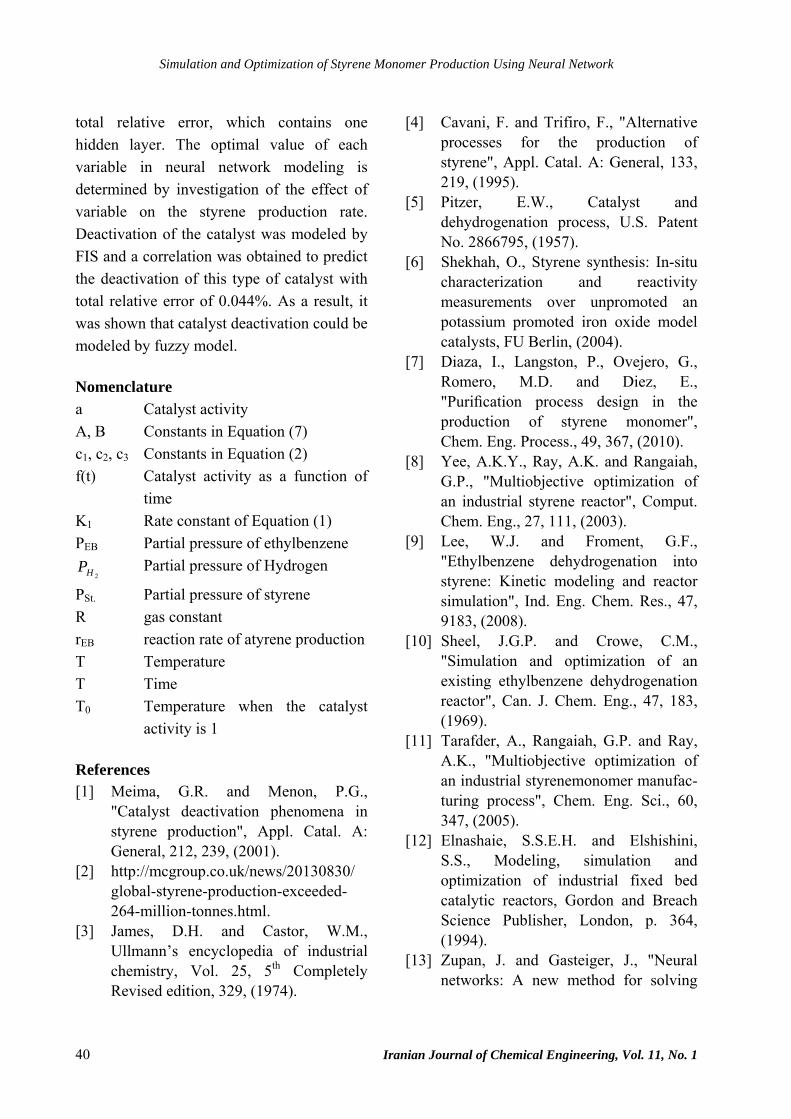
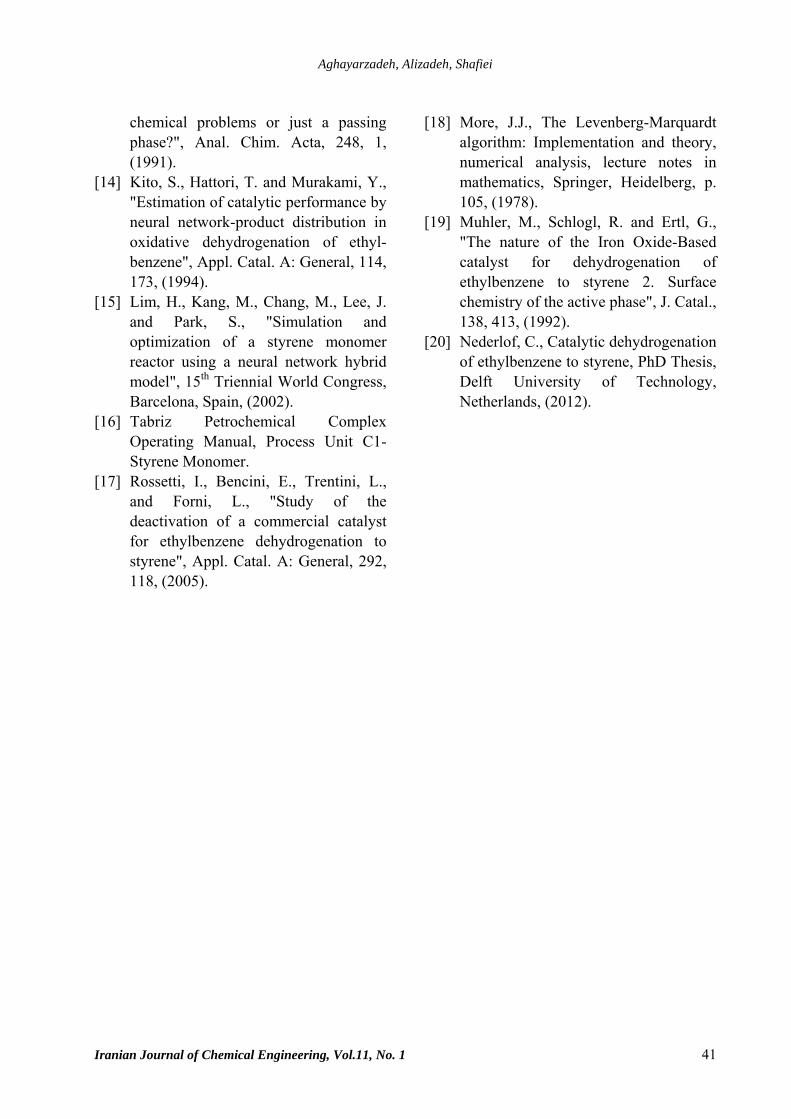
(6) Equation (6) is obtained by assuming constant conversion as temperature increases. A set of 75% of data was randomly selected for training of network and the rest was used for its validation. In order to predict the output temperature of third reactor, FIS was used to model each reactor. First, various fuzzy models were created using Gaussian membership function and according to different clusters’ radius. Then, in order to determine the efficiency of each model, results of created models were compared with industrial data and total relative error for each model was calculated. The best system is the one with the least total relative error. Performance of fuzzy system for trained data and test data of third reactor along with transverse curve and regression coefficients are shown in Figs. 8-10.
Aghayarzadeh, Alizadeh, Shafiei
Iranian Journal of Chemical Engineering, Vol.11, No. 1 39
0 100 200 300 400 500 600560
570
580
590
600
610
620
Time (day)
Out
put T
empr
atur
e(C
)
Industrial dataPredicted by FIS
Figure 8. Comparison of estimated output temperature using Sugeno fuzzy model with industrial trained data.
0 20 40 60 80 100 120 140 160 180
580
590
600
610
620
Time (day)
Out
put T
empr
atur
e (C
)
Industrial dataPredicted by FIS
Figure 9. Comparison of estimated output temperature using Sugeno fuzzy model with industrial test data.
Figure 10. Transverse curve and regression coefficient of estimated output temperature by Sugeno Fuzzy model and industrial data. FIS. Using predicted temperature by Fuzzy model and Equation (6), catalyst activity of the third
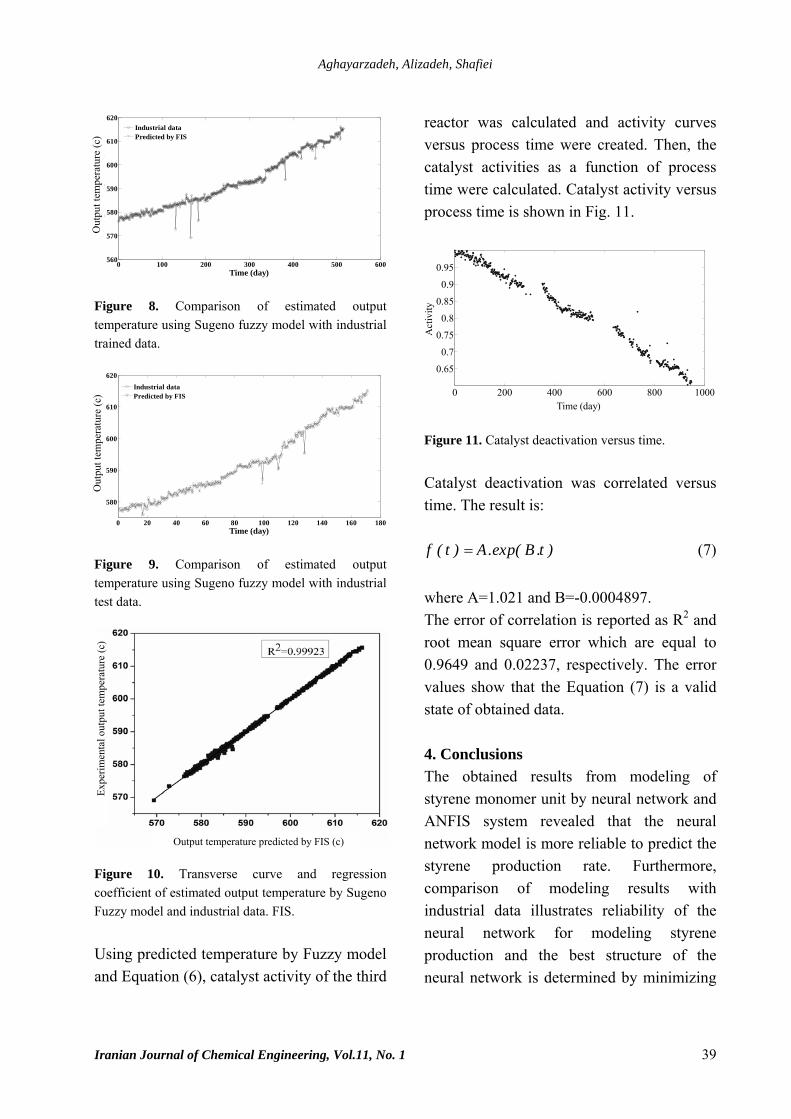
reactor was calculated and activity curves versus process time were created. Then, the catalyst activities as a function of process time were calculated. Catalyst activity versus process time is shown in Fig. 11.
0 200 400 600 800 1000
0.65
0.7
0.75
0.8
0.85
0.9
0.95
Time (day)
Act
ivity
Figure 11. Catalyst deactivation versus time. Catalyst deactivation was correlated versus time. The result is: f ( t ) A.exp( B .t )= (7) where A=1.021 and B=-0.0004897. The error of correlation is reported as R2 and root mean square error which are equal to 0.9649 and 0.02237, respectively. The error values show that the Equation (7) is a valid state of obtained data. 4. Conclusions The obtained results from modeling of styrene monomer unit by neural network and ANFIS system revealed that the neural network model is more reliable to predict the styrene production rate. Furthermore, comparison of modeling results with industrial data illustrates reliability of the neural network for modeling styrene production and the best structure of the neural network is determined by minimizing
Out
put t
empe
ratu
re (c
)
Output temperature predicted by FIS (c)
Out
put t
empe
ratu
re (c
) Ex
perim
enta
l out
put t
empe
ratu
re (c
)
Simulation and Optimization of Styrene Monomer Production Using Neural Network
40 Iranian Journal of Chemical Engineering, Vol. 11, No. 1
total relative error, which contains one hidden layer. The optimal value of each variable in neural network modeling is determined by investigation of the effect of variable on the styrene production rate. Deactivation of the catalyst was modeled by FIS and a correlation was obtained to predict the deactivation of this type of catalyst with total relative error of 0.044%. As a result, it was shown that catalyst deactivation could be modeled by fuzzy model. Nomenclature a Catalyst activity A, B Constants in Equation (7) c1, c2, c3 Constants in Equation (2) f(t) Catalyst activity as a function of
time K1 Rate constant of Equation (1) PEB Partial pressure of ethylbenzene
2HP Partial pressure of Hydrogen
PSt. Partial pressure of styrene R gas constant rEB reaction rate of atyrene production T Temperature T Time T0 Temperature when the catalyst
activity is 1 References [1] Meima, G.R. and Menon, P.G.,
"Catalyst deactivation phenomena in styrene production", Appl. Catal. A: General, 212, 239, (2001).
[3] James, D.H. and Castor, W.M., Ullmann’s encyclopedia of industrial chemistry, Vol. 25, 5th Completely Revised edition, 329, (1974).
[4] Cavani, F. and Trifiro, F., "Alternative processes for the production of styrene", Appl. Catal. A: General, 133, 219, (1995).
[5] Pitzer, E.W., Catalyst and dehydrogenation process, U.S. Patent No. 2866795, (1957).
[6] Shekhah, O., Styrene synthesis: In-situ characterization and reactivity measurements over unpromoted an potassium promoted iron oxide model catalysts, FU Berlin, (2004).
[7] Diaza, I., Langston, P., Ovejero, G., Romero, M.D. and Diez, E., "Purification process design in the production of styrene monomer", Chem. Eng. Process., 49, 367, (2010).
[8] Yee, A.K.Y., Ray, A.K. and Rangaiah, G.P., "Multiobjective optimization of an industrial styrene reactor", Comput. Chem. Eng., 27, 111, (2003).
[9] Lee, W.J. and Froment, G.F., "Ethylbenzene dehydrogenation into styrene: Kinetic modeling and reactor simulation", Ind. Eng. Chem. Res., 47, 9183, (2008).
[10] Sheel, J.G.P. and Crowe, C.M., "Simulation and optimization of an existing ethylbenzene dehydrogenation reactor", Can. J. Chem. Eng., 47, 183, (1969).
[11] Tarafder, A., Rangaiah, G.P. and Ray, A.K., "Multiobjective optimization of an industrial styrenemonomer manufac-turing process", Chem. Eng. Sci., 60, 347, (2005).
[12] Elnashaie, S.S.E.H. and Elshishini, S.S., Modeling, simulation and optimization of industrial fixed bed catalytic reactors, Gordon and Breach Science Publisher, London, p. 364, (1994).
[13] Zupan, J. and Gasteiger, J., "Neural networks: A new method for solving
Aghayarzadeh, Alizadeh, Shafiei
Iranian Journal of Chemical Engineering, Vol.11, No. 1 41
chemical problems or just a passing phase?", Anal. Chim. Acta, 248, 1, (1991).
[14] Kito, S., Hattori, T. and Murakami, Y., "Estimation of catalytic performance by neural network-product distribution in oxidative dehydrogenation of ethyl-benzene", Appl. Catal. A: General, 114, 173, (1994).
[15] Lim, H., Kang, M., Chang, M., Lee, J. and Park, S., "Simulation and optimization of a styrene monomer reactor using a neural network hybrid model", 15th Triennial World Congress, Barcelona, Spain, (2002).
[16] Tabriz Petrochemical Complex Operating Manual, Process Unit C1-Styrene Monomer.
[17] Rossetti, I., Bencini, E., Trentini, L., and Forni, L., "Study of the deactivation of a commercial catalyst for ethylbenzene dehydrogenation to styrene", Appl. Catal. A: General, 292, 118, (2005).
[18] More, J.J., The Levenberg-Marquardt algorithm: Implementation and theory, numerical analysis, lecture notes in mathematics, Springer, Heidelberg, p. 105, (1978).
[19] Muhler, M., Schlogl, R. and Ertl, G., "The nature of the Iron Oxide-Based catalyst for dehydrogenation of ethylbenzene to styrene 2. Surface chemistry of the active phase", J. Catal., 138, 413, (1992).
[20] Nederlof, C., Catalytic dehydrogenation of ethylbenzene to styrene, PhD Thesis, Delft University of Technology, Netherlands, (2012).


![COMPOSITE POLYMERS - Creco Incorporated1].pdf · MOMENTUM 441-400 resins are low styrene monomer bisphenol-A epoxy vinyl ester resins ... COMPOSITE POLYMERS CHEMICAL RESISTANCE GUIDE](https://static.documents.pub/doc/80x56/5b7739197f8b9a47518c9387/composite-polymers-creco-1pdf-momentum-441-400-resins-are-low-styrene-monomer.jpg)

