14
SIMULATION PROJECT Campus Starbucks Coffee Center Niharika Senecha
| Date post: | 21-Jul-2015 |
| Category: |
Data & Analytics |
| Upload: | niharika-senecha |
| View: | 171 times |
| Download: | 8 times |

SIMULATION PROJECT Campus Starbucks Coffee Center
Niharika Senecha
CONTENTS
1 Introduction and Problem Environment 03
1.1 Introduction 03
1.2 Problem Statement 03
1.3 Assumptions 03
2 Model Fit 04
2.1 Data collections 04
2.2 Distributions 04
3 Arena Model 05
3.1 Modeling the system 05
3.2 Simulating the model 07
4 Results 09
5 Improving the System 10
5.1 Suggestion for improvement 10
5.2 Comparing the results 11
6 Conclusion 13
References 14

CHAPTER 1
INTRODUCTION AND PROBLEM ENVIRONMENT
1.1 Introduction
This project deals with the simulation of the Campus Starbucks Coffee Center using Arena
simulation software. The motivation behind this project is to model the shop in order to reduce the
long waiting time and increase the utilization of resources. While modeling the system, the
sequence of operations for different types of orders, the layout of the shop, the processing time of
each operation, etc. were considered. The model is run for one day. The results were analyzed and
a suggestion was also made to improve the system.
1.2 Problem Statement
Starbucks coffee center is one of the most crowded places on campus. According to the information
received from Starbucks, sometimes, the count of customers in a day approaches as high as 1000.
Given the popularity of the coffee center, the average waiting time during some busy days, reaches
around 10 minutes also! Considering the little amount of time students have in between their
classes, this can be a disadvantage to them as well as the Starbucks people. The simulation done in
this project is to find out and analyze how the existing system can be improved in order to lower
the average waiting time of each customer.
1.3 Assumptions
The following assumptions are made in the model:
1. The shop is open 13 hours a day.
2. There are no work shifts between the workers in the coffee center.
CHAPTER 2
MODEL FIT
2.1 Data Collection
With the permission from the Starbucks employees, I collected some random data for a day. The
inter-arrival times between customers, the average waiting time to place order, the average
waiting time to receive the order, the types of orders and their attendants, etc. were all noted
down. It was found that 70% of the orders are for beverages, 20% for snacks and 10% for cakes
and cookies.
2.2 Distributions
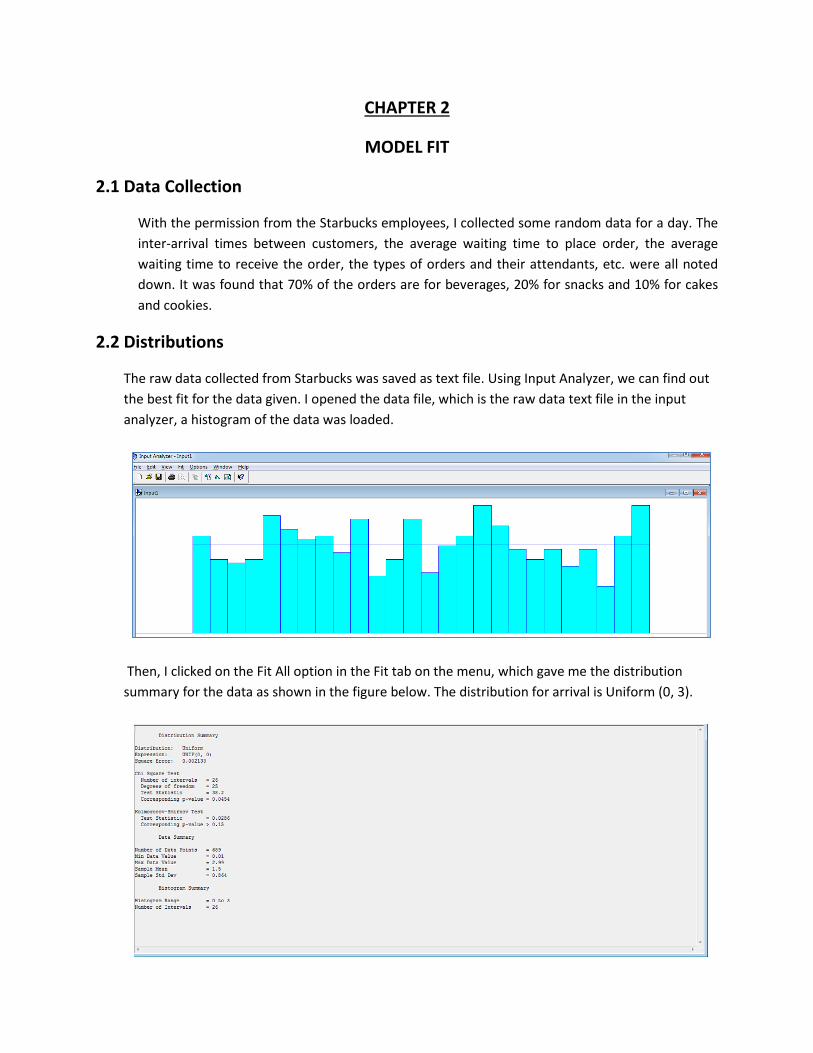
The raw data collected from Starbucks was saved as text file. Using Input Analyzer, we can find out
the best fit for the data given. I opened the data file, which is the raw data text file in the input
analyzer, a histogram of the data was loaded.
Then, I clicked on the Fit All option in the Fit tab on the menu, which gave me the distribution
summary for the data as shown in the figure below. The distribution for arrival is Uniform (0, 3).
CHAPTER 3
ARENA MODEL
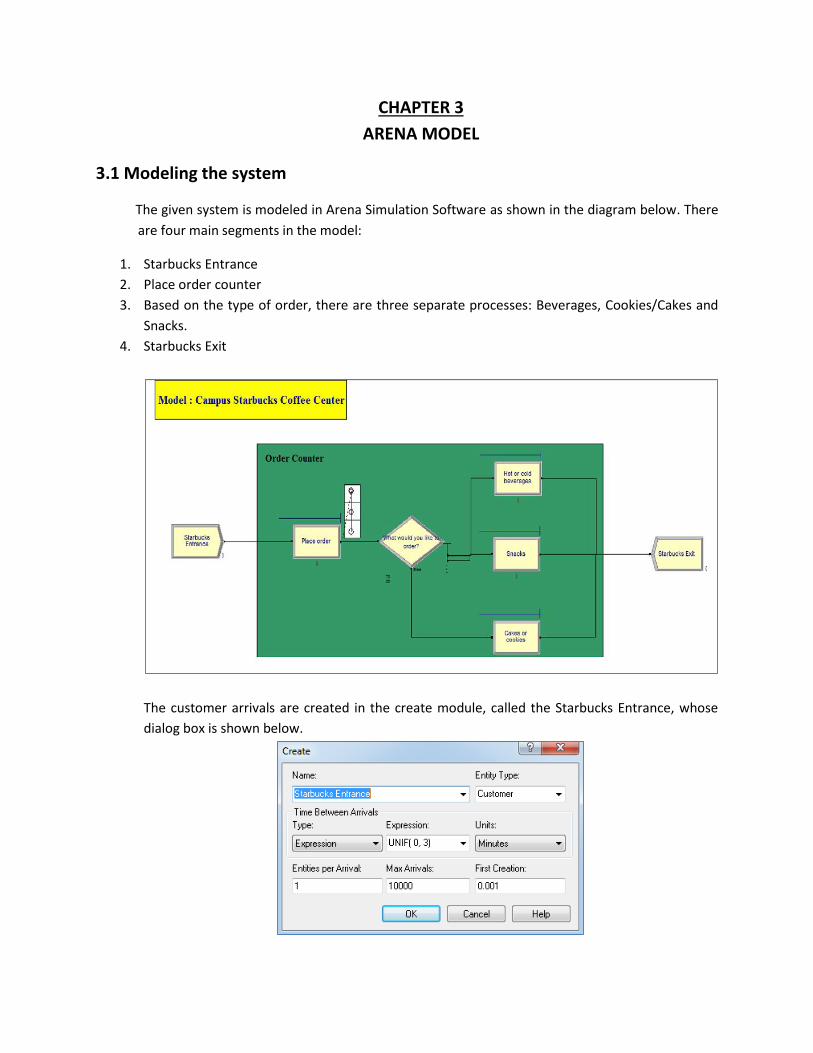
3.1 Modeling the system
The given system is modeled in Arena Simulation Software as shown in the diagram below. There
are four main segments in the model:
1. Starbucks Entrance
2. Place order counter
3. Based on the type of order, there are three separate processes: Beverages, Cookies/Cakes and
Snacks.
4. Starbucks Exit
The customer arrivals are created in the create module, called the Starbucks Entrance, whose
dialog box is shown below.

The distributions for the basic processes for placing order, and the different types of orders like
hot or cold beverages, snacks and cookies or cakes are triangular with the values as shown
below in the diagram.
The resource allocation for all processes was done as shown below.
For the decide module, the values were taken as shown below. It was observed that 70% of the
customers at Starbucks ordered beverages, 20% ordered snacks and the rest 10% ordered Cakes
or cookies. And hence, there are separate processes for each type of order.

The last segment is of the dispose module named as Starbucks Exit as shown below.
There were two statistics defined in order to measure and compare the existing model in terms
of its utilization. The statistics defined were Average Work in Progress and the average total
time taken by customers. They were defined as shown below.
3.2 Simulating the model
The ARENA Campus Starbucks coffee center model was simulated for one day. Parameters like
Replication length and Hours per day etc. were given in Run Setup. The diagram below shows it.

The replication length was given as 780 minutes as Starbucks is open for 13 hours in a day. Some
100 replications were carried out in order to compare results with the new improved model made
later.
CHAPTER 4
RESULTS
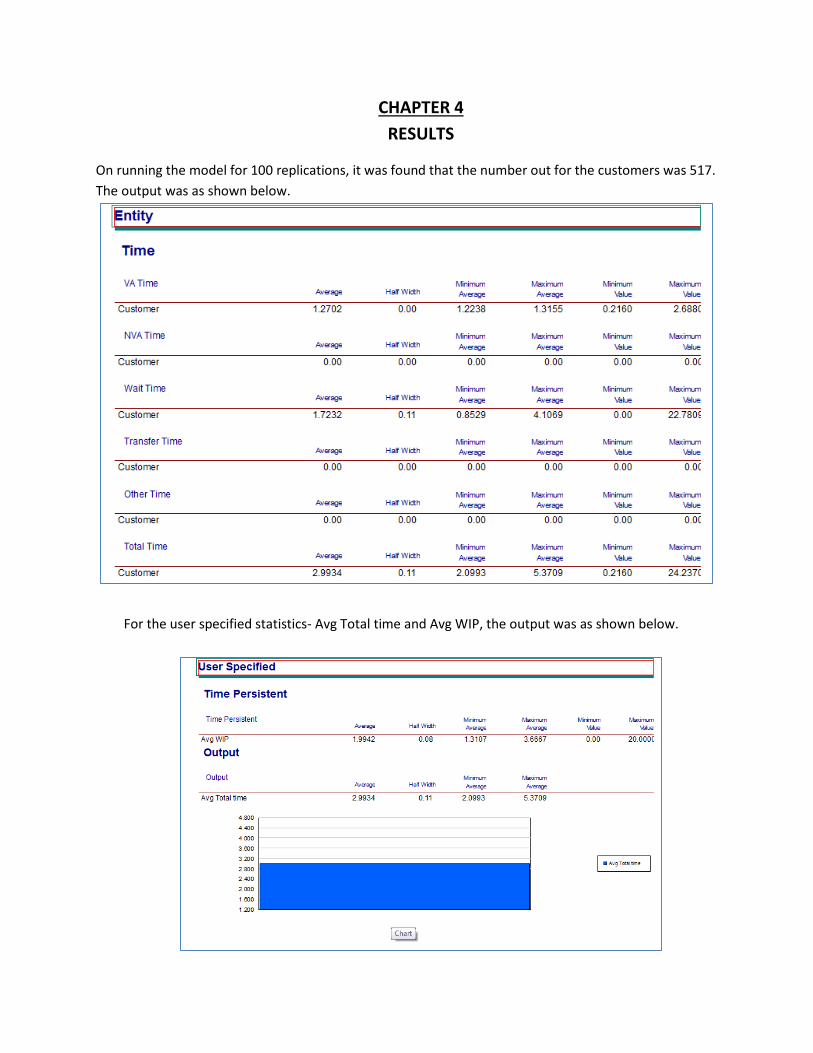
On running the model for 100 replications, it was found that the number out for the customers was 517.
The output was as shown below.
For the user specified statistics- Avg Total time and Avg WIP, the output was as shown below.
CHAPTER 5
IMPROVING THE SYSTEM
5.1 Suggestion for improvement
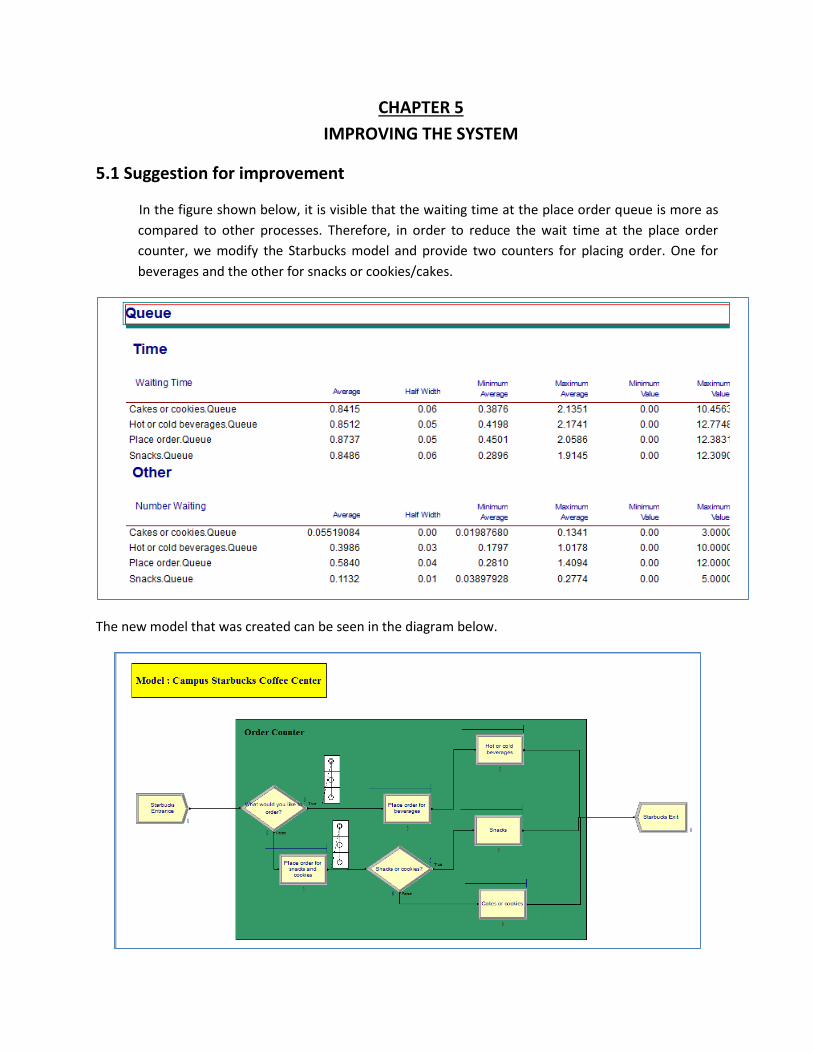
In the figure shown below, it is visible that the waiting time at the place order queue is more as
compared to other processes. Therefore, in order to reduce the wait time at the place order
counter, we modify the Starbucks model and provide two counters for placing order. One for
beverages and the other for snacks or cookies/cakes.
The new model that was created can be seen in the diagram below.
Here, a decide module was put after the arrival. 70% customers go for beverages and remaining
30% go for snacks or cookies/cakes. There is one more decide module for snacks and
cookies/cakes with 66% and 34% probability, respectively. The rest of the model remains the
same except that in this model, we have two types of resources, CustomersIn1 and CustomersIn2
for Beverages and Snacks or Cakes/Cookies, respectively.
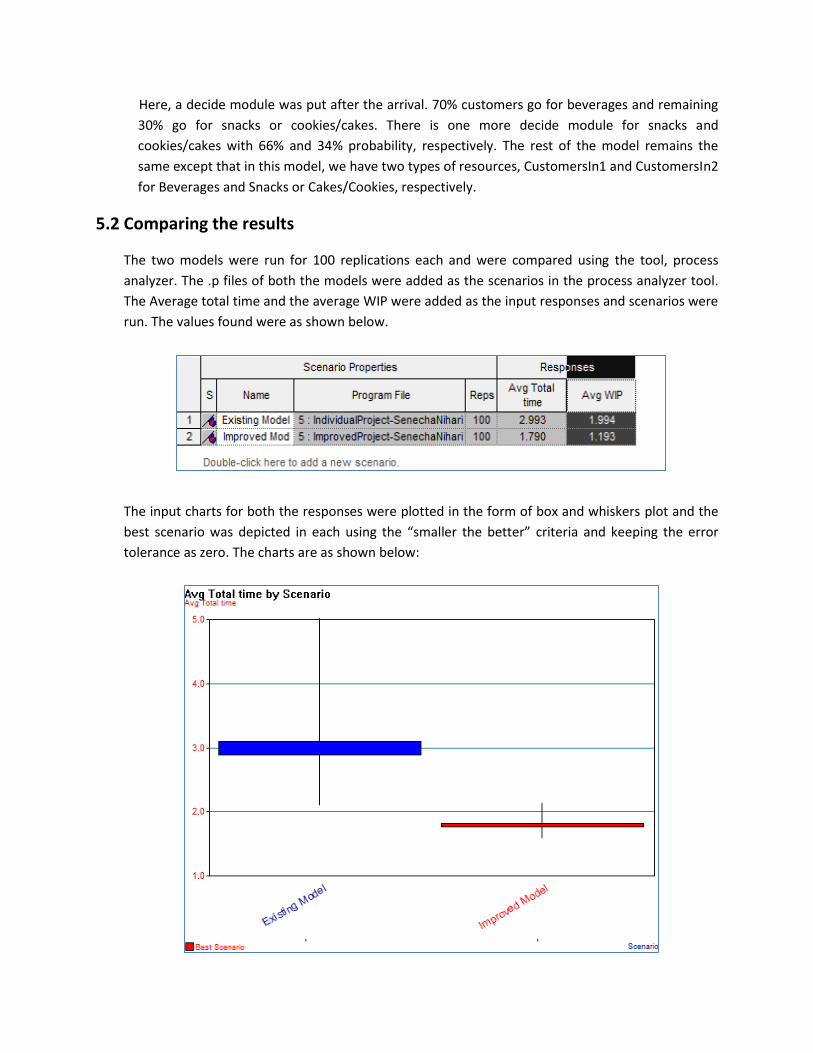
5.2 Comparing the results
The two models were run for 100 replications each and were compared using the tool, process
analyzer. The .p files of both the models were added as the scenarios in the process analyzer tool.
The Average total time and the average WIP were added as the input responses and scenarios were
run. The values found were as shown below.
The input charts for both the responses were plotted in the form of box and whiskers plot and the
best scenario was depicted in each using the “smaller the better” criteria and keeping the error
tolerance as zero. The charts are as shown below:
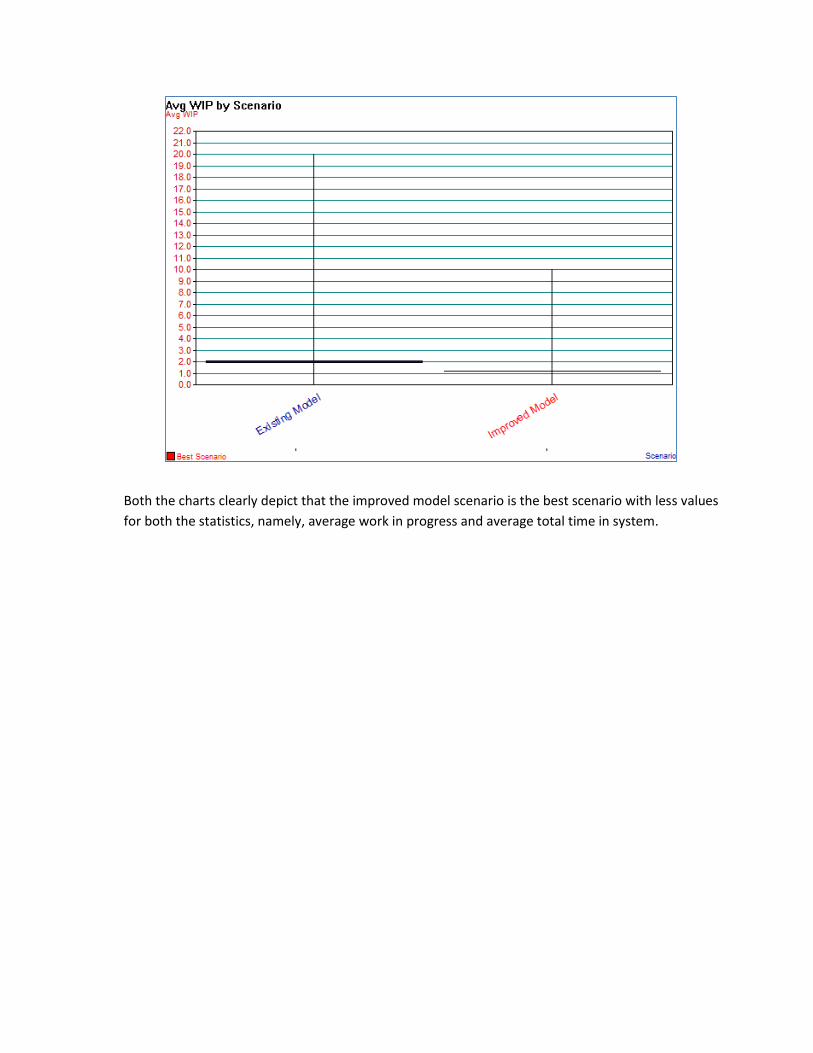
Both the charts clearly depict that the improved model scenario is the best scenario with less values
for both the statistics, namely, average work in progress and average total time in system.

CHAPTER 6
CONCLUSION
The given Campus Starbucks Coffee center was modeled in Arena Simulation Software and the
results were generated. After analyzing the results, it was noticed that the waiting time in place
order counter was more compared to the other stations. So a suggestion was made to increase
the number of place order counters by one. The results before and after were compared. And it
was found that the waiting time in the place order counter decreased and the utilization of the
station increased. Again, lot of suggestions can be made in this system which can lead to cost
saving also.
REFERENCES
[1] David Kelton W., Randall P. Sadowski, Nancy B. Swets. 2013. Simulation with Arena (5e
edition.), McGraw Hill.
[2] Logo - http://www.mgmgranddetroit.com/restaurants/starbucks.aspx
[3] Report Format- https://www.scribd.com/


