Support the definition of prioritized mitigation measures to achieve Mexico´s conditional NDC targets SIMULATION MODELS AERO Methodological approach towards the assessment of simulation models suited for the economic evaluation of mitigation measures to facilitate NDC implementation OTHERS
Transcript
Support the definition of prioritized mitigation measures to achieve Mexico´s conditional NDC targets
SIMULATION MODELS
AERO
Methodological approach towards the assessment of simulation models suited for the economic evaluation of mitigation measures to facilitate NDC implementation
OTHERS
Published byDeutsche Gesellschaft für Internationale Zusammenarbeit (GIZ) GmbH Friedrich-Ebert-Allee 36+4053113 Bonn, DeutschlandT +49 228 44 60-0F +49 228 44 60-17 66E [email protected] www.giz.de
Support the definition of prioritized mitigation measures to achieve Mexico´s conditional NDC targetsPeriférico 5000, Piso Anexo,Col. Insurgentes Cuicuilco, Coyoacán04530, Mexico City, MexicoT +52 55 5536 2344F +52 55 5536 2344E [email protected] www.giz.de/mexico
AuthorsHeather Haydock and Alan McCulloughRicardo Energy & EnvironmentGemini Building, Harwell, Didcot, OX11 0QRUnited Kingdom
Design and LayoutAlexis Bartrina
Legal NoticeGIZ is not responsible for the contents presented in this document. Neither can GIZ accept any liability or give any guarantees for the declarations and perspectives given by the authors of this document.
Financed byGerman Federal Ministry for Economic Cooperation and Development (BMZ) within its Study and Expert Fund (SFF) and the ‘NDC Assist Project – Contributing to the NDC Partnership’.
The project is implemented together with the National Institute for Ecology and Climate Change (INECC) and the Environmental Ministry of Mexico (SEMARNAT).
4. Common modelling tools and how they have been applied for NDCs
4.1 LEAP
4.2 EPPA
4.3 POLES
4.4 MARKAL/TIMES
4.5 GACMO
4.6 Other modelling approaches
5. Methodology for selection of modelling tools
5.1 Define the nature of the policy assessment / modelling
work
5.2 Identify the type of model required
5.3 Identify candidate modelling tools of the appropriate type
5.4 Refine selection based on country specific requirements
and circumstances
Appendices
Appendix 1 Characteristics of selected models
Appendix 2 Key references
Appendix 3 Glossary
4
6
7
9
12
12
13
14
15
16
16
17
18
19
22
23
24
25
43
43
4
Executive summaryFollowing the 21st session of the Conference of the Parties (COP) to the United Nations Framework Convention on Climate Change (UNFCCC), 195 countries adopted the Paris Agreement, which establishes a global action plan to put the world on track to avoid dangerous climate change by limiting global warming to well below 2°C. A core element of the Agreement is the implementation of Nationally Determined Contributions (NDCs) which will transform existing economies into low carbon economies.
The implementation and also preparation of NDCs represents a tremendous challenge for all parties to the Agreement, who need to undertake detailed economic analysis of the mitigation options available at national, regional and local level, including modelling likely costs, impact and rate of adoption of sector specific, cross sectoral and general mitigation measures. The resource requirements can be particularly challenging for developing countries and emerging economies. It is against this background that the Deutsche Gesellschaft für Internationale Zusammenarbeit (GIZ) GmbH in a cooperation with the Environmental Ministry of Mexico (SEMARNAT) and the National Institute for Ecology and Climate Change (INECC), based on the more general information provided by the NDC-Partnership, set the objective to develop a methodology that allows to narrow down the tremendous choice of simulation tools for the analysis of mitigation options according to criteria faced in particular by developing and emerging countries so that NDC-preparation as well as NDC-implementation can finally be facilitated also from an analytical perspective.
The aim of this study was to evaluate and compare a selection of the available tools for economic analysis of a set of mitigation measures, and to produce an overview of their capabilities that will inform model / tool selection in terms of the specific needs and available resources of developing countries.
The study builds on the work done by the NDC Partnership’s Toolbox Navigator which identifies a range of available tools by gathering supplementary information on the research questions that different modelling tools address. This information has been drawn from interviews with model developers and policy makers, and from academic reviews and consultants’ advice on the selection of modelling tools.
5
The report provides:
• An overview of the main types of modelling tools that could support NDC planning activities.
• Examples of how specific modelling tools have been used for the INDC/NDC development and similar country-level energy/emissions modelling applications.
• A methodology that could be used to select modelling tools for further consideration.
• Suggestions for some possible starting points for policy makers seeking to select a modelling tool (or tools) that could support their immediate policy development requirements.
As NDC policy makers need to cover a range of sectors and measures, this report focuses on reviewing models that offer a broad coverage in terms of sectors and technology options. However, the methodology could also be used to select tools for specific sectors, measures or technology options.
This brief introduction to model selection for NDC policy makers only covers a selection of commonly used modelling tools. For information on a wider range of possible modelling tools, please consult the NDC Partnership’s Toolbox Navigator at: http://www.ndcpartnership.org/toolbox-navigator#tools.
Executive summary
6
1. Introduction Following the 21st session of the Conference of the Parties (COP) to the United Nations Framework Convention on Climate Change (UNFCCC), 195 countries adopted the Paris Agreement, which establishes a global action plan to put the world on track to avoid dangerous climate change by limiting global warming to well below 2°C. A core element of the Paris Agreement, which came into force on 21st November 2016, is the implementation of Nationally Determined Contributions (NDCs) which will transform existing economies into low carbon economies.
The implementation of NDCs represents a tremendous challenge for all parties to the Agreement, particularly developing countries and emerging economies, who need to:
• Develop new economic, regulatory and financial policies and instruments
• Assess the economic impact and risks of different mitigation measures
• Identify the most cost-effective set of mitigation measures at sector level
• Build investment cases to attract international support for specific projects
• Undertake supporting actions to address barriers to implementation
• Forecast uptake of mitigation measures under different scenarios
• Review and update NDCs by 2020 and every 5 years thereafter
The cost-effective design and completion of these tasks involves detailed economic analysis of the mitigation options available at national, regional and local level, including modelling likely costs, impact and rate of adoption of sector specific, cross sectoral and general mitigation measures. In this context, there are a wide range of modelling tools that could be used to undertake these tasks, including models of energy supply and end-use, and of the impact and costs of specific mitigation measures on energy supply and use, greenhouse gas (GHG) emissions and the economy.
The aim of this study was to evaluate and compare a selection of the available tools for economic analysis of a set of mitigation measures, and to produce an overview of their capabilities that will inform model / tool selection in terms of the specific needs and available resources of developing countries.
7
The study builds on the work done by the NDC Partnership’s Toolbox Navigator1 which identifies a range of available tools, by gathering supplementary information on the research questions that different modelling tools address. This supplementary information has been drawn from number of sources:
• Interviews with selected model developers and policy makers (or supporting consultants).
• Recent academic reviews, which have assessed the capabilities over 100 modelling tools from different perspectives, including modelling approach sector and technological coverage, number of countries used in, and relevance to specific applications [1 to 3].
• Advice on the selection of modelling tools for developing countries from the perspective of guiding climate compatible development and modelling deep decarbonisation [4, 5].
The report is structured as follows:
• Section 2 describes our approach to this study.
• Section 3 outlines the range of tools that are available to assist governments and stakeholders to address policy questions and to develop NDC implementation plans
• Section 4 provides details of the features and capabilities of a selection of the most commonly used modelling tools, along with examples of previous applications in developing countries
• Section 5 provides a methodology for selecting a possible modelling tool (or tools) that is best suited to addressing different policy questions in light of the available data and resources (i.e., applying a range of selection criteria)
• Appendix 1 provides further details of selected modelling tools
• Appendix 2 lists a selection of papers and report reviewed/referenced during this study
• Appendix 3 contains a glossary of technical terms and acronyms used within this report
2. Study approach Figure 1 outlines our approach to this study. It was originally intended to complete the study within four weeks, so some tasks were undertaken in parallel. In practice, more time was needed to set up and conduct the interviews, and so the total duration was about seven weeks.
Firstly, we undertook a literature review to inform a shortlist of candidate energy models with a significant user base. This included consideration of published results of Intended Nationally Determined Contribution (INDC) modelling work in developing countries, and a review of the more commonly used models in the NDC Partnership Toolbox2.
Secondly, we undertook further research on selected models and conducted interviews with four selected model suppliers and developers, seeking advice on modelling tools that could be particularly relevant to NDC policy makers in developing countries. In parallel, we conducted interviews with four NDC policy makers in developing countries (or their expert advisors) seeking information on modelling tools that they had used or plan to use.
Finally, we confirmed the shortlist of suitable models and incorporated it into a selection process that could be used by NDC policy makers to assess their modelling needs and options.
The interviews conducted with policy makers, advisors and model developers also provided information on how selected models had been used for NDC implementation support, and their perceived strengths and weaknesses. The interviews focused primarily on the use of the LEAP, POLES and MARKAL/TIMES models, and included interviews with those involved with the Mexico, Nigeria, Colombia and India INDC processes. In some cases, the interviewees provided information on other models that had been used to provide input data or scenarios, or to cross-check assumptions and results.
Figure 1: Study Approach
2. NDC Partnership Toolbox at http://www.ndcpartnership.org/about-toolbox-navigator
9
3. Modelling to support NDC Implementation This section introduces a range of models and tools that are available to assist governments and stakeholders to address policy questions and to develop NDC implementation plans.
This report considers four main types of model, which can be divided into top down (or macro-economic) models, bottom up (or engineering) models, hybrid models and other models.
The terms top-down and bottom up refer to the basic modelling approaches used to examine the linkages between the economy and specific GHG emitting sectors such as the energy system. Top-down models evaluate the system from aggregate economic variables, whereas bottom-up models consider technological options or project-specific climate change mitigation policies. The terms “top down” and “bottom up” are shorthand for models derived from aggregated or disaggregated data3.
Hybrid models use a combination of top down and bottom up approaches, and their names often identify the specific top down and bottom up models that have been linked by the developers.
Other types of model include modelling tools and toolboxes that cannot be neatly labelled as top down, bottom up or hybrid models, although in practice they may provide the facilities that enable the user to build top down or bottom up models. An example of this are accounting modelling tools, which generally classified as bottom models by other reviews, but can be used to build top down models.
The specific types of models reviewed in this report are:
a) Top down models (Macro-economic)• General Equilibrium (CGE) models• Input–Output (I/O) models
b) Bottom up models (Engineering)• Optimisation models• Simulation models
c) Hybrid models
d) Other types:• Accounting modelling tools
3. NDC Partnership Toolbox at http://www.ndcpartnership.org/about-toolbox-navigator
3. Modelling to support NDC Implementation
10
Type of Model
General equilibrium (CGE) models
Input–Output (I/O) models
Brief Technical Description and Examples
CGE models typically simulate markets for factors of production (e.g., labour, capital, energy), products, and foreign exchange, with equations that specify supply and demand behaviour. The models are solved for a set of wages, prices, and exchange rates to bring all markets into equilibrium. CGE models examine the economy in different states of equilibrium and so are not able to provide insight into the adjustment process. During the NDC preparation process, they have been used to simulate the effect of price-induced substitution away from or towards energy-intensive products in response to policy changes.
However, as the parameters in CGE models are only partly calibrated (i.e., fitted to one year of data) and only partly statistically or econometrically determined (i.e., estimated from several years of data), it can be difficult to defend the validity of some of the parameter values. Hence other types of modelling are likely to be needed to support the development of a detailed NDC implementation plan.
Examples: EPPA, ICES
I/O models describe the complex interrelationships among economic sectors using sets of simultaneous linear equations. They take aggregate demand as given and provide considerable sectoral detail on how demand is met. They are used when the sectoral consequences of mitigation or adaptation actions are of particular interest. The validity of the models is limited to short runs (5–15 years).
As the coefficients of the equations used in I/O models are generally fixed, they are not able to model factor substitution, behavioural aspects or technological change, which is a significant aspect NDC implementation plans. However, they may be useful in exploring supply chain dependences between different sectors.
Examples: IOTA, REMI
The table below provides a brief technical description of the characteristics of each type of model3 and some examples of models of this type.
11
Type of Model Brief Technical Description and Examples
Simulation models
Optimisation models
Accounting Models
Simulation models include a detailed representation of energy demand and supply technologies, including end-use, conversion, and production technologies. Demand and technology development are driven by scenario assumptions often linked to technology vintage models and econometric forecasts.
The demand sectors are generally disaggregated for industrial subsectors and processes, residential and service categories, transport modes, etc. This allows development trends to be projected through technology development scenarios. They are best suited for short- to medium-term NDC impact assessment studies.
Examples: POLES, AERO
Optimisation models minimise the total costs of the energy system, including all end-use sectors, over a 40 to 50 year horizon and compute a partial equilibrium for the energy markets. Costs include investment and operation costs of all sectors based on a detailed representation of factor costs and assumptions about GHG emission taxes. The technology information in the models can be used to assess capital stock turnover, measure uptake and impact of technology learning. During NDC preparation, they could be used to assess the dynamic aspects of GHG emissions reduction potential and costs, and to model the relative economic cost-effectiveness of a wider range of migration measures in different sectors.
Examples: MARKAL / TIMES, MESSAGE
Accounting models include descriptions of key performance characteristics of an energy system, which allows users to explore the implications of resource, environment and social cost decisions. They are often simple and transparent, with no prior assumptions about market behaviour or optimal choices. This means that they offer a more open modelling framework that can be used to build simple models initially, which can be developed into more detailed models at a later date.
Examples: LEAP, GACMO
3. Modelling to support NDC Implementation
12
This list of model types does not include less commonly used model types such as Econometric, Stochastic (Monte Carlo), Microeconomic (which are generally sector specific simulation models), Spatial, Multicriteria and Back-casting models. These less commonly used models are less suited to modelling the impact of a wide range of technologies and thus are unlikely to be appropriate for NDC applications on their own, but they could be used in combination with the models shown in the table.
Further details on many of these tools are available from the NDC Partnership’s NDC Toolbox Navigator4, a searchable database of tools and resources to support NDC implementation. This toolbox includes key analytical tools and guidance documents, experience profiles, links to other knowledge platforms, and sources of advisory support that are relevant to NDC planning and implementation for both mitigation and adaptation. The toolbox contains detailed information on over 300 tools and resources but does not provide advice on how to select the most appropriate tools for specific tasks.
4. Common modelling tools and how they have been applied for NDCsThis section describes some of the models that have been used for INDC/NDC development and similar country-level energy/emissions modelling applications, drawing on case studies of their application in Mexico, Nigeria, Colombia and India. Further information on the characteristics of each of these models and some alternative models are provided in Appendix 1.
4.1 LEAPThe Long-range Energy Alternatives Planning (LEAP) model was widely used in the development of INDCs, and was the model of choice for many developing countries. The Stockholm Environment Institute (SEI), the developers of LEAP, have identified 34 countries that used LEAP to support their INDC process, including Bangladesh, Nigeria and Ecuador, and there may have been several more.
LEAP is an accounting model that can be developed within 3-6 months and is flexible to different levels of detail and data availability. It includes a wide range of technology options and emission factors, and is aligned with the guidelines of the Intergovernmental Panel on Climate Change (IPCC). Some countries have used LEAP for all sectors of the economy, including land use sectors, while others have used LEAP for some sectors only. The software required to develop a LEAP model is available at no cost to developing countries but most ministries have opted to use consultants or academics to help develop and run the model.
4.2 EPPAThe Emissions Prediction and Policy Analysis (EPPA) model was developed by the Massachusetts Institute of Technology (MIT). EPPA is a computable general equilibrium (CGE) model of the world economy. It is built on the Global Trade Analysis Project (GTAP) database and additional data about GHG and other pollutant emissions. The EPPA model can be used as a stand-alone model of the global economy for the study of greenhouse gas emissions and environmental policy. It also is a component of the MIT Integrated Global Systems Model (IGSM). EPPA is a regional model that models some of the larger countries individually, including Mexico, Brazil, Russia, India and China.
Case study: Use of LEAP for Nigeria’s INDC
The Nigeria LEAP model was developed in three months by a team of international and local consultants with financial support from the United Nations Development Programme (UNDP). The consultancy team decided to use LEAP and recommended it to the Nigerian Government. It was recommended because a LEAP model can be done relatively quickly and there was little time available to prepare the INDC. It was important that the model was not proprietary and could be transferred to others, and that it had been used in many other countries.
The Nigeria LEAP model included all major emitting sectors including the five sectors that were subsequently detailed in NDC sectoral plans: agriculture, industry, oil & gas, power and transport.
The model was driven from the needs of the INDC and the narrative. The consultants developed the model as the discussions took place, in parallel with the consultation and during the evenings after consultation meetings. This led to lots of progress quickly. Scenarios were developed (population, growth rates, cost of capital etc.) and local experts were consulted on assumptions such as the average miles travelled by a car each year. Where necessary, data were taken from other countries. Sensitivity analyses were undertaken and the model was found to be particularly sensitive to assumptions around the cost of capital and GDP growth rate. All decisions and data quality issues were documented.
Other models were used as inputs to LEAP and to validate the LEAP assumptions and results. The Energy Commission of Nigeria had developed a carbon calculator based on the UK Government calculator, and some of the data from this was transferred across to LEAP. The consultants ran a comparison between LEAP and the calculator, which fed that back into LEAP development. The GACMO model (see below) was used for input data e.g. the costs and emissions savings associated with moving from single cycle to combined cycle power plant.
4. Common modelling tools and how they have been applied for NDCs
14
Case study: Use of EPPA for Mexico’s NDC
Case study: Use of POLES for Mexico’s NDC
Mexico’s NDC was informed by EPPA and POLES as well as sector-specific models. This box discusses the use of EPPA and the box in the next section discusses the use of POLES.
EPPA was used to explore different mitigation scenarios for Mexico over the period 2013-2050. The goal of the Mid-Century Strategy (MCS) is to reduce national GHG emissions by 50% from 2000 levels by 2050 in accordance with Mexico’s climate change law. Two main scenarios were considered – an ‘NDC path’ and an ‘NDC more ambitious’ path. The NDC commitments in each scenario were broken down by sector, with oil & gas, LULUCF, power and transport contributing the greatest reductions in emissions from the baseline in 2030 under the NDC path scenario. The work was undertaken by the National Institute of Ecology and Climate Change (INECC), whose staff were already familiar with EPPA through previous work with MIT.
Mexico’s NDC was informed by EPPA and POLES as well as sector specific models. This box discusses the use of POLES and the box in the previous section discusses the use of EPPA.
The Danish Energy Agency supported the use of the POLES model three times. The first time to model the emissions inventory and sectoral breakdown in 2012, the second time to understand the mitigation potential for the INDC before COP21, and most recently to explore the costs associated with the conditional and unconditional commitments in the NDC. The modelling for the INDC showed how energy demands could be met with different scenarios, and the results were used by the Mexican Government at the COP. In the recent modelling exercise the results from POLES were compared with those from a bottom-up technology cost model of the energy sector. It was challenging to compare the two models as POLES has limited technology representation.
4.3 POLESThe Prospective Outlook on Long-term Energy Systems (POLES) model is a world simulation model for the energy sector comprising 66 countries/regions modelled in annual steps to 2050. POLES was first developed in the early 1990s by the Institute of Energy Policies and Economics IEPE (now GAEL Energy) and has since been further developed by Enerdata, EDDEN, and JRC-IPTS of the European Commission. POLES has been used extensively by the European Commission and was used by the World Bank to assess the NDCs of the G20 countries.
15
Case study: Use of MARKAL for India’s INDC
4.4 MARKAL/TIMESThe MARKet ALlocation (MARKAL) model was developed in a cooperative multinational project over a period of almost two decades by the Energy Technology Systems Analysis Programme (ETSAP) of the International Energy Agency. The Integrated MARKAL-EFOM5 System (TIMES) is a more recent development in the same family of models and has replaced MARKAL in many countries.
MARKAL and TIMES are technology-rich energy system models that that generate cost-optimal pathways to 2050. They are typically used to explore different technology choices and scenarios for achieving a given emissions reduction at least cost across the economy of a country.
MARKAL/TIMES models require large data sets including detailed information on the characteristics and costs of technologies and fuels in all sectors of the economy over all time periods, and are usually developed incrementally by research groups over many years. For example, the UK TIMES model has its roots in the UK MARKAL model that was first used to support policy development in the early 1990s.
POLES was chosen for the INDC because the model had already been developed for Mexico and the funding was available to develop it further. Support was provided in the form of consultancy, and the model was not transferred to the Mexican Government.
TERI contributed energy system modelling using MARKA to the INDC process. They have a core team of 4-5 MARKAL modellers supported by around 800 sector and technology experts, and have used MARKAL for two decades. TERI also uses the TIMES model but chose MARKAL for the INDC work as this is the more established model. Other models used for the INDC included LULUCF modelling of carbon sinks and a CGE type model.
The MARKAL model was ‘hard linked’ to other models that allow assessment of air pollution, health and other co-benefits, and economic impacts. In this way it could be considered an integrated assessment model rather than just an energy system model. A lesson from the experience in India was that it is important to look at the co-benefits from NDC measures, and so an integrated assessment model is ideal. The model used for the INDC has been further developed since 2015 to include linkages to water and land use.
5. Energy Flow Optimisation Model
4. Common modelling tools and how they have been applied for NDCs
16
The planning ministry Niti Ayog has its own model based on the UK Government 2050 Calculator. Known as the India Energy Security Scenarios 2047 model. This is a ‘what if ’ model developed by an India/UK team within a year. Because it is a ‘what if ’ model rather than a cost optimisation model is not as robust and TERI would not recommend it is used for policy formulation. It is useful for exploring what would happen if a little more action was taken in one sector or another
4.5 GACMOThe Greenhouse Gas Abatement Cost Model (GACMO) is a simple accounting model developed by the United Nations Environment Programme (UNEP) DTU to assist countries or regions in analysing their GHG mitigation options. GACMO is used to evaluate the costs and benefits of a wide range of mitigation options, to calculate the GHG emissions reduction and the average mitigation cost expressed in US$ per ton of CO2 equivalent. It can combine the options in the form of a marginal abatement cost curve (MACC), showing the average cost of reducing GHG emissions for different alternatives.
GACMO was used for the INDCs of the Maldives and several African countries including Mozambique and Angola. GACMO requires less data than most other models, and includes a specified list of technologies and example technology costs that can be used if country-specific data are not available.
4.6 Other modelling approachesOther approaches to modelling INDCs and NDCs include bespoke spreadsheet (Excel) models and combinations of other models and spreadsheet models.
Case study: Modelling approach for Colombia’s INDC
The modelling of the Colombia INDC was carried out by the Universidad the los Andes. Various models were used to inform the INDC, including LEAP for the power sector, MARKAL, and Excel for the transport and forestry sectors. An overall Excel model then brought all sectors together. These sector models were chosen because they were well understood and validated, and best represented the sectors concerned. Some of these models had also been used since 2011 for the development of the national low carbon strategy (Estrategia Colombiana de Desarrollo Bajo en Carbono), so information was available on mitigation scenarios and potential. The outputs from the different sector models provided inputs to an Excel spreadsheet that calculated the overall total baseline CO2 emissions and the CO2 reductions under different scenarios.
17
The forestry & agriculture sector were modelled in a simplified way. The starting point was the 2010 GHG inventory data. Then the deforestation rates over the last 10-15 years were analysed and a constant annual deforestation rate of 10% was assumed going forward.
To ensure consistency and comparability of the different models, the different research groups and consultants that ran the input models used a consistent set of primary drivers e.g. GDP growth, population, fuel price. The Ministry of Environment and Sustainable Development was provided with the final outputs of these individual models but not the detailed assumptions and calculations. It was necessary to do it this way in order to get the results in time for the INDC submission but it has meant the Ministry is not able to replicate the results, look at different scenarios, update or use the Excel model for NDC implementation planning.
5. Methodology for selection of modelling tools
This section proposes a methodology for selecting a possible modelling tool (or tools) that is best suited to addressing different policy questions in light of the available data and resources.
The selection of best tools for particular energy modelling tasks has been the subject of extensive discussion and a considerable number of expert reviews have been published in academic journals and consultancy reports. The approach adopted in many reviews involves outlining the method used to classify and compare the approach adopted, features and applications of a selection of models. However, they generally do not provide guidance on model selection for specific applications.
In this report, a more application specific approach is adopted. This involves four steps:
1. Defining the nature of the policy assessment / modelling work
2. Identifying the appropriate type or types of model to be used for the application
3. Identifying candidate modelling tools of the appropriate type
4. Refining the selection based on specific requirements (evaluation criteria)
In some situations, this selection process will quickly identify a single modelling tool that can address all of the modelling requirements, but in many cases, a number of modelling tools will be required. In this case, the modelling requirements may need to be reviewed to identify the combination of tools that can best address the modelling requirements, or the modelling tool that should be applied first.
5. Methodology for selection of modelling tools
18
5.1 Define the nature of the policy assessment / modelling work
At the start of the model selection process, it is important to clearly the nature of policy assessment and modelling work that needs to be completed in terms of:
a. Focus of the policy modelling work• Assessing the NDC overall economic impacts
• Forecasting greenhouse gas (GHG) emissions
• Exploring mitigation options
• The investment strategy for different mitigation options
b. Timeframe being modelled:• Short to medium term (i.e. 5 to 20 years ahead)
• Medium to long term (i.e. 20 to 40 years ahead)
• Long to very long term (i.e. 40 to 80 years ahead)
c. Sectors coverage/breakdown:• Energy end-use (industrial, services, transport, residential)
• Energy supply industries (electricity, oil & gas, coal, renewables)
• Rural development sectors (agriculture, forestry, other land use)
d. Measure and technology coverage/breakdown:• Cross cutting measures (e.g. carbon tax, emissions trading, financial incentives)
• Renewable electricity generation (e.g. wind, solar PV, hydro, biomass)
• Renewable heat (e.g. CHP, district heating, bioenergy, heat pumps, solar thermal).
• Energy efficiency measures (e.g. Industrial processes, buildings, equipment)
• Low emission transport (e.g. electric vehicles, biofuels, mode switching)
• Non-energy related emissions (e.g. from agriculture, forestry, land use change)
As NDC policy makers need to cover a range of sectors and measures, the model selection process described in this report will focus on the first two issues, and on reviewing models that offer a broad coverage in terms of sectors and technology options. However, advice is also provided on some other sources of information that could be used to compare the sector and technology coverage of models, and to identify tools that can be used to model particular sectors, measures or technology options.
19
5.2 Identify the type of model required
The following table provides a simplified selection tool based on the types of model typically used by policy makers when focusing on single modelling tasks (see Section 3). Many modelling tools provide the facilities to model shorter or longer timescales, and other modelling tasks, in less technical detail.
The choice of model will depend on the policy questions that will be informed by the modelling to be undertaken. The following table shows examples of how policy questions might map onto model type, and the resulting considerations for model type selection.
Timescale Focus Short to medium term(5 to 20 years)
Medium to long term(20 to 40 years)
Long to very long term(40 to 100 years)
Assessing the NDC economic impacts
Top down: Macro-economic
Bottom Up: Optimisation or Hybrid
Hybrid
Forecasting greenhouse gas (GHG) emission
Bottom Up: Simulation, Optimisation or Accounting
Exploring mitigation options
Investment strategy
Policy maker circumstances
Policy maker questions Considerations for model type selection
For all policy makers: • How will any mitigation actions planned or proposed impact on GHG emissions in future?
• What will be the impacts of these mitigation actions on related development goals (SDGs) such as energy access, jobs, economic development?
• What will it cost to undertake these actions?
• Are there any adaptation actions that would have mitigation co-benefits, and if so what are those benefits in terms of GHG emissions and other impacts?
All the model types considered in this report can be used to assess the impacts of mitigation actions, and nearly all of them include costs.
Technology-rich bottom up models are suited to assessing the impacts of changes in energy demand, the introduction of new technologies or fuels, or (with some off-model calculations) the co-benefits of adaptation action.
Top down macro-economic models can provide insights into economic impacts and job creation, taking account of interactions within the system.
5. Methodology for selection of modelling tools
20
Policy maker circumstances
Policy maker questions Considerations for model type selection
For policy makers in countries that have a 2030 emissions reduction commitment (absolute or relative) that covers the whole economy or all major emitting sectors. This could be split into unconditional (what the country will pay for) and conditional (on international support) commitments:
• Projected future emissions from each sector (will have been modelled for INDC/first NDC but may need to be reviewed in light of e.g. different GDP or population projections)
• What is the most cost-efficient route to get to the 2030 target?How much mitigation potential is there in each sector?
• What will it cost to deliver it?
• What are the uncertainties in mitigation potential and costs?
• What is the potential for lock-in of emissions, e.g. new build of fossil fuel power stations?
A model with built in optimisation capabilities is required to calculate the most efficient route (pathway) to an emissions reduction goal. Scenario analysis can be used to explore different routes and compare costs.
All the models considered in this report can be used to assess mitigation potential and the impacts of mitigation actions. Most are limited to either the energy supply and end-use sectors or the land use (AFOLU) sector, but some allow results from AFOLU models to be used as input parameters to energy models, giving a full system model.
Most of the model types include an ability to conduct uncertainty analysis. The methods vary and include sensitivity analysis, e.g. to defined changes in fuel price or GDP, and more sophisticated Monte Carlo techniques.
For policy makers in countries that do not yet have a 2030 emissions reduction commitment, or only for one or two selected sectors (second NDC due by 2020 but could be done sooner):
• What are the projected emissions to 2030 from the sectors not yet included in the NDC
• Which additional sectors or gases (CH4, N2O, F gases) should we include in the next NDC?
• How reliable are the data and model outputs, and could we end up being tied to a target that we cannot meet?
An accounting model could be a good starting point for gathering the data needed to forecast future energy and emissions, and to model the likely impact of economic growth, renewable energy and energy efficiency measures.
Some accounting tools also include the ability to implement other types of model, or can be linked to other tools e.g. optimisation models.
For policy makers in line ministries who are responsible for a certain sector, e.g. Energy, Industry & Business, Urban Development & Planning, Transport, or Agriculture / Forestry:
• What does the NDC assume about demand growth, technology choice, fuel choice in my sector?
• What does the NDC imply for emissions reduction in my sector?
• What policies and measures are inclded in the NDC in my sector, and what are they expected to achieve in terms of emissions reduction?
• What will be achieved by existing and planned measures, and what extra needs to be done?
A bottom up simulation model is often a useful starting point for exploring how energy is used in particular sectors and for understanding how different mitigation measures and technology options influence sectoral GHG emissions.
International technology databases can be used to identify potential technology options and their costs and benefits, which can then be discussed with sector bodies and then refined in light of feedback on the likely scope for deployment.
Some simulation models also allow users to factor anticipated technology/stock replacement cycles into projections of future emissions.
21
Policy maker circumstances
Policy maker questions Considerations for model type selection
• What are these policies and measures likely to cost (capital and operating costs)?
• How does the cost-effectiveness compare with
other sectors?
• Can the costs of the measures in the unconditional commitment be met from Ministerial budgets, and if not are other ways of meeting the target without as much up-front cost?
• What are the co-benefits in terms of ministerial priorities such as energy security, reduced loss of biodiversity, increased incomes for farmers?
A model with built in optimisation capabilities could be used to calculate the most cost efficient pathway for individual sectors and to compare the cost-effectiveness of action to reduce GHG emissions in different sectors.
The evaluation of potential co-benefits and impact of land use changes may need to be modelled separately
• What would be the impact of market mechanisms?
Policy makers addressing other elements of the NDC:
• When will emissions peak and start to reduce?
• Should we introduce a 2050 emissions target, and if so what should that be?
Hybrid modelling tools should be considered when exploring possible pathways to deep carbonisation or the setting of long term targets. These models offer a combination of top down and bottom up models that can be particularly useful in modelling highly uncertain futures.
5. Methodology for selection of modelling tools
22
Notes:
• Underlined entries are not in the NDC Toolbox Navigator
• Dotted entries do model emissions from AFOLU activities (also not in NDC Toolbox Navigator)
• Stared Entries: One star: These modelling tools can be used to build other types of model. Two stars indicates econometric model – which uses bottom up simulation.
ENPEP-BALANCEMESSAGEIII OSeMOSYS
ICESWorldScan
IOTAEORA/MRIOREMI*
E3ME**TIMES-MACROTIAM-MACROMESSAGE- GLOBIOM
2050 CalculatorMACToolEX-ACT
AEROEnerFutureEn-ROADSGLOBIOM
5.3 Identify candidate modelling tools of the appropriate type
The table below shows candidate modelling tools of different types that have been used for NDCs or similar mitigation pathways analyses, differentiating between those that are more commonly used and other models of the same type.
23
5.4 Refine selection based on country specific requirements and circumstances
Once the model type has been chosen (Section 5.2) and candidate models have been identified (Section 5.3), the selection of modelling tool or tools can be refined and finalised by considering the specific requirements of the country and its NDC. The criteria to be used for this selection are likely to include the following. Appendix 1 provides characteristics of selected models against each of these criteria.
1. How widely used is the model?a. Number of existing applications (Users) b. Number citations in reviewed literaturec. Number of countries used in
2. Accessibility and Supporta. Level of skill needed (High, medium, low)b. Availability of guidance / training (High, medium, low)c. Location of available experience (academia, consultancy, owner model)d. Support options: Consultants (only), academic/think tanks (only), governments (only)e. Cost / Pricing (free, annual licence fee, per run service charge)f. Languages documentation/training available in (English, French, Spanish, Others)
3. Data Requirementsa. Volume of data required (High, medium, low)b. Time steps used in model: e.g. 5-yearly, yearly, month, day, minute etc.c. Categories of input data required: GDP data, engineering data, price elasticities, historical energy demand, GHG emissions, production data, etc.d. Data already included or readily available: energy prices: technology costs (capital, fixed operation and maintenance, variable operation and maintenance), CO2 costs etc.e. Fall back options (if national data not available) and its impacts e.g. international data.
4. Detailed information a. Geographical coverage (Global, Regional, National, Sub-national, Project, Local)b. Sectors/sub-sectors covered (number or list, e.g.: Energy Supply, Industry, Services (Commercial & Public), Residential, Transport, Agriculture (AFOLU), Waste)c. Technologies & Mitigation Measures covered (number or list)d. Ability to add new measures: Yes/No/Difficulte. Linkages to other models: (List of hard linked and soft linked models) f. Useful links: Suppliers website, example applications or case studies.
At this point, other considerations may also come into play, such as a country’s existing modelling capabilities, policy makers’ familiarity with specific models, the availability of funding for model development from development partners, and the capacity and desire of the country’s government to build in-house modelling capability.
5. Methodology for selection of modelling tools
24
AppendicesAppendix 1: Characteristics of selected models
Appendix 2: References
Appendix 3: Glossary
25
Appendix 1 – Characteristics of selected models
The following models have been characterised in detail using the criteria shown in Section 5.4. Those models with an asterisk against them are also discussed in Section 4.
• E3ME
• EnerFuture
• EPPA*
• GACMO*
• GLOBIUM
• ICES
• LEAP*
• Med Pro
• POLES*
• MARKAL/TIMES*
E3ME
Model Name E3ME
1 Type of Model Top Down: General Equilibrium
2 How widely used is the model?
2a Number of existing applications (Users/Licences/Downloads): Unknown, Low (1-20), Medium (20-50), High (100-1,000). Very High (>1,000)
Not Available
2b Number citations in reviewed literature 16
2c Number of countries used in Not Available
3 Accessibility and Support
3a Level of skill needed (High, medium, low) High
3b Availability of guidance / training (High, medium, low) High
3c Location of available experience (academia, consultancy, owner model)
Model Owner
Appendix 1
26
Model Name E3ME
3d Support options: Consultants (only), academic/think tanks (only), governments (only)
Not Available
3e Pricing Not Available
3f Languages documentation/training available in (English, French, Spanish, Others)
English
4 Data Requirements
4a Volume of data required (High, medium, low) Medium
4b Time steps used in model: e.g. 5 yearly, yearly, month, day, minute etc.
Yearly to 2050
4c Categories of input data required: GDP data, engineering data, price elasticities, historical energy demand, GHG emissions, production data etc.
Demographic factors; Commodity/Energy Prices; Economic, Energy & Environmental policies;
4d Data already included or readily available: energy prices: technology costs (capital, fixed operation and maintenance, variable operation and maintenance), CO2 costs etc.
Not Available
4e Fall back options (if national data not available) and its impacts e.g. international data.
Global (59 global regions) but often applied at national level
5b Sectors/sub-sectors covered (number and high level list, e.g.: Energy Supply, Industry, Services (Commercial & Public), Residential, Transport, Agriculture (AFOLU), Waste)
Energy, environment, economy
5c Technologies & Mitigation Measures covered (number or high level list)
Power features 24 types of power technologies and these use 13 types of natural resources. Among these, the 4 non renewable resources, uranium, coal, gas and oil, are treated with the resources consumption model.
5d Ability to add new measures: Yes/No/Difficult Not Available
5e Linkages to other models: (List of hard linked and soft linked models) - Interfaces
2a Number of existing applications (Users/Licences/Downloads): Unknown, Low (1-20), Medium (20-50), High (100-1,000). Very High (>1,000)
Not Available
2b Number citations in reviewed literature Not Available
2c Number of countries used in 15 - 20
3 Accessibility and Support
3a Level of skill needed (High, medium, low) Low
3b Availability of guidance / training (High, medium, low) Not Available
3c Location of available experience (academia, consultancy, owner model)
Model Owner
3d Support options: Consultants (only), academic/think tanks (only), governments (only)
Not Available
3e Pricing Available to purchase
3f Languages documentation/training available in (English, French, Spanish, Others)
English
Appendix 1
The model has been used for several recent high profile assessments, including:contribution of employment projections to CEDEFOP’s annual skills forecasts an assessment of the impacts of high oil prices on the global economy for the 2009 London G20 summit input to the EU’s Impact Assessment of the revised Energy Taxation Directive input to the European Commission’s official communication on options for moving beyond the 20% GHG reduction target for 2020 contribution to the official assessment of the EU’s 2030 environmental targets input to the EU’s Impact Assessment of the Energy Efficiency Directive E3ME is being used extensively in the forthcoming book E3 Modelling for a Sustainable Low Carbon Economy in East Asia.
Case study
28
Model Name EnerFuture
4 Data Requirements
4a Volume of data required (High, medium, low) Low
4b Time steps used in model: e.g. 5 yearly, yearly, month, day, minute etc.
Yearly
4c Categories of input data required: GDP data, engineering data, price elasticities, historical energy demand, GHG emissions, production data etc.
Energy resources; Power generation; Emission profiles; GDP; Population; Oil and gas resources; Technology costs
4d Data already included or readily available: energy prices: technology costs (capital, fixed operation and maintenance, variable operation and maintenance), CO2 costs etc.
Future energy demand prices and GHG emissions by energy source or by sector. Large amount of data if subscribed. Three detailed scenarios available, updated yearly, offering contrasted views on technological development, on effort in developing low-carbon energy sources and on fossil fuels supply
4e Fall back options (if national data not available) and its impacts e.g. international data.
5c Technologies & Mitigation Measures covered (number or high level list)
EnerFuture can be linked to the MACC: Long-term Marginal Abatement Cost Curves to generate the different levels of emissions reductions that can be reached for different carbon price levels for a given year, country and sector.
5d Ability to add new measures: Yes/No/Difficult
5e Linkages to other models: (List of hard linked and soft linked models) - Interfaces
2a Number of existing applications (Users/Licences/Downloads): Unknown, Low (1-20), Medium (20-50), High (100-1,000). Very High (>1,000)
Not Available
2b Number citations in reviewed literature Not Available
2c Number of countries used in Not Available
3 Accessibility and Support
3a Level of skill needed (High, medium, low) Medium
3b Availability of guidance / training (High, medium, low) Medium
3c Location of available experience (academia, consultancy, owner model)
Academia
3d Support options: Consultants (only), academic/think tanks (only), governments (only)
Not Available
3e Pricing Not Available
3f Languages documentation/training available in (English, French, Spanish, Others)
English
4 Data Requirements
4a Volume of data required (High, medium, low) Not Available
4b Time steps used in model: e.g. 5 yearly, yearly, month, day, minute etc.
Through the year 2100
4c Categories of input data required: GDP data, engineering data, price elasticities, historical energy demand, GHG emissions, production data etc.
Economic and energy data
4d Data already included or readily available: energy prices: technology costs (capital, fixed operation and maintenance, variable operation and maintenance), CO2 costs etc.
The model provides reference values for some of the required inputs. E.g. the United Nation forecast are used for Population and GDP Growth.
4e Fall back options (if national data not available) and its impacts e.g. international data.
5b Sectors/sub-sectors covered (number and high level list, e.g.: Energy Supply, Industry, Services (Commercial & Public), Residential, Transport, Agriculture (AFOLU), Waste)
Agriculture, Energy, Forestry and Land Use, Terrestrial Ecosystems, Water Resources, Households
5c Technologies & Mitigation Measures covered (number or high level list)
10 electricity generation technologies, including: coal, gas, refined oil, hydro, nuclear, NGCC, biomass, wind and solar. Several new advanced energy supply options have been specified in EPPA4.
5d Ability to add new measures: Yes/No/Difficult No
5e Linkages to other models: (List of hard linked and soft linked models) - Interfaces
The EPPA model can be used as a stand-alone model of the global economy for the study of greenhouse gas emissions and environmental policy. It also is a component of the MIT Integrated Global Systems Model
Applications: It has been used in Brazil and Mexico - “Climate change policy in Brazil and Mexico: Results from the MIT EPPA model” https://doi.org/10.1016/j.eneco.2015.04.007
• Study of the interaction of climate policies and other economic policies (Jacoby et al 1997);
• Exploration of the implications of assumptions about malleability of capital (Jacoby and Sue Wing, 1999);
• The cost implications of controlling multiple trace gases (Reilly et al., 1999);
• Elaboration of issues of design of carbon emissions trading (Ellerman and Sue Wing, 2000);
• Analysis of the interaction of nuclear electric sector and climate change policy in Japan (Babiker et al ., 2000a);
• Study of the impacts of the Kyoto Protocol on the US economy (Babiker et al. , 2000b), developing countries (Babiker et al ., 2000c) and the European Union (Viguier et al ., 2003);
• Preparation of information on uncertainty in emissions projections for use in climate models (Webster et al ., 2002);
• Uncertainty analysis of climate change and policy response (Webster et al., 2003);
• Demonstration of the effects of non-CO2 greenhouse gases and carbon sinks on climate control policy (Reilly et al, 2002);
• Calculation of the environmental and economic implications of the Marrakech agreement (Babiker et al., 2002);
Case study
31
GACMO
Model Name GACMO
1 Type of Model Bottom Up: Simulation
2 How widely used is the model?
2a Number of existing applications (Users/Licences/Downloads): Unknown, Low (1-20), Medium (20-50), High (100-1,000). Very High (>1,000)
Not Available
2b Number citations in reviewed literature Not Available
2c Number of countries used in Not Available
3 Accessibility and Support
3a Level of skill needed (High, medium, low) High
3b Availability of guidance / training (High, medium, low) High
3c Location of available experience (academia, consultancy, owner model)
Public sector
3d Support options: Consultants (only), academic/think tanks (only), governments (only)
Not Available
3e Pricing Not Available
3f Languages documentation/training available in (English, French, Spanish, Others)
English
Appendix 1
• Study of alternative Kyoto targets (Babiker and Eckaus, 2002);
• Analysis of carbon capture and sequestration (McFarland et al., 2004);
• Assessment of Russia’s role in the Kyoto Protocol (Bernard et al., 2003);
• Assessment of the US Climate Stewardship Act of 2003 (Paltsev et al., 2003);
• Studies of approaches to modelling technology and technical change (Jacoby et al., 2004);
• Estimation of the cost of the Kyoto Protocol targets for Japan (Paltsev et al., 2004b);
• Calculation of air pollution health effects (Yang et al., 2005);
• Assessment of the role of non-CO2 gases in climate policy (Reilly et al., 2005); and
• Exploration of the role of the existing fuel taxes in climate policy (Paltsev et al., 2005).
32
Model Name GACMO
4 Data Requirements
4a Volume of data required (High, medium, low) Medium
4b Time steps used in model: e.g. 5 yearly, yearly, month, day, minute etc.
Yearly
4c Categories of input data required: GDP data, engineering data, price elasticities, historical energy demand, GHG emissions, production data etc.
The GHG balance for the chosen country is needed.The annual growth in defined periods is needed.Discount rate. Energy prices for crude oil, all distillates, coal, lignite and natural gas. Calorific values and GHG emission factor for all fuels. CO2 emission factor for electricity production. Global Warming Potential.
4d Data already included or readily available: energy prices: technology costs (capital, fixed operation and maintenance, variable operation and maintenance), CO2 costs etc.
Most of the yellow cells (input list given above) contain default values that can be overwritten.
4e Fall back options (if national data not available) and its impacts e.g. international data.
Enerdata.net can be used to get input data for the country.
5c Technologies & Mitigation Measures covered (number or high level list)
All the GHG mitigation options are located according to the types, and subtypes used in the CDM pipeline (www.cdmpipeline.org).
5d Ability to add new measures: Yes/No/Difficult No - but these get updated
5e Linkages to other models: (List of hard linked and soft linked models) - Interfaces
Enerdata.net
5f Useful links:
Suppliers website http://www.cdmpipeline.org//
Applications: Not Available
Case Studies: Not Available
33
GLOBIOM
Model Name GLOBIOM
1 Type of Model Bottom Up: Simulation
2 How widely used is the model?
2a Number of existing applications (Users/Licences/Downloads): Unknown, Low (1-20), Medium (20-50), High (100-1,000). Very High (>1,000)
Not Available
2b Number citations in reviewed literature Not Available
2c Number of countries used in Not Available
3 Accessibility and Support
3a Level of skill needed (High, medium, low) Not Available
3b Availability of guidance / training (High, medium, low) Not Available
3c Location of available experience (academia, consultancy, owner model)
Not Available
3d Support options: Consultants (only), academic/think tanks (only), governments (only)
Not Available
3e Pricing Not Available
3f Languages documentation/training available in (English, French, Spanish, Others)
Not Available
4 Data Requirements
4a Volume of data required (High, medium, low) Not Available
4b Time steps used in model: e.g. 5 yearly, yearly, month, day, minute etc.
2000-2030 (ten year time step)
4c Categories of input data required: GDP data, engineering data, price elasticities, historical energy demand, GHG emissions, production data etc.
Population, GDP, consumer preferences
4d Data already included or readily available: energy prices: technology costs (capital, fixed operation and maintenance, variable operation and maintenance), CO2 costs etc.
Data available for 27 different crops including 4 vegetable oil types, co-products, perennials and short rotation plantations, crop residues. Various energy conversion processes are modelled and implemented with specific technological costs, conversion efficiencies and co-products (e.g. wood, lignocellulose, conventional ethanol, conventional biodiesel and oilseed crushing).
Appendix 1
34
Model Name GLOBIOM
4e Fall back options (if national data not available) and its impacts e.g. international data.
All information in GLOBIOM is sourced from FAOSTAT and EUROSTAT “
5b Sectors/sub-sectors covered (number and high level list, e.g.: Energy Supply, Industry, Services (Commercial & Public), Residential, Transport, Agriculture (AFOLU), Waste)
Global coverage, with 30 regions currently represented in the global version. GLOBIOM-Brazile and GLOBIOM-EU have been designed with national and regional instituted and are more detailed.
5c Technologies & Mitigation Measures covered (number or high level list)
Analyse the competition for land use between agriculture, forestry, and bioenergy.
5d Ability to add new measures: Yes/No/Difficult 12 sources of GHG emissions covering crop cultivation, livestock, land use change, soil organic carbon based on advanced accounting framework. Peatland emissions based on IPCC default emission factors.
5e Linkages to other models: (List of hard linked and soft linked models) - Interfaces
2a Number of existing applications (Users/Licences/Downloads): Unknown, Low (1-20), Medium (20-50), High (100-1,000). Very High (>1,000)
Not Available
2b Number citations in reviewed literature Not Available
2c Number of countries used in Not Available
3 Accessibility and Support
3a Level of skill needed (High, medium, low) High
3b Availability of guidance / training (High, medium, low) Not Available
3c Location of available experience (academia, consultancy, owner model)
Public sector
3d Support options: Consultants (only), academic/think tanks (only), governments (only)
Not Available
3e Pricing Not Available
3f Languages documentation/training available in (English, French, Spanish, Others)
English
4 Data Requirements
4a Volume of data required (High, medium, low) Not Available
4b Time steps used in model: e.g. 5 yearly, yearly, month, day, minute etc.
Up to 2050
4c Categories of input data required: GDP data, engineering data, price elasticities, historical energy demand, GHG emissions, production data etc.
Economic and energy data
4d Data already included or readily available: energy prices: technology costs (capital, fixed operation and maintenance, variable operation and maintenance), CO2 costs etc.
Not Available
4e Fall back options (if national data not available) and its impacts e.g. international data.
5b Sectors/sub-sectors covered (number and high level list, e.g.: Energy Supply, Industry, Services (Commercial & Public), Residential, Transport, Agriculture (AFOLU), Waste)
Agriculture, Energy, Forestry and Land Use, Oceans and Coastal, Terrestrial Ecosystems
5c Technologies & Mitigation Measures covered (number or high level list)
Technologies include: renewable (wind, solar and hydro-electricity), traditional power sector, nuclear energy, biofuels.
5d Ability to add new measures: Yes/No/Difficult Other mitigation policies include emission reduction through credits on avoided deforestation, carbon sink due to afforestation and timber management, and a ban on illegal logging has also been explored with ICES.
5e Linkages to other models: (List of hard linked and soft linked models) - Interfaces
Comprehensive assessment of current well-being and future sustainability based upon 28 indicators related to the 17 Sustainable Development Goals (SDGs).
5f Useful links:
Suppliers website APPS (Assessment, Projection and Policy of Sustainable Development Goals)
Applications: Not Available
Case Studies: http://www.feem.it/getpage.aspx?id=138&sez=Research&padre=18&sub=75&idsub=102
Model Name LEAP
1 Type of Model Bottom Up: Accounting
2 How widely used is the model?
2a Number of existing applications (Users/Licences/Downloads): Unknown, Low (1-20), Medium (20-50), High (100-1,000). Very High (>1,000)
>5000
2b Number citations in reviewed literature 6
2c Number of countries used in 150-160
3 Accessibility and Support
3a Level of skill needed (High, medium, low) Low
37
Model Name LEAP
3b Availability of guidance / training (High, medium, low) High
3c Location of available experience (academia, consultancy, owner model)
Consultancy
3d Support options: Consultants (only), academic/think tanks (only), governments (only)
Not Available
3e Pricing License is free for students, developing country governments, NGOs and academic organisations (for limited users and time). Licence fees are charged per country for all other users including international consultants supporting developing countries.
3f Languages documentation/training available in (English, French, Spanish, Others)
English, French, Spanish, Portuguese and Chinese.
4 Data Requirements
4a Volume of data required (High, medium, low) Low (Initially)
4b Time steps used in model: e.g. 5 yearly, yearly, month, day, minute etc.
Yearly and time horizon can extend for an unlimited number of years (typically between 20 and 50).
4c Categories of input data required: GDP data, engineering data, price elasticities, historical energy demand, GHG emissions, production data etc.
National population data; Rates of urbanisation; Average household sizes; GDP/GNP data; Value added by sector/subsector; Interest rates; Energy consumption and production by sector and fuel; Emission factors from GHG inventories; National energy policies/plans
4d Data already included or readily available: energy prices: technology costs (capital, fixed operation and maintenance, variable operation and maintenance), CO2 costs etc.
LEAP's built-in calculations handle all of the "non controversial" energy, emissions and cost-benefit accounting calculations
4e Fall back options (if national data not available) and its impacts e.g. international data.
The SEI Energy Modelling team has created a set of national level "starter" data sets for LEAP.
5b Sectors/sub-sectors covered (number and high level list, e.g.: Energy Supply, Industry, Services (Commercial & Public), Residential, Transport, Agriculture (AFOLU), Waste)
LEAP can simulate all sectors, all technologies, and all costs within an energy-system, as well as externalities for any pollutants, decommissioning costs, and unmet demand costs.
5c Technologies & Mitigation Measures covered (number or high level list)
LEAP can simulate all sectors, all technologies, and all costs within an energy-system, as well as externalities for any pollutants, decommissioning costs, and unmet demand costs.
5d Ability to add new measures: Yes/No/Difficult Yes
5e Linkages to other models: (List of hard linked and soft linked models) - Interfaces
OSeMOSYS
Appendix 1
38
Model Name LEAP
5f Useful links:
Suppliers website http://www.energycommunity.org/
Applications: Not Available
Case Studies: Not Available
MEDPro (previously MEDEE)
Model Name MEDPro (previously MEDEE)
1 Type of Model Bottom Up: Simulation
2 How widely used is the model?
2a Number of existing applications (Users/Licences/Downloads): Unknown, Low (1-20), Medium (20-50), High (100-1,000). Very High (>1,000)
Not Available
2b Number citations in reviewed literature Not Available
2c Number of countries used in >60
3 Accessibility and Support
3a Level of skill needed (High, medium, low) Not Available
3b Availability of guidance / training (High, medium, low) Low
3c Location of available experience (academia, consultancy, owner model)
Model Owner
3d Support options: Consultants (only), academic/think tanks (only), governments (only)
Not Available
3e Pricing The empty model can be purchased and then data and scenarios added
3f Languages documentation/training available in (English, French, Spanish, Others)
English
4 Data Requirements
4a Volume of data required (High, medium, low) Medium
4b Time steps used in model: e.g. 5 yearly, yearly, month, day, minute etc.
Not Available
39
Model Name MEDPro (previously MEDEE)
4c Categories of input data required: GDP data, engineering data, price elasticities, historical energy demand, GHG emissions, production data etc.
Socio economic variables: GDP, population, value added, energy prices, productivity, etc.
4d Data already included or readily available: energy prices: technology costs (capital, fixed operation and maintenance, variable operation and maintenance), CO2 costs etc.
Technological: fuel efficiencies, mileage, new equipment performance, etc.
4e Fall back options (if national data not available) and its impacts e.g. international data.
Simulation of energy demand by type and end-use according to various energy efficiency scenarios; electricity load forecasts. If the MedPro Environment is added calculation of future energy demand and related CO2 and GHG emissions are possible.
5b Sectors/sub-sectors covered (number and high level list, e.g.: Energy Supply, Industry, Services (Commercial & Public), Residential, Transport, Agriculture (AFOLU), Waste)
Developed for country-level studies
5c Technologies & Mitigation Measures covered (number or high level list)
Energy demand by main sectors: industry (6 sub-sectors + 9 energy intensive products), households (various dwelling types), service (sub-sectors and end users), transport (rail, road, air, water) and agriculture and fishing.
5d Ability to add new measures: Yes/No/Difficult Transport: passenger, freight by mode; Industry: thermal, electricity and non energy uses; Residential: cooking, hot water, space heating, air conditioning, lighting and other electrical uses; Tertiary: thermal and electricity end-uses, public lighting; Agriculture: tractors, water pumping.
5e Linkages to other models: (List of hard linked and soft linked models) - Interfaces
2a Number of existing applications (Users/Licences/Downloads): Unknown, Low (1-20), Medium (20-50), High (100-1,000). Very High (>1,000)
Not Available
2b Number citations in reviewed literature 9
2c Number of countries used in 30
3 Accessibility and Support
3a Level of skill needed (High, medium, low) High
3b Availability of guidance / training (High, medium, low) Low
3c Location of available experience (academia, consultancy, owner model)
Model Owner
3d Support options: Consultants (only), academic/think tanks (only), governments (only)
3e Pricing POLES is only available through a consultancy agreement; the software cannot be purchased.
3f Languages documentation/training available in (English, French, Spanish, Others)
English, French
4 Data Requirements
4a Volume of data required (High, medium, low) Extensive
4b Time steps used in model: e.g. 5 yearly, yearly, month, day, minute etc.
Yearly to 2050
4c Categories of input data required: GDP data, engineering data, price elasticities, historical energy demand, GHG emissions, production data etc.
Energy resources; Power generation; Emission profiles; GDP; Population; Oil and gas resources; Technology costs
4d Data already included or readily available: energy prices: technology costs (capital, fixed operation and maintenance, variable operation and maintenance), CO2 costs etc.
Oil and gas sectors: Discoveries and reserves for 87 producers, international trade of energy products for oil and natural gas, GHG emissions, Endogenous international energy prices and markets. Supplementary module: GHG Marginal Abatement Cost Curves (MACCs)
4e Fall back options (if national data not available) and its impacts e.g. international data.
Model Name TIMES (part of the MARKAL family of models)
1 Type of Model Bottom Up: Optimisation
2 How widely used is the model?
2a Number of existing applications (Users/Licences/Downloads): Unknown, Low (1-20), Medium (20-50), High (100-1,000). Very High (>1,000)
High
2b Number citations in reviewed literature Not Available
2c Number of countries used in Used in 70 countries by 250 institutions
3 Accessibility and Support
3a Level of skill needed (High, medium, low) Very High
3b Availability of guidance / training (High, medium, low) Medium
3c Location of available experience (academia, consultancy, owner model)
Public sector
Appendix 1
42
Model Name TIMES (part of the MARKAL family of models)
3d Support options: Consultants (only), academic/think tanks (only), governments (only)
3e Pricing Higher prices for commercial licences than educational licences. Extensive training required.
3f Languages documentation/training available in (English, French, Spanish, Others)
English
4 Data Requirements
4a Volume of data required (High, medium, low) Extensive
4b Time steps used in model: e.g. 5 yearly, yearly, month, day, minute etc.
Flexible, max 50 years
4c Categories of input data required: GDP data, engineering data, price elasticities, historical energy demand, GHG emissions, production data etc.
A complete scenario consists of four types of inputs: energy service demand curves, primary resource supply curves, a policy setting, and the descriptions of a complete set of technologies.
4d Data already included or readily available: energy prices: technology costs (capital, fixed operation and maintenance, variable operation and maintenance), CO2 costs etc.
For the global versions of TIMES, the main drivers are: Population, GDP, GDP per capita, number of households, and sectoral outputs. For sectoral TIMES models, the demand drivers may be different depending on the system boundaries.
4e Fall back options (if national data not available) and its impacts e.g. international data.
5 Detailed information As one example, several global instances of TIMES use the GEM-E3 to generate a set of coherent (national and sectoral) output growth rates in the various regions.
For population and household projections, TIMES instances use the same exogenous sources (IPCC, Nakicenovic 2000, Moomaw and Moreira, 2001).
5b Sectors/sub-sectors covered (number and high level list, e.g.: Energy Supply, Industry, Services (Commercial & Public), Residential, Transport, Agriculture (AFOLU), Waste)
5c Technologies & Mitigation Measures covered (number or high level list)
5d Ability to add new measures: Yes/No/Difficult Global, Regional, National, Local
5e Linkages to other models: (List of hard linked and soft linked models) - Interfaces
Energy Supply (5), Storage (3), Transport (16), Residential (12)
5f Useful links:
Suppliers website
Applications:
Case Studies: http://iea-etsap.org/index.php/etsap-tools/model-generators/times
43
Appendix 2 – Key References
[1] Hay, S., & Ferguson, A. (2015). A Review of Power System Modelling Platforms and Capabilities. IET Special Interest Publication for the Council for Science and Technology, (March), 3–13.
[2] Ben Amer, S., & Nielsen, P. S. (2016). A comparison of modelling tools for energy planning. Cities 3rd General Consortium Meeting, (May).
[3] Hall, L. M. H., & Buckley, A. R. (2016). A review of energy systems models in the UK: Prevalent usage and categorisation. Applied Energy, 169, 607–628.https://doi.org/10.1016/j.apenergy.2016.02.044
[4} Ecofys, Ids, Hagemann, M., Hendel-Blackford, S., Höhne, N., Harvey, B., Urban, F. (2011). Guiding climate compatible development User-orientated analysis of planning tools and methodologies. Development, (September).Retrieved from http://www.climateplanning.org/sites/climateplanning.org/files/attachments/Ecofys IDS 2011_Appendices_format.pdf
[5] Pye, S., & Bataille, C. (2016). Improving deep decarbonization modelling capacity for developed and developing country contexts. Climate Policy, 16(sup1), S27–S46.https://doi.org/10.1080/14693062.2016.1173004
Appendix 3 – Glossary
AFOLU Agriculture, Forestry and Other Land Use
GACMO Greenhouse Gas Abatement Cost Model
CGE Computable General Equilibrium
CH4 Methane
CO2 Carbon Dioxide
E3ME Energy-Environment-Economy Model for Europe
EFOM Energy Flow Optimisation Model
EPPA Emissions Prediction and Policy Analysis
GDP Gross Domestic Product
GHG Greenhouse Gas
Appendix 2
44
GLOBIUM Global Biosphere Management Model
HFC Hydrofluorocarbons
ICES Intertemporal Computable Equilibrium System
INDC Intended Nationally Determined Contribution
IPCC Intergovernmental Panel on Climate Change
LEAP Long-range Energy Alternatives Planning
MACC Marginal Abatement Cost Curve
MARKAL Market Allocation
MEDEE Model of the Energy DEmand Evaluation
MedPro Successor to the MEDEE model
N2O Nitrous Oxide
NDC Nationally Determined Contribution
OSeMOSYS Open Source Energy Modelling System
PFC Perfluorocarbons
POLES Prospective Outlook on Long-term Energy Systems
SF6 Sulphur Hexafluoride
TIMES The Integrated MARKAL-EFOM System
UNFCCC United Nations Framework Convention on Climate Change
Deutsche Gesellschaft für Internationale Zusammenarbeit (GIZ) GmbH
Agencia de la GIZ en MéxicoTorre Hemicor, PHAv. Insurgentes Sur No. 826Col. Del Valle03100 CDMX, MéxicoT +52 55 5536 2344E [email protected] www.giz.de/mexico-mx www.youtube.com/user/gizmexico


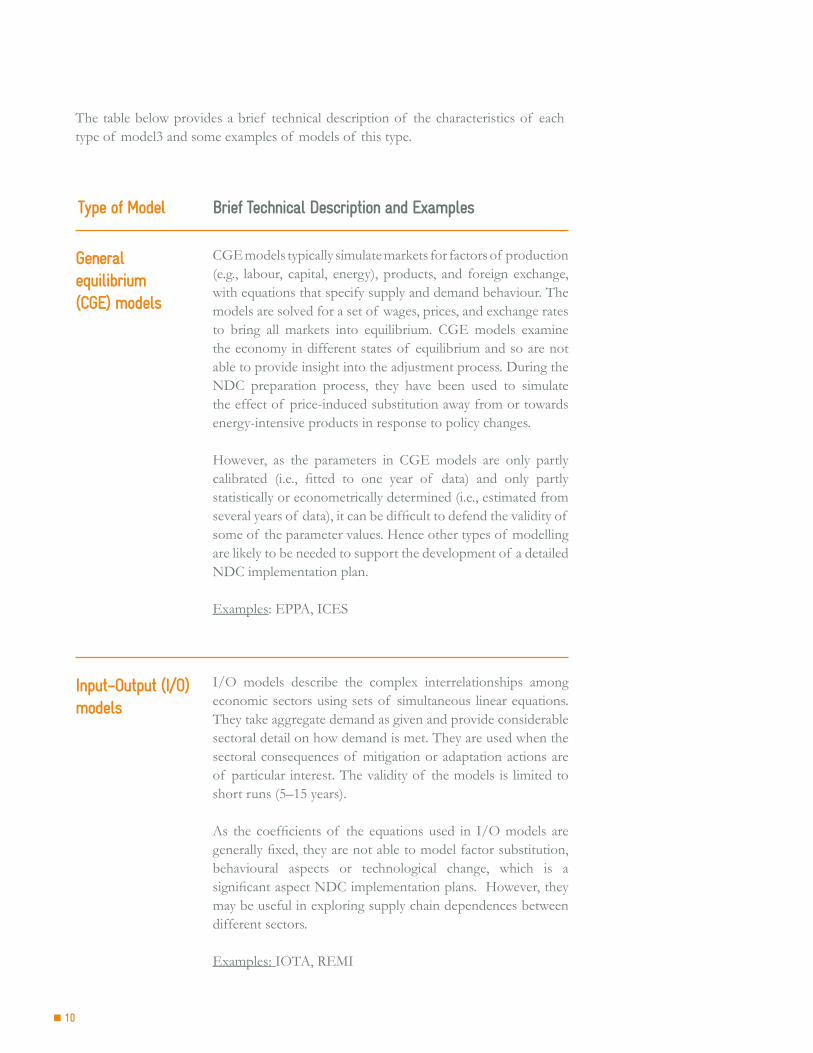
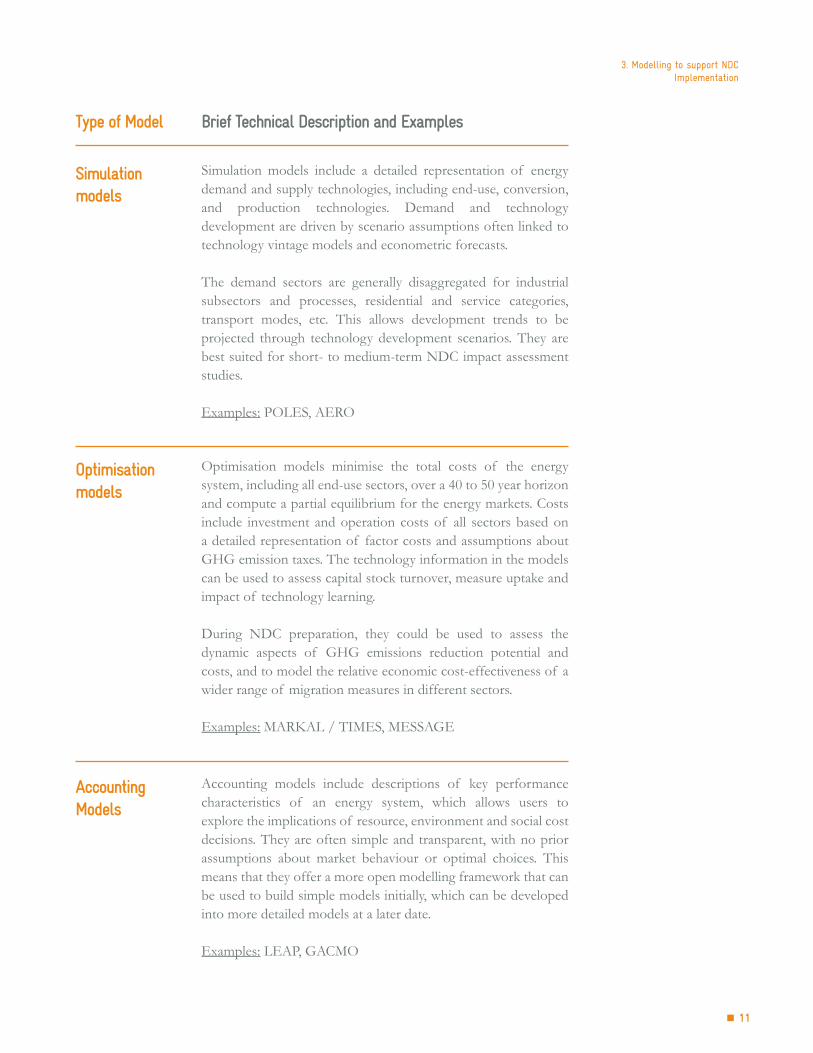

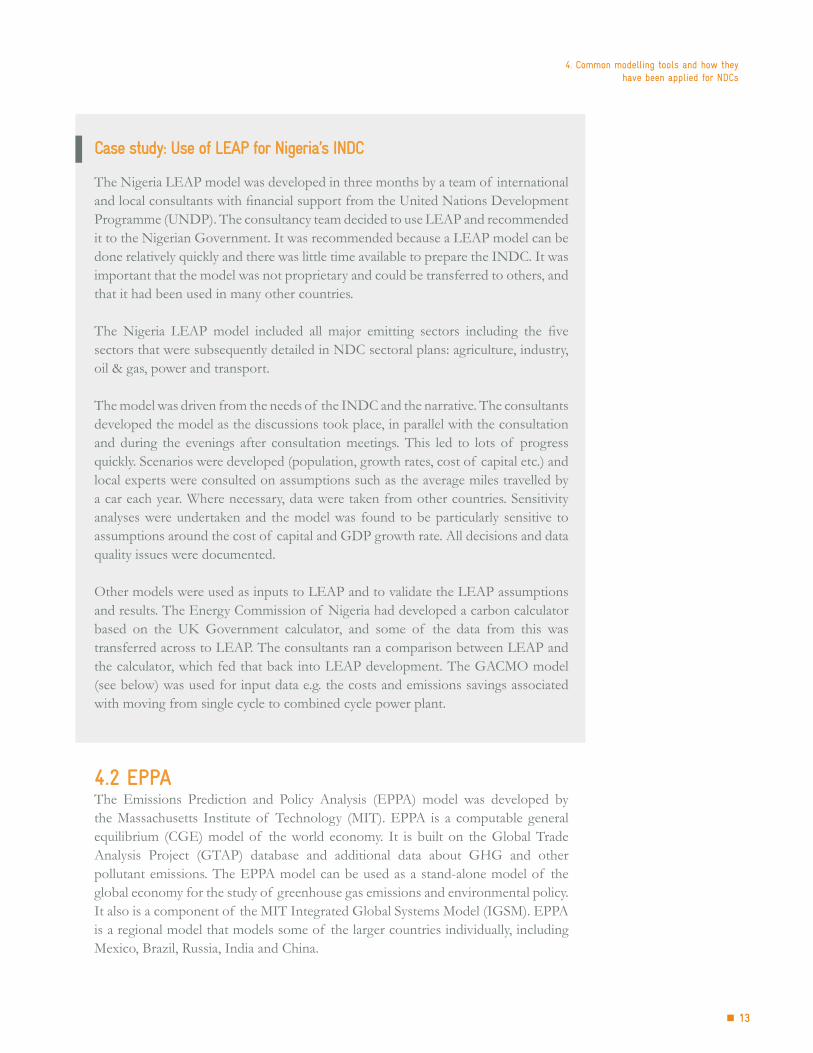
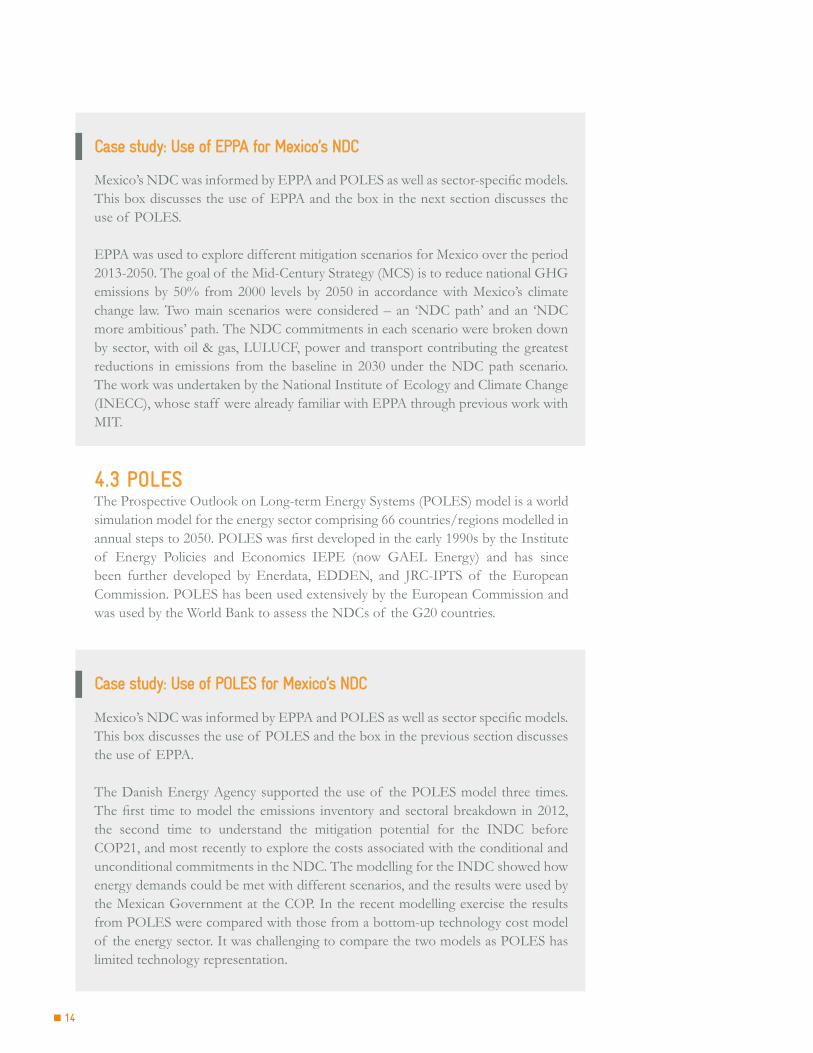
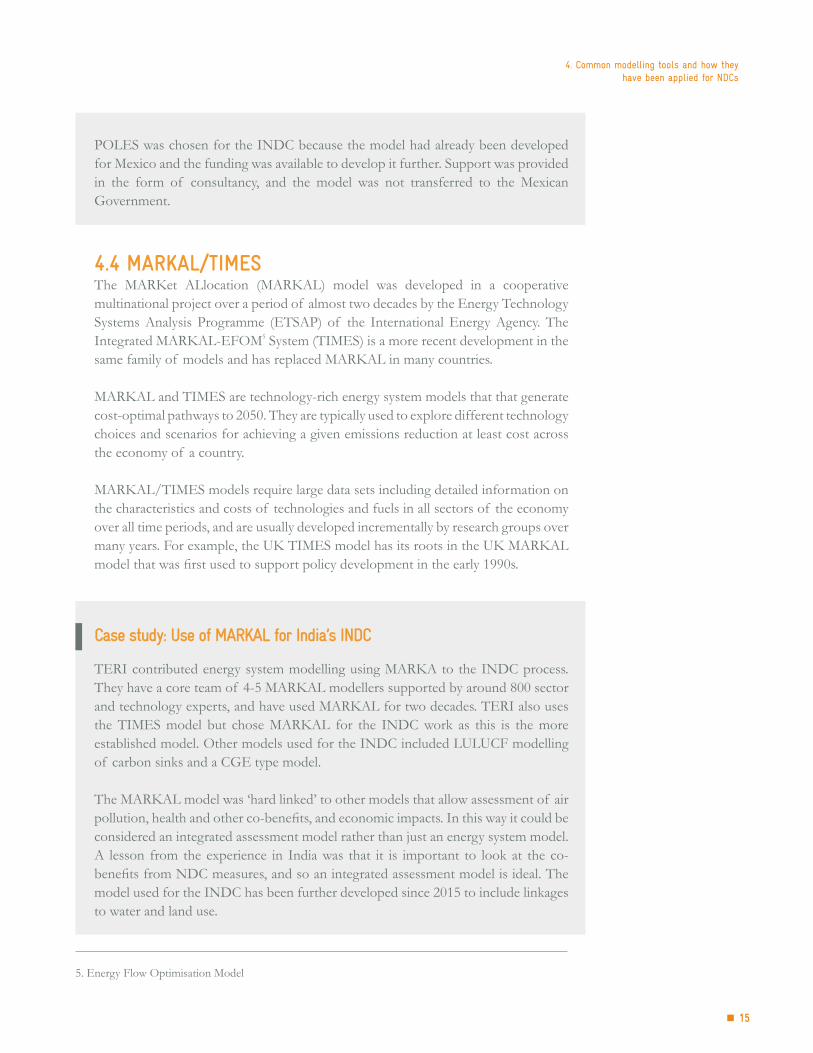
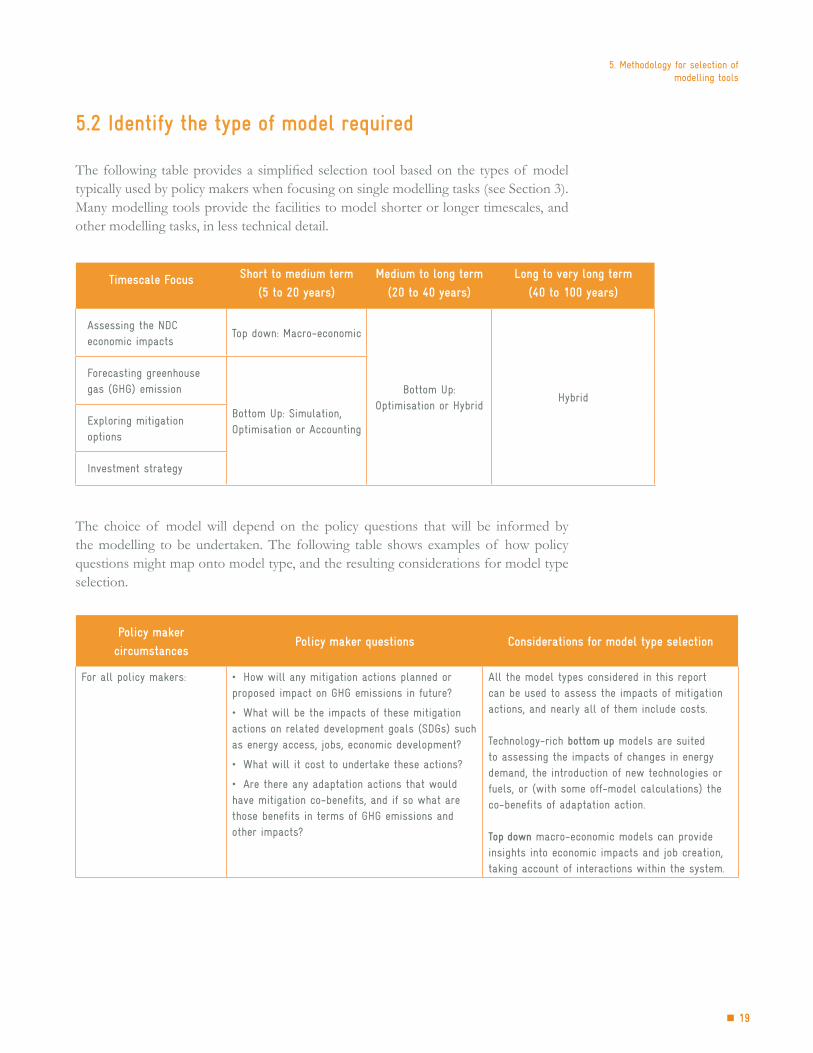
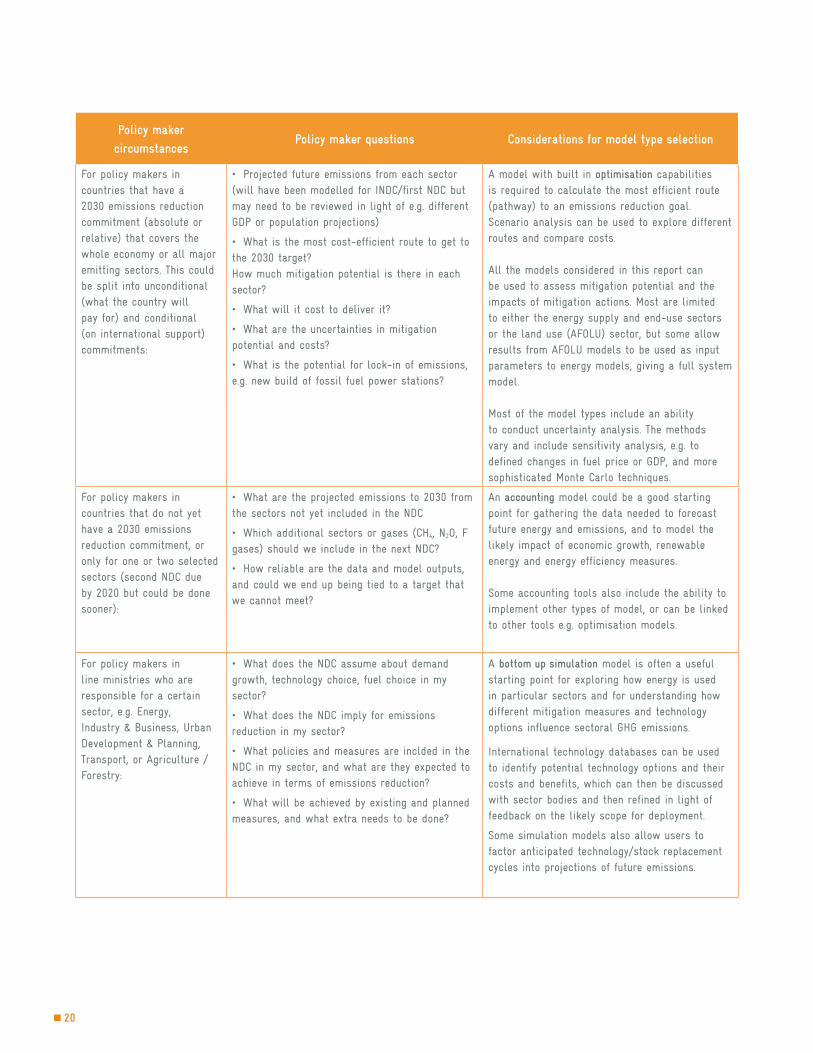
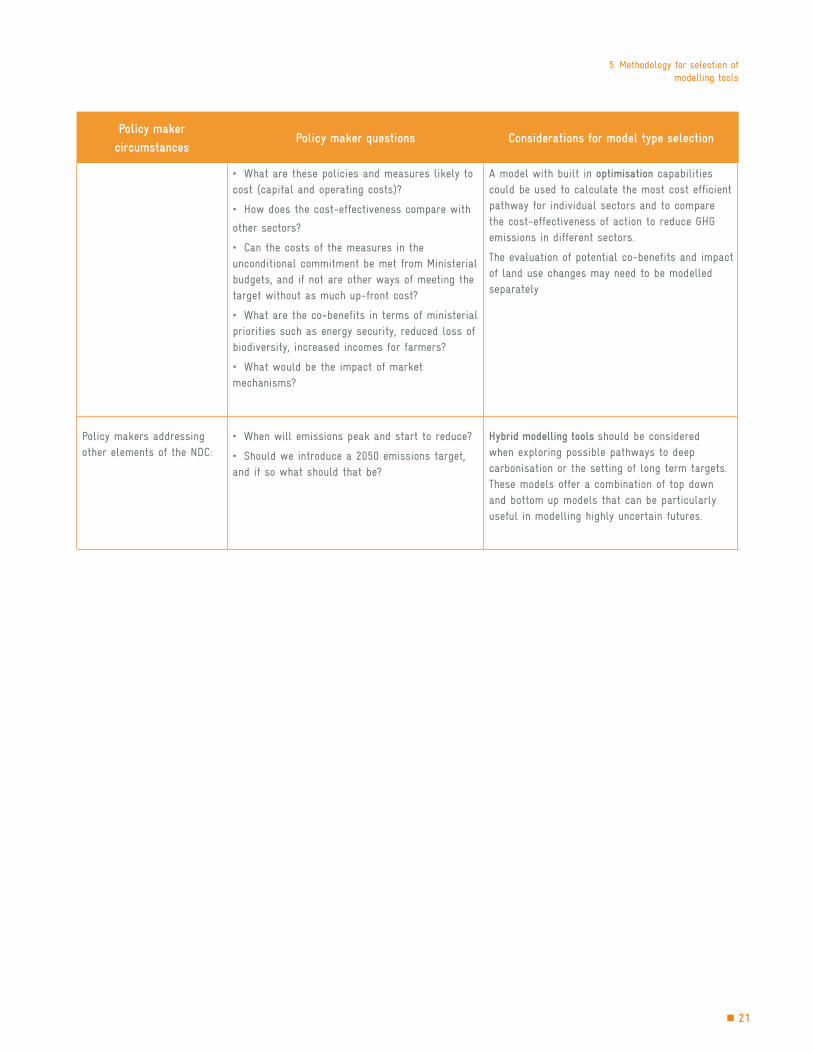
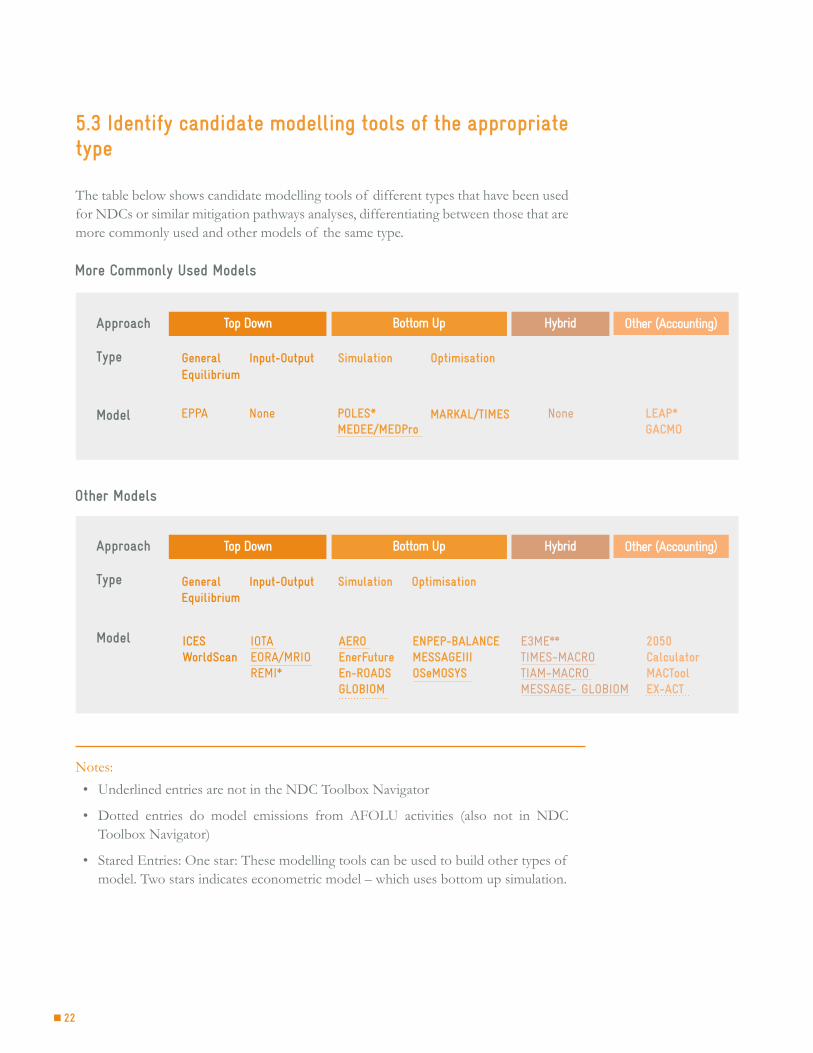


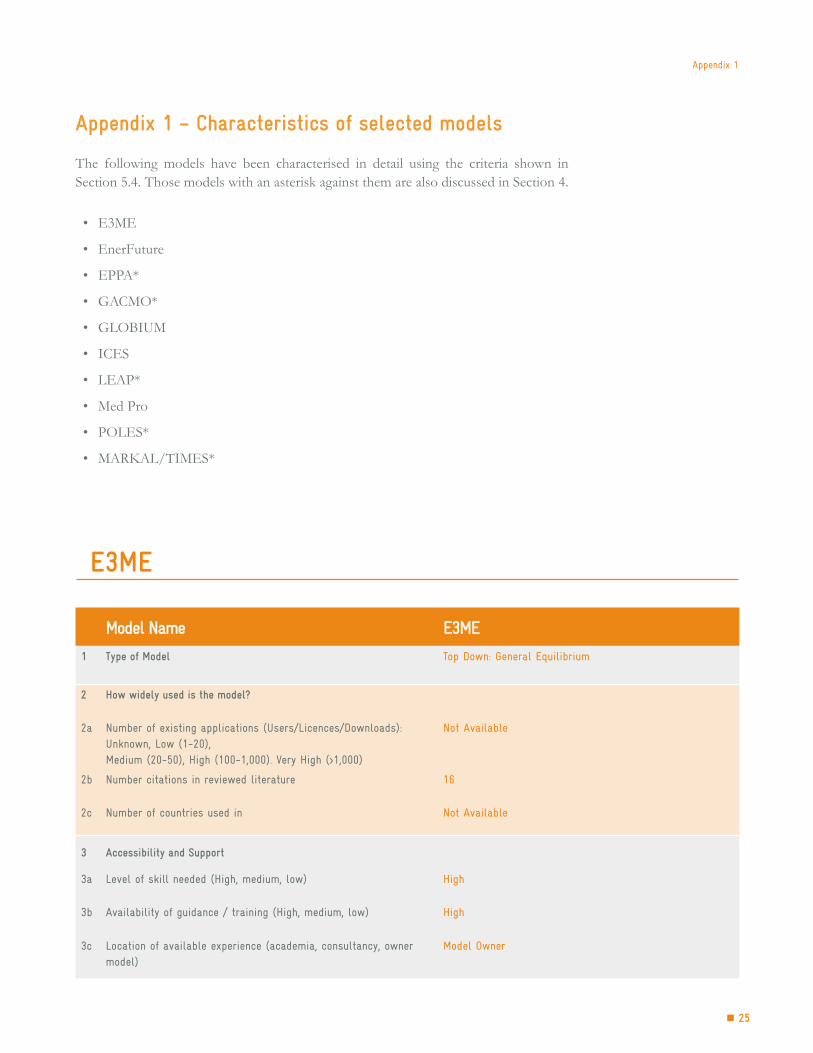

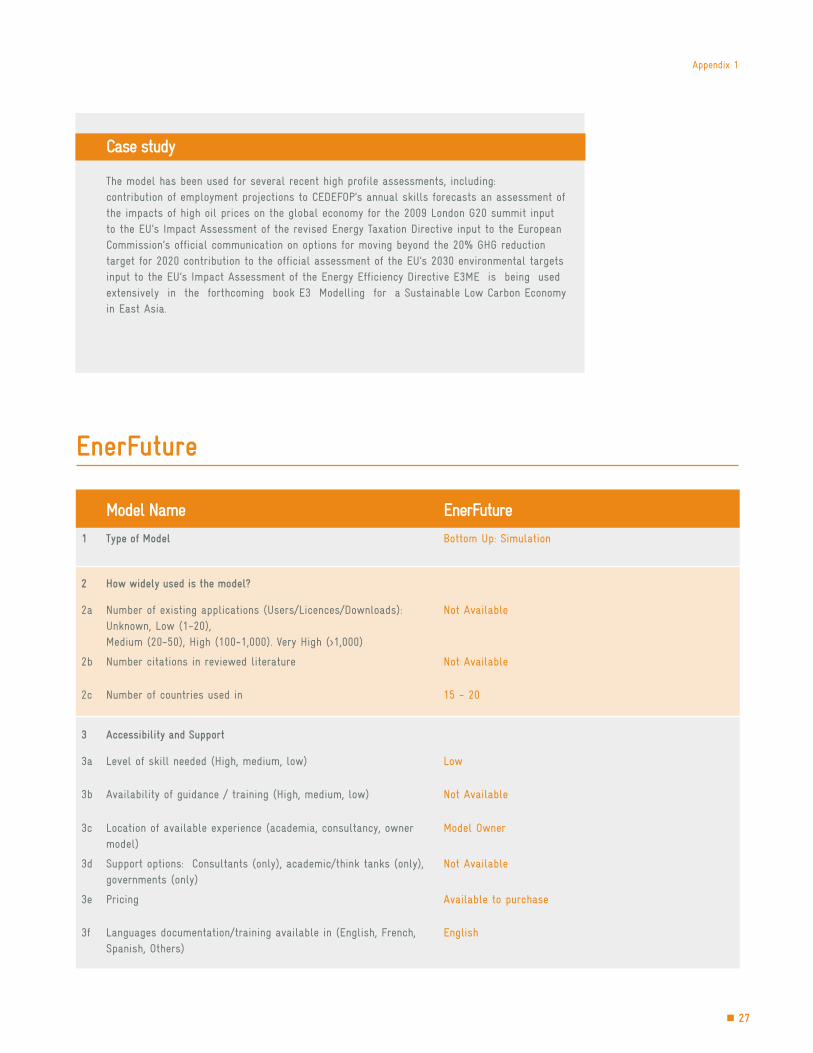
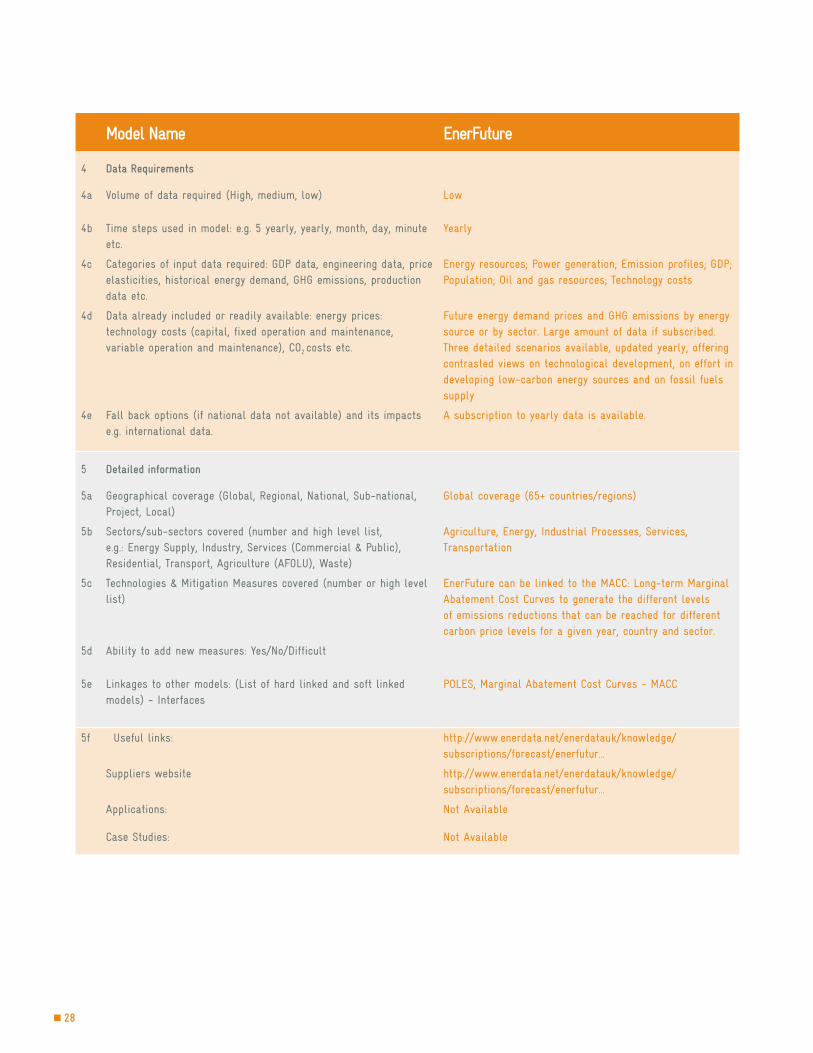

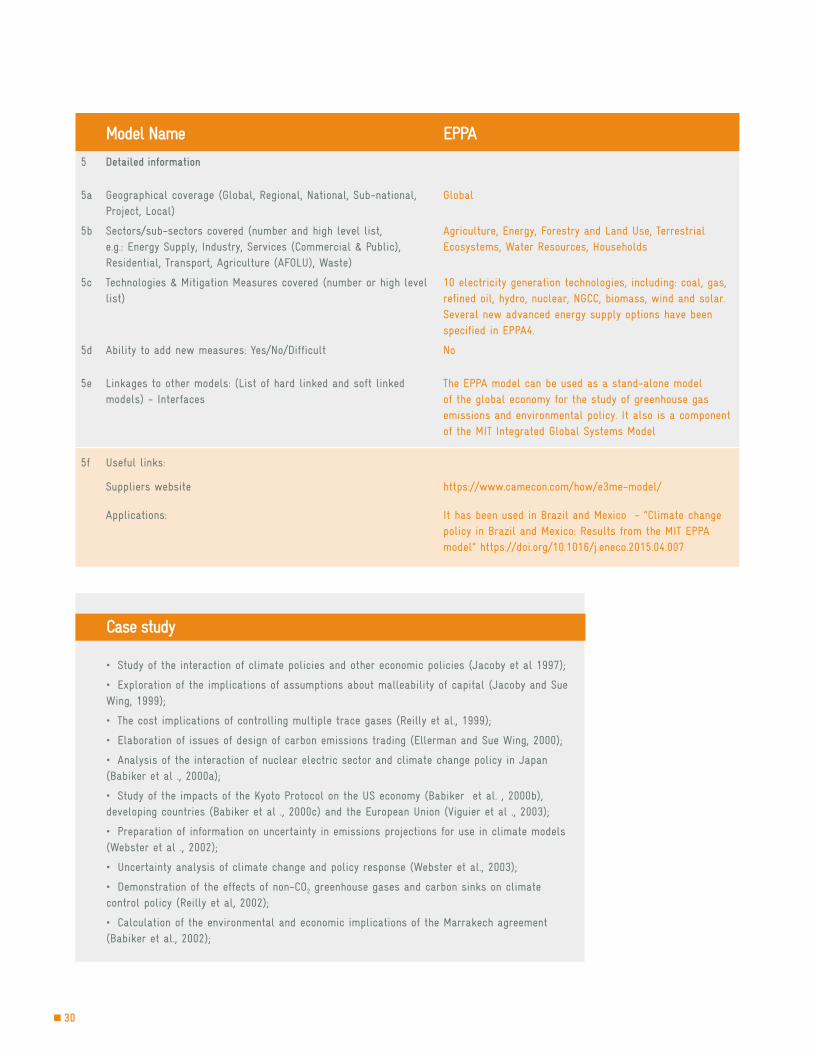
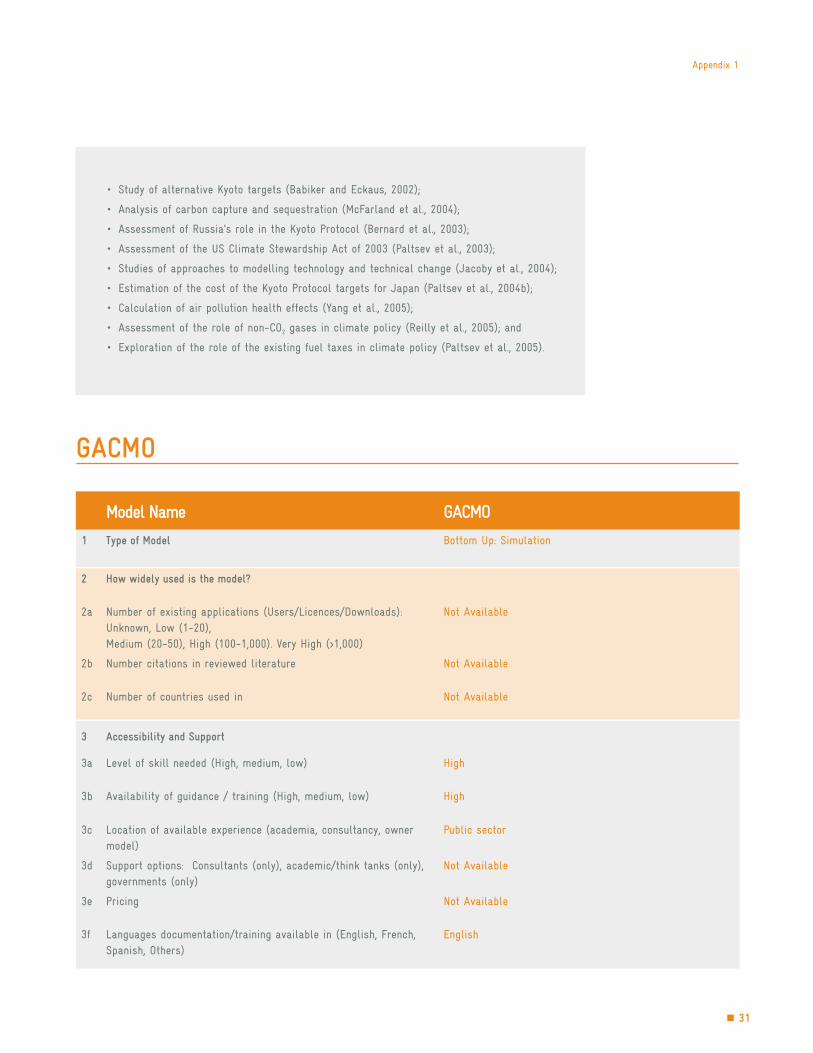


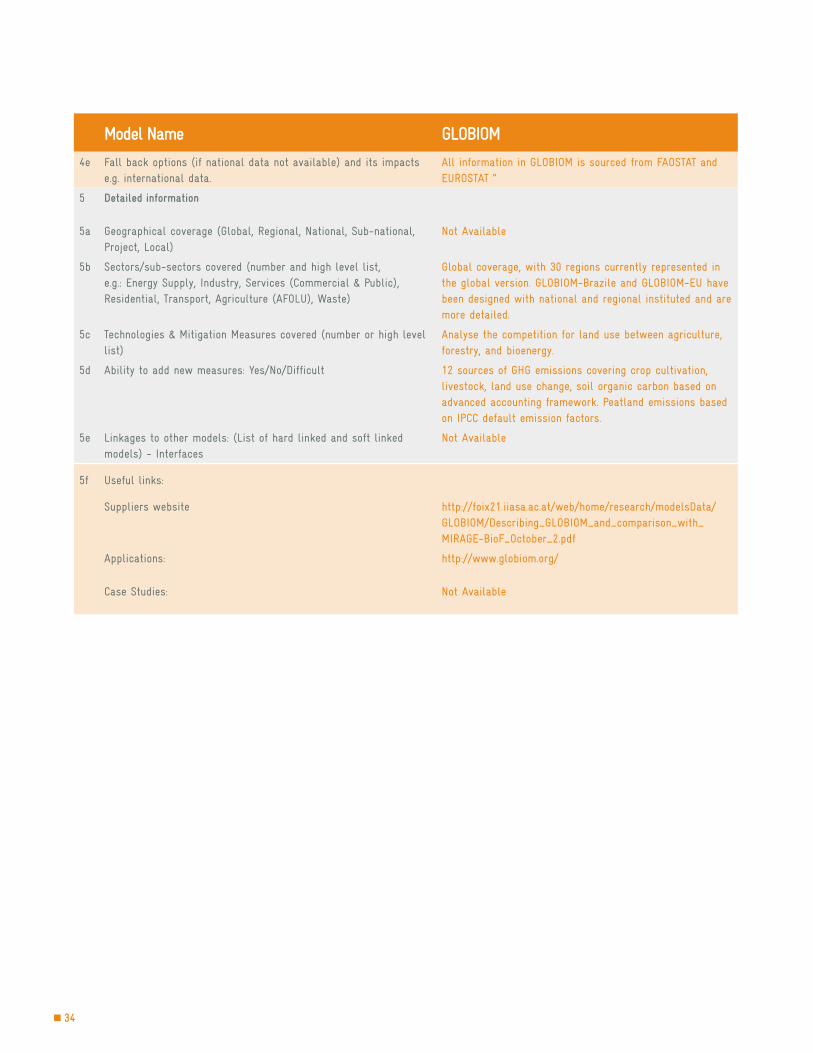

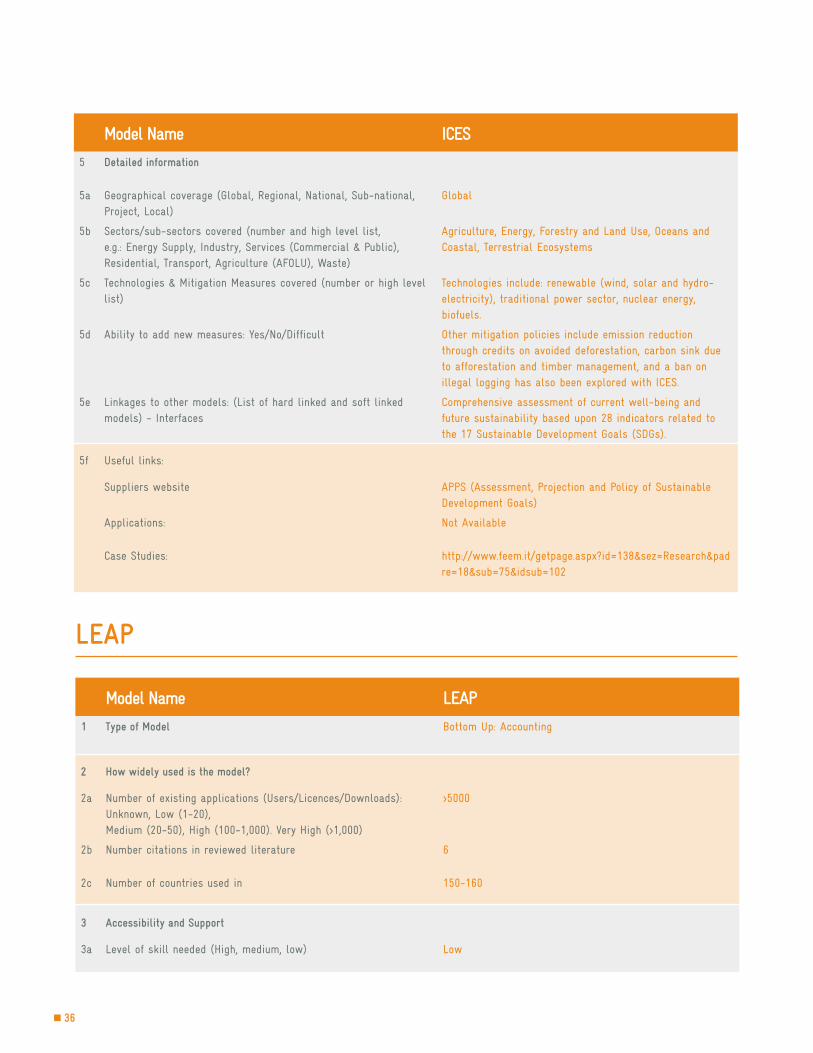
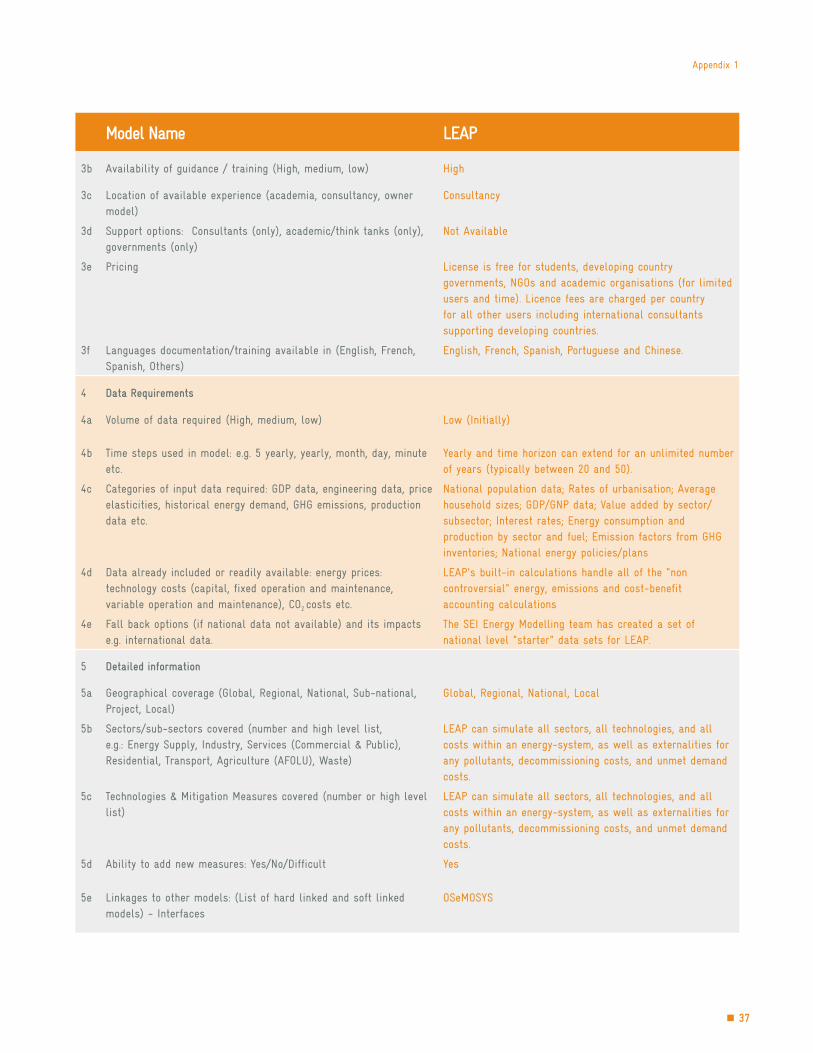
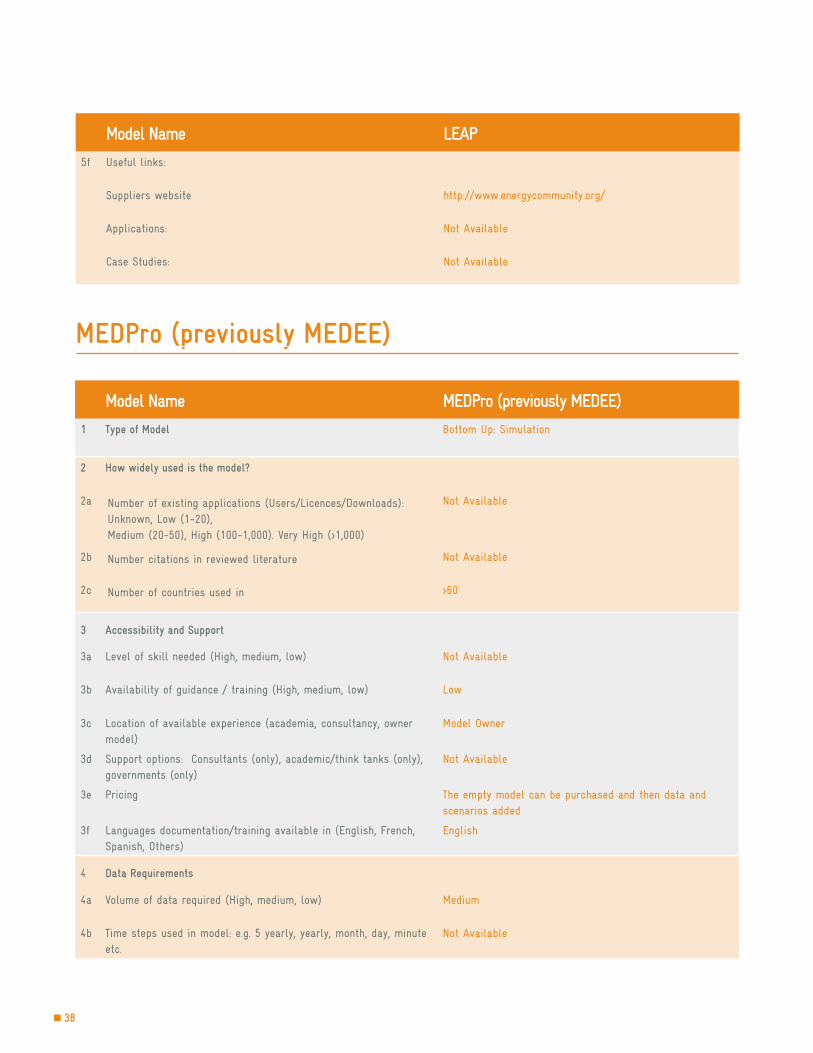


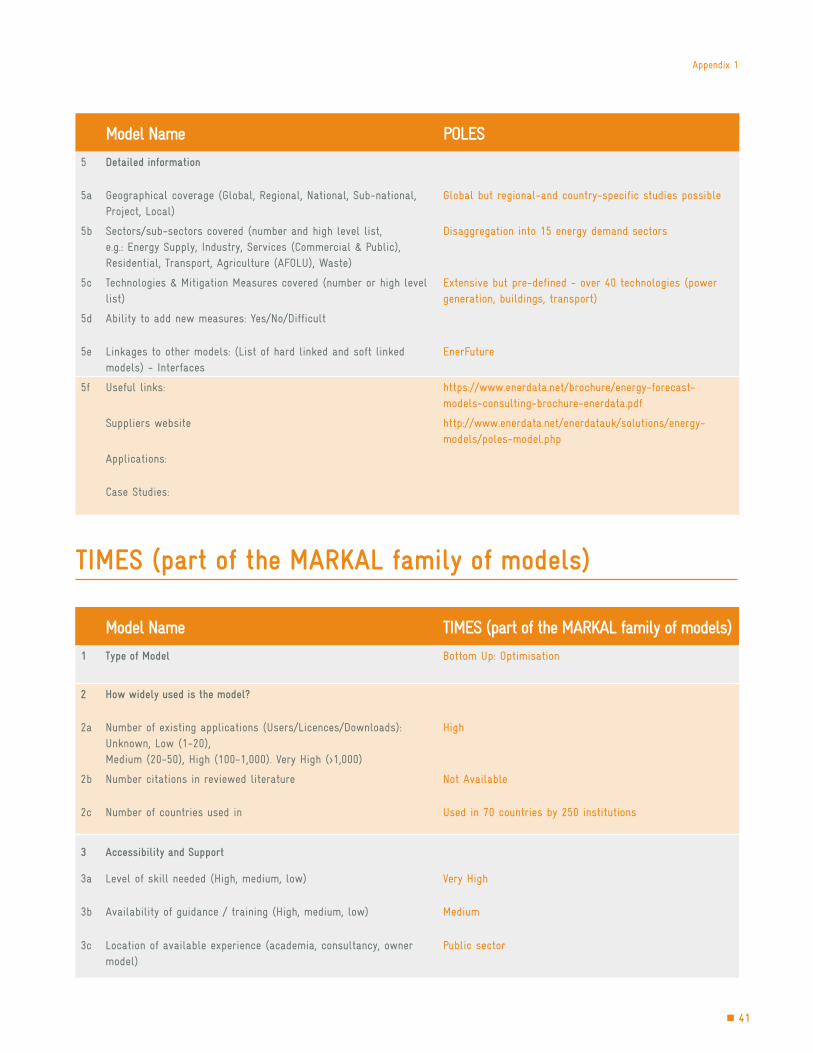


![UN Campus Platz der Vereinten Nationen 1 53113 Bonn Germany › e-forum › vc_ye_synthesis.pdf · Platz der Vereinten Nationen 1 53113 Bonn Germany Tel: [+49] 228 815 0100 Fax: [+49]](https://static.documents.pub/doc/80x56/5f1044b37e708231d4484567/un-campus-platz-der-vereinten-nationen-1-53113-bonn-germany-a-e-forum-a-vcyesynthesispdf.jpg)