Simulation of a non-equilibrium helium plasma bullet emerging into oxygen at high pressure (250–760 Torr) and interacting with a substrate Wen Yan 1,2 and Demetre J. Economou 2,a) 1 School of Physics and Materials Engineering, Dalian Nationalities University, Dalian 116600, People’s Republic of China 2 Plasma Processing Laboratory, Department of Chemical and Biomolecular Engineering, University of Houston, Houston, Texas 77204, USA (Received 16 June 2016; accepted 6 September 2016; published online 27 September 2016) A two-dimensional computational study of a plasma bullet emanating from a helium gas jet in oxygen ambient at high pressure (250–760 Torr) was performed, with emphasis on the bullet inter- action with a substrate. Power was applied in the form of a trapezoidal þ5 kV pulse lasting 150 ns. A neutral gas transport model was employed to predict the concentration distributions of helium and oxygen in the system. These were then used in a plasma dynamics model to investigate the characteristics of the plasma bullet during its propagation and interaction with a substrate. Upon ignition, the discharge first propagated as a surface wave along the inner wall of the containing tube, and then exited the tube with a well-defined ionization front (streamer or plasma bullet). The plasma bullet evolved from a hollow (donut-shaped) feature to one where the maximum of ioniza- tion was on axis. The bullet propagated in the gap between the tube exit and the substrate with an average speed of 2 10 5 m/s. Upon encountering a metal substrate, the bullet formed a conduc- tive channel to the substrate. Upon encountering a dielectric substrate, the bullet turned into an ion- ization wave propagating radially along the substrate surface. For a conductive substrate, the radial species fluxes to the surface peaked on the symmetry axis. For a dielectric substrate, a ring-shaped flux distribution was observed. The “footprint” of plasma-surface interaction increased either by decreasing the gap between tube exit and substrate, decreasing the relative permittivity of an insu- lating substrate, or decreasing pressure. As the system pressure was lowered from 760 to 250 Torr, the discharge was initiated earlier, and the plasma bullet propagation speed increased. A reverse electric field developed during the late stages of the ramp-down of the pulse, which accelerated electrons forming a brief backward discharge. Published by AIP Publishing. [http://dx.doi.org/10.1063/1.4963115] I. INTRODUCTION Non-thermal (cold) high pressure (notably 1 atm) plas- mas are investigated intensely because of current and future applications ranging from surface modification and materials processing to plasma medicine. 1–6 Various types of non- thermal plasma sources have been developed and studied. 7,8 In particular, cold atmospheric pressure plasma jets (APPJ) have attracted considerable attention, compared to other plasmas in confined geometries, primarily due to their ability to deliver various active species to relatively remote loca- tions for localized treatment. Understanding the physical and chemical processes tak- ing place in the plasma jet is critically important. To this end, numerous experimental and simulation studies have contributed to a better understanding of these systems. For example, it was demonstrated that the plasma jet is typically composed of streamers or “plasma bullets” propagating at supersonic speeds (10 4 –10 5 m/s). 9,10 Images revealed that the bullet is in fact hollow, having a donut-shaped structure. 11,12 Plasma diagnostics showed that the streamer dynamics depends on electron temperature. 13 Using two-photon laser-induced fluorescence spectroscopy, the O number den- sity in a plasma jet emerging in 1 atm air ambient was found to reach 5.8 10 15 cm 3 . 14 Experimental measurements have been complemented by modeling and simulation. Several research groups have developed two-dimensional (2-D) axisymmetric models to explain the experimental observations. Using the local field approximation, Naidis 15,16 successfully simulated the donut- shaped plasma bullet and showed that the formation of such structure is due to radial non-uniformity of the electron impact ionization rate of the gas species. The computational studies by Breden et al. 17,18 and Norberg et al. 19 provided valuable insights into the dynamics of plasma bullet propa- gation and its interaction with surfaces. Plasma jets can be generated in different gases using different means of electrical excitation. A typical plasma jet consists of a dielectric tube through which a jet of noble gas exhausts into an ambient gas. High voltage (HV) nanosecond pulse waveforms are applied to a ring electrode wrapped around the tube to form a plasma jet. 10 The gas is near room temperature, making these devices ideal for the treatment of thermosensitive materials (e.g., human skin). Previous experimental studies by Xian et al. 20 and Schmidt-Bleker et al. 21 investigated He plasma jets and the a) E-mail: [email protected]0021-8979/2016/120(12)/123304/13/$30.00 Published by AIP Publishing. 120, 123304-1 JOURNAL OF APPLIED PHYSICS 120, 123304 (2016) Reuse of AIP Publishing content is subject to the terms at: https://publishing.aip.org/authors/rights-and-permissions. Download to IP: 129.7.106.18 On: Tue, 27 Sep 2016 15:31:20
Transcript
Simulation of a non-equilibrium helium plasma bullet emerging into oxygenat high pressure (250–760 Torr) and interacting with a substrate
Wen Yan1,2 and Demetre J. Economou2,a)
1School of Physics and Materials Engineering, Dalian Nationalities University, Dalian 116600,People’s Republic of China2Plasma Processing Laboratory, Department of Chemical and Biomolecular Engineering,University of Houston, Houston, Texas 77204, USA
(Received 16 June 2016; accepted 6 September 2016; published online 27 September 2016)
A two-dimensional computational study of a plasma bullet emanating from a helium gas jet in
oxygen ambient at high pressure (250–760 Torr) was performed, with emphasis on the bullet inter-
action with a substrate. Power was applied in the form of a trapezoidal þ5 kV pulse lasting 150 ns.
A neutral gas transport model was employed to predict the concentration distributions of helium
and oxygen in the system. These were then used in a plasma dynamics model to investigate the
characteristics of the plasma bullet during its propagation and interaction with a substrate. Upon
ignition, the discharge first propagated as a surface wave along the inner wall of the containing
tube, and then exited the tube with a well-defined ionization front (streamer or plasma bullet). The
plasma bullet evolved from a hollow (donut-shaped) feature to one where the maximum of ioniza-
tion was on axis. The bullet propagated in the gap between the tube exit and the substrate with an
average speed of �2� 105 m/s. Upon encountering a metal substrate, the bullet formed a conduc-
tive channel to the substrate. Upon encountering a dielectric substrate, the bullet turned into an ion-
ization wave propagating radially along the substrate surface. For a conductive substrate, the radial
species fluxes to the surface peaked on the symmetry axis. For a dielectric substrate, a ring-shaped
flux distribution was observed. The “footprint” of plasma-surface interaction increased either by
decreasing the gap between tube exit and substrate, decreasing the relative permittivity of an insu-
lating substrate, or decreasing pressure. As the system pressure was lowered from 760 to 250 Torr,
the discharge was initiated earlier, and the plasma bullet propagation speed increased. A reverse
electric field developed during the late stages of the ramp-down of the pulse, which accelerated
electrons forming a brief backward discharge. Published by AIP Publishing.[http://dx.doi.org/10.1063/1.4963115]
I. INTRODUCTION
Non-thermal (cold) high pressure (notably 1 atm) plas-
mas are investigated intensely because of current and future
applications ranging from surface modification and materials
processing to plasma medicine.1–6 Various types of non-
thermal plasma sources have been developed and studied.7,8
In particular, cold atmospheric pressure plasma jets (APPJ)
have attracted considerable attention, compared to other
plasmas in confined geometries, primarily due to their ability
to deliver various active species to relatively remote loca-
tions for localized treatment.
Understanding the physical and chemical processes tak-
ing place in the plasma jet is critically important. To this
end, numerous experimental and simulation studies have
contributed to a better understanding of these systems. For
example, it was demonstrated that the plasma jet is typically
composed of streamers or “plasma bullets” propagating at
supersonic speeds (104–105 m/s).9,10 Images revealed that the
bullet is in fact hollow, having a donut-shaped structure.11,12
Plasma diagnostics showed that the streamer dynamics
depends on electron temperature.13 Using two-photon
laser-induced fluorescence spectroscopy, the O number den-
sity in a plasma jet emerging in 1 atm air ambient was found
to reach 5.8� 1015 cm�3.14
Experimental measurements have been complemented
by modeling and simulation. Several research groups have
developed two-dimensional (2-D) axisymmetric models to
explain the experimental observations. Using the local field
approximation, Naidis15,16 successfully simulated the donut-
shaped plasma bullet and showed that the formation of such
structure is due to radial non-uniformity of the electron
impact ionization rate of the gas species. The computational
studies by Breden et al.17,18 and Norberg et al.19 provided
valuable insights into the dynamics of plasma bullet propa-
gation and its interaction with surfaces.
Plasma jets can be generated in different gases using
different means of electrical excitation. A typical plasma jet
consists of a dielectric tube through which a jet of noble gas
exhausts into an ambient gas. High voltage (HV) nanosecond
pulse waveforms are applied to a ring electrode wrapped
around the tube to form a plasma jet.10 The gas is near room
temperature, making these devices ideal for the treatment of
thermosensitive materials (e.g., human skin).
Previous experimental studies by Xian et al.20 and
Schmidt-Bleker et al.21 investigated He plasma jets and thea)E-mail: [email protected]
0021-8979/2016/120(12)/123304/13/$30.00 Published by AIP Publishing.120, 123304-1
JOURNAL OF APPLIED PHYSICS 120, 123304 (2016)
Reuse of AIP Publishing content is subject to the terms at: https://publishing.aip.org/authors/rights-and-permissions. Download to IP: 129.7.106.18 On: Tue, 27 Sep 2016
resulting bullets propagating in oxygen ambient. Xian
et al.20 observed that the plasma jet became shorter and thin-
ner by increasing the mole fraction of O2 in the ambient gas.
Winter et al.22 found a drastic decrease in the measured
metastable He density by decreasing the mole fraction of
oxygen in the ambient gas. Several simulations23–25 were
performed to investigate the generation mechanism of reac-
tive oxygen species in discharges fed by He/O2 mixtures.
Schmidt-Bleker et al.21 investigated, by a combination of
simulation and experiment, the influence of electronegativity
of the ambient gas on the propagation of the plasma bullet.
Despite the plethora of investigations, however, several
aspects of the effect of substrate conductivity and system
pressure on the plasma jet and its interaction with surfaces
have not been elucidated.
In this work, a two dimensional axisymmetric fluid
model was developed to investigate the discharge dynamics
of a helium high pressure plasma jet emerging in oxygen
ambient. Physical processes including discharge ignition and
propagation inside the tube, plasma bullet propagation in the
open gap, and its interaction with a substrate were studied.
Particular emphasis was placed on the effect of the conduc-
tivity of the substrate surface (conductor vs. insulator) and
system pressure (250–760 Torr).
II. MODEL DEVELOPMENT
The plasma jet configuration studied in this work is
shown in Fig. 1. The overall problem was divided into two
parts: a neutral gas flow model and a plasma dynamics
model. Fig. 1(a) shows the simulation domain; only the right
half of the axisymmetric (r, z) system is shown. The larger
domain (ADEG) was used for the neutral gas model, while
the smaller domain (ACFG) was used for the plasma dynam-
ics model. A detail of the plasma region is shown in Fig.
1(b). Helium gas flowed through a dielectric tube (relative
permittivity of 4) with 2 mm ID (inner diameter). A high
voltage (HV) ring electrode (1.5 mm long with 4 mm ID and
4.4 mm OD (outer diameter)) was embedded in the dielectric
wall, similar to the works by Raja et al.17,18 and Lu et al.26
The distance between the downstream edge of the HV elec-
trode and the tube exit was 3.5 mm.
A trapezoidal voltage pulse with amplitude of þ5 kV
was applied to the ring electrode, see Fig. 1(c). The rise and
fall time of the voltage was 10 ns each. Thus, the voltage on
the electrode was steady at 5 kV for 130 ns. Following
common practice,15,18,19 only a single pulse was simulated.
This implies that the pulse OFF time interval is long enough
(�gas residence time) for the system volume to be replen-
ished with fresh gas before the next voltage pulse is applied.
The substrate was placed 5 mm away from the tube exit per-
pendicular to the jet axis. Both conductive and insulating
substrates were examined. In the case of insulator (relative
permittivity either 5 or 15), the thickness of the dielectric
layer facing the plasma was 0.5 mm. This layer was on top
of a grounded metal wall.
A. Neutral gas flow model
The helium working gas flowed through the dielectric
tube and emerged into an oxygen ambient. The average gas
flow velocity in the tube was 5 m/s (at 760 Torr), correspond-
ing to a Reynolds number of 86, implying laminar flow. The
neutral gas flow model consisted of the total mass continuity
equation (Eq. (1)), the momentum conservation (Navier-
Stokes) equations (Eq. (2)), and the species mass balance
equation (Eq. (3))
r � ðquÞ ¼ 0; (1)
ðr � quuÞ ¼ �rp� ðr � sÞ þ F; (2)
r � ðquwiÞ þ r � Ji ¼ 0: (3)
Here u is the mass-average velocity of the mixture, q is the mix-
ture density (helium¼ 0.1625 kg m�3, oxygen¼ 1.284 kg m�3
at 760 Torr), s is the stress tensor for a Newtonian fluid,
and F is the body force. wi and Ji are mass fraction and diffu-
sion flux of species i, respectively. For laminar flow,
Ji ¼ �qDirwi, where D is the (molecular) diffusion coeffi-
cient (helium in oxygen¼ 7:2 �10�5 m2 s�1 at 760 Torr
(Ref. 26)). The effect of the plasma on the neutral gas flow
was not considered in this work. An indication of the weak
interaction between neutral gas flow and plasma under the
present conditions is the fact that the temperature of the fluid
in the jet hardly increases above ambient.18,27,28 The bound-
ary conditions are summarized in Table I, with the corre-
sponding boundaries shown in Fig. 1(a). The velocity of the
entrained oxygen ambient gas was set at 0.3 m/s (at 760 Torr)
FIG. 1. Plasma jet configuration stud-
ied: (a) Computational domain; due to
axisymmetric (r, z) nature of the prob-
lem, only half of the domain is shown.
The axis of symmetry is AG. Helium
is fed through boundary AB (1 mm
radius), while O2 enters through annu-
lar boundary CD. (b) Detail of the
plasma region, not showing the region
of injection of the ambient oxygen gas.
(c) Applied voltage.
123304-2 W. Yan and D. J. Economou J. Appl. Phys. 120, 123304 (2016)
Reuse of AIP Publishing content is subject to the terms at: https://publishing.aip.org/authors/rights-and-permissions. Download to IP: 129.7.106.18 On: Tue, 27 Sep 2016
15:31:20
on face CD in Fig. 1(a).29 The governing Equations (1)–(3)
were solved using a steady-state solver in COMSOL.30
B. Plasma dynamics model
Plasma dynamics was governed by a fluid model, which
is based on the continuity Eq. (4), with the drift-diffusion
approximation Eq. (5), the electron energy conservation Eq.
(6) and Poisson’s Eq. (7)31,32
@ni
@tþr � Ci ¼
Xj
Rij; (4)
Ci ¼ sgnðqiÞniliE� Dirni þ uni; (5)
@ neð Þ@tþr � 5
3leEne �
5
3Derne
� �
¼ �eCe � E�X
j
DEjRinel;j � 3me
Mkbne�en Te � Tgð Þ; (6)
e0r � ðerrUÞ ¼ �X
i
qini; (7)
where subscripts i and e indicate the ith species and elec-
trons, respectively. ni is the species density, Ci is the flux (in
the drift-diffusion approximation), Rij is the rate of produc-
tion or consumption of species i in reaction j, qi is the
charge of species i; l and D are mobility and diffusion coef-
ficient, respectively. sgnðqiÞ is the sign function (positive or
negative), E is the electric field, and U is the electric poten-
tial. ne ¼ ne�e is the electron energy density and Te ¼ 23�e is
the electron equivalent temperature. DE and Rinel are the
energy loss during inelastic collisions and the corresponding
reaction rate, respectively. me, M, �en and Tg are the electron
mass, gas species mass, electron-neutral momentum transfer
collision frequency, and gas temperature, respectively. The
right-hand side of the electron energy Eq. (6) consists of
three source terms in the order shown: Joule heating and
inelastic and elastic collisional energy exchange, respec-
tively. Moreover, in Eq. (7), er is the relative permittivity of
the dielectric and e0 is the vacuum permittivity. Table II
summarizes the boundary conditions of the plasma dynamics
model. The boundary conditions for the particle flux and the
electron energy density on solid walls were
Ce � n ¼1
4ne
ffiffiffiffiffiffiffiffiffiffiffi8kbTe
pme
s� as
Xi
ci Ci � nð Þ þ a0sleneE; (8)
Ci � n ¼1
4ni
ffiffiffiffiffiffiffiffiffiffiffi8kbTi
pmi
rþ asliniE; (9)
Cm � n ¼2cm
2� cm
1
4nm
ffiffiffiffiffiffiffiffiffiffiffiffi8kbTg
pmm
s; (10)
Ce � n ¼1
2ne
ffiffiffiffiffiffiffiffiffiffiffi8kbTe
pme
s� as2kbTe
Xi
ci Ci � nð Þ; (11)
where subscripts e, i, m and e indicate electrons, ions, meta-
stables and electron energy, respectively. n is the unit normal
vector pointing towards the surface, ci¼ 0.01 is the secondary
electron emission coefficient by ion impact, and cm is the
wall reaction probability of neutral species m. Ti and Tg are
the ion and background gas temperature, respectively, taken
as Ti¼Tg¼ 300 K; kb is the Boltzmann constant, and as and
a0s are switching functions depending on the dot product of E
and n
as ¼1 ðE � n � 0Þ0 ðE � n < 0Þ;
�a0s ¼
0 ðE � n � 0Þ1 ðE � n < 0Þ:
�(12)
The potential at the surface of a dielectric was calculated
according to Gauss’s law
D2 � D1ð Þ � n ¼ rs;drs
dt¼ Ji � nþ Je � n; (13)
where D1 and D2 are the electric displacement vectors, rs is
the net charge density accumulated on the dielectric surface,
and Je � n and Ji � n are the normal components of the elec-
tron current density and total ion current density on the sur-
face, respectively. In the case of conductive substrate, the
potential of the substrate was set to ground (i.e., zero).
A simplified chemistry mechanism15,33 was used in this
investigation, which involved reactions in the gas phase as
well as recombination and quenching reactions on solid sur-
faces. The species considered in the model were He, metasta-
ble He*¼He(23S1), excimer He2*¼He2(a3Ru), Heþ, He2
þ,
O2, O, O2�, O2
þ, and electrons. The gas phase reaction
mechanism is shown in Table III. For reactions involving
TABLE I. Boundary conditions for the neutral gas model. Boundaries AB,
CD, etc., are shown in Fig. 1(a). uz and ur are the velocity components in the
axial and radial direction, respectively. n is the unit normal vector pointing
towards the boundary. Values of uz are at 760 Torr, and scale inversely pro-
portionally to pressure.
AB CD DE EG BIHC
uz 5 m/s 0.3 m/s 0 0 0
ur 0 0 @ur
@r� 1
3r � uð Þ¼ 0a 0 0
wHe 1 0 @wHe
@r¼ 0
@wHe
@z¼ 0
rwHe � n ¼ 0
wO20 1 @wO2
@r¼ 0
@wO2
@z¼ 0
rwO2� n ¼ 0
aCorresponds to zero stress.
TABLE II. Boundary conditions of the plasma dynamics model. Boundaries
AG, AB, etc., are shown in Fig. 1(a). “Ring” is the high voltage electrode.
Ua is the applied voltage.
AG AB BC CH HF GF BIH Ring
ne @ne
@r¼ 0
@ne
@z¼ 0
… … @ne
@r¼ 0
Eq. (8) Eq. (8) …
ni @ni
@r¼ 0
@ni
@z¼ 0
… … @ni
@r¼ 0
Eq. (9) Eq. (9) …
nm @nm
@r¼ 0
@nm
@z¼ 0
… … @nm
@r¼ 0
Eq. (10) Eq. (10) …
ne @ne
@r¼ 0
@ne
@z¼ 0
… … @ne
@r¼ 0
Eq. (11) Eq. (11) …
U @U@r¼ 0
@U@z¼ 0
@U@z¼ 0
0 0 0 Eq. (13) Ua
123304-3 W. Yan and D. J. Economou J. Appl. Phys. 120, 123304 (2016)
Reuse of AIP Publishing content is subject to the terms at: https://publishing.aip.org/authors/rights-and-permissions. Download to IP: 129.7.106.18 On: Tue, 27 Sep 2016
15:31:20
electron collision with heavy species, the reaction rate coeffi-
cients were obtained using BOLSIGþ, a Boltzmann equation
solver.34 The electron transport coefficients were also calcu-
lated using BOLSIGþ. The cross-sections used in the calcu-
lation were obtained from Ref. 35. The transport coefficients
for ions and metastables were obtained from Refs. 25 and
36. Photo-ionization was not considered in the model;
following published works,15,16 a background pre-ionization
was assumed, instead. According to Breden et al.,17 photo-
ionization can affect the streamer (plasma bullet) propaga-
tion speed, but it is not needed to sustain the steamer. The
wall destruction probability of He*, He2*, Heþ, He2
þ, O2�,
and O2þ was set equal to unity, whereas the wall recombina-
tion probability of O-atoms was 0.02.37 The system of Eqs.
(4)–(7) and (13) was solved by a time-dependent solver in
COMSOL.30 Triangular finite elements were used with a
finer grid in the region r< 1 mm and close to the substrate
surface. The minimum mesh size was 0.01 mm. Nearly
12 000 elements were employed and the total number of
degrees of freedom was �1 000 000. Reducing the grid size
to half of that of the base case, yielded profiles essentially
identical to the base case, implying grid convergence.
A question can arise concerning the effect of rotational
and vibrational states of molecular oxygen on the system
behavior. A test simulation including several vibrational
excitation channels of oxygen showed no significant effect
of these processes on the plasma bullet dynamics. This may
be due to the high electron temperatures in the system (see
below) that favor high activation energy processes. Indeed,
plasma bullet propagation is governed by electron-impact
ionization of helium atoms and oxygen molecules.17
The neutral gas flow model and the plasma dynamics
model were solved sequentially. This time, the splitting
approach is valid because of the disparate time scales of the
neutral gas flow and the plasma flow. In addition, the cou-
pling between the neutral gas flow model and the plasma
dynamics model is rather weak.18,27,28 First, the neutral gas
flow model was solved to obtain the steady-state fluid veloc-
ity and concentration (He and O2) profiles. These were in
turn used as input to the plasma dynamics model to obtain
the time-dependent charged and minority neutral species
concentrations as well as the electric field profiles. This sim-
ulation method is similar to that reported by Naidis15,16 and
Breden and Raja.18
III. RESULTS AND DISCUSSION
The base case parameter values used in the simulation
were as follows: geometry as shown in Figure 1; pressure,
760 Torr; gas temperature, 300 K; applied voltage, þ5 kV
for 150 ns (including 10 ns rise time and 10 ns fall time);
5 mm gap between the tube exit and the substrate; and
conductive (metal) substrate. The effect of a 3 mm gap, a
0.5 mm-thick insulating substrate having relative permittivity of
5 or 15, as well as the effect of system pressure (250–760 Torr)
was investigated.
A. Steady state properties of the neutral gas
Figure 2 shows the helium mole fraction distribution for
the base case as well as for a 3 mm gap. The helium mole
fraction is essentially unity inside the tube. Back diffusion of
oxygen into the tube is negligible since the corresponding
TABLE III. Reactions included in the model. Reaction rate coefficients were described by an Arrhenius form k ¼ ATB exp ð�C=TÞ. For electron impact reac-
tions, T is the electron temperature in eV, and for reaction between heavy species, T is the gas temperature also in eV. Species “M” in reaction (R21) represents
a third-body.
Helium–oxygen chemistry (units are molecules-meter-electron volt)
Index Reaction A B C Threshold energy (eV) References
(R1) Heþ e! eþHe* BOLSIGþ 19.8 34 and 35
(R2) Heþ e!2 eþHeþ BOLSIGþ 24.6 34 and 35
(R3) eþHe*!2 eþHeþ 4.661� 10�16 0.6 4.78 4.78 18
(R4) 2He*!eþHeþHeþ 4.5� 10�16 0 0 �15 18
(R5) eþHe*!eþHe 1.099� 10�17 0.31 0 �19.8 18
(R6) eþHe2*!2 eþHe2
þ 1.268� 10�18 0.71 3.4 3.4 18
(R7) eþHe2þ!He*þHe 5.386� 10�13 �0.5 0 0 18
(R8) He*þ 2He!He2*þHe 1.3� 10�45 0 0 … 18
(R9) Heþþ 2He!He2þþHe 1.0� 10�43 0 0 … 18
(R10) eþHeþ!He* 7.314� 10�17 �0.5 0 0 18
(R11) 2 eþHeþ!eþHe* 1.04� 10�20 �4.5 0 0 18
(R12) eþ 2O2!O2þO2� 6.0� 10�39 �1.0 0 0 18
(R13) eþO2!eþO2(v3) BOLSIGþ 0.57 34 and 35
(R14) eþO2!eþO2(v4) BOLSIGþ 0.75 34 and 35
(R15) eþO2!eþO2(a1) BOLSIGþ 0.977 34 and 35
(R16) eþO2!eþO2(b1) BOLSIGþ 1.627 34 and 35
(R17) eþO2!eþO2(exc) BOLSIGþ 4.5 34 and 35
(R18) eþO2!eþOþO BOLSIGþ 6.0 34 and 35
(R19) eþO2!eþOþO(1D) BOLSIGþ 8.4 34 and 35
(R20) eþO2!2 eþO2þ BOLSIGþ 12.06 34 and 35
(R21) O2�þO2
þþM!2O2þM 3.12� 10�31 �2.5 0 … 18
123304-4 W. Yan and D. J. Economou J. Appl. Phys. 120, 123304 (2016)
Reuse of AIP Publishing content is subject to the terms at: https://publishing.aip.org/authors/rights-and-permissions. Download to IP: 129.7.106.18 On: Tue, 27 Sep 2016
15:31:20
Peclet number is Pe¼ u L/D� 350� 1 where u is the aver-
age helium flow velocity in the tube, L is the tube length,
and D is the diffusion coefficient of oxygen in helium. As
the flow exits the tube, the helium mole fraction decreases in
both the z- and r-direction, due to mixing (by convective
diffusion) of the ambient oxygen with the helium gas. When
the gas reaches the substrate, it flows radially outwards
(stagnation point flow), which is similar to previous simula-
tion results.18 As expected, in the 5 mm gap case, the pure
helium core near the substrate location has smaller diameter,
since oxygen mixing occurs for longer time, compared to
the 3 mm gap. The mole fraction distribution of He in the
He/O2 mixture is critical for confining and guiding the
plasma bullet. In fact, the radial extent of the bullet is con-
fined to the region where the He mole fraction is above
�0.99.15 The plasma cannot be sustained beyond a certain
concentration of oxygen (a certain radial position) because
the ionization rate coefficient vs. E/N (electric field to neu-
tral gas density ratio) decreases sharply as the oxygen mole
fraction in the He-O2 mixture increases.15 The diameter of
the He core of the jet shrinks as a function of distance from
the tube exit, then expands upon striking the substrate (see
below). The constriction of the diameter of the He core of
the jet is not as pronounced in the 3 mm compared to the
5 mm gap.
B. Conductive substrate
Although it appears continuous to the naked eye, the dis-
charge is actually composed of fast ionization waves
(streamers, also called plasma bullets) traveling at supersonic
speeds in the dielectric tube and in the gap between the tube
exit and the substrate.7 The spatio-temporal distribution of
the ionization rate is shown in Fig. 3 for conductive (a) and
insulating (b) substrates. Over a period of the applied voltage
pulse, the discharge starts as a surface ionization wave adja-
cent to the containing tube wall. A plasma bullet then forms
that is launched in the gap at t � 22 ns, and propagates
towards the substrate. The bullet starts as a donut-shaped
structure (ionization peaks off axis), but the “hole” fills in as
the bullet travels further downstream, resulting in peak ioni-
zation on the axis. The average propagation speed of the
plasma bullet in the gap is �2� 105 m/s, in the range of val-
ues reported by other investigators (Ref. 7 and references
therein). Upon striking a metal (conductive) substrate (Fig.
3(a)) at t � 45 ns, the plasma bullet forms a conductive chan-
nel to the substrate. Eventually ionization is suppressed
when the He mole fraction drops below �0.99.
Previous computational studies (Naidis et al.,15 Breden
et al.,38 Boeuf et al.,39 and Lu et al.26) have provided
insights into the structure of the plasma bullet emerging in
air ambient. The main difference in the structure of the
FIG. 2. Helium mole fraction profiles
for (a) 5 mm gap between the tube exit
and the substrate, and (b) 3 mm gap.
Other parameters at their base case
values.
FIG. 3. Spatiotemporal evolution of the
total ionization rate (including reac-
tions (R2), (R3), (R4), (R6), and (R20),
see Table III) for conductive (a), and
insulating (b), substrates. The plasma
bullet is shown at different times dur-
ing a voltage pulse. Rectangular insets
show expanded scale of the plasma bul-
let near the substrate at 45 and 60 ns for
the conductive substrate and 90 and
140 ns, for the insulating substrate.
For t¼ 90 and 140 ns, the ionization
rate is multiplied by 10 for better
visualization.
123304-5 W. Yan and D. J. Economou J. Appl. Phys. 120, 123304 (2016)
Reuse of AIP Publishing content is subject to the terms at: https://publishing.aip.org/authors/rights-and-permissions. Download to IP: 129.7.106.18 On: Tue, 27 Sep 2016
15:31:20
plasma bullet between previous studies and our work is that
the radial extends and the spatial evolution of the ionization
profile of our plasma bullet follows the evolution of the
helium core of Fig. 2, i.e., the bullet constricts as it propa-
gates downstream, only to expand upon hitting the substrate.
Figure 4 shows the spatial distribution of electron den-
sity and electron temperature at t¼ 35, 45, and 140 ns during
a pulse, for a conductive (metal) substrate. When the power
is applied, the discharge is ignited at the downstream edge of
the high voltage ring electrode. A surface discharge forms
near the tubular wall, and the maximum electron temperature
(Te¼ 10.4 eV) is also near the tube wall. At t¼ 22 ns, the
plasma bullet exits the dielectric tube and propagates axially
towards the substrate. At time t¼ 35 ns, the bullet reaches an
axial position of 4.2 mm from the tube exit (see also Fig. 3).
The electron density is initially donut-shaped, but the “hole”
fills-in further downstream, mimicking the behavior of the
plasma bullet. At about t¼ 45 ns, the bullet impacts the
surface, creating a peak in the electron density (and electron
temperature) near the surface. From 45 ns to 140 ns, the dis-
charge “connects” to the substrate via a rather concentrated
spot. The electrons are quite hot near the surface even at
t¼ 140 ns due to the high electric field near the conductive
substrate.
Figure 5 shows the axial electric field and the electron
temperature, along the axis of symmetry (r¼ 0), for different
times during a pulse. Axial position z¼ 6 mm is 1 mm down-
stream from the tube exit, and z¼ 10 mm signifies the sub-
strate surface. Insets show an expanded view (z¼ 9.5–10 mm)
near the substrate. Since the rate of electron-impact reactions
is a strong function of Te, or reduced electric field E/N, it is
important to understand the dependence of these variables on
system parameters. At any given time, the spatial profiles of
the electric field and electron temperature are very similar
(excluding the region near the substrate surface), implying that
the local field approximation may be applicable. In the local
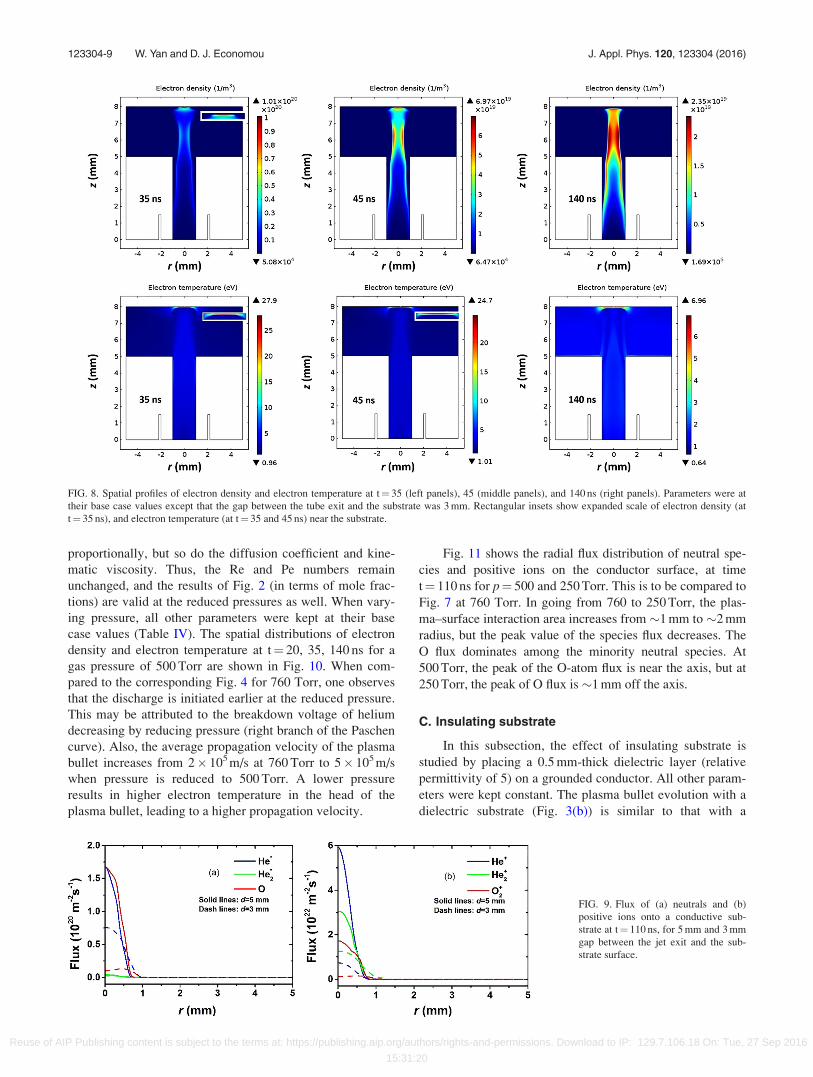
FIG. 4. Spatial profiles of electron density and electron temperature at t¼ 35 (left panels), 45 (middle panels), and 140 ns (right panels). Parameters were at
their base case values. Rectangular insets show expanded scale of electron density and electron temperature near the substrate at t¼ 45 ns.
FIG. 5. Axial electric field (a) and
electron temperature (b) along the axis
of symmetry for several times during a
voltage pulse. Parameters were at their
base case values.
123304-6 W. Yan and D. J. Economou J. Appl. Phys. 120, 123304 (2016)
Reuse of AIP Publishing content is subject to the terms at: https://publishing.aip.org/authors/rights-and-permissions. Download to IP: 129.7.106.18 On: Tue, 27 Sep 2016
15:31:20
field approximation, the electron energy equation (Eq. (6)) is
not used. Instead, the electron energy is assumed to depend on
the local value of the reduced field E/N, where the electric field
E is calculated by the Poisson equation (Eq. (7)).15,16 The rela-
tionship between E/N and average electron energy (or equiva-
lent electron temperature) can be found by solving the
Boltzmann equation. The region next to the substrate is non-
local, e.g., the peak E is at the substrate but the peak Te is a bit
removed from the substrate.
Figure 5 also shows that the peak electric field and elec-
tron temperature are found at the plasma bullet head. As the
bullet approaches the conductive substrate, the axial electric
field and electron temperature at the head both increase. At
t¼ 50 ns, the peak electric field and electron temperature are
148 kV/cm and 25 eV, respectively. After the bullet strikes the
substrate, the electric field and electron temperature decrease
rapidly. The electric field switches signs from positive to nega-
tive near the end (t¼ 150 ns) of the pulse. This is due to resid-
ual charges on the inner surface of the dielectric tube,40 which
now plays the role of cathode, while the substrate switches
roles from cathode to anode. This reverse electric field acceler-
ates electrons towards the substrate, igniting a “backward” dis-
charge, albeit for only a short time. Electron heating by this
field is seen close to the substrate in Fig. 5 (green line).
Figure 6 shows the calculated spatial distribution of spe-
cies densities at t¼ 110 ns. Heþ is generated mainly in the
streamer head by electron impact ionization of He and at a
lower rate in the plasma channel upstream of the head by reac-
tion (R4). The peak value of Heþ density is 5.3� 1018 m�3.
Since Heþ is quickly turned into He2þ by reaction (R9), the
density of He2þ has a similar spatial profile as Heþ. The He2
þ
density is one order of magnitude higher than the Heþ density.
Metastable He* (peak density 9.36� 1020 m�3) has the same
spatial profile as the excimer He2* (peak density 4.27
� 1019m�3). The dominant ion is O2þ, albeit its density is a
bit lower than the sum of the Heþ and He2þ densities. The
peak O-atom density is 2.5� 1021 m�3, commensurate with
measurements,14 implying that the plasma jet is a good source
of reactive O radicals.
A significant advantage of the plasma jet is its ability to
deliver high fluxes of reactive species to a surface under
treatment. Figs. 7(a) and 7(b) show the radial distribution of
the flux of neutrals and ions onto a conductive substrate at
time t¼ 110 ns. The fluxes peak on the axis of symmetry,
and plasma-surface interaction occurs primarily within only
a 1 mm radius. The flux of neutral species is lower than the
positive ion flux, since the only driving force for neutrals is
diffusion, while ions are also under the influence of the elec-
tric field. The He* and O fluxes are dominant among the
neutral species. For positive ions, the Heþ flux dominates,
due to the high mobility of these ions. Negative ions cannot
strike the substrate as long as the sheath repels them.
However, near the end of the pulse, the electric field reverses
and negative ions (as well as accelerated electrons) can strike
the surface. The radial flux distribution of O2� at t¼ 150 ns
is shown in Fig. 7(c). O2� has a similar flux distribution to
that of other species, with a peak flux �4.6� 1019 m�2s�1.
1. Effect of gap size
In this subsection, the effect of decreasing the gap
between the tube exit and the substrate surface from 5 mm to
FIG. 6. Spatial distribution of species densities at 110 ns. Parameters were at their base case values.
123304-7 W. Yan and D. J. Economou J. Appl. Phys. 120, 123304 (2016)
Reuse of AIP Publishing content is subject to the terms at: https://publishing.aip.org/authors/rights-and-permissions. Download to IP: 129.7.106.18 On: Tue, 27 Sep 2016
15:31:20
3 mm is examined. All other parameters were kept at their
base case values. The gas flow model yielded the helium mole
fraction corresponding to this geometry as shown in Figure
2(b). A smaller gap results in thicker pure helium core, which
extends to a larger radial distance along the substrate.
The spatial distributions of electron density and electron
temperature at t¼ 35, 45, and 140 ns are shown in Fig. 8.
Discharge initiation and propagation in the dielectric tube is
hardly affected by the gap size. As the discharge is launched
into the helium–oxygen mixing layer, however, the plasma jet
diameter is larger in the shorter gap, because the exposure
time of the helium jet to the ambient oxygen is shorter, result-
ing in shorter penetration depth of the oxygen into the helium
jet. This is also confirmed by experimental observations.20 In
addition, the smaller gap results in a shorter propagation time
of the streamer from the tube exit to the substrate surface. At
about t¼ 35 ns, the plasma bullet impacts the surface, creating
a peak in the electron density (and electron temperature) near
the surface. The peak electron temperature is 27.9 eV.
After impact, both electron temperature and density near
the surface decrease, as electrons flow from ground to neu-
tralize the positive ion flux. Electrons cannot strike the sub-
strate in the presence of a positive electric field. The electron
density is kept some distance away from the substrate as
shown in Fig. 8 at t¼ 140 ns. A cathode sheath is present,
and the electron temperature in the sheath is about 6 eV.
A comparison of the flux distribution of neutral species
and positive ions, on a conductive surface, at time t¼ 110 ns,
for the two gaps is given in Fig. 9. In both cases, the fluxes
peak on the axis of symmetry and gradually decrease away
from the axis. For the 3 mm gap case, the footprint of the
plasma–surface interaction appears larger than that of the
5 mm case. Decreasing the distance between the tube exit
and the substrate is therefore desirable to maximize the plas-
ma–surface interaction area. However, the peak value of the
species flux (especially for O and O2þ) decreases as the gap
is decreased. The decrease of the O and O2þ fluxes is mainly
due to the lower oxygen mole fraction in the diffusion layer
in the shorter gap case (compare Figures 2(a) and 2(b)).
Also, the ionization front residence time is shorter for the
smaller gap, resulting in less ionization and dissociation.
2. Effect of gas pressure
Neglecting buoyancy effects, the fluid mechanics and
mass transfer in a laminar jet are controlled by the Reynolds
number (Re¼ uL/�) and the Peclet number (Pe¼ uL/D).
Here, u and L are characteristic gas velocity and length scale,
respectively, � is kinematic viscosity, and D is diffusivity.
As pressure decreases, the gas flow velocity increases
FIG. 7. Flux of (a) neutrals at t¼ 110 ns, (b) positive ions at t¼ 110 ns, and (c) O2� negative ions at t¼ 150 ns on the conductive substrate. Parameters were at
their base case values.
TABLE IV. Base case parameter values and range studied.
Parameter Base case value Range investigated
Pressure 760 Torr 250, 500, and 760 Torr
Applied voltage and duration 5 kV, 150 ns
Gap between tube exit
and substrate
5 mm 3, 5 mm
Substrate Conductor Insulator
Relative permittivity of
insulating substrate
5 5, 15
123304-8 W. Yan and D. J. Economou J. Appl. Phys. 120, 123304 (2016)
Reuse of AIP Publishing content is subject to the terms at: https://publishing.aip.org/authors/rights-and-permissions. Download to IP: 129.7.106.18 On: Tue, 27 Sep 2016
15:31:20
proportionally, but so do the diffusion coefficient and kine-
matic viscosity. Thus, the Re and Pe numbers remain
unchanged, and the results of Fig. 2 (in terms of mole frac-
tions) are valid at the reduced pressures as well. When vary-
ing pressure, all other parameters were kept at their base
case values (Table IV). The spatial distributions of electron
density and electron temperature at t¼ 20, 35, 140 ns for a
gas pressure of 500 Torr are shown in Fig. 10. When com-
pared to the corresponding Fig. 4 for 760 Torr, one observes
that the discharge is initiated earlier at the reduced pressure.
This may be attributed to the breakdown voltage of helium
decreasing by reducing pressure (right branch of the Paschen
curve). Also, the average propagation velocity of the plasma
bullet increases from 2� 105 m/s at 760 Torr to 5� 105 m/s
when pressure is reduced to 500 Torr. A lower pressure
results in higher electron temperature in the head of the
plasma bullet, leading to a higher propagation velocity.
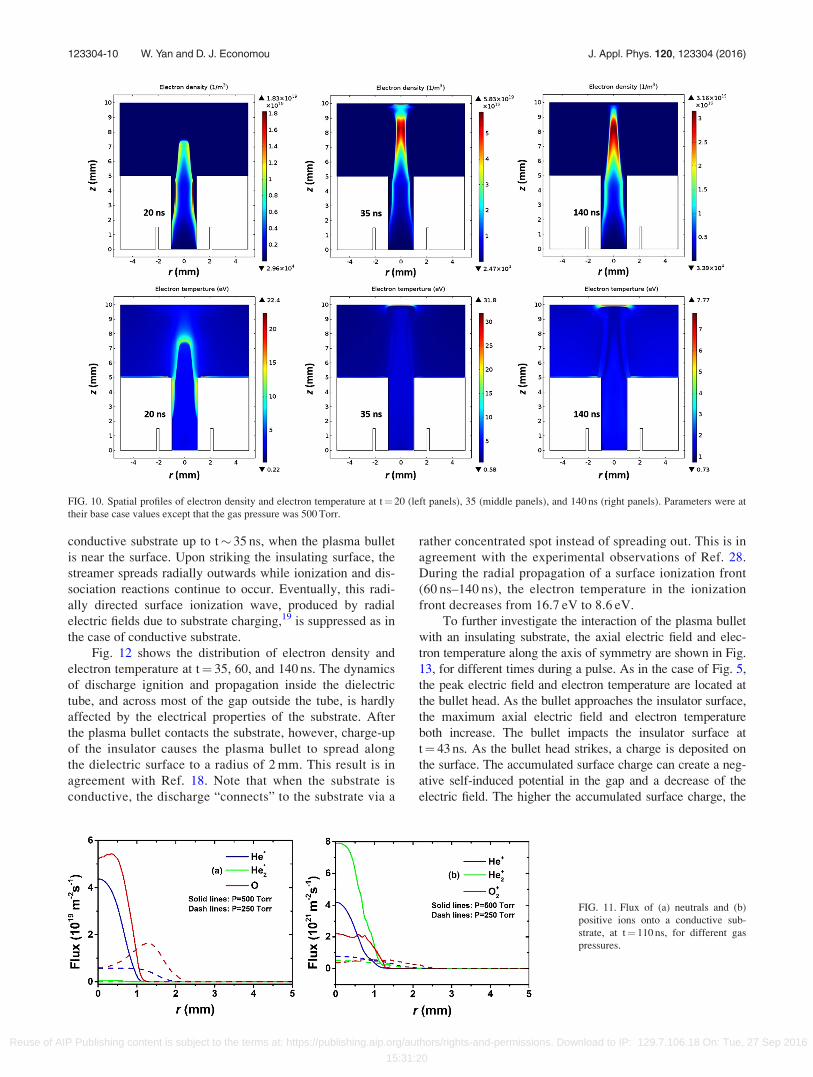
Fig. 11 shows the radial flux distribution of neutral spe-
cies and positive ions on the conductor surface, at time
t¼ 110 ns for p¼ 500 and 250 Torr. This is to be compared to
Fig. 7 at 760 Torr. In going from 760 to 250 Torr, the plas-
ma–surface interaction area increases from �1 mm to �2 mm
radius, but the peak value of the species flux decreases. The
O flux dominates among the minority neutral species. At
500 Torr, the peak of the O-atom flux is near the axis, but at
250 Torr, the peak of O flux is �1 mm off the axis.
C. Insulating substrate
In this subsection, the effect of insulating substrate is
studied by placing a 0.5 mm-thick dielectric layer (relative
permittivity of 5) on a grounded conductor. All other param-
eters were kept constant. The plasma bullet evolution with a
dielectric substrate (Fig. 3(b)) is similar to that with a
FIG. 9. Flux of (a) neutrals and (b)
positive ions onto a conductive sub-
strate at t¼ 110 ns, for 5 mm and 3 mm
gap between the jet exit and the sub-
strate surface.
FIG. 8. Spatial profiles of electron density and electron temperature at t¼ 35 (left panels), 45 (middle panels), and 140 ns (right panels). Parameters were at
their base case values except that the gap between the tube exit and the substrate was 3 mm. Rectangular insets show expanded scale of electron density (at
t¼ 35 ns), and electron temperature (at t¼ 35 and 45 ns) near the substrate.
123304-9 W. Yan and D. J. Economou J. Appl. Phys. 120, 123304 (2016)
Reuse of AIP Publishing content is subject to the terms at: https://publishing.aip.org/authors/rights-and-permissions. Download to IP: 129.7.106.18 On: Tue, 27 Sep 2016
15:31:20
conductive substrate up to t� 35 ns, when the plasma bullet
is near the surface. Upon striking the insulating surface, the
streamer spreads radially outwards while ionization and dis-
sociation reactions continue to occur. Eventually, this radi-
ally directed surface ionization wave, produced by radial
electric fields due to substrate charging,19 is suppressed as in
the case of conductive substrate.
Fig. 12 shows the distribution of electron density and
electron temperature at t¼ 35, 60, and 140 ns. The dynamics
of discharge ignition and propagation inside the dielectric
tube, and across most of the gap outside the tube, is hardly
affected by the electrical properties of the substrate. After
the plasma bullet contacts the substrate, however, charge-up
of the insulator causes the plasma bullet to spread along
the dielectric surface to a radius of 2 mm. This result is in
agreement with Ref. 18. Note that when the substrate is
conductive, the discharge “connects” to the substrate via a
rather concentrated spot instead of spreading out. This is in
agreement with the experimental observations of Ref. 28.
During the radial propagation of a surface ionization front
(60 ns–140 ns), the electron temperature in the ionization
front decreases from 16.7 eV to 8.6 eV.
To further investigate the interaction of the plasma bullet
with an insulating substrate, the axial electric field and elec-
tron temperature along the axis of symmetry are shown in Fig.
13, for different times during a pulse. As in the case of Fig. 5,
the peak electric field and electron temperature are located at
the bullet head. As the bullet approaches the insulator surface,
the maximum axial electric field and electron temperature
both increase. The bullet impacts the insulator surface at
t¼ 43 ns. As the bullet head strikes, a charge is deposited on
the surface. The accumulated surface charge can create a neg-
ative self-induced potential in the gap and a decrease of the
electric field. The higher the accumulated surface charge, the
FIG. 10. Spatial profiles of electron density and electron temperature at t¼ 20 (left panels), 35 (middle panels), and 140 ns (right panels). Parameters were at
their base case values except that the gas pressure was 500 Torr.
FIG. 11. Flux of (a) neutrals and (b)
positive ions onto a conductive sub-
strate, at t¼ 110 ns, for different gas
pressures.
123304-10 W. Yan and D. J. Economou J. Appl. Phys. 120, 123304 (2016)
Reuse of AIP Publishing content is subject to the terms at: https://publishing.aip.org/authors/rights-and-permissions. Download to IP: 129.7.106.18 On: Tue, 27 Sep 2016
15:31:20
weaker the net electric field. Thus, for time t¼ 50 ns, the peak
electric field and electron temperature on axis close to the wall
are only 30 kV/cm and 8 eV, respectively, much lower than
the case with a conductive substrate. As mentioned above,
during the voltage decay of the pulse (t¼ 140–150 ns), a sec-
ondary discharge is induced by the charges deposited on the
surface of the insulator, much like a dielectric barrier dis-
charge. During this time period, the electron temperature
increases as electrons are accelerated towards the surface.
1. Effect of relative permittivity
Figure 14 shows the radial flux distributions of neutral
species and positive ions on the insulator surface, at time
t¼ 110 ns for er¼ 5 and er¼ 15. In both cases, the peak of
species flux is some distance from the axis of symmetry (hol-
low profiles). Chemistry occurring during the radial propaga-
tion of a surface ionization front in the case of the insulating
substrate contributes to the off-axis maxima. The O-atoms
dominate the neutral species flux while Heþ and O2þ domi-
nate the positive ion flux. For er¼ 5, the “footprint” of the
plasma–surface interaction appears larger compared to er¼ 15.
This is due to increasing bullet speed with decreasing er as the
ionization front propagates along the dielectric substrate. As
the discharge spreads to larger radii on the surface, its intensity
decreases due to progressively higher oxygen mole fraction. In
addition, as shown in Figure 14, er¼ 5 yields lower species
fluxes compared to er¼ 15. This is because decreasing er
results in lower electric field over the dielectric surface after
the bullet impacts the surface.41,42
FIG. 12. Spatial distributions of the electron density and electron temperature at t¼ 35 (left panels), 60 (middle panels), and 140 ns (right panels) for 5 mm
gap, and 0.5 mm-thick insulating surface with a permittivity of er¼ 5.
FIG. 13. Axial profiles of electric field (a) and electron temperature (b) on the axis of symmetry (r¼ 0) for several times during a pulse, for 5 mm gap, and
0.5 mm-thick insulating surface with a permittivity of er¼ 5.
123304-11 W. Yan and D. J. Economou J. Appl. Phys. 120, 123304 (2016)
Reuse of AIP Publishing content is subject to the terms at: https://publishing.aip.org/authors/rights-and-permissions. Download to IP: 129.7.106.18 On: Tue, 27 Sep 2016
15:31:20
2. Effect of gas pressure
As discussed above, the plasma bullet evolution with a
dielectric substrate is similar to that with a conductive sub-
strate except when the bullet is near the surface. Therefore,
emphasis was placed on the influence of pressure on the dis-
tributions of species flux onto the insulator surface. Figure 15
shows the radial flux distributions of neutral species and
positive ions on the insulator surface, at time t¼ 110 ns for
p¼ 500 Torr and p¼ 250 Torr. Lowering the pressure from
atmospheric to 250 Torr, the plasma–surface interaction
radius increases from about 1 mm to 3 mm, but the peak value
of the species flux (except O2þ) decreases. The O-atoms
dominate the neutral species flux at 500 Torr, and the peaks
of the helium excited state (He* and He2*) fluxes move
toward the axis as the pressure decreases, eventually resulting
in peak helium metastable on axis at pressure 250 Torr. For
both pressures, the peak of positive ion flux is some distance
from the axis of symmetry (hollow profiles). The dominant
positive ion flux to the surface changes from He2þ to O2
þ
when the pressure decreases from 500 to 250 Torr.
IV. SUMMARY AND CONCLUSIONS
A computational investigation of the plasma bullet
resulting from a cold plasma jet in helium, flowing inside a
dielectric tube and then emerging in oxygen ambient at high
pressures (250–760 Torr) was conducted, based on a two-
dimensional fluid model. Neutral gas flow and mass transport
as well as plasma dynamics were included in the model.
Emphasis was placed on the interaction of the plasma bullet
with a substrate, for different electrical properties of the sub-
strate (e.g., conductor vs. insulator). The effect of gap
between the tube exit and the substrate, relative permittivity
of the insulating substrate and gas pressure, on the discharge
properties was also studied. The spatiotemporal evolution of
the discharge during a 150 ns, þ5 kV trapezoidal pulse (10 ns
each for rise and fall times) applied to a ring electrode encir-
cling the dielectric tube was analyzed. The discharge was
initiated at the downstream edge of the ring electrode. Inside
the dielectric tube, the discharge started as a surface wave
along the wall of the tube. A plasma bullet (streamer) was
then formed that was launched in the free space between the
tube end and the substrate. The bullet was donut-shaped (ion-
ization peaked off axis) upon exiting the tube, but ionization
peaked on axis further downstream.
Upon impact on a metal (conductive) substrate, the bul-
let established a conductive channel to the substrate. The
species flux to a conductive substrate peaked on axis and
decreased rapidly in the radial direction along the surface.
The peak positive ion flux was �1022 m�2s�1. The dominant
positive ion and neutral species fluxes to the surface were
Heþ, He*, and O, respectively. When the gap between the
tube exit and the substrate surface was reduced from 5 mm to
3 mm, the bullet–surface interaction area increased, while
the peak species flux decreased, mainly for O and O2þ.
For an electrically insulating substrate, the discharge
spread along the radius of the dielectric surface. Species con-
tinued to be produced by a surface ionization wave as it
propagated along the radius. As a consequence, the species
flux peaked off-axis. The dominant ion fluxes were those of
Heþ and O2þ, whereas the O-atom flux was dominant among
the neutral species. The plasma–surface interaction area
increased when the relative permittivity of the insulator
decreased.
The propagation velocity of the plasma bullet and the
area of direct interaction between the bullet and the substrate
both increased by reducing pressure. For insulating substrate,
the dominant positive ion flux to the surface changed from
FIG. 14. Flux of (a) neutrals and (b)
positively charged ions onto a 0.5 mm
thick insulating surface at t¼ 110 ns
for er¼ 5 and er¼ 15.
FIG. 15. Flux of (a) neutrals and (b)
positive ions onto a 0.5 mm thick insu-
lating surface at t¼ 110 ns, for two dif-
ferent gas pressures.
123304-12 W. Yan and D. J. Economou J. Appl. Phys. 120, 123304 (2016)
Reuse of AIP Publishing content is subject to the terms at: https://publishing.aip.org/authors/rights-and-permissions. Download to IP: 129.7.106.18 On: Tue, 27 Sep 2016
of the peak of the positive ion fluxes. A reverse electric field
developed during the late stages of the ramp-down of the
pulse, which accelerated electrons forming a brief backward
discharge.
ACKNOWLEDGMENTS
This work was supported by the Department of Energy,
Office of Fusion Energy Science, Contract No. DE-
SC0001939. Wen Yan is grateful to the National Natural
Science Foundation of China for a study abroad grant.
1M. Laroussi and T. Akan, Plasma Processes Polym. 4, 777 (2007).2M. G. Kong, G. Kroesen, G. Morfill, T. Nosenko, T. Shimizu, J. Van Dijk,
and J. L. Zimmermann, New J. Phys. 11, 115012 (2009).3J. Schlegel, J. K€oritzer, and V. Boxhammer, Clin. Plasma Med. 1, 2 (2013).4X. Zhang and S. Ptasinska, J. Phys. D: Appl. Phys. 47, 145202 (2014).5D. B. Graves, Phys. Plasmas 21, 080901 (2014).6H. Paetzelt, G. B€ohm, and T. Arnold, Plasma Sources Sci. Technol. 24,
025002 (2015).7X. Lu, M. Laroussi, and V. Puech, Plasma Sources Sci. Technol. 21,
034005 (2012).8X. Lu, G. V. Naidis, M. Laroussi, and K. Ostrikov, Phys. Rep. 540, 123
(2014).9M. Teschke, J. Kedzierski, E. G. Finantu-Dinu, D. Korzec, and J.
Engemann, IEEE Trans. Plasma Sci. 33, 310 (2005).10X. Lu and M. Laroussi, J. Appl. Phys. 100, 063302 (2006).11N. Mericam-Bourdet, M. Laroussi, A. Begum, and E. Karakas, J. Phys. D:
Appl. Phys. 42, 055207 (2009).12Y. Sakiyama, D. B. Graves, J. Jarrige, and M. Laroussi, Appl. Phys. Lett.
96, 041501 (2010).13S. Park, W. Choe, H. Kim, and J. Y. Park, Plasma Sources Sci. Technol.
24, 034003 (2015).14J. B. Schmidt, B. L. Sands, W. D. Kulatilaka, S. Roy, J. Scofield, and J. R.
Gord, Plasma Sources Sci. Technol. 24, 032004 (2015).15G. V. Naidis, J. Phys. D: Appl. Phys. 44, 215203 (2011).16G. V. Naidis, IEEE Trans. Plasma Sci. 43, 733 (2015).17D. Breden, K. Miki, and L. L. Raja, Plasma Sources Sci. Technol. 21,
034011 (2012).18D. Breden and L. L. Raja, Plasma Sources Sci. Technol. 23, 065020
(2014).
19S. A. Norberg, E. Johnsen, and M. J. Kushner, J. Appl. Phys. 118, 013301
(2015).20Y. Xian, P. Zhang, X. Pei, and X. Lu, IEEE Trans. Plasma Sci. 42, 2448
(2014).21A. Schmidt-Bleker, S. A Norberg, J. Winter, E. Johnsen, S. Reuter, K. D.
Weltmann, and M. J. Kushner, Plasma Sources Sci. Technol. 24, 035022
(2015).22J. Winter, J. S. Sousa, N. Sadeghi, A. Schmidt-Bleker, S. Reuter, and V.
Puech, Plasma Sources Sci. Technol. 24, 025015 (2015).23D. X. Liu, M. Z. Rong, X. H. Wang, F. Iza, M. G. Kong, and P.
Bruggeman, Plasma Processes Polym. 7, 846 (2010).24G. Y. Park, Y. J. Hong, H. W. Lee, J. Y. Sim, and J. K. Lee, Plasma
Processes Polym. 7, 281 (2010).25J. He and Y. T. Zhang, Plasma Processes Polym. 9, 919 (2012).26X. Y. Liu, X. K. Pei, X. P. Lu, and D. W. Liu, Plasma Sources Sci.
Technol. 23, 035007 (2014).27X. Lu, Z. Jiang, Q. Xiong, Z. Tang, and Y. Pan, Appl. Phys. Lett. 92,
151504 (2008).28J. L. Walsh, J. J. Shi, and M. G. Kong, Appl. Phys. Lett. 88, 171501
(2006).29X. Shao, Z. Chang, H. Mu, W. Liao, and G. Zhang, IEEE Trans. Plasma
Sci. 41, 899 (2013).30COMSOL 5.0 (COMSOL, Burlington, MA, 2014).31W. Yan, F. Liu, C. Sang, and D. Wang, Phys. Plasmas 21, 063505
(2014).32W. Yan, F. Liu, C. Sang, and D. Wang, Phys. Plasmas 21, 013504
(2014).33Y. Sakiyama and D. B. Graves, Plasma Sources Sci. Technol. 18, 025022
(2009).34G. Hagelaar and L. Pitchford, Plasma Sources Sci. Technol. 14, 722
(2005).35See http://www.lxcat.laplace.univ-tlse.fr/cross_sec_download.php for
cross section data.36Q. Wang, D. J. Economou, and V. M. Donnelly, J. Appl. Phys. 100,
023301 (2006).37D. S. Stafford and M. J. Kushner, J. Appl. Phys. 96, 2451 (2004).38D. Breden, K. Miki, and L. L. Raja, Appl. Phys. Lett. 99, 111501
(2011).39J. P. Boeuf, L. L. Yang, and L. C. Pitchford, J. Phys. D: Appl. Phys. 46,
015201 (2013).40S. H€ubner, S. Hofmann, E. M. van Veldhuizen, and P. J. Bruggeman,
Plasma Sources Sci. Technol. 22, 065011 (2013).41F. Pechereau, J. J�ansk�y, and A. Bourdon, Plasma Sources Sci. Technol. 21,
055011 (2012).42N. Y. Babaeva and M. J. Kushner, Plasma Sources Sci. Technol. 20,
035017 (2011).
123304-13 W. Yan and D. J. Economou J. Appl. Phys. 120, 123304 (2016)
Reuse of AIP Publishing content is subject to the terms at: https://publishing.aip.org/authors/rights-and-permissions. Download to IP: 129.7.106.18 On: Tue, 27 Sep 2016